electronic absorption spectra of neutral perylene (c h ... · pdf fileof the detection of...
TRANSCRIPT

Electronic Absorption Spectra of Neutral Perylene (C20H12), Terrylene (C30H16), andQuaterrylene (C40H20) and Their Positive and Negative Ions: Ne Matrix-IsolationSpectroscopy and Time-Dependent Density Functional Theory Calculations
Thomas M. Halasinski,†,§ Jennifer L. Weisman,# Richard Ruiterkamp, ⊥ Timothy J. Lee,|Farid Salama,*,† and Martin Head-Gordon#
Space Science DiVision, NASA Ames Research Center, Mail Stop 245-6, Moffett Field, California 94035,Department of Chemistry, UniVersity of California, Berkeley, and Chemical Sciences DiVision,Lawrence Berkeley National Laboratory, Berkeley, California 94720, Raymond & BeVerly Sackler Laboratoryat Leiden ObserVatory, P.O. Box 9513, 2300 RA Leiden, The Netherlands, and NASA AdVancedSupercomputing DiVision, NASA Ames Research Center, Mail Stop 230-3, Moffett Field, California 94035
ReceiVed: NoVember 5, 2002; In Final Form: February 19, 2003
We present an experimental and theoretical study of an interesting series of polycyclic aromatic hydrocarbons,the oligorylenes. The absorption spectra of perylene, terrylene, and quaterrylene in neutral, cationic, andanionic charge states are obtained by matrix-isolation spectroscopy in Ne. The experimental spectra aredominated by a bright state that red shifts with growing molecular size. Excitation energies and state symmetryassignments for this state are obtained by calculations using time-dependent density functional theory methods.These calculations also provide additional information and insight into the trends in oscillator strength andexcitation energy for the bright states: in particular, the oscillator strength per unit mass of carbon increasesalong the series.
I. Introduction
Polycyclic aromatic hydrocarbons (PAHs) are now thoughtto be ubiquitous throughout the interstellar medium on the basisof the detection of their widespread infrared spectral signature.1
PAHs are also attractive candidates for (some of) the diffuseinterstellar bands (DIBs), visible absorption features that areassociated with low-density regions of interstellar space.2 Inspace, PAH molecules are present as neutral, positively charged,and negatively charged species. The charge distribution varieswith the physical conditions (interstellar field, electron density,and temperature, etc.) that reign in the various regions of theinterstellar medium.2 The comparison of the infrared signaturesof PAHs in laboratory spectra with that of the astronomical datasuggests that one class of molecules responsible for theinterstellar emission features are PAHs. More specific informa-tion would result, however, from the detection of the electronic/vibronic signature of interstellar PAHs. Thus, the best prospectin detecting individual PAH molecules in the interstellar mediumlies in the identification of the origin of the DIBs.
Current experimental research is directed toward extendingthe size,3 structure,4 and charge state5 distributions of themolecules studied in the laboratory. Matrix-isolation spectros-copy experiments offer a crucial guideline for future laboratorystudies by allowing the preselection of promising PAH mol-ecules to be studied in free jet expansions. Definitive tests of
the proposal that PAH ions are responsible for some of the DIBsmust await the availability of laboratory measurements of thefree molecules and ions in the gas phase that are still notavailable for molecules as large as terrylene and quaterrylenepresented in this study.
Theoretical calculations are a valuable tool to guide andsupport current and future laboratory studies. Time-dependentdensity functional theory methods6 are capable of producingreasonably accurate vertical excitation energies and oscillatorstrengths for large systems. For example, in studies of naph-thalene, perylene, and pyrene radical cations,7 accuracies ofapproximately(0.3 eV were found for excitation energies. Inaddition to simply predicting absorption spectra, it is possibleto gain insight into the nature of the absorptions and more easilyextract trends that may aid in the direction of future investiga-tions as illustrated in the current study of perylene, terrylene,and quaterrylene.
The collection and analysis of the spectra of these speciescontribute to a spectral database upon which to identify possiblecandidates for the DIBs, as well as information concerning thephotophysical processes of absorption and emission of radiationwithin the interstellar medium. Ultimately, through studies suchas this, a more complete understanding of the physical conditionsand the chemical evolution within the interstellar medium canbe reached.
In a parallel paper,3 we discuss the astrophysical implicationsof the spectroscopy of a large set of neutral and ionized PAHs.Here, we discuss the detailed analysis of the electronic spectraof a subset of the original set, namely, the oligorylenes perylene,terrylene, and quaterrylene, that present interesting spectroscopicproperties. Matrix-isolated spectra and supporting time-depend-ent density functional theory (TDDFT) calculations are presentedfor these large molecular systems.
* To whom correspondence should be addressed. E-mail: [email protected].
† Space Science Division, NASA Ames Research Center.§ Present address: Department of Chemistry, Saint Joseph’s University,
Philadelphia, PA 19131.# University of California, Berkeley, and Lawrence Berkeley National
Laboratory.⊥ Raymond & Beverly Sackler Laboratory at Leiden Observatory.| NASA Advanced Supercomputing Division, NASA Ames Research
Center.
3660 J. Phys. Chem. A2003,107,3660-3669
10.1021/jp027394w CCC: $25.00 © 2003 American Chemical SocietyPublished on Web 04/12/2003

II. Methods
II.a. Experimental Methods. The experimental instrumenta-tion employed in these studies, a UV/visible/near-IR spectrom-eter equipped with its own dedicated sample vacuum chamberand matrix deposition source, has been previously described.8
A brief review will be given here. The UV/visible/near-IRinstrument is equipped with a sapphire sample window cooledto 4.2 K by an extended liquid helium transfer cryostat. Thesample window can be rotated 360° under vacuum to face,alternatively, two spectroscopic window ports, the matrix gasand PAH deposition lines, and a MgF2 VUV window port.
Single beam spectra of the cold substrate were collectedbefore the matrix was deposited and used as the backgroundfor all spectra reported unless noted otherwise. A deuteriumlamp provides spectral output from 160 to 360 nm, and a quartztungsten halogen lamp provides output from 320 to 2500 nm.Spectra were recorded from 180 to 1000 nm with a nominalresolution of 0.1 nm.
The vaporization and codeposition of each PAH with the inertgas (neon) was performed using Pyrex tubes (12.7 mm o.d.),which were mounted on the sample chamber through stainlesssteel Cajon Ultratorr fittings and heated from outside the vacuumchamber with the use of heating tape. The tubes were positionedbetween 4 and 5 cm from the cold window and perpendicularto the surface of the cold substrate. The temperature of the tubewas monitored using a chromel/alumel thermocouple mountedon the exterior of each tube with Al foil tape.
Matrix gas was admitted through a port at a position 45° fromthe plane of the substrate surface and the median between thePyrex tube containing the PAH sample such that the two vaporstreams combined before the surface of the window. Typicaldeposition temperatures for each PAH were 108, 260, and 396°C for perylene, terrylene, and quaterrylene, respectively. Neflow rates were estimated to be 12 mmol/h. Based on these flowrates and vaporization temperatures, the matrix/PAH ratio isestimated to be in excess of 1000/1. Typical deposition timesvaried from 2 to 4 h. Matrices used with NO2 as an electronacceptor were formed by deposition of premixed 1000/1 Ne/NO2 gas samples.
A microwave-powered, hydrogen flow (10% H2/He) dis-charge lamp (Opthos Instruments MPG 4M) mounted on theMgF2 vacuum chamber window was used for photolysis of thematrix. This lamp generates nearly monochromatic radiation inthe LymanR line at 121.6 nm (10.2 eV). Typical photolysistimes ranged from 2 to 20 min.
Perylene (99.5+%) and NO2 (99.5+%) were obtained fromAldrich Chemical Co. The terrylene and quaterrylene sampleswere obtained from Dr. W. Schmidt (PAH Forschungs Institut,Greifenberg, Germany). Ne (Cryogenic Rare Gas 99.9995%)research-grade rare gas was the inert matrix material utilizedin the experimental studies. All chemicals were used as received.
II.b. Computational Methods. The ground-state structuresof perylene, terrylene, and quaterrylene were optimized usingKohn-Sham density functional theory (DFT) with the Beckeexchange functional,9 the LYP correlation functional,10 and the6-31G* basis set. The neutral, radical cation, and radical anioncharge states of the three molecules were each optimized at theBLYP/6-31G* level. Time-dependent density functional theory(TDDFT) methods were used to determine the absorption spectraof the molecules. The DFT and TDDFT calculations wereimplemented in the Q-Chem program package.11
TDDFT vertical excitation energies are generally insensitiveto basis set size (for a representative example, see ref 7). We
performed a study of the perylene excitation energies in thethree charge states to verify the lack of basis set dependence.We found that small basis sets were sufficient to accuratelydescribe the strongest visible excitation for these species (thesedata are available in Table 1 of Supporting Information). Theneutral and radical cation TDDFT calculations were performedat the BLYP/6-31G//BLYP/6-31G* level, while the radical anioncalculations were performed at the BLYP/6-31G*//BLYP/6-31G* level, where the “double slash” notation means “at thegeometry of”.
III. Results and Discussion
III.a. Experimental Results. The absorption spectra ofneutral perylene, terrylene, and quaterrylene from 13 000 to55 000 cm-1 (180-770 nm) are shown in Figure 1. The moststructured absorption band system in all three cases belongs tothe transition from the ground electronic state to the first excitedelectronic state. This transition shifts to the red as the molecularsize increases in the series. Several vibronic bands are observedin the first excited state for all three molecules (expanded viewsof the three spectra are shown in Figure 2). The fwhm of theobserved vibronic bands also increase with molecular size.Several higher-lying excited electronic states are also observedfor each molecule. It is not clear whether they follow similartrends with molecular size because their spectral assignmentsare uncertain.
The matrix-isolated samples containing NO2-doped Ne weresubjected to LymanR (10.2 eV) photolysis. NO2 was added tothe matrix gas to act as an electron acceptor, facilitating theformation of PAH cations by inhibiting the formation of thecounterions (PAH anions). The spectral features that grew upon
Figure 1. The UV/visible spectra of a codeposit of (A) a 10 min depositof perylene in Ne, (B) a 10 min deposit of terrylene in Ne, and (C) a40 min deposit of quaterrylene in Ne. The molecular axis chosen forthe symmetries of the molecular orbitals and electronic states of allthree PAHs is given in the inset.
Spectra of C20H12, C30H16, and C40H20 J. Phys. Chem. A, Vol. 107, No. 19, 20033661

photolysis for perylene, terrylene, and quaterrylene are shownin the difference spectra obtained by subtracting the measuredabsorbance of the sample before photolysis from the measuredabsorbance of the sample after photolysis (Figures 3A, 4A, and5A, respectively). A single intense absorption is observed ineach case that shifts to the red as the molecular size increasesin the series.
The difference spectra of matrix samples photolyzed in theabsence of NO2 for perylene, terrylene, and quaterrylene aregiven in Figures 3B, 4B, and 5B, respectively. Similar to thespectral features of the PAH cations for this series of molecules,the spectral features of the PAH anions are dominated by asingle intense absorption feature that shifts to the red as themolecular size increases in the series. We discuss below eachindividual spectrum.
III.a.i. Perylene (C20H12). Several studies of the electronicabsorption spectra of perylene isolated in noble gas matriceshave been reported previously.12 The spectral properties arereported here for comparison purposes with the spectra of neutralterrylene and quaterrylene. In addition, we report new calcula-tions for the first excited electronic state. The chosen molecularaxis, illustrated in Figure 1, has the molecule lying in thexyplane,x being the long axis of the molecule.
Figure 1A displays the electronic absorption spectrum ofneutral perylene from 19 000 to 55 000 cm-1 (180-530 nm).The observed band positions and associated vibrational spacingsare available in Table 2 of Supporting Information. Thetransition from the ground electronic state to the first excitedstate has been assigned (e.g., see ref 12b and references therein)to involve a S1(B3u) r S0(Ag) transition. Two series of bandswere observed for the S1(B3u) r S0(Ag) transition by Joblin etal. and were assigned as isolated perylene trapped in twodifferent sites in Ne matrices (site a and site b). The fullprogression of site a is listed in this report, we only list the
vibronic origin of site b at 39 cm-1 to the red of the vibronicorigin of site a.
An expanded view of the 23 000 to 28 000 cm-1 (360-430nm) region is illustrated in Figure 2A. Only a few fundamentalvibrational modes (348, 543, 1098, 1293, 1395, and 1601 cm-1)are responsible for the majority of observed vibronic bands inthe S1(B3u) r S0(Ag) transition. Several spectral features dueto vibronic progressions in higher electronic states are alsoobserved in Figure 1 and listed in Table 2 of SupportingInformation.
Figure 3A displays the spectral features produced uponphotolysis of perylene isolated in a Ne matrix doped with NO2
and assigned to the perylene cation.7,13 The positions of theobserved bands are listed in Table 3 of Supporting Informationalong with assignments from Hirata et al.7 The majority of theobserved bands in the perylene cation show a multicomponentsplitting. This splitting has been assigned to the presence ofdifferent sites within the solid matrix or to transitions involvinglow vibrational frequencies of the perylene cation.12b
Figure 3B displays the spectral features produced uponphotolysis of perylene isolated in a Ne matrix (in the absenceof NO2). The bands that are observed in this spectrum and areabsent or very weak in Figure 3A are denoted with an asteriskand assigned to the perylene anion. The positions of the observedbands assigned to the perylene anion are listed in Table 4 ofSupporting Information. Multicomponent splitting is observedin the majority of perylene anion bands that are similar in natureto those observed in the perylene cation. Discussion of theassignments for some of the stronger bands is given in sectionIII.b.
III.a.ii. Terrylene (C30H16). Figure 1B displays the electronicabsorption spectrum of neutral terrylene from 16 000 to 55 000cm-1 (180-630 nm), and Table 5 of Supporting Informationlists the observed band positions and associated vibrationalspacings. An expanded view of the 18 000 to 23 000 cm-1
(430-560 nm) region is illustrated in Figure 2B. Similar to theperylene cation, we assign the spectral feature to the red of the
Figure 2. Expanded regions of the spectra shown in Figure 1.
Figure 3. The visible/near-IR spectra of (A) a 3 hdeposit of peryleneand NO2 in Ne followed by 10 min of LymanR photolysis and (B) a3 h deposit of perylene in Ne followed by 10 min of LymanRphotolysis. The spectral features denoted with an asterisk have beenassigned to the perylene anion.
3662 J. Phys. Chem. A, Vol. 107, No. 19, 2003 Halasinski et al.

main vibronic origin as a site splitting. The larger 154 cm-1
shift compared to the 39 cm-1 shift of the perylene cationpresumably arises from the larger size of the molecular ion.Also similar to neutral perylene, only a few fundamentalvibrational modes (241, 1311, 1398, and 1634 cm-1) are re-sponsible for the vibronic progression observed in the S1(B3u)r S0(Ag) transition of neutral terrylene. These features are ingood agreement with the spectral features observed at 247, 1317,1390, and 1590 cm-1 by fluorescence excitation of terrylene inNe matrices.14
Figure 4A displays the spectral features produced uponphotolysis of terrylene isolated in a Ne matrix doped with NO2,which we assign to the terrylene cation. The positions of theobserved bands are listed in Table 6 of Supporting Information.The majority of bands observed in the terrylene cation show asplitting into multicomponents. We assign the origin of thissplitting to a similar site effect responsible for the multicom-ponents observed in the spectral features for the perylene cationand anion.
Figure 4B displays the spectral features produced uponphotolysis of terrylene isolated in a Ne matrix (in the absenceof NO2). The bands that are observed in this spectrum and areabsent or very weak in Figure 4A are denoted with an asteriskand assigned to the terrylene anion. The positions of theobserved bands assigned to the terrylene anion are listed in Table7 of Supporting Information. Splitting of the spectral featuresinto multicomponents is also observed in this molecular radical.Discussion of the assignments for the strongest bands observedin the spectra of the terrylene cation and anion is given in sectionIII.b.
III.a.iii. Quaterrylene (C40H20). Figure 1C displays theelectronic absorption spectrum of neutral quaterrylene from13 000 to 55 000 cm-1 (180-770 nm), and Table 8 ofSupporting Information lists the observed band positions andassociated vibrational spacings. An expanded view of the 15 000to 21 000 cm-1 (480-670 nm) region is illustrated in Figure2C. Comparison of the spectra in Figure 2A-C shows that the
observed spectral features appear to broaden with increasingmolecular size. While neutral perylene and neutral terrylene haveone spectral feature each that we assign to site splittings, neutralquaterrylene has at least two spectral features lying 89 and 373cm-1 to the red of the most intense transition that may also beassigned to site effects. Also similar to neutral perylene andterrylene, only a few fundamental vibrational modes (186, 1281,1395, and 1555 cm-1) are responsible for the vibronic progres-sion observed in the S1(B3u) r S0(Ag) transition of neutralquaterrylene.
Figure 5A displays the spectral features produced uponphotolysis of quaterrylene isolated in a Ne matrix doped withNO2, which we assign to the quaterrylene cation. The positionsof the observed bands are listed in Table 9 of SupportingInformation. Unlike the perylene cation/anion and the terrylenecation/anion, the quaterrylene cation does not exhibit multi-components to individual spectral bands. Presumably, this isdue to the observed increased broadening of the spectral featureswith molecular size.
Figure 5B displays the spectral features produced uponphotolysis of quaterrylene isolated in a Ne matrix (in the absenceof NO2). The bands that are observed in this spectrum and areabsent or very weak in Figure 5A are denoted with an asteriskand assigned to the quaterrylene anion. The positions of theobserved bands assigned to the quaterrylene anion are listed inTable 10 of Supporting Information. As with the quaterrylenecation, splitting of the spectral features into multicomponentsis not observed. Discussion of the assignments for the strongestfeature observed in the spectra of the quaterrylene cation andanion is given in section III.b.
Comparison of the relative spectral intensities for the mostintense transition observed for the radical species of perylene,terrylene, and quaterrylene in Figures 3-5 suggests that thistransition increases in intensity with molecular size. We discussbelow a computational argument for this observation.
III.b. Computational Results. The calculated TDDFTabsorption spectra for the three molecules in three charge states
Figure 4. The visible/near-IR spectra of (A) a 3 hdeposit of terryleneand NO2 in Ne followed by 10 min of LymanR photolysis and (B) a3 h deposit of terrylene in Ne followed by 10 min of LymanRphotolysis. The spectral features denoted with an asterisk have beenassigned to the terrylene anion.
Figure 5. The visible/near-IR spectra of (A) a 3 h deposit ofquaterrylene and NO2 in Ne followed by 10 min of LymanR photolysisand (B) a 3 hdeposit of quaterrylene in Ne followed by 10 min ofLyman R photolysis. The spectral features denoted with an asteriskhave been assigned to the quaterrylene anion.
Spectra of C20H12, C30H16, and C40H20 J. Phys. Chem. A, Vol. 107, No. 19, 20033663
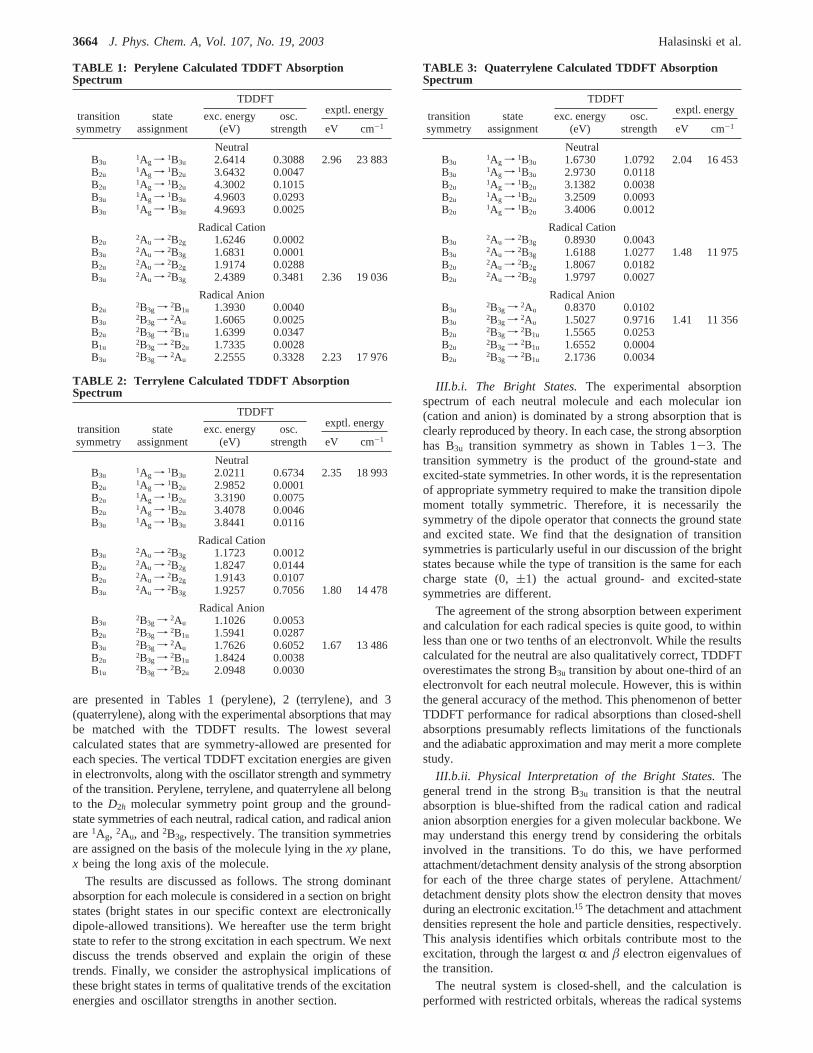
are presented in Tables 1 (perylene), 2 (terrylene), and 3(quaterrylene), along with the experimental absorptions that maybe matched with the TDDFT results. The lowest severalcalculated states that are symmetry-allowed are presented foreach species. The vertical TDDFT excitation energies are givenin electronvolts, along with the oscillator strength and symmetryof the transition. Perylene, terrylene, and quaterrylene all belongto the D2h molecular symmetry point group and the ground-state symmetries of each neutral, radical cation, and radical anionare1Ag, 2Au, and2B3g, respectively. The transition symmetriesare assigned on the basis of the molecule lying in thexy plane,x being the long axis of the molecule.
The results are discussed as follows. The strong dominantabsorption for each molecule is considered in a section on brightstates (bright states in our specific context are electronicallydipole-allowed transitions). We hereafter use the term brightstate to refer to the strong excitation in each spectrum. We nextdiscuss the trends observed and explain the origin of thesetrends. Finally, we consider the astrophysical implications ofthese bright states in terms of qualitative trends of the excitationenergies and oscillator strengths in another section.
III.b.i. The Bright States.The experimental absorptionspectrum of each neutral molecule and each molecular ion(cation and anion) is dominated by a strong absorption that isclearly reproduced by theory. In each case, the strong absorptionhas B3u transition symmetry as shown in Tables 1-3. Thetransition symmetry is the product of the ground-state andexcited-state symmetries. In other words, it is the representationof appropriate symmetry required to make the transition dipolemoment totally symmetric. Therefore, it is necessarily thesymmetry of the dipole operator that connects the ground stateand excited state. We find that the designation of transitionsymmetries is particularly useful in our discussion of the brightstates because while the type of transition is the same for eachcharge state (0,(1) the actual ground- and excited-statesymmetries are different.
The agreement of the strong absorption between experimentand calculation for each radical species is quite good, to withinless than one or two tenths of an electronvolt. While the resultscalculated for the neutral are also qualitatively correct, TDDFToverestimates the strong B3u transition by about one-third of anelectronvolt for each neutral molecule. However, this is withinthe general accuracy of the method. This phenomenon of betterTDDFT performance for radical absorptions than closed-shellabsorptions presumably reflects limitations of the functionalsand the adiabatic approximation and may merit a more completestudy.
III.b.ii. Physical Interpretation of the Bright States.Thegeneral trend in the strong B3u transition is that the neutralabsorption is blue-shifted from the radical cation and radicalanion absorption energies for a given molecular backbone. Wemay understand this energy trend by considering the orbitalsinvolved in the transitions. To do this, we have performedattachment/detachment density analysis of the strong absorptionfor each of the three charge states of perylene. Attachment/detachment density plots show the electron density that movesduring an electronic excitation.15 The detachment and attachmentdensities represent the hole and particle densities, respectively.This analysis identifies which orbitals contribute most to theexcitation, through the largestR andâ electron eigenvalues ofthe transition.
The neutral system is closed-shell, and the calculation isperformed with restricted orbitals, whereas the radical systems
TABLE 1: Perylene Calculated TDDFT AbsorptionSpectrum
TDDFTexptl. energy
transitionsymmetry
stateassignment
exc. energy(eV)
osc.strength eV cm-1
NeutralB3u
1Ag f 1B3u 2.6414 0.3088 2.96 23 883B2u
1Ag f 1B2u 3.6432 0.0047B2u
1Ag f 1B2u 4.3002 0.1015B3u
1Ag f 1B3u 4.9603 0.0293B3u
1Ag f 1B3u 4.9693 0.0025
Radical CationB2u
2Au f 2B2g 1.6246 0.0002B3u
2Au f 2B3g 1.6831 0.0001B2u
2Au f 2B2g 1.9174 0.0288B3u
2Au f 2B3g 2.4389 0.3481 2.36 19 036
Radical AnionB2u
2B3g f 2B1u 1.3930 0.0040B3u
2B3g f 2Au 1.6065 0.0025B2u
2B3g f 2B1u 1.6399 0.0347B1u
2B3g f 2B2u 1.7335 0.0028B3u
2B3g f 2Au 2.2555 0.3328 2.23 17 976
TABLE 2: Terrylene Calculated TDDFT AbsorptionSpectrum
TDDFTexptl. energy
transitionsymmetry
stateassignment
exc. energy(eV)
osc.strength eV cm-1
NeutralB3u
1Ag f 1B3u 2.0211 0.6734 2.35 18 993B2u
1Ag f 1B2u 2.9852 0.0001B2u
1Ag f 1B2u 3.3190 0.0075B2u
1Ag f 1B2u 3.4078 0.0046B3u
1Ag f 1B3u 3.8441 0.0116
Radical CationB3u
2Au f 2B3g 1.1723 0.0012B2u
2Au f 2B2g 1.8247 0.0144B2u
2Au f 2B2g 1.9143 0.0107B3u
2Au f 2B3g 1.9257 0.7056 1.80 14 478
Radical AnionB3u
2B3g f 2Au 1.1026 0.0053B2u
2B3g f 2B1u 1.5941 0.0287B3u
2B3g f 2Au 1.7626 0.6052 1.67 13 486B2u
2B3g f 2B1u 1.8424 0.0038B1u
2B3g f 2B2u 2.0948 0.0030
TABLE 3: Quaterrylene Calculated TDDFT AbsorptionSpectrum
TDDFTexptl. energy
transitionsymmetry
stateassignment
exc. energy(eV)
osc.strength eV cm-1
NeutralB3u
1Ag f 1B3u 1.6730 1.0792 2.04 16 453B3u
1Ag f 1B3u 2.9730 0.0118B2u
1Ag f 1B2u 3.1382 0.0038B2u
1Ag f 1B2u 3.2509 0.0093B2u
1Ag f 1B2u 3.4006 0.0012
Radical CationB3u
2Au f 2B3g 0.8930 0.0043B3u
2Au f 2B3g 1.6188 1.0277 1.48 11 975B2u
2Au f 2B2g 1.8067 0.0182B2u
2Au f 2B2g 1.9797 0.0027
Radical AnionB3u
2B3g f 2Au 0.8370 0.0102B3u
2B3g f 2Au 1.5027 0.9716 1.41 11 356B2u
2B3g f 2B1u 1.5565 0.0253B2u
2B3g f 2B1u 1.6552 0.0004B2u
2B3g f 2B1u 2.1736 0.0034
3664 J. Phys. Chem. A, Vol. 107, No. 19, 2003 Halasinski et al.

are open-shell, and the calculations are performed with unre-stricted orbitals. The neutral transition appears to be a one-electron highest occupied molecular orbital (HOMO) to lowestunoccupied molecular orbital (LUMO) excitation. The radicaltransitions are also one-electron excitations; however, the totalexcitation is dominated by two configurations, which bothinvolve changes in the occupation of the singly occupiedmolecular orbital (SOMO). We may confirm the identities ofthe orbitals involved in the transitions by attachment/detachmentdensities of the excitations.
Table 4 presents the largestR andâ electron eigenvalues forthe strong B3u transition attachment/detachment density of the
neutral, radical cation, and radical anion perylene. The neutralperyleneR andâ spin largest eigenvalues are identical becausethis is a closed-shell molecule. Because the eigenvalues are eachapproximately 0.5, the transition for this molecule is essentiallydescribed by a two-orbital, one-electron picture, in which theone electron may beR or â spin. The attachment/detachmentdensity diagram for this transition is shown in Figure 6.
The cation and anion species are both radicals with unre-stricted orbitals. This indicates that the SOMO, for example,may not be identical for theR andâ electrons. As mentionedearlier, the strong absorption for both of these radicals involvescontributions from movement in to and out of the singlyoccupied molecular orbital. We therefore need to consider boththeR andâ attachment/detachment densities separately. TheRandâ attachment/detachment densities are shown in Figures 7and 8 for the radical cation and radical anion, respectively. Thefact that there is movement in to and out of the SOMO indicatesthat these transitions are, at a minimum, described by a four-orbital picture.
The neutral excitation is a two-orbital, HOMO to LUMOtransition. Comparing Figure 6 to Figures 7 and 8, it is possibleto see that the radical cationR excitation is identical to the
Figure 6. Neutral perylene BLYP/6-31G//BLYP/6-31G* attachment/detachment density of the 11Ag f 11B3u transition at 90% density enclosure.The left-hand plot shows the detachment density, which is removed from the ground state and rearranged as the attachment density (shown on theright) in the excited state.
Figure 7. Perylene radical cation BLYP/6-31G//BLYP/6-31G* (a)R and (b)â electron attachment/detachment densities of the 12Au f 12B3g
transition at 90% density enclosure. See Figure 6 for further details.
TABLE 4: Attachment/Detachment Density Analysis of theStrong B3u Absorption of the C20H12 Three Charge Statesa
C20H12
charge state λ (A)R λ (D)R λ (A)â λ (D)â
neutral 0.492 0.492 0.492 0.492radical cation 0.443 0.443 0.538 0.538radical anion 0.644 0.644 0.337 0.337
a Largest eigenvalues,λ, are given in units of electronic charge.Eigenvalues less than 0.1 e are omitted.
Spectra of C20H12, C30H16, and C40H20 J. Phys. Chem. A, Vol. 107, No. 19, 20033665

neutral excitation. This contribution to the radical cationtransition is a HOMO to LUMO excitation in theR electronspace. The radical anionâ excitation is also essentially the same,only slightly more diffuse in character than the neutral andradical cation. This contribution to the radical anion transitionis similarly a HOMO to LUMO excitation in theâ electronspace.
The radical cation and radical anion total excitations havecontributions in both theR and â electron spaces. Thecontribution in theâ space for the radical cation andR spacefor the radical anion are HOMO to LUMO excitations ofappropriate symmetry to yield a B3u transition. These thencomplete the four-orbital picture and are shown pictorially inFigure 9. Two orbitals are the HOMO and LUMO of the neutralexcitation. The additional two orbitals come one each from theradical cation and radical anion excitations, the HOMO in the
â space from the radical cation and the LUMO in theR spacefrom the radical anion.
The two-orbital picture for the neutral transition and four-orbital picture for both radicals, as shown in Figure 9, explainthe experimental blue shift of the neutral strong absorption. Theneutral transition, as stated before, is a one-electron HOMO toLUMO excitation, as shown by a single red arrow. The radicaltransitions involve a superposition of two configurations, whichtogether describe the total one-electron transition for eachspecies. The two configurations are distinguished by twodifferent colored arrows. Figure 9 showsR andâ electrons beingpromoted for the radical transitions by arrows in blue and red,respectively. Each red arrow and each blue arrow depicts a one-electron transition from the ground-state configuration yieldingan excitation of B3u transition symmetry. There is configurationinteraction between the one-electron excitations present in theradical transitions that lower their absorption energies from theneutral transition contribution. While TDDFT qualitativelypredicts the blue shift for the neutral compounds relative to thecation and anion species, the quantitative accuracy for the shiftis in poor agreement with experiment.
It is interesting to note that the red shift in the radicaltransitions could have been predicted very simply by Hu¨ckelmolecular orbital (HMO) theory (for representative discussions,see ref 16). Because of particle-hole equivalence in the HMOmodel for alternate hydrocarbons, such as the molecules inthe study, the energy differences between the HOMO andHOMO - 1 and LUMO and LUMO+ 1 are identical. If weassume a configuration interaction picture in which the singleexcitation configurations of the lowest energy will interact, weshould expect the same picture as we have seen described withTDDFT. In fact, also by particle-hole equivalence, HMO theory
Figure 8. Perylene radical anion BLYP/6-31+G*//BLYP/6-31G* (a) R and (b)â electron attachment/detachment densities of the 12B3g f 12Au
transition at 90% density enclosure. See Figure 6 for further details.
Figure 9. Schematic diagram of the neutral, radical cation, and radicalanion strong B3u transitions.
3666 J. Phys. Chem. A, Vol. 107, No. 19, 2003 Halasinski et al.

with configuration interaction predictsidentical excitationenergies for the radical cation and radical anion species. Thisis not exactly what is observed experimentally, and this subtledifference in the cation and anion behavior (larger red shift forthe anion) has been recovered with TDDFT.
III.b.iii. Astrophysical Implications of the Bright States.Somegeneral astrophysical implications may be asserted from theseresults on the basis of the observed and calculated trends in thebright states. The perylene, terrylene, and quaterrylene seriesof strong B3u transitions show definite trends in the excitationenergies and oscillator strengths. The B3u absorption has thesame symmetry as the long axis of the molecule, as we willdiscuss further later, so perylene, terrylene, and quaterrylenecan be related in terms of their long axis.
The trend in excitation energies for all three charge states isthat the excitation energy decreases from perylene to terryleneto quaterrylene as follows from simple particle-in-a-box model-ing. So, as the long axis of the molecule grows, the absorptionenergy decreases. This result is in excellent agreement with thesemiempirical model developed by Salama et al.2a in their earlierdiscussion of the potential relation between neutral and ionizedPAHs and the diffuse interstellar bands. On the other hand, theoscillator strength increases from perylene to terrylene toquaterrylene. As the molecule size increases, the intensity ofthe absorption does as well. Insight into this phenomenon maybe gained by the transition density plots of the strong absorptionwithin a set of charge state derivatives. We investigate the setof radical cations as an example of the general behavior of allthree groups.
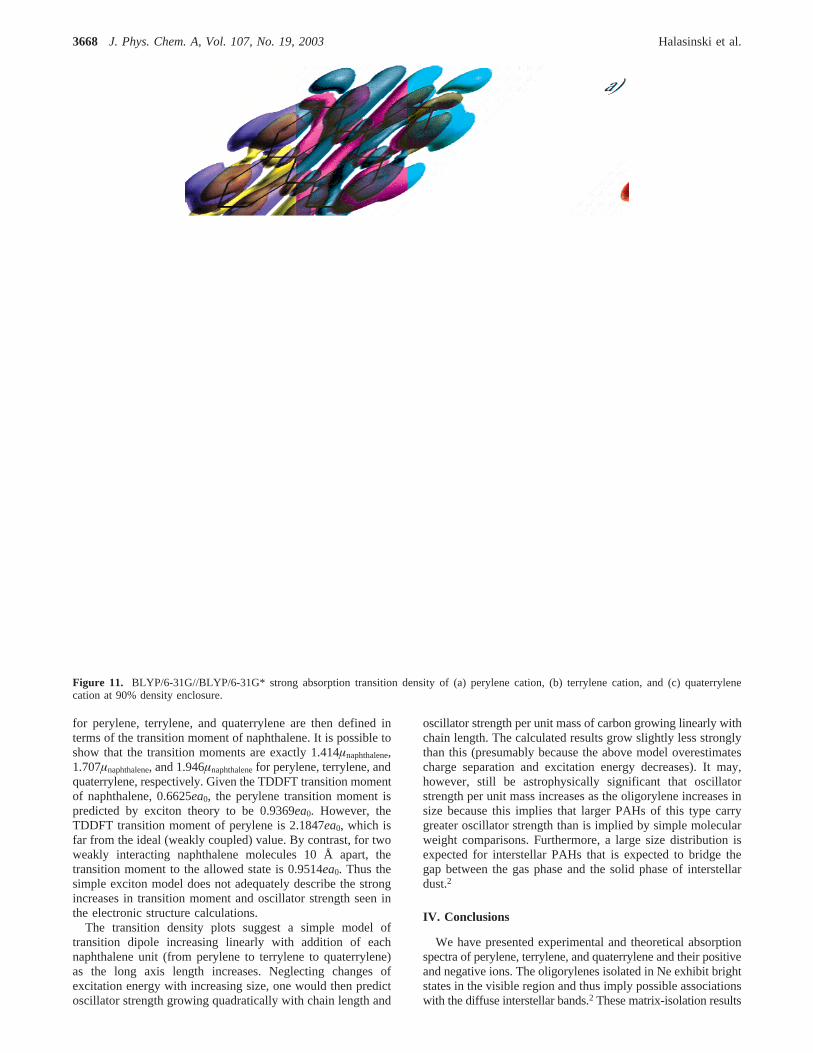
The perylene radical cation transition density is shown inFigure 10, at 90% density enclosure, along with the neutral andradical anion transition densities, to confirm that the radicalcation is qualitatively representative of all three charge states.The positive and negative phases are shown in different colors.The contours are not opaque and so the darker regions areoverlapping phases in one coordinate, although they do notoccupy the same spatial density. Figure 10 shows that thegeneral character of the transition density is the same for theneutral and radical species. It is possible to see from these plotsthat each transition density is characterized by a dipole momentalong the long axis of the molecule.
This transition character is the same for all three radicalcations, as seen in Figure 11. This then explains the growingoscillator strength with molecular size. Because the transitiondipole is oriented along the long axis of the molecule, the dipolemoment increases as the molecule length also increases on thataxis. Therefore the intensity of this given absorption grows uponadding naphthalene units to the perylene backbone. We assertthat the same type of transition character explains the oscillatorstrength trends in the neutral and radical anion species as well.
Physical interpretations of the transitions based on excitontheory are enlightening for these systems. We have already madereference to the growth pattern in perylene, terrylene, andquaterrylene as naphthalene unit additions, and this is the basisof an exciton theory analysis. Perylene may be treated as twointeracting naphthalene units, terrylene as three interacting units,and quaterrylene as four. The long axis transition in peryleneis then described by short axis transitions in the naphthaleneunits and the interaction between them. In this instance,experimental information about the short axis naphthalenetransition and the long axis perylene transition determines theinteraction energy necessary to be able to predict excitationenergies and oscillator strengths for terrylene and larger oligo-rylene spectra based upon this mode of growth.
Using the experimental absorption energies for the short axisnaphthalene transition, 4.45 eV,17 and the long axis perylenetransition, 2.96 eV, we then determine the interaction energy(VAB) to be 1.49 eV. This subsequently leads to long axistransition energies of 2.34 and 2.04 eV for neutral terryleneand quaterrylene, respectively. These energies are in excellentagreement with experiment, 2.35 and 2.04 eV, respectively! Wecan also follow this same prescription, using TDDFT energiesfor naphthalene and perylene instead of experimentally deter-mined energies. In this case, the exciton theory derivedabsorption energies for terrylene and quaterrylene match thecalculated TDDFT energies. This indicates that exciton theorydescribes consistent behavior within the exact experimentalframework and also the theoretical TDDFT framework.
The prediction of oscillator strengths (f ) 2/3ω|µ̌|2) based inexciton theory is not as satisfactory. The wave functions thatare determined from exciton theory are based on nonoverlappingmonomer wave functions. While the energies are explicitlydependent on an interaction energy term, the wave functionsare independent of the interaction term. The transition moments
Figure 10. Perylene (a) radical cation, (b) neutral, and (c) radical anionstrong absorption transition density at 90% density enclosure.
Spectra of C20H12, C30H16, and C40H20 J. Phys. Chem. A, Vol. 107, No. 19, 20033667
for perylene, terrylene, and quaterrylene are then defined interms of the transition moment of naphthalene. It is possible toshow that the transition moments are exactly 1.414µnaphthalene,1.707µnaphthalene, and 1.946µnaphthalenefor perylene, terrylene, andquaterrylene, respectively. Given the TDDFT transition momentof naphthalene, 0.6625ea0, the perylene transition moment ispredicted by exciton theory to be 0.9369ea0. However, theTDDFT transition moment of perylene is 2.1847ea0, which isfar from the ideal (weakly coupled) value. By contrast, for twoweakly interacting naphthalene molecules 10 Å apart, thetransition moment to the allowed state is 0.9514ea0. Thus thesimple exciton model does not adequately describe the strongincreases in transition moment and oscillator strength seen inthe electronic structure calculations.
The transition density plots suggest a simple model oftransition dipole increasing linearly with addition of eachnaphthalene unit (from perylene to terrylene to quaterrylene)as the long axis length increases. Neglecting changes ofexcitation energy with increasing size, one would then predictoscillator strength growing quadratically with chain length and
oscillator strength per unit mass of carbon growing linearly withchain length. The calculated results grow slightly less stronglythan this (presumably because the above model overestimatescharge separation and excitation energy decreases). It may,however, still be astrophysically significant that oscillatorstrength per unit mass increases as the oligorylene increases insize because this implies that larger PAHs of this type carrygreater oscillator strength than is implied by simple molecularweight comparisons. Furthermore, a large size distribution isexpected for interstellar PAHs that is expected to bridge thegap between the gas phase and the solid phase of interstellardust.2
IV. Conclusions
We have presented experimental and theoretical absorptionspectra of perylene, terrylene, and quaterrylene and their positiveand negative ions. The oligorylenes isolated in Ne exhibit brightstates in the visible region and thus imply possible associationswith the diffuse interstellar bands.2 These matrix-isolation results
Figure 11. BLYP/6-31G//BLYP/6-31G* strong absorption transition density of (a) perylene cation, (b) terrylene cation, and (c) quaterrylenecation at 90% density enclosure.
3668 J. Phys. Chem. A, Vol. 107, No. 19, 2003 Halasinski et al.

motivate the further investigation of this subset of PAHs withgas-phase techniques.
Time-dependent density functional theory calculations predictabsorption spectra in good agreement with the experimentalresults. The excitation energies and oscillator strengths of theB3u bright states match well, especially for the radical species.The TDDFT calculations have allowed us to understand thecharacter of the bright state transitions. The neutral excitationsare shown to be single HOMOf LUMO transitions, while theradical excitations involve configuration interaction betweenpromotions in to and out of the SOMO, leading to red shiftsrelative to the neutral.
For all neutral and radical species, the strong B3u transitionis the result of a transition dipole along the long axis of themolecule. The growth of the molecular backbone along the longaxis of the molecule leads to a larger transition dipole momentfor the bright state transition. In fact, the oscillator strength ofthe bright state per unit mass of carbon increases for largeroligorylenes, which may indicate a greater significance for theselarger systems in relation to the DIBs and to the interstellarextinction curve in general. It would be interesting to determinea picture of the trends of the oscillator strength through furtherstudies of other large PAH systems.
Acknowledgment. J.L.W. and M.H.G. thank the fellowauthors for their invitation to collaborate on such an interestingstudy and also acknowledge support by the Director, Office ofEnergy Research, Office of Basic Energy Sciences, ChemicalSciences Division of the U.S. Department of Energy, underContract No. DE-AC03-765F00098 and a grant from thePetroleum Research Fund. F.S. and T.M.H. acknowledge supportfrom NASA, Office of Space Science, under Grant SARA 188-01-00-21 and the excellent technical support of R. Walker. Theauthors acknowledge many helpful discussions with Lou Alla-mandola.
Supporting Information Available: Tables 1-10 providebasis set effects on the calculations (Table 1) and vibronictransitions of neutral, anionic, and cationic perylene, terrylene,and quaterrylene. This material is available free of charge viathe Internet at http://pubs.acs.org.
References and Notes
(1) (a) Allamandola, L. J.; Tielens, A. G. G. M.; Barker, J. R.Astrophys.J. Suppl. Ser. 1989, 71, 733. (b) Puget, J. L.; Le´ger, A.Annu. ReV. Astron.Astrophys. 1989, 27, 161. (c) Hudgins, D. M.; Allamandola, L. J.Astrophys.J. Lett. 1999, 513, L69.
(2) (a) Salama, F.; Bakes, E. L. O.; Allamandola, L. J.; Tielens, A. G.G. M. Astrophys. J. 1996, 458, 621. (b) Salama, F.; Galazutdinov, G. A.;Krelowski, J.; Allamandola, L. J.; Musaev, F. A.Astrophys. J.1999, 526,265.
(3) Ruiterkamp, R.; Halasinski, T.; Salama, F.; Foing, B.; Schmidt,W.; Ehrenfreund, P.Astron. Astrophys. 2002, 390, 1153.
(4) Halasinski, T. M.; Salama, F.; Allamandola, L. J.Astrophys. J.,manuscript in preparation.
(5) Halasinski, T. M.; Hudgins, D. M.; Salama, F.; Allamandola, L.J.; Bally, T.J. Phys. Chem. A 2000, 104, 7484.
(6) (a) Runge, E.; Gross, E.Phys. ReV. Lett. 1984, 52, 997. (b)Petersilka, M.; Gossmann, U.; Gross, E.Phys. ReV. Lett. 1996, 76, 1212.(c) Bauernschmitt, R.; Alrichs, R.Chem. Phys. Lett. 1996, 256, 454.
(7) Hirata, S.; Lee, T.; Head-Gordon, M.J. Chem. Phys. 1999, 111,8904.
(8) (a) Salama, F.; Allamandola, L. J.J. Chem. Phys. 1991, 94, 6964.(b) Salama, F.; Joblin, C.; Allamandola, L. J.J. Chem. Phys. 1994, 101,10252.
(9) Becke, A. D.Phys. ReV. A 1988, 38, 3098.(10) Lee, C.; Yang, W.; Parr, R. G.Phys. ReV. B, 1988, 37, 785.(11) Kong, J.; White, C. A.; Krylov, A. I.; Sherrill, C. D.; Adamson, R.
D.; Furlani, T. R.; Lee, M. S.; Lee, A. M.; Gwaltney, S. R.; Adams, T. R.;Ochsenfeld, C.; Gilbert, A. T. B.; Kedziora, G. S.; Rassolov, V. A.; Maurice,D. R.; Nair, N.; Shao, Y.; Besley, N. A.; Maslen, P. E.; Dombroski, J. P.;Dachsel, H.; Zhang, W. M.; Korambath, P. P.; Baker, J.; Byrd, E. F. C.;Van Voorhis, T.; Oumi, M.; Hirata, S.; Hsu, C. P.; Ishikawa, N.; Florian,J.; Warshel, A.; Johnson, B. G.; Gill, P. M. W.; Head-Gordon, M.; Pople,J. A. J. Comput. Chem. 2000, 21, 1532.
(12) (a) Szczepanski, J.; Chapo, C.; Vala, M.Chem. Phys. Lett. 1993,205, 434. (b) Joblin, C.; Salama, F.; Allamandola, L.J. Chem. Phys. 1999,110, 7287.
(13) (a) Joblin, C.; Salama, F.; Allamandola, L. J. Chem. Phys. 1995,102, 9743. (b) Chillier, X. D. F.; Stone, B. M.; Salama, F.; Allamandola,L. J. J. Chem. Phys. 1999, 111, 449.
(14) Deperasinska, I.; Kozankiewicz, B.; Biktchantaev, I.; Sepiol, J.J.Phys. Chem. A 2001, 105, 810.
(15) Head-Gordon, M.; Grana, A. M.; Maurice, D.; White, C. A.J. Phys.Chem. 1995, 99, 14261.
(16) (a) Jaffe´, H. H.; Orchin, M.Theory and Applications of UltraVioletSpectroscopy; John Wiley and Sons: New York, 1962. (b) Murrel, J. N.The Theory of the Electronic Spectra of Organic Molecules; Spottiswoode,Ballantyne & Co. Ltd.: London, 1963.
(17) George, G. A.; Morris, G. C.J. Mol. Spectrosc.1968, 26, 67.
Spectra of C20H12, C30H16, and C40H20 J. Phys. Chem. A, Vol. 107, No. 19, 20033669