electromagnetic wave guidance mechanisms in photonic crystal … · electromagnetic wave guidance...
TRANSCRIPT

Electromagnetic Wave Guidance Mechanisms in Photonic Crystal Fibers Tushar Biswas1, Shyamal K. Bhadra1
1Fiber optics and Photonics Division, CSIR-Central Glass and Ceramic Research Institute *196, Raja S C Mullick Road, Jadavpur, Kolkata-700032, India, [email protected] Abstract: We present the utilization finite element method as implemented in COMSOL Multiphysics for understanding three different types of wave guidance mechanisms in photonic crystal fibers (PCFs), like modified total internal reflection, Bragg’s reflection and resonant trapping of defect mode at Dirac frequency. Effective refractive indices of the core and cladding are calculated using mode analysis study to verify total internal reflection in a solid core PCF. The photonic band structure (PBS) of the cladding is calculated using eigen frequency study to identify photonic band gap region which constitute the transmission window of a hollow core PCF. The eigen frequency of the Dirac point is identified from the PBS. Trapping of Dirac mode is obtained by optimizing the defect radius in such a way that the defect state resonate at the Dirac frequency. This study is important for designing and investigating the performance of various PCF based devices for advanced applications. Keywords: Photonic crystal fiber, electromagnetics, waveguide, photonic band gap. 1. Introduction
Photonic crystal fibers (PCFs) guide light through a solid or hollow core by employing various inherent optical properties of artificially created crystal like cladding, generally, which is a periodic arrangement of air holes in silica glass [1,2]. The schematic diagram of a solid core (SC) and a hollow core (HC) PCF are shown in figure 1.
(a)
(b)
Figure 1.Schematic diagram of the cross section of (a) solid core and (b) hollow core PCF. The white circles represent air holes and the blue regions represent the silica glass. Process of fabricating PCF is now a proven technology which is providing applications like supercontinuum generation, low loss ultra-short pulse propagation, lasing, sensing and many more [3-6]. A clear knowledge of wave propagation characteristics into PCFs is the fundamental requirement of designing various PCF based devices. Two types of light guidance mechanisms, namely index guidance and photonic band gap (PBG) guidance have been widely adopted during the last decade. Light is guided through a high refractive index core by total internal reflection (TIR) in a SC index guiding PCF and by Bragg’s reflection in a HC-PBG guiding PCF. Recently, possibility of another type of wave guidance namely Dirac mode guidance employing a special point of the photonic band structure (PBS) of the cladding known as the Dirac point has been explored. Dirac point for a specially designed PC ensures isotropic linear dispersion relation between the bands crossing in the Brillouin zone (BZ). Light corresponding to Dirac frequency can be trapped in a PCF by creating appropriate defect core. One has to calculate the effective refractive index (RI) of the fundamental space filling mode (nFSM) and PBS to understand various light guidance mechanisms. We present applications of mode analysis and eigen frequency studies of radio frequency (RF) of physics module of COMSOL multiphysics for such calculations.
Excerpt from the Proceedings of the 2015 COMSOL Conference in Pune

2. Index guidance mechanism
The wave guidance mechanism in a SCPCF (figure 1(a)) is almost similar to that in a conventional step index fiber which consists of a high RI core and low RI cladding. Light faces total internal reflection (RI) at the core cladding interface for certain launching condition. Thus light is guided along the length of the fiber following multiple TIRs. This kind of wave guidance mechanisms is often termed as index guidance mechanism. The difference in a SCPCF is that the effective RI of the cladding gets modified due the micro structuring. So the wave guidance mechanism in a SCPCF is termed as modified total internal reflection (MTIR).
The first step to understand this mechanism is calculation of the effect RI index of the fundamental space filling mode (nFSM), which is the fundamental solution of the Maxwell’s electromagnetic wave equation into a defect less cladding. The Maxwell’s equation is written as following
0Erε20
E)( k (1)
Where E represent the electric field, εr is the dielectric permittivity and k0 is the free space wavenumber. The value of nFSM is calculated by solving eq.(1) into the elementary piece of the crystal as shown in figure 2 (a).
(a)
(b)
(c)
Figure 2. (a) Elementary piece of the intrinsic cladding used to compute nFSM, (b) mesh elements inside the elementary piece, (c) electric field distribution of the FSM. A Perfect electric or magnetic conductor (PEC or PMC respectively) is used along each symmetric plane. The conditions set by PEC and PMC are given by the following equations
0En (2)
0Hn (3)
Figure 2 (b) shows the mesh element division inside the elementary piece. The value of nFSM at a particular wavelength is obtained by mode analysis study into the elementary piece. The electric field distribution of the FSM for Ʌ=2.21µm and d=0.47Ʌ at 1300nm wavelength is shown in figure 2(c). The corresponding value of nFSM is 1.149436. Similarly, the core guided modes are obtained by mode analysis into the cross section of the PCF. The electric field distribution of the fundamental core guided mode is shown in figure 3.
Figure 3.The electric field distribution of the fundamental core guided mode at 1300nm.
Excerpt from the Proceedings of the 2015 COMSOL Conference in Pune
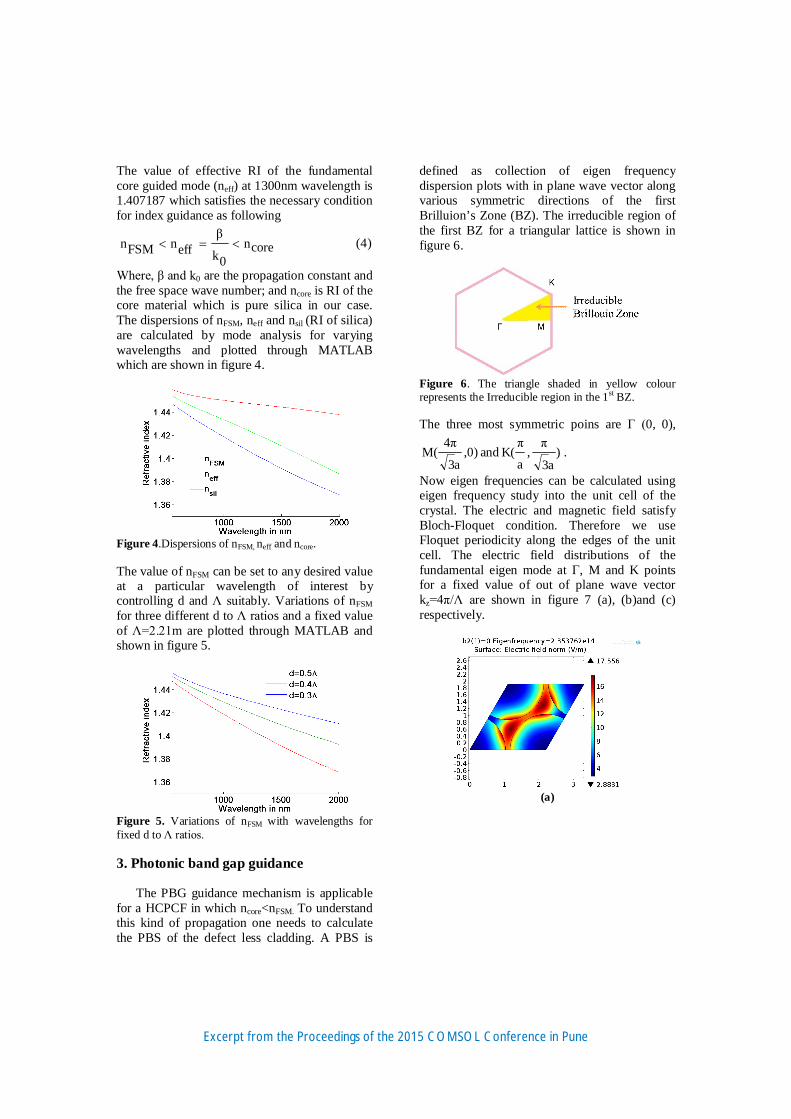
The value of effective RI of the fundamental core guided mode (neff) at 1300nm wavelength is 1.407187 which satisfies the necessary condition for index guidance as following
coren0k
βeffnFSMn (4)
Where, β and k0 are the propagation constant and the free space wave number; and ncore is RI of the core material which is pure silica in our case. The dispersions of nFSM, neff and nsil (RI of silica) are calculated by mode analysis for varying wavelengths and plotted through MATLAB which are shown in figure 4.
Figure 4.Dispersions of nFSM, neff and ncore. The value of nFSM can be set to any desired value at a particular wavelength of interest by controlling d and Ʌ suitably. Variations of nFSM for three different d to Ʌ ratios and a fixed value of Ʌ=2.21m are plotted through MATLAB and shown in figure 5.
Figure 5. Variations of nFSM with wavelengths for fixed d to Ʌ ratios. 3. Photonic band gap guidance
The PBG guidance mechanism is applicable for a HCPCF in which ncore<nFSM. To understand this kind of propagation one needs to calculate the PBS of the defect less cladding. A PBS is
defined as collection of eigen frequency dispersion plots with in plane wave vector along various symmetric directions of the first Brilluion’s Zone (BZ). The irreducible region of the first BZ for a triangular lattice is shown in figure 6.
Figure 6. The triangle shaded in yellow colour represents the Irreducible region in the 1st BZ. The three most symmetric poins are Γ (0, 0),
,0)a3
4πM( and )
a3
π,
a
πK( .
Now eigen frequencies can be calculated using eigen frequency study into the unit cell of the crystal. The electric and magnetic field satisfy Bloch-Floquet condition. Therefore we use Floquet periodicity along the edges of the unit cell. The electric field distributions of the fundamental eigen mode at Γ, M and K points for a fixed value of out of plane wave vector kz=4π/Ʌ are shown in figure 7 (a), (b)and (c) respectively.
(a)
Excerpt from the Proceedings of the 2015 COMSOL Conference in Pune

(b)
(c)
Figure 7. The electric field distributions of the fundamental eigen mode at (a) Γ, (b) M and (c) K points for kz=4π/Ʌ. Eigen frequencies of first six modes are collected and their dispersion curves are plotted using MATLAB to obtain the PBS as shown in figure 8.
Figure 8. PBS for Ʌ=2.21µm, d=0.47* Ʌ and kz=4π/Ʌ. The PBG is shown by the shaded region. There is no real solution for a range of wavelength in the PBS. This region is called the PBG. The position and width of the PBG change for varying kz. The variation of PBG with kz is known as the PBG map which gives the transmission window of a HCPCF. Such a map is plotted using MATLAB and shown in figure 9.
Figure 9. The PBG map for for Ʌ=2.21µm, d=0.47* Ʌ. The area inscribed by blue lines represents the PBG and the red curve shows the dispersion of the fundamental core guided mode. In figure 9 the area inscribed by blue lines represents the PBG and the red curve shows the dispersion of the fundamental core guided mode. The electric field distribution of the fundamental core guided mode at 1300nm is shown in figure 10.
Figure 10. The electric field distribution of the fundamental core guided mode at 1300nm. 4. Dirac mode guidance
This type of guidance can be obtained by utilizing Dirac point as shown in figure 8. Band 5 and band 6 cross K point almost linearly for the value of normalized frequency fɅ/c=1.999. The density of states becomes zero at this point. Also, the eigen frequency surface plots take conical form due to linearity of dispersion curves near the close vicinity of the point. Figure 11 shows the formation of Dirac cone near K point.
Excerpt from the Proceedings of the 2015 COMSOL Conference in Pune

Figure 11. Eigen frequency surface plots of band 5 and band 6 near Dirac point. Now we create a defect into the crystal in such a way that the eigen frequency of the super cell coincide with Dirac frequency. This is done by performing eigen frequency study for varying defect radius dc as shown in figure 12.
Figure 12. Super cell showing defect radius to trap Dirac frequency. We found that for Ʌ=2.21µm, d=0.47* Ʌ if the value dc is set to 1.9*Ʌ the defect state resonate at Dirc frequency. The normalized value of Dirac frequency is fdɅ/c=1.999. Modal confinement is confirmed using mode analysis study at Dirac frequency. The electric field distribution of the Dirac mode is shown in figure 13.
Figure 13. electric field distribution of Dirac mode. 7. Conclusions
Three different wave propagation characteristics were calculated by finite element
method as implemented in COMSOL Multiphysics. PCFs having core index higher than cladding guides light by TIR. This guidance mechanism, also known the index guidance, was verified by calculating the effective refractive indices of core and photonic crystal cladding using mode analysis study of RF module of COMSOL Multiphysics. In case of PBG guidance the EM- frequencies forbidden in the PC are trapped into the low index core. The PBS of cladding was calculated with help of eigen frequency study of RF module to investigate PBG guidance mechanism. Dirac mode guidance was obtained by introducing suitable defect mode that resonates at Dirac frequency. This study may be useful for designing as well as analyzing different types of PCFs and devices based on them. 8. References 1. P. Russell, “Photonic crystal fibers,” Science, 299, 358–62(2003). 2. F, Benabid, “Hollow core photonic bandgap fibre: newlightguidance for new science and technology,” Phil. Trans. R. Soc. A, 364, 3439–62(2006). 3. D. Ghosh, S. Roy and S.K Bhadra, “Efficient Supercontinuum Sources Based on Suspended Core Microstructured Fibers,” IEEE-J. Sec. Top. Quantum Elec, 20, 7600108 (2014). 4. D. Ghosh, S. Roy, M. Pal, P. Leproux, P. Viale, V. Tombelaine, S. K. Bhadra, "Blue-Extended Sub-Nanosecond Supercontinuum Generation in Simply Designed Nonlinear Microstructured Optical Fibers," J. Lightw. Technol, 29,146-152 (2011). 5. D. Ghosh, S. Roy, M. Pal, A. Pal, S. Bhadra, J. McCarthy, H. Bookey, and A. Kar, "Generation of supercontinuum and its theoretical study in three-ring silica microstructured optical fibers," Appl. Opt, 48, G12-G20 (2009). 6. T. Biswas, R. Chattopadhyay and S. K. Bhadra, “Plasmonic hollow-core photonic band gap fiber for efficient sensing of biofluids”, J. Opt, 16, 045001(2014). 9. Acknowledgements Director CSIR-CGCRI, CSIR 12th five-year-plan project GLASSFIB
Excerpt from the Proceedings of the 2015 COMSOL Conference in Pune