electromagnetic radiation measurements of a short wave ...€¦ · web viewelectronic engineering...
TRANSCRIPT
Electromagnetic wave transmission prediction software and experimental simulation, aiding laboratory classes for electronic engineering students
KONSTANTINOS VOUDOURISDepartment of Electronics
Technological Educational Institute (TEI) of AthensGR-12210, Athens, Greece
http://www.ee.teiath.gr
Abstract: This paper presents a methodology aiming for student’s better understating phenomena such as fading in electromagnetic radiocommunication transmission. Combining software and hardware simulations, the method aids electronic engineering undergrads to be familiar in designing broadband radiocommunication network links, taking into account specifications at large, emphasising in quality indicators such as network availability and offering solutions in fading problems, such as space or frequency diversity.
Key-Words: Radiocommunications, fading, space diversity, frequency diversity, electromagnetic wave propagation, radiocommunications laboratory, engineering education..
1. IntroductionWireless communications, are undoubtedly the main technology for fast and reliable development of broadband networks, carrying services such as eGovernment, eLearning, eHealth and eBusiness, fulfilling therefore the objectives of eEurope 2005 action plan [1], [2].
Electronic engineering undergrads should, inter alia, be trained in all aspects and physical phenomena related to wireless communications such as the electromagnetic wave transmission. One of the most important issue, which directly effects the quality of communication and thus the installation an running cost of the eService, is fading.
The radiocommunications laboratory, within the department of Electronics, of the Technological Institute (TEI) of Athens, has developed a methodology, based on hard- and soft-ware solutions, in order to offer its students the basic knowledge regarding the issue of designing radiocommunications network links.
2. Radiocommunications link design Ground reflections are probably the most crucial parameter when designing a radio link [3]. Well known methods of increasing antennae gain, or using space or frequency diversity techniques, or even changing antenna mast site, are included during the process of the laboratory experiment. Students are called to calculate required antenna gain, as well as space and frequency distances. Their goal is to reduce
the effect of ground reflection in order to increase fade margin and thus quality of service.
3. Software approachIn order students to become familiar with terms such as “line of site”, “Fresnel zone”, “back to back repeaters”, “link availability”, and “fade margin”, the next steps are followed during the lab workshop.
The work is focused in selecting a proper site for the repeater, and the appropriate size of the antennae.
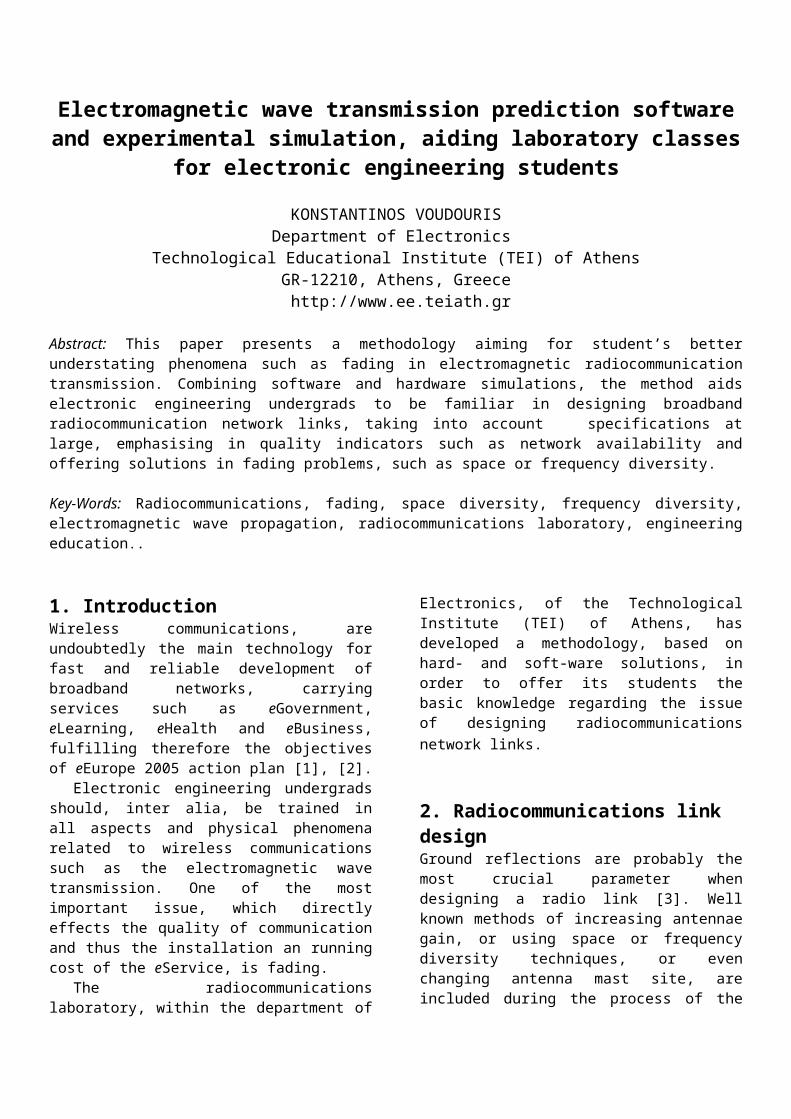
3.1 Establishing line of siteThe sample map depicted in Fig. 1 is given to students, with the requirement to connect site A with site B. This requirement is supposed to cover electronic communication needs of the relevant operator, with the following specifications.
Table 1. Radio link design specificationsA. Propagation data
Frequency Band
15 GHz Conductivity 8
Climate type Continental Dielectric constant
15
k-factor 4/3 Rain Region A
Propagation model Free Space + RMD
B. Radio Link data
Site A Site B Repeater Site
Coordinates N44°15'27.54" W123°23'37.84"
N44°11'29.78" W122°46'37.75" -
elevation 241 m 244 m -Antenna height < 10 m < 50 m
Transmitter power 20 - 25 dBm -
Line loss ~ 1,2 dBAntenna diameter < 1,2 m < 0,6 m < 2,4 m
Link Availability > 99,99970%
Fig. 1 Sample terrain top view map
The corresponded to the above radiolink terrain cut is shown in next fig.2
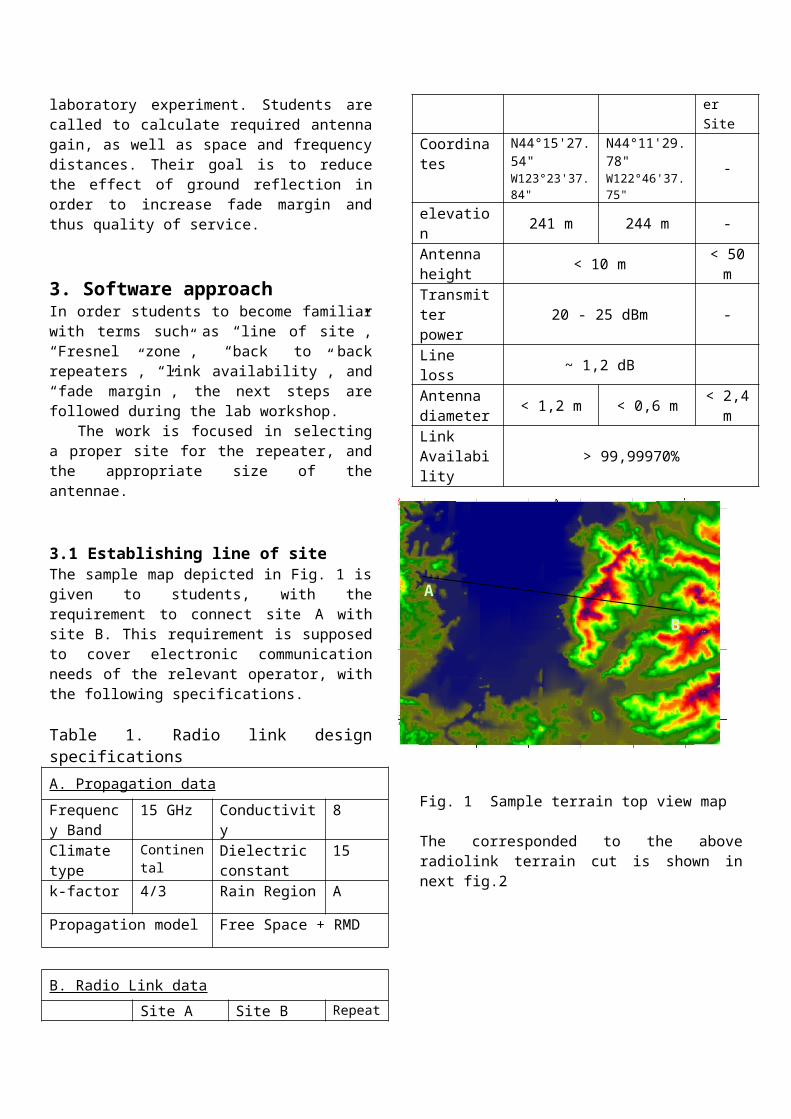
Fig. 2: Terrain cut of link A B
3.2. Overcoming obstacles
The main design goal at this point, overcome the obstacle of the 900 high mountain at 32 km from site A, by redesign the link using a repeater at the highest point of the route.
3.3. Setting up repeatersStudents at this end, have to take into account the possibility of interference in case they choose as repeater site the top of the obstacle mountain [4]. Furthetmore, extra factors have to be considered, such as the difficulties of installing antennae masts at high altitudes, and the high likelihood of absence of transportation infrastructure. The repeater site is chosen at point D, as shown in next fig. 3. Site D is at lower altitude, Points A and B do not lie on the same line, and therefore the likelihood of interference due to dispersion is reduced. The relevant terrain cuts are shown in figs. 4 and 5.
It is essential at this point to introduce the issue of spectrum management, and the need of a separate study on choosing frequency bands and then, the consequently exact frequency of the radiolink.
Fig. 3: Sample terrain top view map
3.4 Finalising the designWith the repeater fixed at point D, two link studies are performed, which fulfil quality requirements of the telecom operator. Next fig. 5 depicts the new terrain top view, and table 2 summarises link performance indicators.
A
B
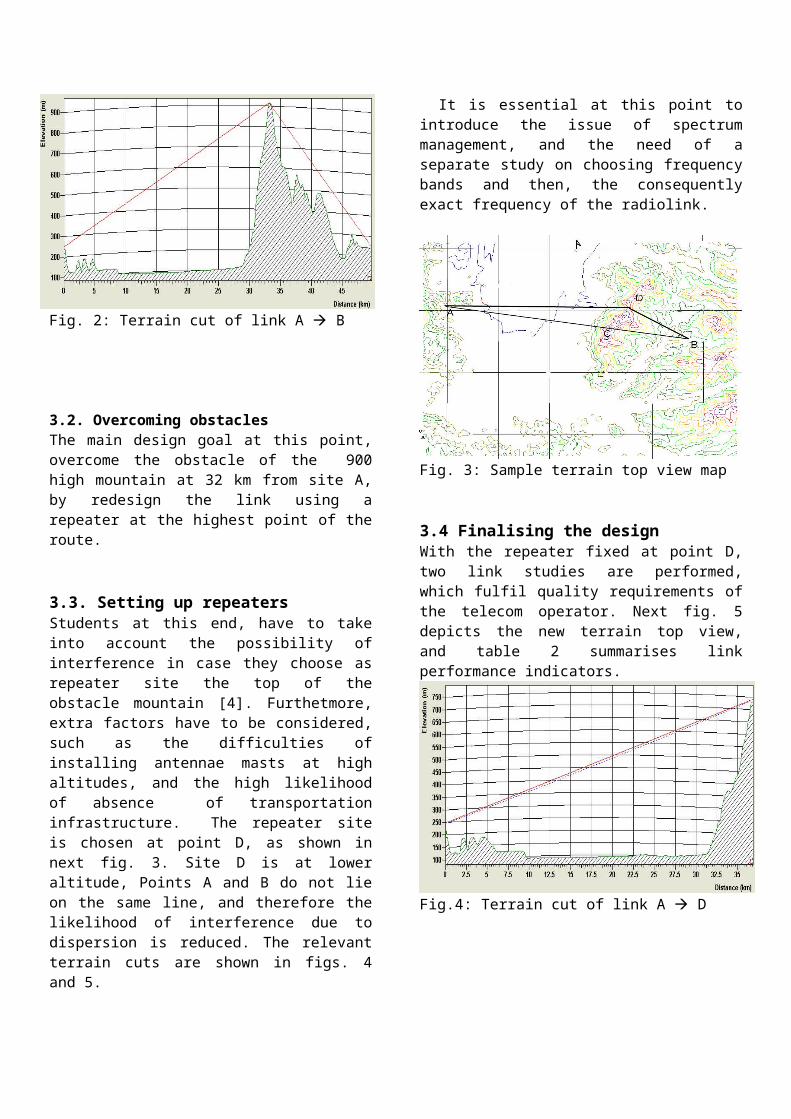
Fig.4: Terrain cut of link A D
Fig.5 Terrain cut of link D B
Table 2: Radio link performance indicatorsInitial phase
Repeater at site C
Repeater at site D
A B
A C
C A
A D B D
Link Length [km]
46,66 33,34 13,32 36,81 14,51
Path Loss [dB]
183 146 140 147 139
Fade Margin [dB]
-20 43,50 43,70 42,64 42,90
Annual Fade outage [sec]
4x10⁶ 118 13 193 11
Availability [%]
45 99,9985 99,9998 99,9976 99,9999
Received signal level
-126 -63 -62,50 -63,64 -63,40
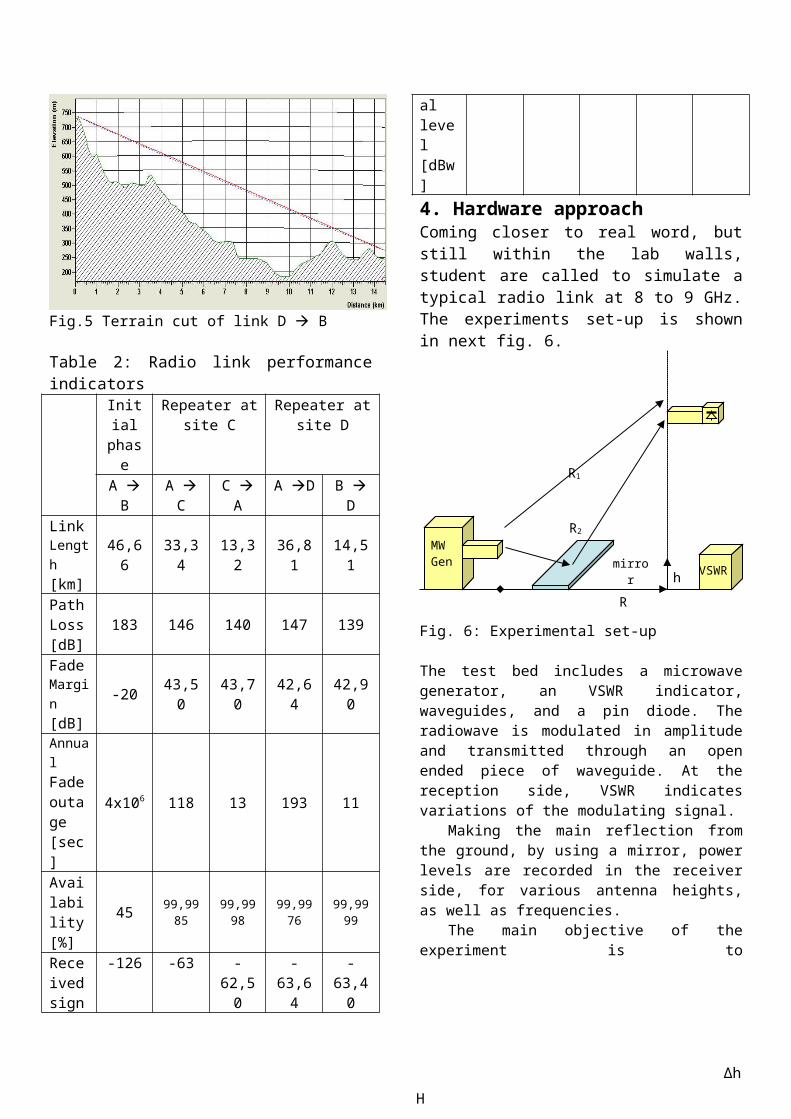
[dBw]4. Hardware approachComing closer to real word, but still within the lab walls, student are called to simulate a typical radio link at 8 to 9 GHz. The experiments set-up is shown in next fig. 6.
Fig. 6: Experimental set-up
The test bed includes a microwave generator, an VSWR indicator, waveguides, and a pin diode. The radiowave is modulated in amplitude and transmitted through an open ended piece of waveguide. At the reception side, VSWR indicates variations of the modulating signal.
Making the main reflection from the ground, by using a mirror, power levels are recorded in the receiver side, for various antenna heights, as well as frequencies.
The main objective of the experiment is to
Fig. 7: Far field Radiowave shape
h VSWR
R
mirror
R1
R2
MW Gen
hR
Δh
H
demonstrate the shape of the electromagnetic wave in space (fig. 7), and from this to calculate the appropriate diversity system, space or frequency.
Next table 3 shows experimental results, both for space and frequency diversities. The theoretical values are calculated form the formulas bellow [5].
(1)
(2)
Where R = 2,5 m, H = 100 cm and the transmitting frequency, when the space diversity is measured, is f = 8 GHz, and similarly h = 150 cm for frequency diversity.
Table 3. Experimental results for space and frequency diversities
Space Diversity Frequency DiversityAntenna height [cm]
VSWR[dB]
Transmission Frequency
[GHz]
VSWR[dB]
15.5 -22 8.02 -1218.7 -28 8.29 -26213 -19 8.52 -1424.1 -27 8.71 -2427.6 -20 8.94 -1130.7 -30 9.17 -3033.4 -21 9.40 -2136.3 -29 9.63 -29
When applying the above formulas, the theoretical values for space and frequency diversities are respectively: 2,34 cm and 125 MHz, when the measurements give mean values of 3 cm and 230 MHz.
Theoretical, versus measured results are not so close. This experimental set up value does not lie within its power to predict the behaviour of a radiolink, but rather to offer students the opportunity to observe the reflection phenomenon and through appropriate measurements to end up with a design which solves fading problems.
5. Limitations Hardware simulation suffers from multipath reflections, resulting to inaccurate measurements. This is due to the indoor environment, and the absence of an anechoic chamber. Despite the difficulties, this methodology fulfils the aim of educating students with
all basics for radiowave propagation and radiolink design. Future de-embedding may improve results of this experiment, and would be proved an inexpensive measurement method as well.
6. ConclusionsA methodology which combines software and hardware simulations was presented. Electronic engineering undergrads are becoming familiar with phenomena such as fading and solutions such as space and frequency diversities. The design of a broadband radiolink is part of the experimental simulation. Students are dealing with many of the specification and installation parameters of a radiolink, including repeaters site selection. Emphasis is given on quality indicators, such as availability. Space and frequency diversity distances were calculated both experimentally and theoretically.
The described methodology is an efficient and inexpensive laboratory teaching tool for electronic engineering undergraduate students.
References:[1] Commission Communication, eEurope 2005
action plan”, COM(2002)263 and itsreview COM(2004)108
[2] Council Resolution of 18 February 2003 on the implementation of the eEurope 2005 Action Plan OJ C 48, 28.2.2003, p. 2.
[3] Rec. 530-4, “Propagation data and prediction method required for design of terrestrial line of sight systems”, International Telecommunication Union (ITU), RPN Series 1992, pp. 214-236 (ISBN 92-61-04531-6)
[4] Rec. 452-5, “Prediction procedure for the evaluationof microwave interference between stations on the surface of the earth at frequencies above about 0,7 GHz”, International Telecommunication Union (ITU), RPN Series 1992, pp. 285-317 (ISBN 92-61-04531-6)
[5] P. Panter, “Communication systems design”, Mac Graw Hill, 1972