electrodeposition of germanium at elevated temperatures
TRANSCRIPT
12080 | Phys. Chem. Chem. Phys., 2015, 17, 12080--12089 This journal is© the Owner Societies 2015
Cite this:Phys.Chem.Chem.Phys.,
2015, 17, 12080
Electrodeposition of germanium at elevatedtemperatures and pressures from ionic liquids†
Minxian Wu,a Gijs Vanhoutte,a Neil R. Brooks,b Koen Binnemansb andJan Fransaer*a
The electrodeposition of germanium at elevated temperatures up to 180 1C and pressures was studied
from the ionic liquids 1-butyl-1-methylpyrrolidinium dicyanamide and 1-butyl-1-methylpyrrolidinium
bis(trifluoromethylsulfonyl)imide containing [GeCl4(BuIm)2] (where BuIm = 1-butylimidazole) or GeCl4.
Cyclic voltammetry (CV), electrochemical quartz crystal microbalance (EQCM), rotating ring-disk
electrode (RRDE), scanning electron microscope (SEM), X-ray diffraction (XRD), transmission electron
microscopy (TEM), electron backscatter diffraction (EBSD) and Auger electron spectroscopy (AES) were
used to investigate the electrochemical behavior and the properties of the electrodeposited germanium.
Electrodeposition at elevated temperatures leads to higher deposition rates due to: (1) increase in the
diffusion rate of the electroactive germanium compounds; (2) faster electrochemical kinetics in the
electrolyte; and (3) higher electrical conductivity of the electrodeposited germanium film. Moreover,
the morphology of the germanium film is also of a better quality at higher electrodeposition tempera-
tures due to an increase in adatom mobility.
1 Introduction
The electrodeposition of germanium thin films is receiving alot of attention from the scientific community, thanks to theimportance of germanium in semiconductor applications.1–4
Thin films of germanium can be fabricated from varioussolutions using electrodeposition. Due to the low overpotentialfor hydrogen evolution on germanium electrodes, only ultrathingermanium layers could be obtained from aqueous solutions.5–7
Grey shiny germanium films were electrodeposited from organicsolvents, e.g. ethylene glycol, propylene glycol, etc.8–10 However,the current efficiency for electrodeposition from protic organicelectrolytes such as ethylene glycol and propylene glycol is verylow due to formation of hydrogen gas. To avoid hydrogenevolution, electrolytes based on supercritical fluids or ionicliquids are gaining more and more interest.3,11
Ionic liquids are solvents that consist entirely of ions. Theyhave a wide electrochemical window and an intrinsic ionic
conductivity.12,13 Using ionic liquids as electrolytes and per-forming electrodeposition from ionic liquids has been a hotresearch topic during last decade. Some metals that are impos-sible to deposit from water due to hydrolysis or due to the factthat hydrogen evolution happens before metal ion reductioncan be electrodeposited from ionic liquids because water canbe easily removed.14 Endres and coworkers first reported ongermanium electrodeposition from the ionic liquid 1-butyl-3-methylimidazolium hexafluorophosphate using germanium(IV)halides as germanium source.15–18 Germanium nanoclusterswere obtained, but carbon, oxygen and halogen impurities weredetected in the deposits. Germanium has also been electrodepositedfrom other ionic liquids, e.g. 1-butyl-3-methylimidazolium bis-(trifluoromethylsulfonyl)imide, 1-butyl-1-methylpyrrolidiniumbis(trifluoromethylsulfonyl)imide, 1-ethyl-2,3-dimethylimidazoliumbis(trifluoromethylsulfonyl)imide.19–21 Due to the low boilingpoint of GeCl4 (86.5 1C), most of the depositions have beencarried out at room temperature. Xin et al. performed SixGe1�x
deposition from 1-ethyl-3-methylimidazolium bis(trifluoromethyl-sulfonyl)imide using GeCl4 and SiCl4 at 90 1C and found a2D-ordered SixGe1�x deposit at 90 1C instead of the 3D structurethat was formed at room temperature.22 The film morphologywas improved due to the increase of adatom mobility on thesurface at elevated temperatures.23 To prevent the evaporationof the electroactive germanium compound, we used a newgermanium compound [GeCl4(BuIm)2] (where BuIm = 1-butyl-imidazole), which is much less volatile than GeCl4, and success-fully electrodeposited porous germanium films from a mixture
a Department of Materials Engineering, KU Leuven, Kasteelpark Arenberg 44 – bus 2450,
B-3001 Leuven, Belgium. E-mail: [email protected]; Fax: +32 16 32 19 91;
Tel: +32 16 32 12 60b Department of Chemistry, KU Leuven, Celestijnenlaan 200F – bus 2404, B-3001 Leuven,
Belgium
† Electronic supplementary information (ESI) available: SEM images of thegermanium film electrodeposited from [BMP][DCA] and [BMP][Tf2N]; a photo-graph of a germanium film electrodeposited from [BMP][Tf2N]; linear scanvoltammograms of 0.5 M GeCl4 in [BMP][Tf2N]; viscosity of [BMP][Tf2N] atdifferent temperatures. See DOI: 10.1039/c4cp06076h
Received 26th December 2014,Accepted 9th April 2015
DOI: 10.1039/c4cp06076h
www.rsc.org/pccp
PCCP
PAPER
Ope
n A
cces
s A
rtic
le. P
ublis
hed
on 1
0 A
pril
2015
. Dow
nloa
ded
on 2
/28/
2022
12:
45:3
4 A
M.
Thi
s ar
ticle
is li
cens
ed u
nder
a C
reat
ive
Com
mon
s A
ttrib
utio
n-N
onC
omm
erci
al 3
.0 U
npor
ted
Lic
ence
.
View Article OnlineView Journal | View Issue

This journal is© the Owner Societies 2015 Phys. Chem. Chem. Phys., 2015, 17, 12080--12089 | 12081
of 1-butyl-1-methylpyrrolidinium dicyanamide and 1-butyl-1-methylpyrrolidinium chloride at 100 1C.24 The deposition rateat 100 1C was much higher than at room temperature. Becauseat elevated temperatures, both the diffusion rate of germaniumions and electrochemical kinetics are increased. Also, theelectrical conductivity (s) of electrodeposited germanium filmalso increased at higher temperatures as s p exp(�Eg/2kBT),where Eg is the band gap of the material, kB is the Boltzmannconstant, and T is the absolute temperature.25
This paper is about the electrodeposition of germanium atelevated temperatures up to 120 1C from 1-butyl-1-methyl-pyrrolidinium dicyanamide and up to 180 1C from 1-butyl-1-methylpyrrolidinium bis(trifluoromethylsulfonyl)imide. Toprevent the evaporation of [GeCl4(BuIm)2] and GeCl4, a highpressure electrochemical cell was built. At temperatures higherthan 150 1C, dense shiny germanium films could be electro-deposited and high deposition rates could be obtained.
2 Experimental
The ionic liquids 1-butyl-1-methylpyrrolidinium bis(trifluoro-methylsulfonyl)imide [BMP][Tf2N] (IoLiTec, 498%) and 1-butyl-1-methylpyrrolidinium dicyanamide [BMP][DCA] (IoLiTec, 498%)were thoroughly dried in a vacuum of 0.6 mbar at 120 1C for atleast 8 h. GeCl4 (Umicore, Olen, Belgium, 99.99%) was used asreceived. [GeCl4(BuIm)2] was synthesized according to a literatureprocedure.24
The electrolyte solutions were prepared in an argon-filledglove box (oxygen and water contents were below 1 ppm), andthen the electrolytes were transferred into a closed pressurecell. The schematic drawing of the pressure electrochemical cellis shown in Fig. 1. It was a cylindrical glass cell with a screwcap. The electrochemical experiments were performed outsidethe glove box and the closed cell was entirely immersed in a hotsilicon oil bath. All the electrochemical experiments werecarried out in a three-electrode system. The counter electrodewas a p-type germanium wafer and a platinum wire was used asa pseudo-reference electrode. The working electrode used for
cyclic voltammetry and for linear scan voltammetry experi-ments was a polished platinum disk (f = 1 mm) embeddedin EpoFixs resin. In rotating ring-disk electrode experiments, aplatinum/platinum rotating ring-disk electrode (Pine ResearchInstrumentation, E7R8 Series) was used as working electrode.The dimensions of the ring and disk electrodes were providedby the supplier. The disk has a diameter of 4.57 mm (2r1), andthe inside and outside diameters of the ring are 4.93 mm (2r2)and 5.38 mm (2r3), respectively. Platinum-coated silicon wafers(silicon covered with 500 nm of silica, 10 nm of titanium and100 nm of platinum) or n-type germanium wafers (Umicore,Cz88 742) were used as working electrode for germaniumdeposition. Before electrodeposition, all the substrates wererinsed with deionized water and absolute ethanol and finallydried in a stream of hot air. An EG & G 273 potentiostat or anAutolab 302N was used for electrochemical experiments.
The electrochemistry of germanium deposition in [BMP][Tf2N]was studied by electrochemical quartz crystal microbalance(EQCM, Maxtek RS232/IEEE488). The mass change per unit area(Dm) on a platinum-coated 5 MHz quartz crystal was determinedby the Sauerbrey equation:
Df = �CfDm (1)
where Df is the frequency change; and Cf is the sensitivity factorof the crystal, which was calibrated as 6523 Hz g�1 m2 in[BMP][Tf2N] solutions. The calibration was done according tothe method described by Gabrielli et al.26 A solution of 50 mM[Ag(MeCN)4]2[Ag(Tf2N)3] in [BMP][Tf2N] was used for calibration,and deposition was done at a constant potential. The sensitivityfactor was calculated using the Sauerbrey equation by assumingthe current efficiency for silver deposition in this solution is100%. [Ag(MeCN)4]2[Ag(Tf2N)3] was chosen because it has highersolubility in [BMP][Tf2N] than AgNO3. It was prepared accordingto a literature procedure.27,28
The concentration of [BMP][Tf2N] containing GeCl4 wasdetermined using inductively coupled plasma optical emissionspectroscopy (ICP-OES, Varian 720-ES apparatus). Because[BMP][Tf2N] is immiscible with water, methanol was added tomake the ICP solutions. The morphology and elemental com-position of the films were determined by scanning electronmicroscopy (SEM) and energy-dispersive X-ray spectroscopy(EDX, Philips XL 30 FEG). X-ray diffraction (XRD, Seifert3003), transmission electron microscopy (TEM, FEI Tecnai G2F20) and electron backscatter diffraction (EBSD) were used tocharacterize the crystal structure of the deposits. TEM samplewas prepared with focused ion beam (FIB, FEI Helios). EBSDwas performed using a TSL-EDAX system on an FEI Nova 600NanoLab instrument. The cross-sections for EBSD measurementand SEM were prepared using a JEOL cross-section polisher.
Auger electron spectroscopy (AES) was used for analyzing thecarbon impurity in the germanium film. The Auger chamber(Thermo Scientific) was under ultrahigh vacuum (8.9� 10�9 Torr)and spectra were measured using a primary electron beam withan energy of 8 keV with a typical current of 10 nA and a Gaussianprofile with a radius of about 0.5 mm. Auger electrons weredetected with a hemispherical analyzer (Thermo Scientific) in
Fig. 1 Schematic drawing of the electrochemcial cell used for electro-chemical experiments at elevated temperatures.
Paper PCCP
Ope
n A
cces
s A
rtic
le. P
ublis
hed
on 1
0 A
pril
2015
. Dow
nloa
ded
on 2
/28/
2022
12:
45:3
4 A
M.
Thi
s ar
ticle
is li
cens
ed u
nder
a C
reat
ive
Com
mon
s A
ttrib
utio
n-N
onC
omm
erci
al 3
.0 U
npor
ted
Lic
ence
.View Article Online

12082 | Phys. Chem. Chem. Phys., 2015, 17, 12080--12089 This journal is© the Owner Societies 2015
an energy range from 100 eV up to 1500 eV. Depth profiling wasdone by sputtering with an argon ion beam for 5 min betweeneach AES measurement. The sputter beam current was approxi-mately 3 mA, and the beam size had a Gaussian profile with adiameter of approximately 1 mm and was scanned over an areaof 2 � 2 mm2. AES spectra was analyzed using Avantage DataSystem software (Thermo Scientific).
3 Results and discussion3.1 Electrodeposition of germanium using [GeCl4(BuIm)2]
In the authors’ previous experiments, uniform and porous germa-nium films could be electrodeposited from 0.1 M [GeCl4(BuIm)2]in [BMP][DCA] at room temperature.24 The deposition rate wascalculated from the mass change on a electrochemical quartzcrystal microbalance and it was 0.87 mm h�1. Efforts to increasethe deposition rate were made by increasing the [GeCl4(BuIm)2]concentration to 0.4 M in [BMP][DCA]. Unfortunately, due to thehigh viscosity of the solution, the deposition rate did not signifi-cantly increase.24 To increase the deposition rate, a [BMP][DCA]solution containing 0.4 M [GeCl4(BuIm)2] was heated to 120 1C.Germanium films were electrodeposited at different potentials.The film deposited at �1.6 V (vs. Pt) had an orange color andshowed many cracks on the surface (see ESI†). The EDX spectrumof the deposit showed the film also contains a considerableamount of oxygen. Due to the bad adhesion between the germa-nium film and platinum substrate, the germanium film pealed offduring ultrasonic cleaning. The theoretical deposition rate wascalculated from the applied charge based on Faraday’s law and itreached 2.0 mm h�1. This value is close to the germaniumdeposition rate reported in propylene glycol containing 5 vol%GeCl4 (B2.2 mm h�1).10 However, due to the polymerization ofdicyanamide anions, the solution darkened and became moreviscous during the electrodeposition process. Polymerization of[BMP][DCA] is caused, not only by applied electrical current, butalso by the high temperature.29,30 Fig. 2 shows the color of pure[BMP][DCA] after heating at 140 1C for different times. Thesolution turned darker at longer heating times, indicating thatthe polymerization took place during heating. The discolorationat elevated temperature is similar to the one due to the applied
electrical charge.24 The increase in viscosity due to the polymer-ization led to a decrease of the deposition rate. Because of the fastpolymerization [DCA]� ions, germanium films could not beobtained at temperatures higher than 140 1C from [BMP][DCA].
3.2 Electrodeposition of germanium using GeCl4
GeCl4 has a high solubility in [BMP][Tf2N]. A [BMP][Tf2N]solution containing 0.5 M was used for deposition of germa-nium. However, due to the low boiling temperature of GeCl4
(86.5 1C), the loss of GeCl4 in [BMP][Tf2N] at elevated tempera-tures is significant. The evaporation of GeCl4 even occurred atroom temperature as detected by ICP-OES. After exposing thesolution in argon atmosphere for 30 min, the concentration ofGeCl4 in [BMP][Tf2N] decreased to 0.37 M. The solution wasfurther heated at 150 1C for one hour, and then no germaniumtrace was found in the solution, which means all GeCl4 hasevaporated. To prevent the loss of germanium, a three-electrodepressure cell which could be totally sealed was designed andused for GeCl4 solutions in [BMP][Tf2N] at higher temperatures(Fig. 1). When the temperature increased, the evaporation ofGeCl4 leads to an increase in the pressure above the solution(autogenerated GeCl4 atmosphere), preventing the further lossof GeCl4. The pressure change with temperature can be calcu-lated from the Clapeyron equation:
lnP2
P1
� �¼ DHv
R
1
T1� 1
T2
� �(2)
where P is the pressure (Pa), DHv is the molar heat of evaporation( J mol�1), R is the gas constant (8.314 J K�1 mol�1), and T is thetemperature (K). The pressure calculated based on eqn (2) atdifferent temperatures is shown in Fig. 3. Laubengayer et al. showedthat the actual experimental pressures agreed with the calculated.31
At 150 1C, the pressure is expected to increase to about 4 bar.The viscosity and density of [BMP][Tf2N] change with tem-
perature. The density of [BMP][Tf2N] at different temperatureswas described in the literature.32,33 The kinematic viscosity (n)of pure [BMP][Tf2N] was measured at different temperaturesand was converted to dynamic viscosity (Fig. 4). The viscosity
Fig. 2 Color changes of pure [BMP][DCA] after heating at 140 1C fordifferent times: (a) 0 h, (b) 20 h, and (c) 72 h.
Fig. 3 Vapor pressure of GeCl4 as a function of temperature. The blackline was calculated based on eqn (2) and the circles are the experimentaldata from the literature.31
PCCP Paper
Ope
n A
cces
s A
rtic
le. P
ublis
hed
on 1
0 A
pril
2015
. Dow
nloa
ded
on 2
/28/
2022
12:
45:3
4 A
M.
Thi
s ar
ticle
is li
cens
ed u
nder
a C
reat
ive
Com
mon
s A
ttrib
utio
n-N
onC
omm
erci
al 3
.0 U
npor
ted
Lic
ence
.View Article Online

This journal is© the Owner Societies 2015 Phys. Chem. Chem. Phys., 2015, 17, 12080--12089 | 12083
non-linearly decreases with increasing temperatures. This non-linear effect can be described by the Tammann–Vogel–Fulcher(TVF) equation:
log Z = log Z0 � B/(T � T0) (3)
where Z is the dynamic viscosity (Pa s), T is temperature (K), Z0,B and T0 are adjustable parameters. Z0 is the viscosity at infinitetemperature, T0 is the temperature at which the viscosity becomeinfinite, and parameter B corresponds to the pseudo-activationenergy associated with viscous flow.34 The best fit for Z0, B and T0
are 1.24 � 10�5 Pa s, 25.1 K and 7.4 K, respectively. The decreasein viscosity of [BMP][Tf2N] at higher temperatures promotes thediffusion of GeCl4 which means that germanium can be electro-deposited at a high current density, but in order to reach thesehigher temperatures a pressurized cell must be used.
Fig. 5a shows the cyclic voltammograms of 0.5 M GeCl4 in[BMP][Tf2N] at room temperature. The cyclic voltammogramswere stopped at cathodic vertex potentials of �1.0 V, �1.2 V,�1.5 V, �1.7 V, �2.0 V and �2.5 V to study the reactionshappening at different potentials. There are two reductionpeaks on the cathodic scan and three oxidation waves on theanodic scan. The second oxidation peak a2 correlated to thefirst reduction peak r1 at �1.1 V. The peak current density ofa2 increased as more negative cathodic vertex potential wasapplied. The first reduction peak r1 is due to the reduction ofGe(IV) to Ge(II). This was further proven using potential scanexperiment: a constant potential of�1.0 V was applied until thecharge density reached 2 C dm�2. Ge(II) ions were formed at theworking electrode. Then the potential was scanned from �1.0 Vto +1.5 V after waiting at open circuit potential for differenttimes (0 s, 10 s, 30 s and 300 s). With longer waiting time, moreGe(II) ions diffused away from working electrode. The oxidationpeak a2 which was due to the oxidation of Ge(II) to Ge(IV)decreased as longer waiting times were applied (see ESI†).When an even more negative cathodic vertex potential wasapplied, the second oxidation peak a2 decreased, less Ge(II)was in the solution because at the second reduction peak r2Ge(II) was further reduced to Ge(0). The oxidation peak a3corresponds to the oxidation of chloride ions to chlorine gas
(E0Cl2=Cl�
¼ þ1:36V vs. SHE). Chloride ions are present in
solution after reduction of GeCl4 to Ge(0). The oxidationpotential of chloride ions was determined using a [BMP][Tf2N]solution containing 0.4 M [BMP]Cl. Fig. 6 shows the linear
Fig. 4 Tammann–Vogel–Fulcher fitting of viscosity change of ionic liquid[BMP][Tf2N] with temperature.
Fig. 5 Cyclic voltammograms of 0.5 M GeCl4 in [BMP][Tf2N] at (a) roomtemperature and (b) 150 1C. At room temperature, the cyclic voltammetrystopped at different cathodic vertex potentials of �1.0 V, �1.2 V, �1.5 V,�2.0 V and �2.5 V. The working electrode was a platinum disk (f = 1 mm)and the counter electrode was a p-type germanium wafer. The scan ratewas 50 mV s�1.
Fig. 6 Linear sweep voltammograms of 0.4 M [BMP]Cl in [BMP][Tf2N](solid line) and pure [BMP][Tf2N] (dotted line) at room temperature. Theworking electrode was a platinum disk (f = 1 mm), the counter electrodeswas a platinum coil. The scan rate was 50 mV s�1.
Paper PCCP
Ope
n A
cces
s A
rtic
le. P
ublis
hed
on 1
0 A
pril
2015
. Dow
nloa
ded
on 2
/28/
2022
12:
45:3
4 A
M.
Thi
s ar
ticle
is li
cens
ed u
nder
a C
reat
ive
Com
mon
s A
ttrib
utio
n-N
onC
omm
erci
al 3
.0 U
npor
ted
Lic
ence
.View Article Online

12084 | Phys. Chem. Chem. Phys., 2015, 17, 12080--12089 This journal is© the Owner Societies 2015
sweep voltammograms of 0.4 M [BMP]Cl in [BMP][Tf2N]. Anoxidation peak could be observed at +1.07 V which was due tothe oxidation of chloride ions to chlorine gas. This peak is notpresent in pure [BMP][Tf2N]. The first oxidation peak a1 appearedonly when the cathodic potential was scanned to the secondreduction peak r2, indicating a1 was due to the stripping of Ge(0).
When the cell was immersed in the heating bath to 150 1Csome gas bubbles were formed in the solution due to the highvolatility of the GeCl4. The formation of gas bubbles stoppedwhen the final temperature was reached. The cyclic voltammo-gram of 0.5 M GeCl4 in [BMP][Tf2N] at 150 1C is quite similar tothe cyclic voltammogram at room temperature (Fig. 5b). Thereare two reduction peaks on the cathodic scan. The first one at�1.25 V is due to the reduction of Ge(IV) to Ge(II), and thesecond reduction peak at �2.1 V corresponds to the depositionof Ge(0). The peak current density is �4.2 A dm�2 compared to�1.3 A dm�2 at room temperature. The increase in the currentdensity is due to the reduction of the viscosity at elevatedtemperatures. The decrease in viscosity leads to an increasein diffusion coefficient of Ge(IV) ions in [BMP][Tf2N]. Thediffusion coefficient of Ge(IV) was calculated based on thefollowing equations:35
jp ¼ 0:496nFcanaFvDRT
� �12
(4)
Ep � Ep=2 ¼ �47:7
anamV (5)
where F is the Faraday constant, jp is peak current density(A m�2), n is the total number of electrons involved in theoverall process, na is number of electrons involved in the ratedetermine step reaction, a is the charge transfer coefficient, c isthe concentration (mol m�3), v is the scan rate (V s�1), D is thediffusion coefficient (m2 s�1), Ep is the peak potential, and Ep/2
is the half peak potential. Cyclic voltammetry was performed inthe potential range of the first reduction peak where Ge(IV) isreduced to Ge(II) with different scan rates and the peak currentdensity was plotted versus the square root of the scan rate v(Fig. 7). The diffusion coefficient of Ge(IV) in [BMP][Tf2N] atroom temperature (22 1C) and 150 1C are 9.0 � 10�12 m2 s�1
and 1.9� 10�10 m2 s�1, respectively, meaning that the diffusioncoefficient at 150 1C is 22 times larger than that at roomtemperature. This is in close correspondence to the Stokes–Einstein relation:
D ¼ kBT
6pZr(6)
where kB is Boltzmann’s constant, Z is the dynamic viscosity(Pa s), and r is the hydrodynamic radius (m) of the diffusingspecies. The dynamic viscosity of the ionic liquid [BMP][Tf2N]at room temperature is 18 times larger than that at 150 1C (seeESI†), and the diffusion coefficient is 26 times higher at 150 1Cthan that at room temperature.
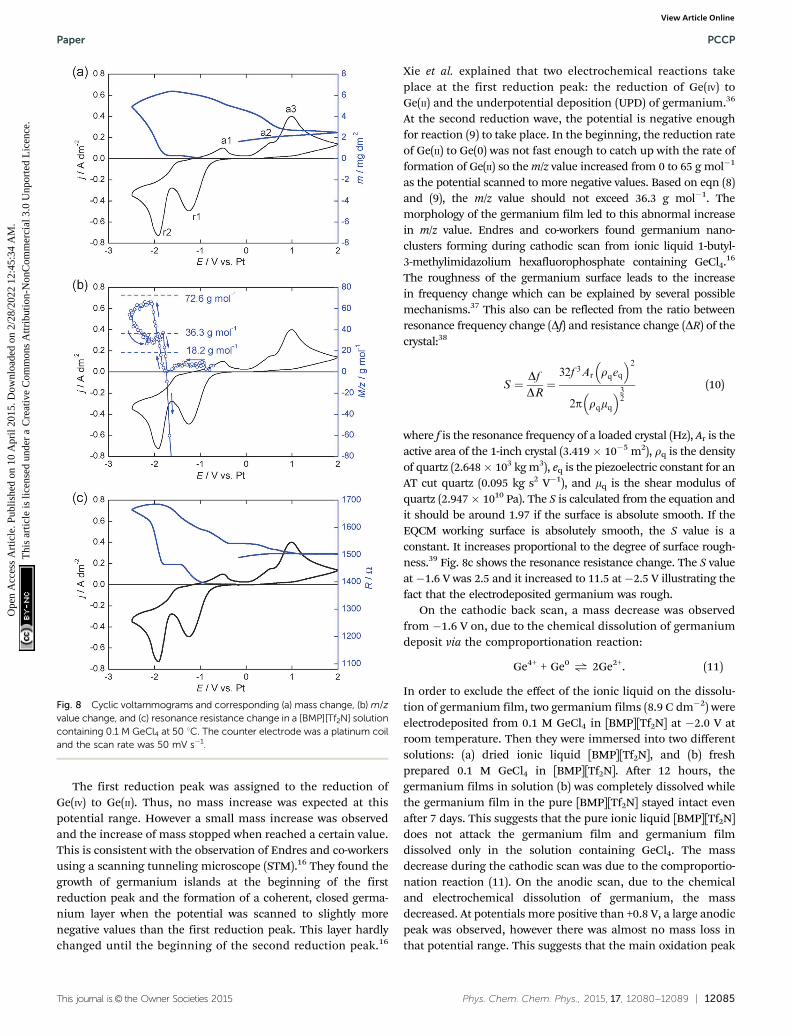
The electrochemical behavior of [BMP][Tf2N] solution con-taining GeCl4 was further studied using electrochemical quartzcrystal microbalance (EQCM). As shown in Fig. 8a, a cyclic
voltammogram was recorded on a platinum-coated EQCMcrystal working electrode, and the corresponding frequencychange was simultaneously recorded by EQCM. Based on thefrequency change, the mass change on the crystal was calcu-lated from the Sauerbrey equation. The m/z value was calcu-lated at different potential ranges (Fig. 8b) and it varies fordifferent reactions:
Ge4+ + 2e� - Ge2+ m/z = 0 (7)
Ge4+ + 4e� - Ge0 m/z = 18.2 g mol�1 (8)
Ge2+ + 2e� - Ge0 m/z = 36.3 g mol�1 (9)
Fig. 7 Cyclic voltammograms of 0.5 M GeCl4 in [BMP][Tf2N] with differentscan rates at (a) room temperature and (b) 150 1C, and (c) the plot ofcurrent density versus the square root of the scan rate v.
PCCP Paper
Ope
n A
cces
s A
rtic
le. P
ublis
hed
on 1
0 A
pril
2015
. Dow
nloa
ded
on 2
/28/
2022
12:
45:3
4 A
M.
Thi
s ar
ticle
is li
cens
ed u
nder
a C
reat
ive
Com
mon
s A
ttrib
utio
n-N
onC
omm
erci
al 3
.0 U
npor
ted
Lic
ence
.View Article Online
This journal is© the Owner Societies 2015 Phys. Chem. Chem. Phys., 2015, 17, 12080--12089 | 12085
The first reduction peak was assigned to the reduction ofGe(IV) to Ge(II). Thus, no mass increase was expected at thispotential range. However a small mass increase was observedand the increase of mass stopped when reached a certain value.This is consistent with the observation of Endres and co-workersusing a scanning tunneling microscope (STM).16 They found thegrowth of germanium islands at the beginning of the firstreduction peak and the formation of a coherent, closed germa-nium layer when the potential was scanned to slightly morenegative values than the first reduction peak. This layer hardlychanged until the beginning of the second reduction peak.16
Xie et al. explained that two electrochemical reactions takeplace at the first reduction peak: the reduction of Ge(IV) toGe(II) and the underpotential deposition (UPD) of germanium.36
At the second reduction wave, the potential is negative enoughfor reaction (9) to take place. In the beginning, the reduction rateof Ge(II) to Ge(0) was not fast enough to catch up with the rate offormation of Ge(II) so the m/z value increased from 0 to 65 g mol�1
as the potential scanned to more negative values. Based on eqn (8)and (9), the m/z value should not exceed 36.3 g mol�1. Themorphology of the germanium film led to this abnormal increasein m/z value. Endres and co-workers found germanium nano-clusters forming during cathodic scan from ionic liquid 1-butyl-3-methylimidazolium hexafluorophosphate containing GeCl4.16
The roughness of the germanium surface leads to the increasein frequency change which can be explained by several possiblemechanisms.37 This also can be reflected from the ratio betweenresonance frequency change (Df) and resistance change (DR) of thecrystal:38
S ¼ DfDR¼
32f 3Ar rqeq� �2
2p rqmq� �3
2
(10)
where f is the resonance frequency of a loaded crystal (Hz), Ar is theactive area of the 1-inch crystal (3.419� 10�5 m2), rq is the densityof quartz (2.648� 103 kg m3), eq is the piezoelectric constant for anAT cut quartz (0.095 kg s2 V�1), and mq is the shear modulus ofquartz (2.947� 1010 Pa). The S is calculated from the equation andit should be around 1.97 if the surface is absolute smooth. If theEQCM working surface is absolutely smooth, the S value is aconstant. It increases proportional to the degree of surface rough-ness.39 Fig. 8c shows the resonance resistance change. The S valueat�1.6 V was 2.5 and it increased to 11.5 at�2.5 V illustrating thefact that the electrodeposited germanium was rough.
On the cathodic back scan, a mass decrease was observedfrom �1.6 V on, due to the chemical dissolution of germaniumdeposit via the comproportionation reaction:
Ge4+ + Ge0 " 2Ge2+. (11)
In order to exclude the effect of the ionic liquid on the dissolu-tion of germanium film, two germanium films (8.9 C dm�2) wereelectrodeposited from 0.1 M GeCl4 in [BMP][Tf2N] at �2.0 V atroom temperature. Then they were immersed into two differentsolutions: (a) dried ionic liquid [BMP][Tf2N], and (b) freshprepared 0.1 M GeCl4 in [BMP][Tf2N]. After 12 hours, thegermanium films in solution (b) was completely dissolved whilethe germanium film in the pure [BMP][Tf2N] stayed intact evenafter 7 days. This suggests that the pure ionic liquid [BMP][Tf2N]does not attack the germanium film and germanium filmdissolved only in the solution containing GeCl4. The massdecrease during the cathodic scan was due to the comproportio-nation reaction (11). On the anodic scan, due to the chemicaland electrochemical dissolution of germanium, the massdecreased. At potentials more positive than +0.8 V, a large anodicpeak was observed, however there was almost no mass loss inthat potential range. This suggests that the main oxidation peak
Fig. 8 Cyclic voltammograms and corresponding (a) mass change, (b) m/zvalue change, and (c) resonance resistance change in a [BMP][Tf2N] solutioncontaining 0.1 M GeCl4 at 50 1C. The counter electrode was a platinum coiland the scan rate was 50 mV s�1.
Paper PCCP
Ope
n A
cces
s A
rtic
le. P
ublis
hed
on 1
0 A
pril
2015
. Dow
nloa
ded
on 2
/28/
2022
12:
45:3
4 A
M.
Thi
s ar
ticle
is li
cens
ed u
nder
a C
reat
ive
Com
mon
s A
ttrib
utio
n-N
onC
omm
erci
al 3
.0 U
npor
ted
Lic
ence
.View Article Online

12086 | Phys. Chem. Chem. Phys., 2015, 17, 12080--12089 This journal is© the Owner Societies 2015
does not correspond to the dissolution of germanium. Thisoxidation peak corresponded to the oxidation of chloride ions.
The rotating-ring disk electrode experiments provide clearevidence of the formation of Ge(II) at the first reduction peak.A cyclic voltammogram was performed on the disk and aconstant potential of +1.3 V was applied on the ring (Fig. 9).At the first reduction plateau r01, Ge(IV) was reduced to Ge(II)and then the Ge(II) convected to the ring and this Ge(II) wasoxidized back to Ge(IV) on the ring. Thus, a correspondingcurrent a01 was observed on the ring. At the second reductionwave r02, Ge(II) was reduced to Ge(0), and no oxidation currentis expected on the ring. However, an anodic current a02 wasobserved. This is because chloride ions are liberated from thegermanium complex when Ge(II) is reduced to Ge(0). Thechloride ions were convected to the ring and were oxidized tochlorine gas. The formation of germanium on the disk ledto the passivation of the electrode, and as a result, the diskcurrent decreased. At the third reduction plateau r03, Ge(IV) wasreduced to Ge(II) which is the same reaction on r01, but the
current is much lower. In order to prevent the oxidation ofchloride ions on the ring, the ring potential was changed to+0.65 V where Ge(II) can be oxidized to Ge(IV) but not positiveenough for oxidizing chloride ions. The result is shown inFig. 10. At the first reduction peak, a ring current was observed.The ring current was lower than the limiting current due to theapplied potential was not positive enough. At the secondreduction peak, the ring current dropped to zero.
Germanium films were electrodeposited from [BMP][Tf2N]solutions at elevated temperatures in order to investigate theirmorphologies. Fig. 11a shows the SEM pictures of the germaniumfilm electrodeposited at 150 1C. The film was electrodeposited at�1.2 V with an average current density of �0.35 A dm�2, and thetheoretical thickness calculated from the charge was 4.8 mm. Thegermanium film had a very flat and uniform morphology, butthere were a few cracks on the macroscale (see ESI†). In the EDXspectrum, a very small oxygen peak was observed which was dueto the oxidation of germanium in the air. A chlorine peak was alsofound in the EDX. Endres and co-workers attributed the presenceof chlorine to GeCl3 termination of the deposit-electrolyte inter-face.18 Fig. 11c shows SEM picture of the germanium filmelectrodeposited at �0.9 V at 180 1C. The EDX spectrum for thisfilm shows a very small oxygen peak and barely a chlorine peak.The film deposited at 180 1C had a grey but shiny metallicappearance, and no cracks were found in the film (see ESI†).The average current density was�0.46 A dm�2 and the theoreticalthickness was 5.8 mm. Increasing the deposition temperature, notonly increased the deposition rate, but also prevented the formationof cracks in the dense films. Dissolution of the p-type germaniumanode was observed during electrodeposition. The surface of the
Fig. 9 Rotating ring-disk electrode result from 0.5 M GeCl4 in [BMP][Tf2N]at room temperature: a cyclic voltammogram was applied on the disk at ascan rate of 2 mV s�1 and a ring potential of +1.3 V was applied. Therotation speed was 500 rpm.
Fig. 10 Rotating ring-disk electrode result from 0.5 M GeCl4 in [BMP][Tf2N]at room temperature: a cyclic voltammogram was applied on the disk at ascan rate of 2 mV s�1 and a ring potential of +0.65 V was applied. Therotation speed was 500 rpm.
Fig. 11 SEM images of electrodeposited germanium films. The germa-nium films were electrodeposited from [BMP][Tf2N] solution containing0.5 M GeCl4 at different potentials and temperatures: (a) �1.2 V at 150 1Cand (b) �0.9 V at 180 1C for one hour. The counter electrode was a p-typegermanium wafer. The solution was stirred by a magnetic stir bar.
PCCP Paper
Ope
n A
cces
s A
rtic
le. P
ublis
hed
on 1
0 A
pril
2015
. Dow
nloa
ded
on 2
/28/
2022
12:
45:3
4 A
M.
Thi
s ar
ticle
is li
cens
ed u
nder
a C
reat
ive
Com
mon
s A
ttrib
utio
n-N
onC
omm
erci
al 3
.0 U
npor
ted
Lic
ence
.View Article Online

This journal is© the Owner Societies 2015 Phys. Chem. Chem. Phys., 2015, 17, 12080--12089 | 12087
germanium wafer became rough. The color of the solution did notchange after electrodeposition.
The electrodeposited germanium film was removed fromthe substrate using resin and analyzed by XRD. No diffractionpeaks were observed for the germanium film which indicatesthat the electrodeposited germanium on platinum was amorphous.Germanium was also electrodeposited on a copper substrate,however, XRD diffraction peaks for Cu3Ge alloy were observed.This suggests that electrodeposited germanium formed an alloywith the copper substrate (Fig. 12).
Maldonado and co-workers were the first to report the epitaxialelectrodeposition of germanium nanowires from an aqueoussolution, and their work required the formation of galliumnanodroplets.40 In principle, at elevated temperature, due tothe increase of the adatom mobility epitaxial growth of germa-nium on germanium substrate can be achieved if the surface ofthe germanium substrate is free of contaminations like oxides,grease, etc. The n-type germanium(100) substrates were rinsedwith deionized water before using to remove most of the nativeoxides on the surface. Also, thanks to the comproportionationreaction (11), germanium substrates should be ‘‘self-cleaned’’in the [BMP][Tf2N] solution containing GeCl4. This was sup-posed to prevent the existence of a native oxide layer betweenthe germanium wafer and the electrolyte. However, the trans-mission electron microscopy (TEM) picture of the cross-sectionof the germanium layer deposited on germanium substrateshows the interface was not clean (Fig. 13). The electrondiffraction patterns indicates that the deposited germaniumfilm was amorphous whereas the substrate was single crystal-line. In order to eliminate oxygen from the germanium sub-strates, a positive potential of +1.0 V was applied for differenttimes (3 s, 10 s, 15 s and 20 s) before deposition to dissolvetop layer of germanium. The films were characterized by theelectron backscatter diffraction (EBSD). Kikuchi pattern ofgermanium was always found on the substrates, but the electro-deposited films did not give rise to any Kikuchi diffractionpatterns. Epitaxial growth of germanium was not successful
even with the pre-dissolution of germanium wafer beforedeposition.
Fig. 14 shows the SEM image of the cross-section of a thickgermanium film (75 mm thick) electrodeposited on germanium.The film was very dense but partially delaminated fromthe substrate. The deposition rate reached about 6.0 mm h�1.The energy-dispersive X-ray spectroscopy (EDS) illustrates thepresence of chlorine as well as oxygen and carbon impurities.The purity of the germanium film was further analyzed usingAuger electron spectroscopy (AES) (Fig. 15). Without etching,carbon and oxygen were detected on the surface of the electro-deposited germanium and the germanium peaks were almostinvisible which means the germanium surface was covered witha contamination layer. After the first etching cycle, the oxygenand carbon peaks reduced and germanium peaks can be clearlyobserved. However a small peak at about 184 eV appearedwhich is associated with chlorine. Carbon and oxygen peakswere vanished after four etching cycles, but the chlorine peakwas still there. The concentration of chlorine in germanium is
Fig. 12 XRD pattern of the germanium film deposited on copper sub-strate from 0.5 M GeCl4 in [BMP][Tf2N] at 150 1C. The deposition potentialwas �1.5 V vs. Pt. The counter electrode was a p-type germanium wafer.The peaks labeled as ‘‘sub’’ came from the the XRD pattern originated fromthe sample holder.
Fig. 13 TEM image and electron diffraction patterns of the cross-sectionof the germanium film electrodeposited on an n-type germanium sub-strate. The film was deposited from 0.5 M GeCl4 in [BMP][Tf2N] at 180 1C at�0.9 V vs. Pt. The solution was stirred by a magnetic stir bar.
Fig. 14 SEM image of the cross-section of the germanium film electro-deposited on an n-type germanium substrate. The film was depositedfrom 0.5 M GeCl4 in [BMP][Tf2N] at 180 1C at �0.9 V vs. Pt for 12.4 h. Thesolution was stirred by a magnetic stir bar.
Paper PCCP
Ope
n A
cces
s A
rtic
le. P
ublis
hed
on 1
0 A
pril
2015
. Dow
nloa
ded
on 2
/28/
2022
12:
45:3
4 A
M.
Thi
s ar
ticle
is li
cens
ed u
nder
a C
reat
ive
Com
mon
s A
ttrib
utio
n-N
onC
omm
erci
al 3
.0 U
npor
ted
Lic
ence
.View Article Online

12088 | Phys. Chem. Chem. Phys., 2015, 17, 12080--12089 This journal is© the Owner Societies 2015
difficult to quantify due to the low signal intensity and thus alow signal-to-noise ratio, therefore no proper peak fitting couldbe obtained. The presence of those impurities in the film canbe another reason for the absence of epitaxial growth.
4 Conclusions
The electrodeposition of germanium from GeCl4 in the ionicliquid 1-butyl-1-methylpyrrolidinium bis(trifluoromethylsulfonyl)-imide has been studied in a pressure cell at elevated temperaturesup to 180 1C. The viscosity of the solution decreased from 69.7 �10�3 Pa s at room temperature to 3.8 � 10�3 Pa s at 150 1C. Thediffusion coefficient of germanium increased to 1.9� 10�10 m2 s�1
at 150 1C. High deposition rates up to 6.0 mm h�1 could beobtained. The germanium films obtained at elevated temperatureshad a grey or silver shiny metallic color. The germanium depositedon both platinum and n-type germanium substrates was amor-phous. Orange germanium films were also obtained from 1-butyl-1-methylpyrrolidinium dicyanamide containing [GeCl4(BuIm)2] at120 1C. The deposition rate reached 2.0 mm h�1. Due to the fastpolymerization of dicyanamide anions at elevated temperatures,germanium films could not be obtained in this ionic liquid attemperatures higher than 140 1C.
Acknowledgements
The authors acknowledge financial support from the IWT (SBOproject ‘‘Material processing in ionic liquids’’, MAPIL) and theFWO-Flanders (Research community ‘‘Ionic liquids’’, andresearch project G0B9613N). Support by IoLiTec (Heilbronn,Germany) is gratefully acknowledged. The authors thankUmicore (Olen, Belgium) for a generous gift of germanium(IV)chloride. The authors also acknowledge Prof. Philippe Vereeckenfor his help with the rotating ring-disk electrode experiment,and Prof. Marc Heyns for providing the germanium wafers andProf. Bert Verlinden, Tom Van der Donck, Dr Xiebin Wang,I. R. Ling Qin and I. R. Chen Li for their help with EBSD, and
Prof. Jean-Pierre Locquet and Dr Bastiaan Opperdoes for the AESmeasurement, and MA-tek for their help with TEM measurement.
References
1 N. Chandrasekharan and S. C. Sevov, J. Electrochem. Soc.,2010, 157, C140–C145.
2 J. Gu, E. Fahrenkrug and S. Maldonado, J. Am. Chem. Soc.,2013, 135, 1684–1687.
3 J. Ke, P. N. Bartlett, D. Cook, T. L. Easun, M. W. George,W. Levason, G. Reid, D. Smith, W. Su and W. Zhang, Phys.Chem. Chem. Phys., 2012, 14, 1517–1528.
4 X. Meng, R. Al-Salman, J. Zhao, N. Borissenko, Y. Li andF. Endres, Angew. Chem., Int. Ed., 2009, 48, 2703–2707.
5 X. Liang, Y.-G. Kim, D. K. Gebergziabiher and J. L. Stickney,Langmuir, 2010, 26, 2877–2884.
6 M. J. Jawad, M. R. Hashim, N. K. Ali, E. P. Corcoles andM. E. Sharifabad, J. Electrochem. Soc., 2012, 159, D124–D128.
7 A. I. Carim, S. M. Collins, J. M. Foley and S. Maldonado,J. Am. Chem. Soc., 2011, 133, 13292–13295.
8 C. G. Fink and V. M. Dokras, J. Electrochem. Soc., 1949, 95,80–97.
9 G. Szekely, J. Electrochem. Soc., 1951, 98, 318–324.10 M. Saitou, K. Sakae and W. Oshikawa, Surf. Coat. Technol.,
2002, 162, 101–105.11 H. Ohno, Electrochemical aspects of ionic liquids, John Wiley
& Sons, Inc., Hoboken, New Jersey, 2005.12 M. Armand, F. Endres, D. R. MacFarlane, H. Ohno and
B. Scrosati, Nat. Mater., 2009, 8, 621–629.13 N. V. Plechkova and K. R. Seddon, Chem. Soc. Rev., 2008, 37,
123–150.14 F. Endres, D. MacFarlane and A. Abbott, Electrodeposition
from ionic liquids, Wiley-VCH, Weinheim, 2008.15 F. Endres, Phys. Chem. Chem. Phys., 2001, 3, 3165–3174.16 F. Endres and S. Zein El Abedin, Phys. Chem. Chem. Phys.,
2002, 4, 1649–1657.17 F. Endres and S. Zein El Abedin, Phys. Chem. Chem. Phys.,
2002, 4, 1640–1648.18 F. Endres, Electrochem. Solid-State Lett., 2002, 5, C38–C40.19 I. Mukhopadhyay and W. Freyland, Chem. Phys. Lett., 2003,
377, 223–228.20 F. Martineau, K. Namur, J. Mallet, F. Delavoie, F. Endres,
M. Troyon and M. Molinari, Mater. Sci. Eng., 2009, 6, 012012.21 R. Al-Salman, S. Zein El Abedin and F. Endres, Phys. Chem.
Chem. Phys., 2008, 10, 4650–4657.22 W. Xin, J. Zhao, D. Ge, Y. Ding, Y. Li and F. Endres, Phys.
Chem. Chem. Phys., 2013, 48, 2421–2426.23 R. W. Chia, C. C. Wang and J. J. Lee, J. Magn. Magn. Mater.,
2000, 209, 45–49.24 M. Wu, N. R. Brooks, S. Schaltin, K. Binnemans and
J. Fransaer, Phys. Chem. Chem. Phys., 2013, 15, 4955–4964.25 R. E. Hummel, Electronic Properties of Materials, Springer
Verlag, Berlin, 2011.26 C. Gabrielli, M. Keddam and R. Torresi, J. Electrochem. Soc.,
1991, 138, 2657–2660.
Fig. 15 Auger electron spectra of the germanium film deposited on an n-type germanium substrate from 0.5 M GeCl4 in [BMP][Tf2N] at 180 1C at�0.9 V vs. Pt.
PCCP Paper
Ope
n A
cces
s A
rtic
le. P
ublis
hed
on 1
0 A
pril
2015
. Dow
nloa
ded
on 2
/28/
2022
12:
45:3
4 A
M.
Thi
s ar
ticle
is li
cens
ed u
nder
a C
reat
ive
Com
mon
s A
ttrib
utio
n-N
onC
omm
erci
al 3
.0 U
npor
ted
Lic
ence
.View Article Online

This journal is© the Owner Societies 2015 Phys. Chem. Chem. Phys., 2015, 17, 12080--12089 | 12089
27 N. R. Brooks, S. Schaltin, K. Van Hecke, L. Van Meervelt,J. Fransaer and K. Binnemans, Dalton Trans., 2012, 41, 6902–6905.
28 S. Schaltin, L. D’Urzo, Q. Zhao, A. Vantomme, H. Plank,G. Kothleitner, C. Gspan, K. Binnemans and J. Fransaer,Phys. Chem. Chem. Phys., 2012, 14, 13624–13629.
29 T. Romann, O. Oll, P. Pikma, K. Kirsimae and E. Lust,J. Power Sources, 2015, 280, 606–611.
30 O.-H. Kim, Y.-H. Cho, D. Y. Chung, M. J. Kim, J. M. Yoo,J. E. Park, H. Choe and Y.-E. Sung, Sci. Rep., 2015, 5, 8376.
31 A. W. Laubengayer and D. L. Tabern, J. Phys. Chem., 1926,30, 1047–1048.
32 M. Vranes, S. Dozic, V. Djeric and S. Gadzuric, J. Chem. Eng.Data, 2012, 57, 1072–1077.
33 M. Geppert-Rybczynska, A. Knorr, J. K. Lehmann andA. Heintz, J. Chem. Eng. Data, 2012, 57, 1923–1927.
34 J. Russell, D. Giordano and D. Dingwell, Am. Mineral., 2003,88, 1390–1394.
35 M. Noel and K. I. Vasu, Cyclic Voltammetry and the Frontiersof Electrochemistry, Oxford & IBH Publishing Company,1990.
36 X.-F. Xie, J.-W. Yan, J.-H. Liang, J.-J. Li, M. Zhang and B.-W.Mao, J. Electrochem., 2014, 20, 12–16.
37 L. Daikhin, E. Gileadi, G. Katz, V. Tsionsky, M. Urbakh andD. Zagidulin, Anal. Chem., 2002, 74, 554–561.
38 MAXTEK, INC. Operation and service manual-RQCMresearch quartz Crystal microbalance.
39 N.-J. Cho, J. N. D’Amour, J. Stalgren, W. Knoll, K. Kanazawaand C. W. Frank, J. Colloid Interface Sci., 2007, 315, 248–254.
40 E. Fahrenkrug, J. Gu, S. Jeon, P. A. Veneman, R. S. Goldmanand S. Maldonado, Nano Lett., 2014, 14, 847–852.
Paper PCCP
Ope
n A
cces
s A
rtic
le. P
ublis
hed
on 1
0 A
pril
2015
. Dow
nloa
ded
on 2
/28/
2022
12:
45:3
4 A
M.
Thi
s ar
ticle
is li
cens
ed u
nder
a C
reat
ive
Com
mon
s A
ttrib
utio
n-N
onC
omm
erci
al 3
.0 U
npor
ted
Lic
ence
.View Article Online