electrode architecture-assembly of battery … 8-12, 2015, arlington, virginia electrode...
TRANSCRIPT

June 8-12, 2015, Arlington, Virginia
Electrode Architecture-Assembly of Battery Materials and Electrodes
2015 Annual Merit Review and Peer Evaluation Meetings
Project ID: ES222
Karim Zaghib
This presentation does not contain any proprietary or confidential information
Overview
2
Timeline • Start date: October 2012 • End date: September 2016 • 68% completed
Budget • Total project funding: $1460K • FY13 funding: $365K • FY14 funding: $365K • FY15 funding: $365K • FY16 funding: $365K
Barriers • Low energy • Poor cycle/calendar life
Partners • LBNL (L. Gao, V. Battaglia) • PNNL (J. Zhang, C. Wang) • UT (J. Goodenough)

Objectives
3
Develop high-capacity, low-cost electrodes with good cycle stability and rate capability.
Identify a method to produce new sources of Si.
Understand the mechanism of electrode degradation by using in-situ tools to improve the electrode composition and architecture.

Approach
4
Design of electrode architectures by controlling tortuosity and porosity to achieve high ionic/electronic conductivity.
Identify a method to produce new sources of Si.
Utilize in-situ and ex-situ SEM and TEM to investigate the failure mode and SEI layer on the anode and cathode.

Milestones
5
Completed: Production of Si nanopowder : capacity fade < 20% @100 cycles
In-situ TEM analysis for Si nanopowder
Deliverables :
• Si powder to LBNL (1kg), Stanford Univ.(1kg), Penn State Univ. (0.5kg)
• Electrode : Si (Jun-2014, Sep-2014, Dec-2014), HV LMN (Sep-2014), HE NCM
(Dec-2014), NCM-LMO (Dec-2014), Gr (Dec-2014)
• Electrolyte : Sep-2014, Dec-2014
• Cell : 20 Ah cells (ver.1 _Sep-2014), 60 Ah cells – 250 Wh/kg (ver.2_Dec-2014)
On going: Optimize particle size (200 ~ 50 nm) and process conditions of Si-nano-powder.
Study the effect of precursors : Si, SiH4, SiOx, Si-SiOx
Continue to study SEI passivation, fracture of electrode and particles by in-situ SEM,
TEM, dual-beam microscope.
Increase the energy density to meet the requirement of the BMR program
Increase the loading of Si electrode : development of binder and electrode architecture
Characterize the gas generation in slurry and cell.
Si Production – Metallurgical Process
6
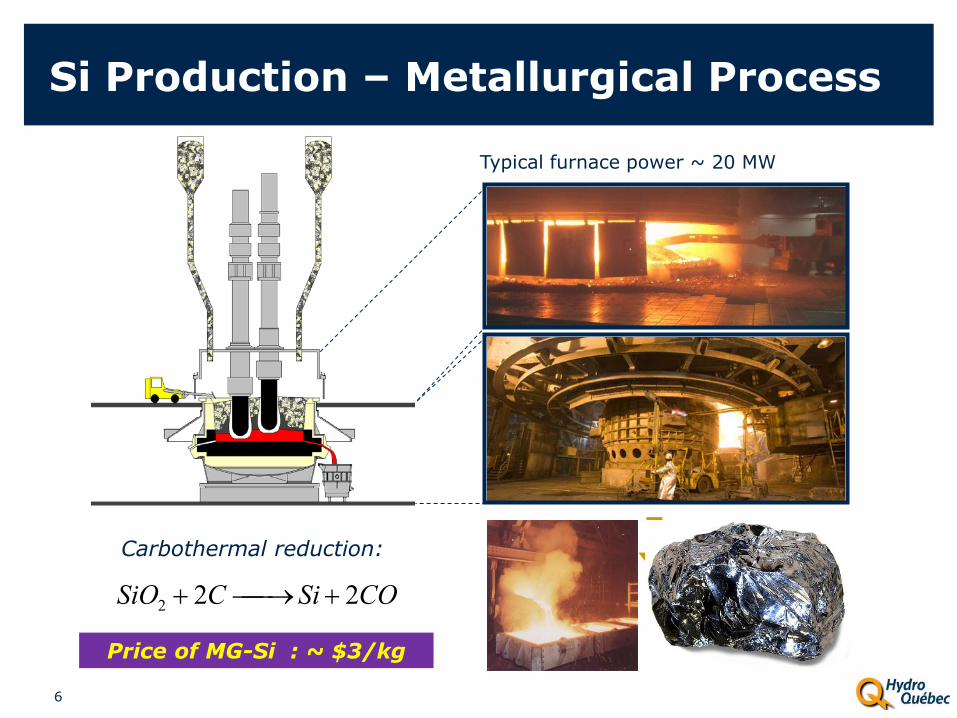
Typical furnace power ~ 20 MW
COSiCSiO 222 +→+
Carbothermal reduction:
Price of MG-Si : ~ $3/kg

Si nano powder- 1. Metallurgical Process
7
Large Si chunk
Jaw crusher d50 < 13 mm
Roll crusher d50 < 1 mm
Jet mill d50 < 10 µm
Wet mill d50 < 1 µm
Low process cost
Jet mill < $1/kg
Wet mill < $3~4/kg
Jet Mill_Particle Size Distribution
8
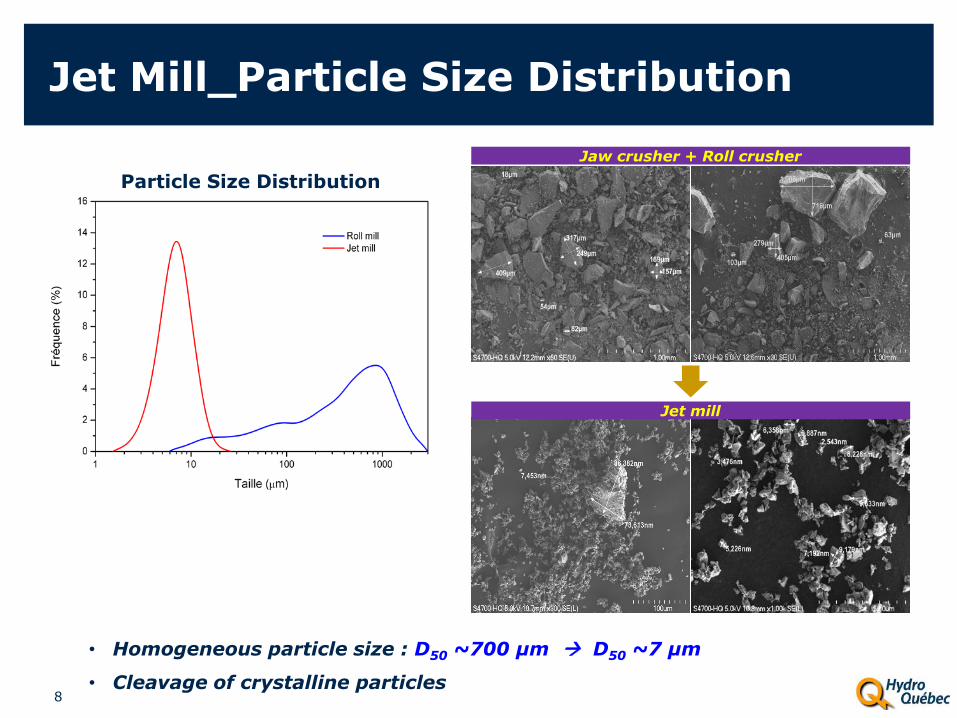
Particle Size Distribution
• Homogeneous particle size : D50 ~700 µm D50 ~7 µm
• Cleavage of crystalline particles
Jaw crusher + Roll crusher
Jet mill

Jet Mill_Chemical Analysis
9
Large Chunk After Jet Mill
• Oxygen content increases from 0.049% to 0.84% due to the higher
surface area (formation of surface oxide).
Element Large Chunks After Jet mill
(%) (%)
B 0.0030 0.00029
Mg 0.0004 0.0004
Al 0.057 0.075
P 0.0034 0.0034
Ca 0.022 0.023
Ti 0.069 0.077
V 0.0019 0.0021
Cr 0.0012 0.0023
Mn 0.015 0.017
Fe 0.31 0.35
Ni 0.0015 0.0022
Cu 0.0018 0.0018
Zn 0.0006 0.0004
Zr 0.016 0.0180
C 0.011 0.015
O 0.049 0.84
Jet Mill_Electrochemical Performance
10
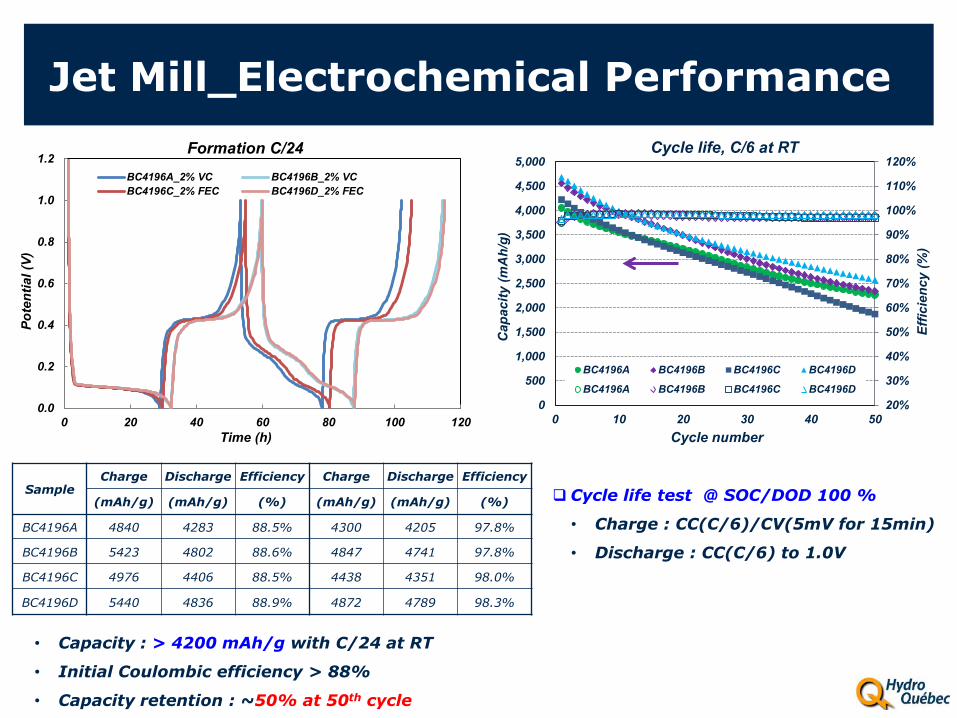
Sample Charge Discharge Efficiency Charge Discharge Efficiency
(mAh/g) (mAh/g) (%) (mAh/g) (mAh/g) (%)
BC4196A 4840 4283 88.5% 4300 4205 97.8%
BC4196B 5423 4802 88.6% 4847 4741 97.8%
BC4196C 4976 4406 88.5% 4438 4351 98.0%
BC4196D 5440 4836 88.9% 4872 4789 98.3%
20%
30%
40%
50%
60%
70%
80%
90%
100%
110%
120%
0
500
1,000
1,500
2,000
2,500
3,000
3,500
4,000
4,500
5,000
0 10 20 30 40 50
Effic
ienc
y (%
)
Cap
acity
(mA
h/g)
Cycle number
Cycle life, C/6 at RT
BC4196A BC4196B BC4196C BC4196D
BC4196A BC4196B BC4196C BC4196D
0.0
0.2
0.4
0.6
0.8
1.0
1.2
0 20 40 60 80 100 120
Pote
ntia
l (V)
Time (h)
Formation C/24 BC4196A_2% VC BC4196B_2% VCBC4196C_2% FEC BC4196D_2% FEC
Cycle life test @ SOC/DOD 100 %
• Charge : CC(C/6)/CV(5mV for 15min)
• Discharge : CC(C/6) to 1.0V
• Capacity : > 4200 mAh/g with C/24 at RT
• Initial Coulombic efficiency > 88%
• Capacity retention : ~50% at 50th cycle
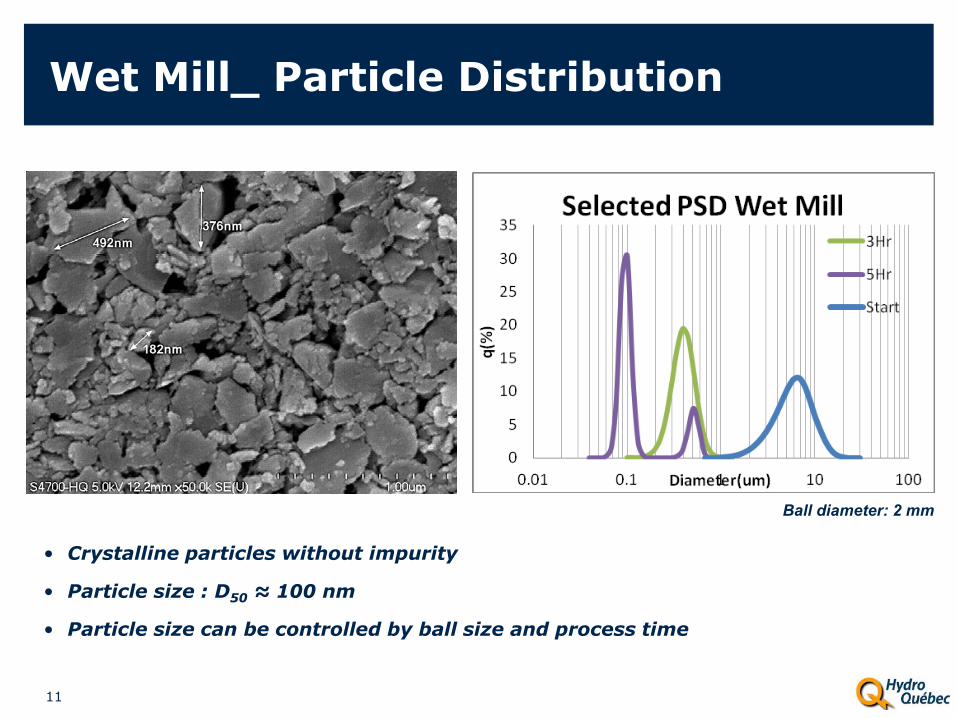
Wet Mill_ Particle Distribution
11
Ball diameter: 2 mm
• Crystalline particles without impurity
• Particle size : D50 ≈ 100 nm
• Particle size can be controlled by ball size and process time
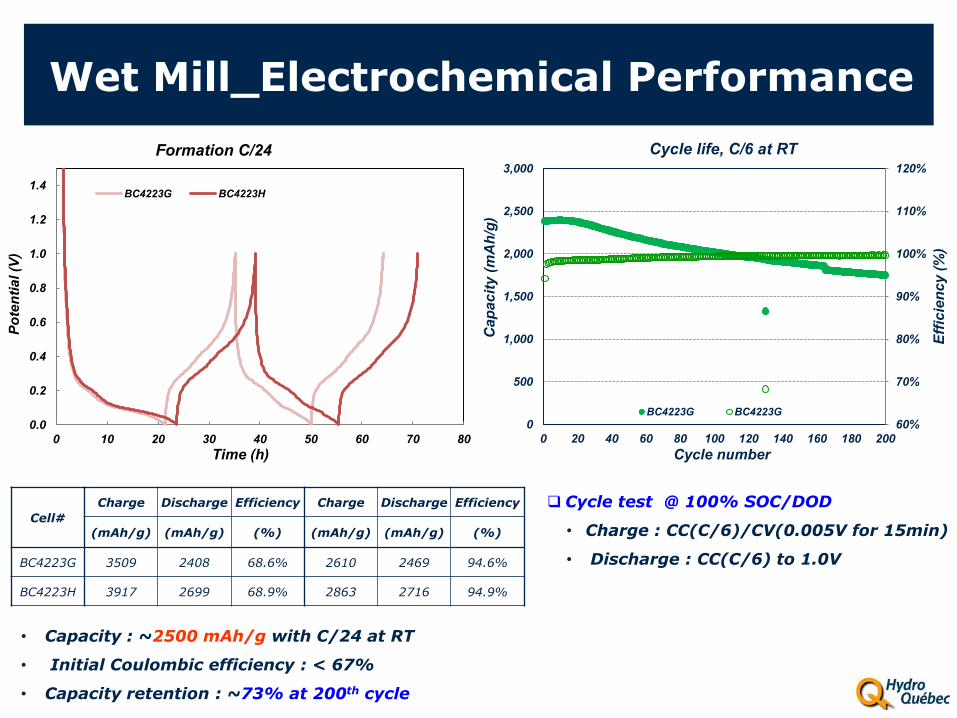
Wet Mill_Electrochemical Performance
12
0.0
0.2
0.4
0.6
0.8
1.0
1.2
1.4
0 10 20 30 40 50 60 70 80
Pote
ntia
l (V)
Time (h)
Formation C/24
BC4223G BC4223H
60%
70%
80%
90%
100%
110%
120%
0
500
1,000
1,500
2,000
2,500
3,000
0 20 40 60 80 100 120 140 160 180 200
Effic
ienc
y (%
)
Cap
acity
(mA
h/g)
Cycle number
Cycle life, C/6 at RT
BC4223G BC4223G
Cycle test @ 100% SOC/DOD
• Charge : CC(C/6)/CV(0.005V for 15min)
• Discharge : CC(C/6) to 1.0V
Cell# Charge Discharge Efficiency Charge Discharge Efficiency
(mAh/g) (mAh/g) (%) (mAh/g) (mAh/g) (%)
BC4223G 3509 2408 68.6% 2610 2469 94.6%
BC4223H 3917 2699 68.9% 2863 2716 94.9%
• Capacity : ~2500 mAh/g with C/24 at RT
• Initial Coulombic efficiency : < 67%
• Capacity retention : ~73% at 200th cycle

Si nano powder - 2. Plasma Process
13
Silicone powder (µm size,
99.999wt%)
3 MHz, 60 kW
Metal vapor
Si nanopowder Heat Quenching
High process cost > $50/kg

Characterization of Plasma-Nano Si
14
SEM Spherical shape Dia. 50 to 200 nm
TEM Crystalline lattice in the silicon
nanoparticles Contamination-free atomic surface
XRD c-Si with diamond cubic lattice
(a = 5.43 Å) No impurity phase detected
PSD : D50 = 85 nm BET : 30 m2/g
XRD PSA

Micro-Si (electrode)
15
In-situ evolution of micron-sized Si particles on real time cycling
Cracking of particles leading to the loss of electrode integrity
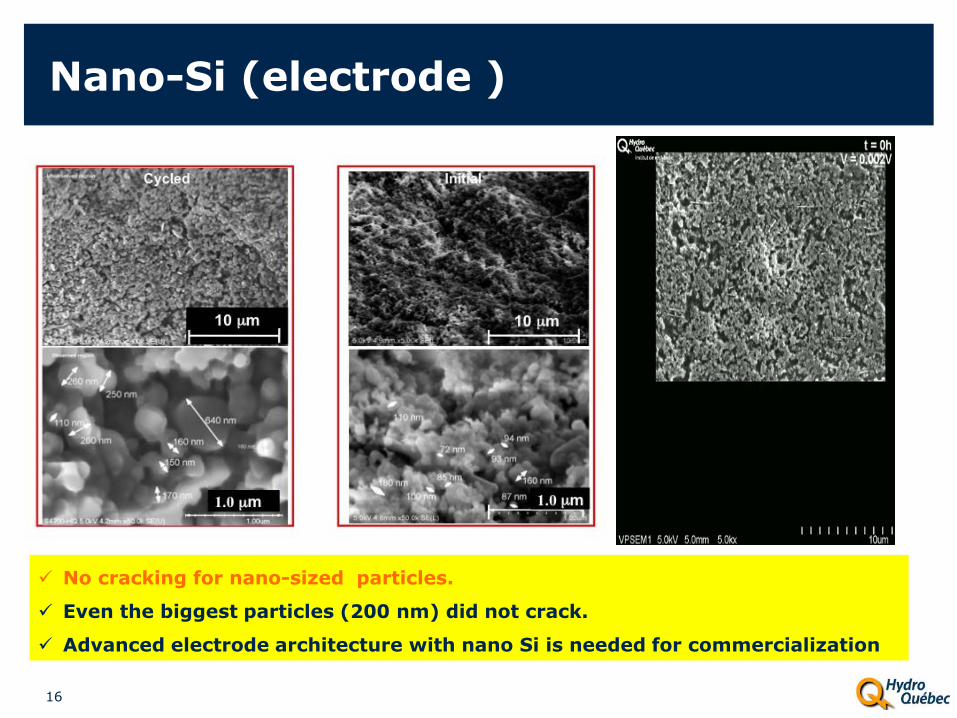
Nano-Si (electrode )
16
No cracking for nano-sized particles.
Even the biggest particles (200 nm) did not crack.
Advanced electrode architecture with nano Si is needed for commercialization
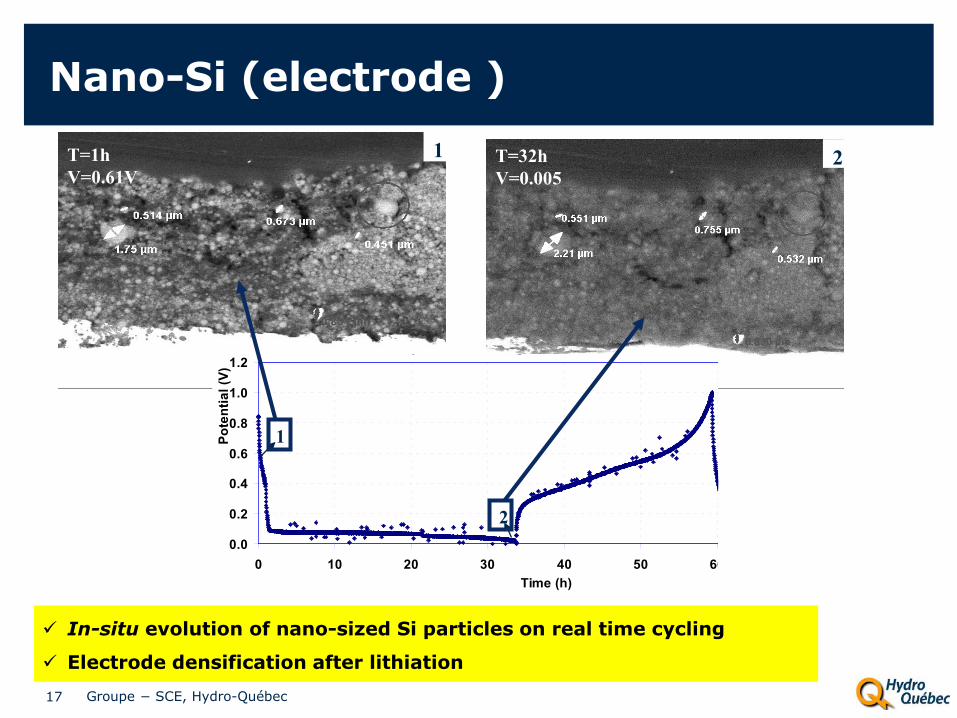
Nano-Si (electrode )
17 Groupe − SCE, Hydro-Québec
376 10 T=1h V=0.61V
1 T=32h V=0.005
2
) g
0.0
0.2
0.4
0.6
0.8
1.0
1.2
0 10 20 30 40 50 60Time (h)
Pote
ntia
l (V)
1
2
In-situ evolution of nano-sized Si particles on real time cycling
Electrode densification after lithiation

In situ TEM; Collaboration with PNNL
18
W
Pt
LiLi2O
Si NS V
Silicon nanoparticles were loaded on a platinum electrode.
Lithium metal was loaded on a tungsten tip, which was fixed to a piezosystme, with lithium oxide surface layer serving a solid electrolyte.
Insertion of lithium into Si particles was controlled by application of bias voltage of -2 ~-5 V.
Titan 80-300 with a probe corrector was operated at 300 kV for imaging.
In situ transmission electron microscopy observations of lithiation of silicon nanopowder produced by induced plasma atomization, Journal of Power Sources, Volume 279 (2015) 522-527 Dominic Leblanc, Chongmin Wang, Yang He, Daniel Bélanger, Karim Zaghib

In situ TEM : Si/Li2O/Lithium
19

20
In situ TEM : Si/Li2O/Lithium
20
(a) (b) (c)
a) Particles in discharged state : 50 – 200 nm spheres
b) Initiation of lithium insertion : rapid reaction from the surface forms a core-
shell structure.
c) Growth of amorphous LixSi alloy : particle expansion without collapsing

Effect of SOC Control
21
Discharge capacity of 3500 mAh/g was achieved
at 100% SOC/DOD.
SOC should be limited to < 40% in order to
reach the cycle life >100 cycles
Useable capacity at 40% SOC : ~1670 mAh/g.
Cycle life > 200 cycles

Effect of Electrode Loading
22
0
500
1000
1500
2000
2500
3000
3500
4000
4500
0.0 0.1 1.0 10.0
Capa
city
(mAh
/g)
Rate (C)
Ragonne
BC4199C_2.0milBC4199L_3.0milBC4204C_5.0milBC4199F_6.0milBC4199G_10.0mil
Coating Gap
Loading Level C-rate Cycle
(mil) (mg/cm2) - -
2 0.45 OO >700 3 0.75 O >400 5 0.99 Δ >250 6 1.26 X >100
10 1.96 XX <50
Electrode chemical performance of Si electrode is
highly dependent on the electrode loading.
Cycle life > 700 cycles at the low loading of 0.45
mg/cm2 .
0
500
1000
1500
2000
2500
0 100 200 300 400 500 600 700
Capa
city
(mAh
/g)
Cycle Number
Cycle life, C/6 at RT
BC4199A_2.0mil BC4199K_3.0mil BC4204B_5.0milBC4199D_6.0mil BC4199H_10.0mil

Design of Large Format Cell (ver.1)
23
Anode utilization
216 mm
255 mm
• Cathode : HV LMNO
• Anode : nano Si
• Cathode determining design with limited utilization (40%) of anode

Process Flow (Automatic Pilot Line)
24
Mixing
LMNO PVDF/NMP Carbon
Coating
Pressing
Cutting Cutting Separator
Electrolyte EL Injection
Stacking
Formation
Grading
Mixing
Si-nano Alginate/Water Carbon
Coating
Pressing
Drying Drying
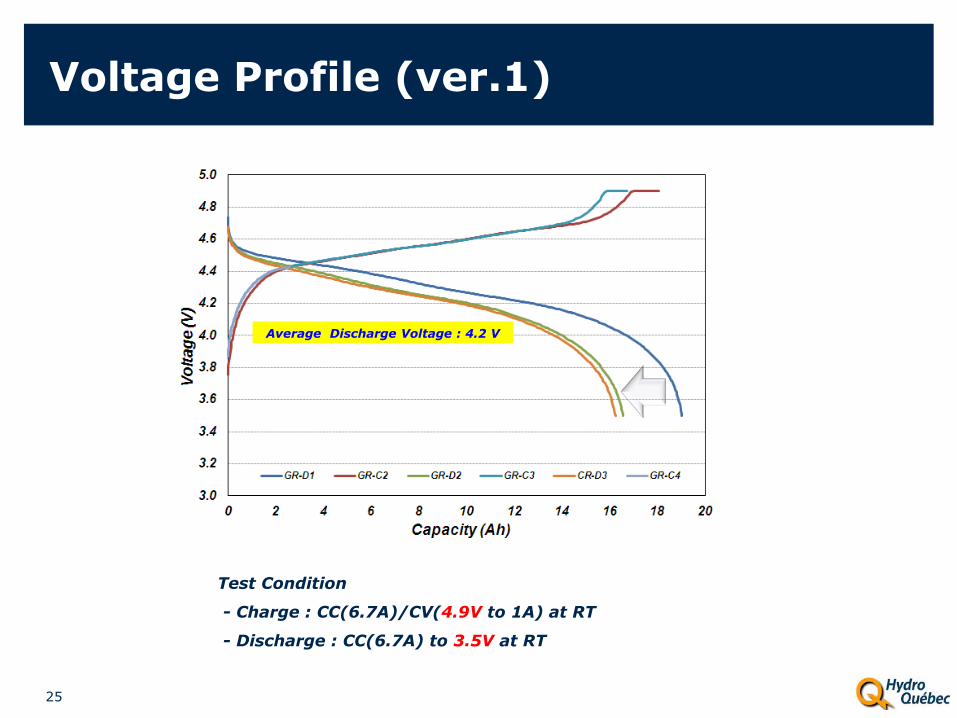
Voltage Profile (ver.1)
25
Test Condition
- Charge : CC(6.7A)/CV(4.9V to 1A) at RT
- Discharge : CC(6.7A) to 3.5V at RT
Average Discharge Voltage : 4.2 V

Issues in Manufacturing Process (ver.1)
Mixing
Coating
Deliverable w/o EL Pre-formation Main-formation Pressing
Mixing
LMNO PVDF/NMP Carbon
Coating
Pressing
Cutting Cutting Separator
Electrolyte EL Injection
Stacking
Formation
Grading
Mixing
Si-nano Alginate/Water Carbon
Coating
Pressing
Drying Drying

Severe Gas Generation (ver.1)
27
EL Injection
Pre-formation
Degassing
Main formation
Grading
2nd-grading
3rd-grading
3rd-degassing
4th-degassing
5th-degassing
NCM vs. Graphite LMNO vs. Si-nano
Discharge
6th-degassing
Charge
Gas
Gas
Gas
2nd-degassing
Gas
Gas
Gas
Gas Discharge
Gas
No
https://www.liv.ac.uk/chemistry/research/hardwick-group/research/
0%
100%
40%
30%
100%
30%
30%
30%
3 cycles
3 cycles
3 cycles
1 step
1 step
1 step
SOC
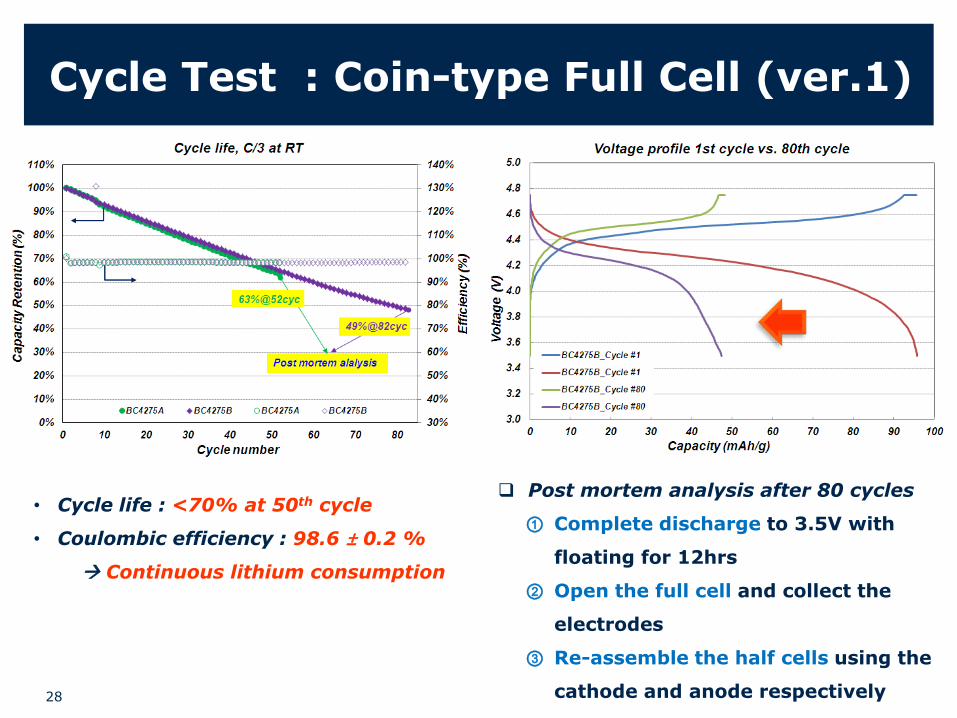
Cycle Test : Coin-type Full Cell (ver.1)
28
Post mortem analysis after 80 cycles
① Complete discharge to 3.5V with
floating for 12hrs
② Open the full cell and collect the
electrodes
③ Re-assemble the half cells using the
cathode and anode respectively
• Cycle life : <70% at 50th cycle
• Coulombic efficiency : 98.6 ± 0.2 %
Continuous lithium consumption

Post Mortem Analysis_Cathode Half Cell
29
0
20
40
60
80
100
120
140
0 10 20 30
Cap
acity
(mA
h/g)
Cycle Number
Cathode Half Cell, C/3
BC4307A_205 - OUVERTURE CATHODE.3.0
3.2
3.4
3.6
3.8
4.0
4.2
4.4
4.6
4.8
5.0
0 20 40 60 80
Pote
ntia
l (V)
Time (h)
Cathode Half Cell, C/24
BC4307A BC4307C
C-rate Charge Discharge Charge Discharge Unused
Capacity
Capacity Retention in
Full Cell (mAh/g) (mAh/g) (mAh/g) (mAh/g)
BC4307A 101 125 142 129 28.9% 63%
BC4307C - 66 141 129 51.1% 49%
First discharge
First charge
• Cathode performance is completely recovered in the half cell.
• Capacity decay in full cell is due to the mismatch of anode-cathode
balance, caused by the irreversible loss of lithium.
Test Condition
- Charge : CC(C/3)/CV(4.9V for 15 min)
- Discharge : CC(C/3) to 3.5V

Post Mortem Analysis_Anode Half Cell
30
0
200
400
600
800
1000
1200
1400
1600
1800
0 10 20 30
Cap
acity
(mA
h/g)
Cycle Number
Anode Half Cell
BC4307B_207 - OUVERTURE ANODE.
0.0
0.2
0.4
0.6
0.8
1.0
1.2
1.4
0 10 20 30 40 50
Pote
ntia
l (V)
Time (h)
Anode Half Cell, C/24
BC4307B BC4307D
C-rate Discharge Charge Discharge Charge Capacity
Loss (mAh/g) (mAh/g) (mAh/g) (mAh/g)
BC4307A 4 3284 2828 2888 -
BC4307C - 3221 2724 2613 -
Test Condition
- Charge : CC(C/6)/CV(5mV for 15 min, or
SOC40% at RT
- Discharge : CC(C/6) to 1.0V at RT
• Anode performance is completely recovered in the half cell.
• Capacity decay in full cell is due to the mismatch of anode-cathode
balance, caused by the irreversible loss of lithium.
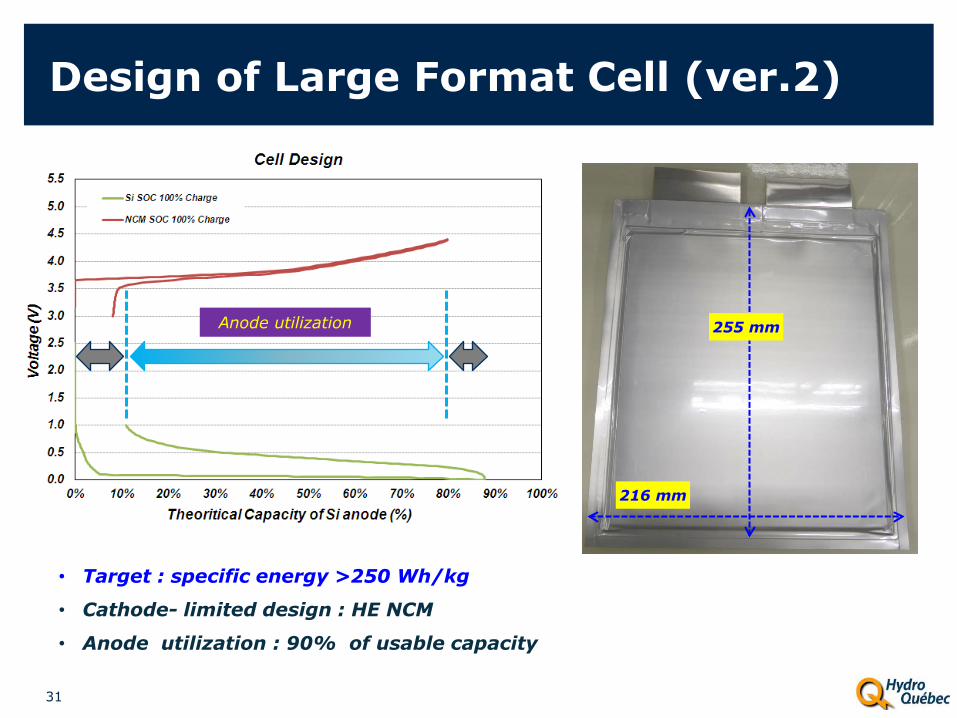
Design of Large Format Cell (ver.2)
31
• Target : specific energy >250 Wh/kg
• Cathode- limited design : HE NCM
• Anode utilization : 90% of usable capacity
Anode utilization
216 mm
255 mm

Voltage Profile
32
- Charge : CC(20A)/CV(4.4V to 3A) at RT
- Discharge : CC(20A) to 2.5V at RT
- Charge : CC(6.7A)/CV(4.9V to 1A) at RT
- Discharge : CC(6.7A) to 3.5V at RT
Ver.1 Ver.2
No gas generation in ver.2
Cell thickness change : ~7.4% (SOC 100% vs. 0%)
Average Voltage : 4.2 V
Average Voltage : 3.4 V

Rate Capability (ver.2)
33
C-rate Capacity Retention Average. V Energy Energy Density Max. Temp.
(Ah) (%) (V) (Wh) (Wh/kg) (Wh/L) (°C)
C/3_20A 59.9 100% 3.481 209 237 445 27
C/2_30A 56.6 95% 3.494 198 225 423 29
1C_60A 53.8 90% 3.467 187 212 399 33
1.3C_80A 52.3 87% 3.446 180 205 385 38
1.7C_100A 50.9 85% 3.422 174 198 372 42
Test Condition
- Charge : CC(C/3)/CV(4.4V to 3A) at RT
- Discharge : CC to 2.5V at RT
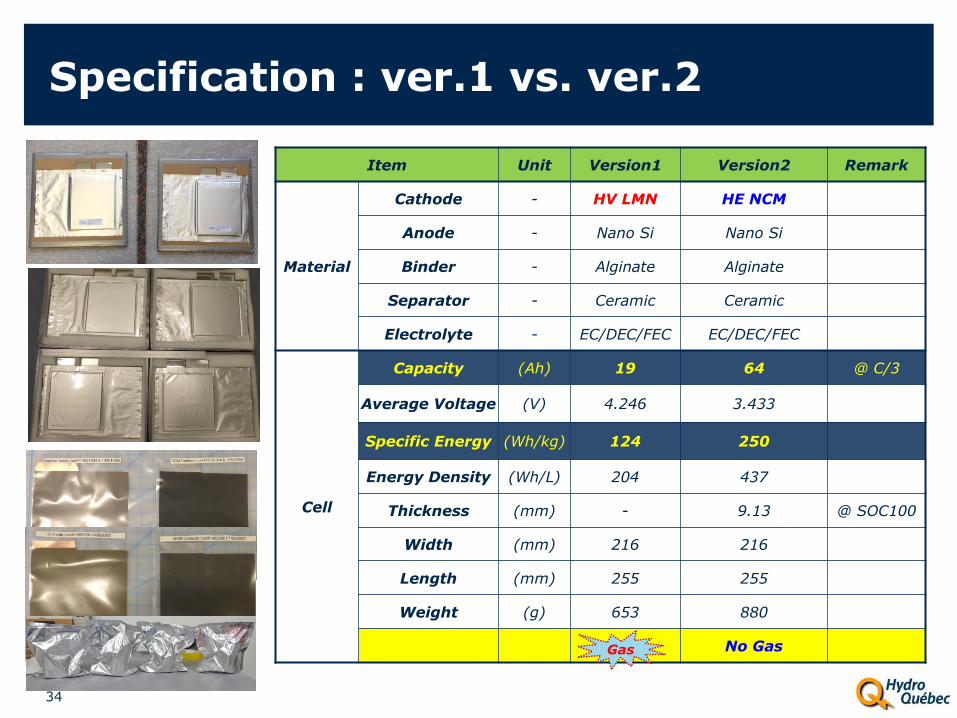
Specification : ver.1 vs. ver.2
34
Item Unit Version1 Version2 Remark
Material
Cathode - HV LMN HE NCM
Anode - Nano Si Nano Si
Binder - Alginate Alginate
Separator - Ceramic Ceramic
Electrolyte - EC/DEC/FEC EC/DEC/FEC
Cell
Capacity (Ah) 19 64 @ C/3
Average Voltage (V) 4.246 3.433
Specific Energy (Wh/kg) 124 250
Energy Density (Wh/L) 204 437
Thickness (mm) - 9.13 @ SOC100
Width (mm) 216 216
Length (mm) 255 255
Weight (g) 653 880
Gas No Gas Gas
Summary
35
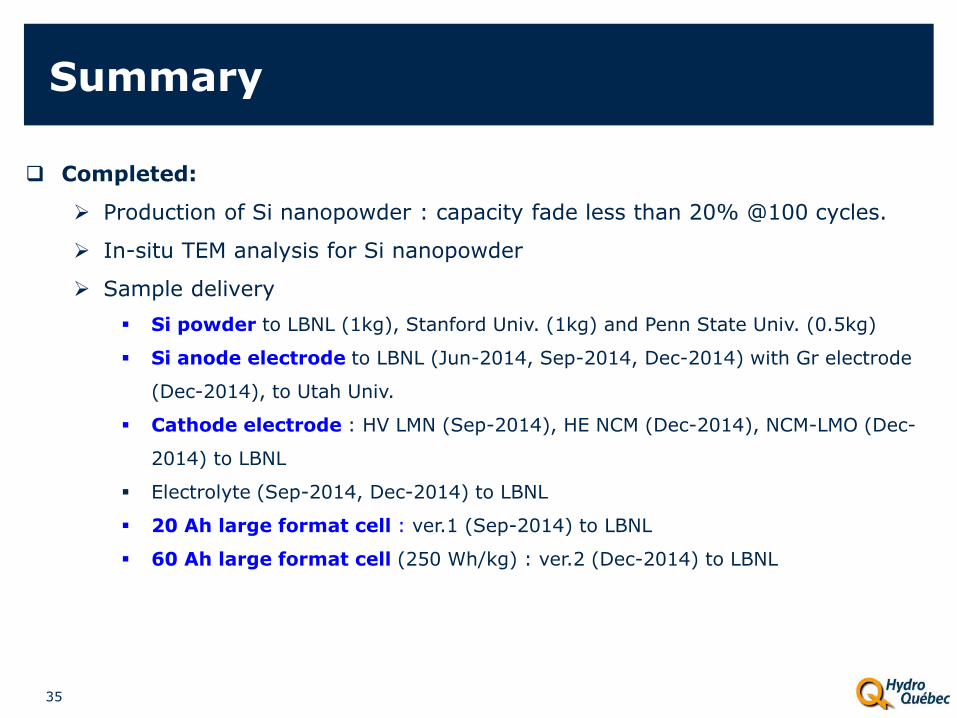
Completed:
Production of Si nanopowder : capacity fade less than 20% @100 cycles.
In-situ TEM analysis for Si nanopowder
Sample delivery Si powder to LBNL (1kg), Stanford Univ. (1kg) and Penn State Univ. (0.5kg)
Si anode electrode to LBNL (Jun-2014, Sep-2014, Dec-2014) with Gr electrode
(Dec-2014), to Utah Univ.
Cathode electrode : HV LMN (Sep-2014), HE NCM (Dec-2014), NCM-LMO (Dec-
2014) to LBNL
Electrolyte (Sep-2014, Dec-2014) to LBNL
20 Ah large format cell : ver.1 (Sep-2014) to LBNL
60 Ah large format cell (250 Wh/kg) : ver.2 (Dec-2014) to LBNL

Future Activities
36
On going:
Optimize the particle size (200 ~ 50 nm) and process conditions of nano-
Si powder.
Study the effect of precursor composition : Si, SiOx, Si-SiOx .
Synthesis of secondary particles using spray-dry process.
Continue to study SEI passivation, fracture of electrode and particles by
in-situ SEM, TEM, dual-beam microscope.
Increase the energy density to meet the requirement of BMR program
Increase the loading Si electrode : further development of binder and
electrode architecture.
Characterize the gas generation in slurry and cell.
Surface treatment of nano-Si powder by using spry dryer.
HQ wants to be a provider of baseline nano-Si powder for BMR program
and supply it to PI’s without NDA.
Dual-beam(electron+ion) Microscope
37
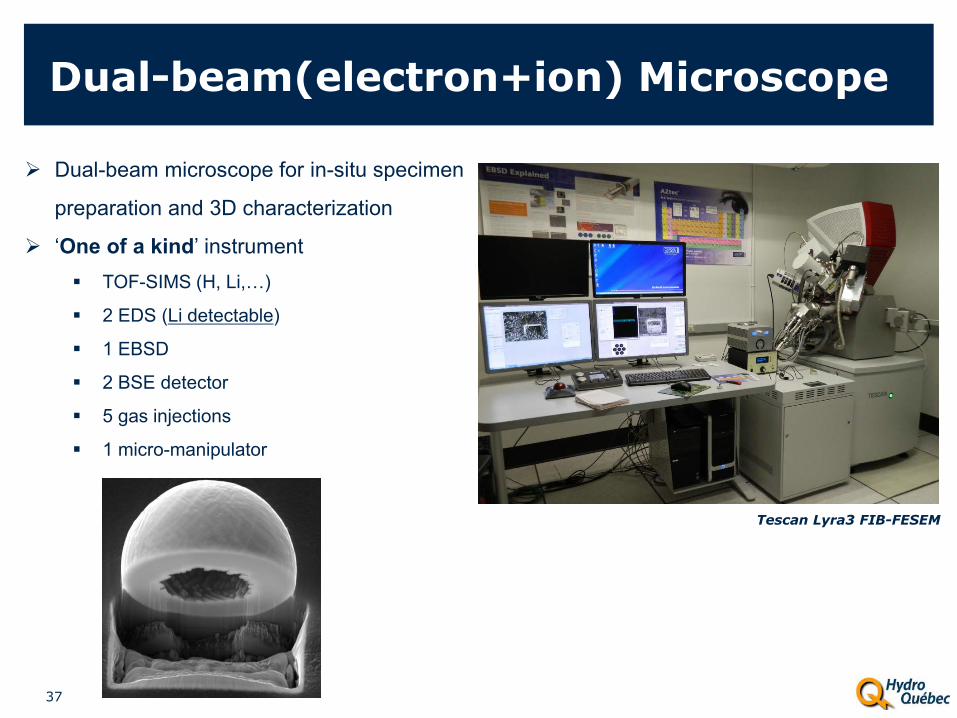
Tescan Lyra3 FIB-FESEM
Dual-beam microscope for in-situ specimen
preparation and 3D characterization
‘One of a kind’ instrument TOF-SIMS (H, Li,…)
2 EDS (Li detectable)
1 EBSD
2 BSE detector
5 gas injections
1 micro-manipulator
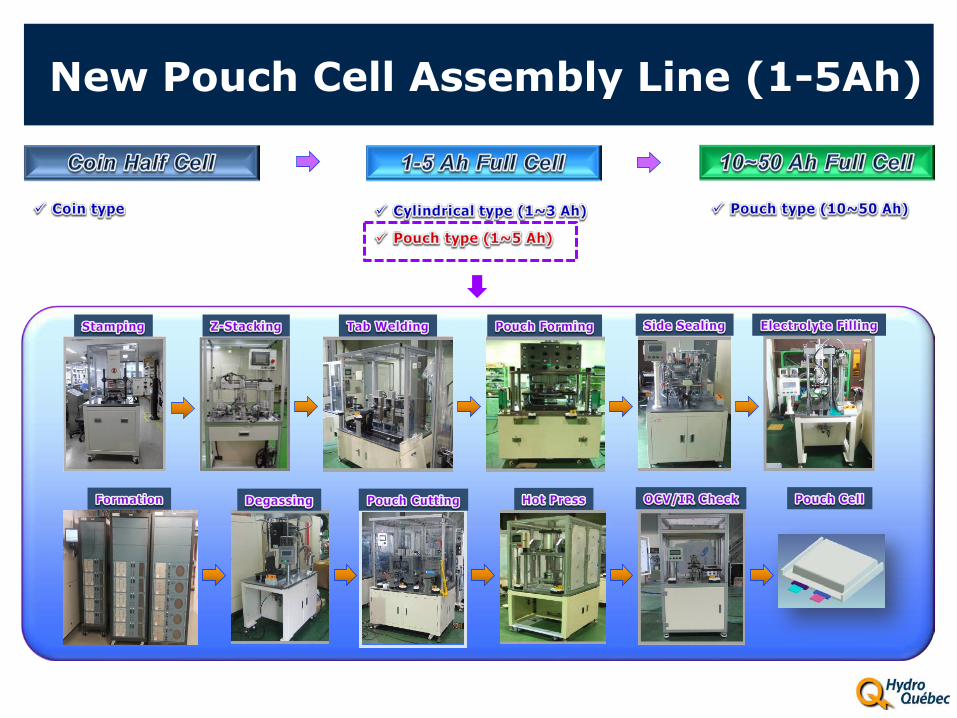
New Pouch Cell Assembly Line (1-5Ah)