electrochemical investigation of the diffusion of lithium in β-lial alloy at room temperature
TRANSCRIPT

JOURNAL OF APPLIED ELECTROCHEMISTRY 22 (1992) 728-732
Electrochemical investigation of the diffusion of lithium in II-LiAl alloy at room temperature N. K U M A G A I , Y. K I K U C H I , K. T A N N O
Department of Applied Chemistry, Faculty of Engineering, Iwate University, Morioka, 020, Japan
F. L A N T E L M E , M. C H E M L A
Laboratoire d'Electrochimie, U.A. 430, Universitd Pierre et Marie Curie, 75252 Paris Cedex 05, France
Received 30 August 1991; accepted 20 January 1992
The chemical diffusion coefficients of lithium in fl-LiA1 alloy were measured by the use of transient techniques such as chronopotent iometry, chronoamperometry and a.c. impedance spectroscopy in 1 M LiC104-propylene carbonate at 25 ~ C. A fl-LiA1 layer, formed by electrodepositing lithium on a thin aluminittm substrate having a microstructure of preferred (1 0 0) orientation, was mainly used. The values of the diffusion coefficients were found to be of the order of 10-70 cm 2 s-7, which are close to those reported in the literature. A scatter in the coefficient was discussed in terms of the formation and disruption of the passivating layer on the alloy.
1. Introduction
The use of lithium-aluminium alloy is of considerable interest as an alternative to pure lithium as the nega- tive electrode in secondary lithium cells operating at ambient temperature in order to avoid problems associated with the formation of dendrites [1, 2]. In the past decade several groups have pursued this idea [3-81.
In general diffusion is slow in solid materials. Therefore, studies of the diffusion process are essential for evaluation of the alloy as a possible negative elec- trode. In a previous paper [9], the cycling behaviour of the Li-AI alloys, formed on several kinds of thin aluminium substrates having different microstructures and modifications, was investigated. In the present work, we applied the electrochemical pulse technique to the study of the behaviour of Li-A1 alloy in an organic electrolyte. Special attention was paid to the influence of the chemical diffusion coefficient of lithium on the electrochemical behaviour of the alloy.
2. Experimental details
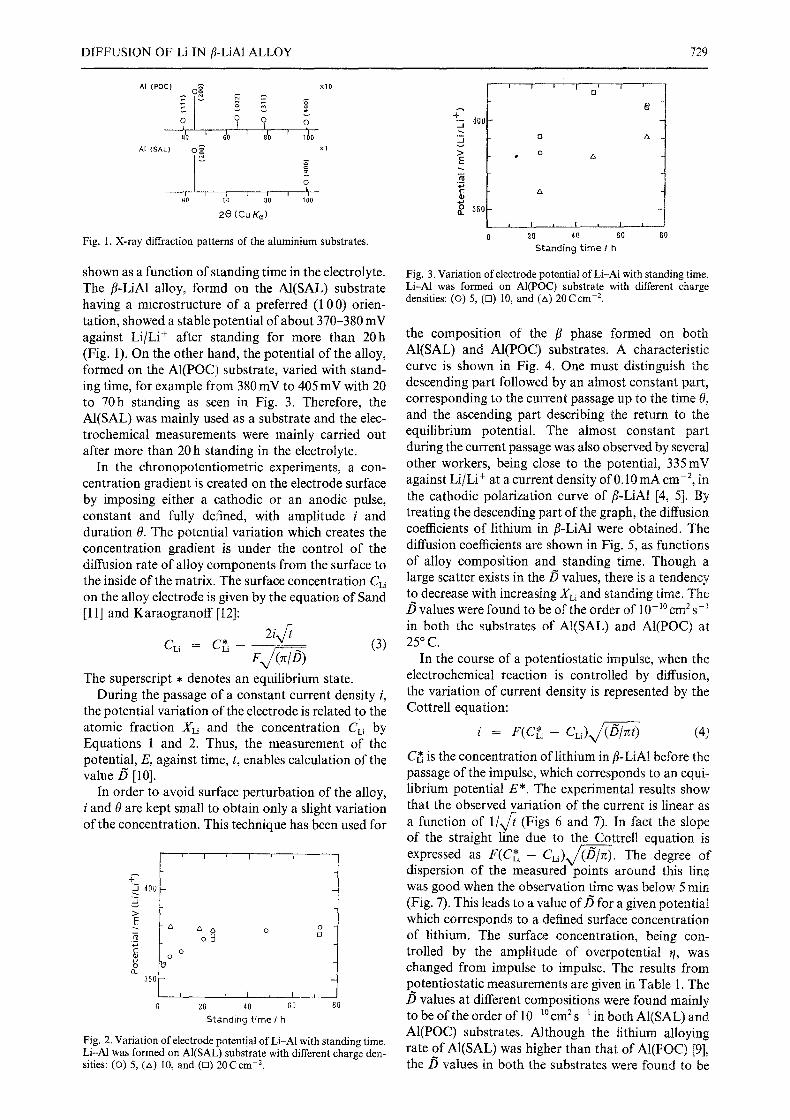
Preparations of working, counter and reference electrodes and the electrolyte and the assembly of the cell were carried out as described in the previous paper [9]. The working electrode was prepared by galvano- static electrolysis with different charge densities (5-30 C cm -2) and at a current density of 1 mA cm -2. The starting substrates were two kinds of aluminium foil, AI(SAL) (purity: 99.99%, thickness: 0.10mm) obtained from KDK Co., and AI(POC) (99.8%, 0.10mm) obtained from Nilako Co., both of which were cut into rectangular pieces with an exposed geometric area of 2.0 cm 2 [9]. X-ray diffraction pat- terns of these substrates are shown in Fig. 1. The AI(SAL) substrate has a considerably preferred (1 0 0)
728
orientation. Both counter and reference electrodes were lithium pellets pressed onto nickel nets. The electrolyte used was 1.0M LiC104-propylene car- bonate (PC) obtained from Tomiyama Kagaku Chemical, which contained only trace amounts of water less than 20 mgdm -3. A glass beaker type cell filled with about 20ml of electrolyte solution was used. All the measurements and handlings were carried out in a dry box filled with argon.
3. Results
3.1. Determh~ation of the diffusion coefficient of ~-LiAI alloy by electrochemical techniques
The amount of lithium reduced was followed by the measurement of electrolytic current and the surface concentration of lithium in the Li-A1 alloy was followed from the potential E of the alloy electrode, referred to pure lithium metal. In the fl-LiA1 system at 25~ the potential, E (mV against Li/Li+), in the range 380 mV to 250mV against Li/Li + is related to the atomic fraction of lithium XLi in the alloy by the following expression [6].
XLi -- 6.03 • 10 -2 • E + 73.23
(47% < XLi < 56%) (l)
XLi and the concentration of lithium, CLi, are connected by
)iZLi p Li_nl Qi = (2)
[XLiMLi q- (1 -- X'Li)MAI ]
PLi-AI being the alloy specific mass and Mu and MAI the atomic specific masses of lithium and aluminium.
In Figs 2 and 3 the variations of the electrode potentials of Li-A1 alloy, formed on AI(SAL) and AI(POC) substrates with different charge densities, are
0021-891X/92 �9 1992 Chapman & Hall
DIFFUSION OF Li IN/%LiA1 ALLOY 729
AI (POC)
A[ (SAL)
OE x lO
o ? + o Ii ' l [ l'I qO I 610 810 1 O0
O ~ xl
I O
f I L I ~ii ~O 60 810 I O0
2e (Cu K~)
Fig. 1. X-ray diffraction patterns of the aluminium substrates.
shown as a function of standing time in the electrolyte. The fl-LiA1 alloy, formd on the AI(SAL) substrate having a microstructure of a preferred (1 00) orien- tation, showed a stable potential of about 370-380 mV against Li/Li + after standing for more than 20h (Fig. 1). On the other hand, the potential of the alloy, formed on the AI(POC) substrate, varied with stand- ing time, for example from 380 mV to 405 mV with 20 to 70h standing as seen in Fig. 3. Therefore, the AI(SAL) was mainly used as a substrate and the elec- trochemical measurements were mainly carried out after more than 20 h standing in the electrolyte.
In the chronopotentiometric experiments, a con- centration gradient is created on the electrode surface by imposing either a cathodic or an anodic pulse, constant and fully defined, with amplitude i and duration 0. The potential variation which creates the concentration gradient is under the control of the diffusion rate of alloy components from the surface to the inside of the matrix. The surface concentration CLi on the alloy electrode is given by the equation of Sand [11] and Karaogranoff [12]:
2ix/~ (3) C L i : C L ~ i F ~
N / ' ' " The superscript �9 denotes an equilibrium state.
During the passage of a constant current density i, the potential variation of the electrode is related to the atomic fraction Xu and the concentration CLi by Equations 1 and 2. Thus, the measurement of the potential, E, against time, t, enables calculation of the value/5 [10].
In order to avoid surface perturbation of the alloy, i and 0 are kept small to obtain only a slight variation of the concentration. This technique has been used for
4oo J
E
g O ll.
350
~' & & O O o B tn
o o
I ~ I , I ,
20 40 80 80
Standing time / h
Fig. 2. Variation of electrode potential of Li-A1 with standing time. Li-A1 was formed on AI(SAL) substrate with different charge den- sities: (o) 5, (zx) 10, and (n) 2 0 C c m -z.
�9 - 400 ._l
_J > E
"~ 350 0-
J I l I D l
0
D
@
I i J I i I q 2D 4 0 6 0 8 0
Standing t ime I h
Fig. 3. Variation of electrode potential of Li-A1 with standing time. Li-AI was formed on AI(POC) substrate with different charge densities: (0) 5, (D) 10, and (~x) 2 0 C c m -2.
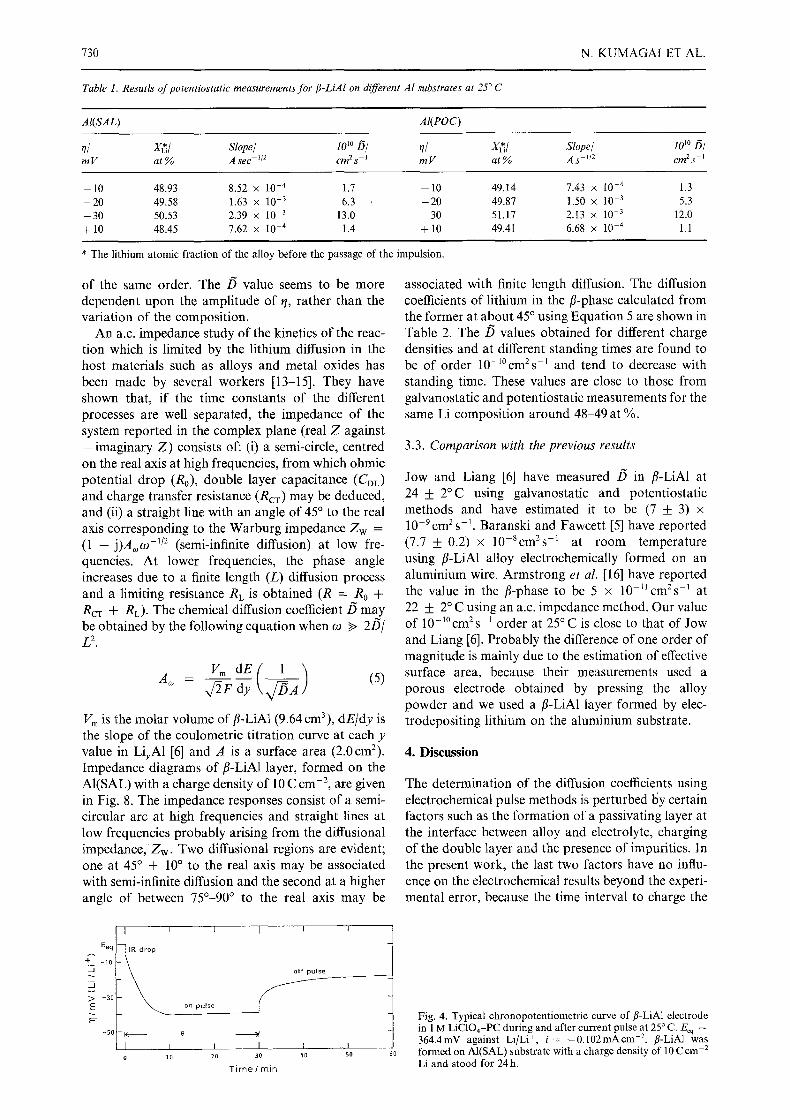
the composition of the /? phase formed on both AI(SAL) and AI(POC) substrates. A characteristic curve is shown in Fig. 4. One must distinguish the descending part followed by an almost constant part, corresponding to the current passage up to the time 0, and the ascending part describing the return to the equilibrium potential. The almost constant part during the current passage was also observed by several other workers, being close to the potential, 335mV against Li/Li + at a current density of 0.10 mA cm -z, in the cathodic polarization curve of/~-LiA1 [4, 5]. By treating the descending part of the graph, the diffusion coefficients of lithium in/?-LiA1 were obtained. The diffusion coefficients are shown in Fig. 5, as functions of alloy composition and standing time. Though a large scatter exists in the/5 values, there is a tendency to decrease with increasing XLi and standing time. The /5 values were found to be of the order of 10-10 cm2s- in both the substrates of AI(SAL) and AI(POC) at 25 ~ C.
In the course of a potentiostatic impulse, when the electrochemical reaction is controlled by diffusion, the variation of current density is represented by the Cottrell equation:
i = F ( C * i - C L i ) J ( / 5 / ~ t ) (4)
C* is the concentration of lithium in #-LiA1 before the passage of the impulse, which corresponds to an equi- librium potential E*. The experimental results show that the observed variation of the current is linear as a function of 1/x//t (Figs 6 and 7). In fact the slope of the straight line due to the Cottrell equation is expressed as F(C*i - C u ) ~ . The degree of dispersion of the measured points around this line was good when the observation time was below 5 rain (Fig. 7). This leads to a value of/5 for a given potential which corresponds to a defined surface conce, ntration of lithium. The surface concentration, being con- trolled by the amplitude of overpotential q, was changed from impulse to impulse. The results from potentiostatic measurements are given in Table 1. The /5 values at different compositions were found mainly to be of the order of 10-1~ cm 2 s-t in both AI(SAL) and AI(POC) substrates. Although the lithium alloying rate of AI(SAL) was higher than that of AI(POC) [9], the/5 values in both the substrates were found to be
730 N. KUMAGAI ET AL.
Table 1. Resutls of potentiostatic measurements for ~-LiAl on different Al substrates at 25 ~ C
AI(SAL) AI(POC)
~/ X*/ Slope/ 10 ~~ 6 / ~/ X~/ Slope/ 10 '~ D/ m g at % A sec- I12 ctn 2 s- ~ m V at % A s- I12 cm 2 S- 1
- 1 0 48.93 8.52 • I0 -4 1.7 --10 49.14 7.43 x 10 .4 1.3 - 2 0 49.58 1.63 x 10 .3 6.3 - 2 0 49.87 1.50 x 10 3 5.3 - 3 0 50.53 2.39 x I0 3 13.0 - 3 0 51.17 2.13 • 10 -3 12.0 + 10 48.45 7.62 x 10 4 1.4 + 10 49.41 6.68 • I0 -4 1.1
* The lithium atomic fraction of the alloy before the passage of the impulsion.
of the same order. The /5 value seems to be more dependent upon the amplitude of tl, rather than the variation of the composition.
An a.c. impedance study of the kinetics of the reac- tion which is limited by the lithium diffusion in the host materials such as alloys and metal oxides has been made by several workers [13-15]. They have shown that, if the time constants of the different processes are well separated, the impedance of the system reported in the complex plane (real Z against -imaginary Z) consists of: (i) a semi-circle, centred on the real axis at high frequencies, from which ohmic potential drop (R0), double layer capacitance (CDL) and charge transfer resistance (RcT) may be deduced, and (ii) a straight line with an angle of 45 ~ to the real axis corresponding to the Warburg impedance Zw = (1 -j)Ao, oJ -112 (semi-infinite diffusion) at low fre- quencies. At lower frequencies, the phase angle increases due to a finite length (L) diffusion process and a limiting resistance RL is obtained (R = R0 + RcT + RL). The chemical diffusion coefficient/5 may be obtained by the following equation when co >> 215/ L 2"
A~ - x ~ F dy (5)
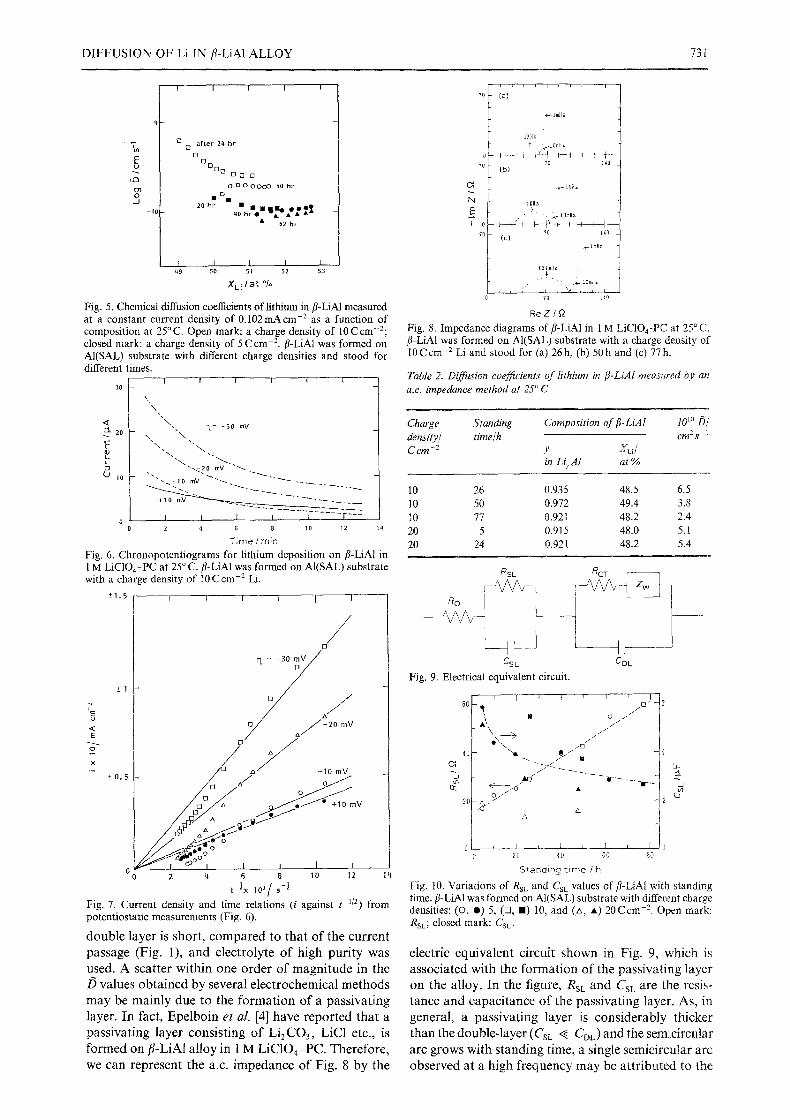
V~ is the molar volume of/%LiA1 (9.64 cm 3 ), dE/dy is the slope of the coulometric titration curve at each y value in LiyA1 [6] and A is a surface area (2.0cm2). Impedance diagrams of fl-LiA1 layer, formed on the AI(SAL) with a charge density of 10 C cm -2, are given in Fig. 8. The impedance responses consist of a semi- circular arc at high frequencies and straight lines at low frequencies probably arising from the diffusional impedance, Zw. Two diffusional regions are evident; one at 45 ~ _+ 10 ~ to the real axis may be associated with semi-infinite diffusion and the second at a higher angle of between 750-90 ~ to the real axis may be
associated with finite length diffusion. The diffusion coefficients of lithium in the fl-phase calculated from the former at about 45 ~ using Equation 5 are shown in Table 2. The /3 values obtained for different charge densities and at different standing times are found to be of order 1 0 - 1 ~ -1 and tend to decrease with standing time. These values are close to those from galvanostatic and potentiostatic measurements for the same Li composition around 48-49 at %.
3.3. Comparison with the previous results
Jow and Liang [6] have measured /5 in fl-LiA1 at 24 __ 2~ using galvanostatic and potentiostatic methods and have estimated it to be (7 _+ 3) x 10-9cm 2 s -1. Baranski and Fawcett [5] have reported (7.7 _+ 0.2) x 10 8cm2s-1 at room temperature using fl-LiA1 alloy electrochemically formed on an aluminium wire. Armstrong et al. [16] have reported the value in the fl-phase to be 5 x 10-Ucm2s ~ at 22 _+ 2 ~ C using an a.c. impedance method. Our value of 10-1~ I order at 25~ is close to that of Jow and Liang [6]. Probably the difference of one order of magnitude is mainly due to the estimation of effective surface area, because their measurements used a porous electrode obtained by pressing the alloy powder and we used a fl-LiA1 layer formed by elec- trodepositing lithium on the aluminium substrate.
4. Discussion
The determination of the diffusion coefficients using electrochemical pulse methods is perturbed by certain factors such as the formation of a passivating layer at the interface between alloy and electrolyte, charging of the double layer and the presence of impurities. In the present work, the last two factors have no influ- ence on the electrochemical results beyond the experi- mental error, because the time interval to charge the
Eeq
~" -IO
15 > -3o
E
F
-50
i I
IR drop
2 I<
[ i 10
J on pulse
o f f pulse
I I i . i 20 30 ~I0 50
T i m e / r a i n
Fig. 4. Typical chronopotentiometric curve of fl-LiA1 electrode in 1 M LiC104-PC during and after current pulse at 25 ~ C. Eoq = 364.4mV against Li/Li +, i = - 0 . 1 0 2 m A c m 2. fl-LiA1 was formed on AI(SAL) substrate with a charge density of 10 C cm 2 Li and stood for 24 h.
D I F F U S I O N O F Li IN fl-LiAl A L L O Y 731
,C3
-J
9
- I0
I I I I I
0 a f te r 2q h r [3
[3
B D E I G D D D
0 0 0 0 0 0 0 0 5 0 h r
�9 i I 20kr �9 �9 1 l I o l i t ~
go hr �9 --ilk �9 ~' i " 62 hr
I I I I I g9 50 51 52 53
X L i / a t %
Fig . 5. C h e m i c a l d i f fus ion coe f f i c i ent s o f l i t h i u m in f l -LiA1 m e a s u r e d at a c o n s t a n t c u r r e n t d e n s i t y o f 0 . 1 0 2 m A c r o -2 as a f u n c t i o n o f
c o m p o s i t i o n at 25 ~ C. O p e n m a r k : a c h a r g e d e n s i t y o f 10 C c m - 2 ;
c l o s e d m a r k : a c h a r g e d e n s i t y o f 5 C c m 2 f l -LiA1 w a s f o r m e d o n
A I ( S A L ) s u b s t r a t e w i t h d i f f erent c h a r g e d e n s i t i e s a n d s t o o d f o r
d i f f e r e n t t i m e s . I l I I I t
30
k
\ , rL= - 3 0 mV 13. 20 \ " ~
L ~ ~ - ~ 2 0 mV ~ -
+lO mV . ~ _ _ _
o I I . I I 1 - - - [ - - - . 2 4 6 8 lO 12 Iq
T i m e ! r a i n
Fig, 6. C h r o n o p o t e n t i o g r a m s for l i t h i u m d e p o s i t i o n o n f l - g i A l in 1 M LiC1Og-PC a t 25 ~ C . f l - L i A l w a s f o r m e d o n A I ( S A L ) s u b s t r a t e w i t h a c h a r g e d e n s i t y o f 10 C c m -2 Li.
-+1.5 t t ~ i I i
/ El
_'1
2 y o/-,o
•
O ~ I - o o I J I I I 0 Z ~ 6 8 IO 12 14
t- �89 10z/ s - �89
Fig. 7. Current density and time relations (i against t 1/2) from potentiostatic measurements (Fig. 6).
double layer is short, compared to that of the current passage (Fig. 1), and electrolyte of high purity was used. A scatter within one order of magnitude in the /3 values obtained by several electrochemical methods may be mainly due to the formation of a passivating layer. In fact, Epelboin e t al . [4] have reported that a passivating layer consisting o f Li2CO3, LiCl etc., is f o r m e d on fi-LiA1 alloy in 1 M L i C 1 0 4 - P C . Therefore, we can represent the a.c. impedance of Fig. 8 by the
N
E I o
70
I , , 1 , i 1 , I
70 (a)
,@lmltz
IK~z ...~10mR~
0 I I " l I ~ ! I I I I b-'- 70 70 i40
[b)
-' " . e i O l l l z
70 140 (c)
~l,oHz
63[m[/z
. . ' ~ lo~llz p i i , i t v , , i - -
70 140
R e Z l ~
Fig. 8. Impedance diagrams of fl-LiAl in 1 M LiC104-PC at 25 ~ C. fl-LiA1 was formed on AI(SAL) substrate with a charge density of 10Ccm -2 Li and stood for (a) 26h, (b) 50h and (c) 77h.
Table 2. Diffusion coefficients o f lithium in fl-LiAl measured by an a.e. impedance method at 25 ~ C
Charge Standing Composition of fl-LiAl 10 l~ D/ density/ time/h cm 2 s - i C em -2 y XLi/
in LiyAt at %
10 26 0.935 48.5 6.5 10 50 0.972 49.4 3.8 10 77 0.921 48.2 2.4 20 5 0.915 48.0 5. l 20 24 0.921 48.2 5.4
CS L C D L
Fig. 9. Electrical equivalent circuit.
I I J I ~ - - T - -
A\ I o / / /
/ [] 40 ""~ 0 / / 4
o / ' / (D 20 x ~ / / ~ - 2
A
0 ~ I r I - . . - L . [ i I 0 20 49 00 80
S t a n d i n g t i m e t h
Fig. 10. Variations of RsL and CSL vatues of fl-kiA1 with standing time./7-LiA] was formed on AI(SAL) substrate with different charge densities: (O, II) 5, ([3, I ) 10, and (A, i ) 20Ccm -2. Open mark: RsL; closed mark: CSL.
electric equivalent circuit shown in Fig. 9, which is associated with the formation of the passivating layer on the alloy. In the figure, RsL and CsL are the resis- tance and capacitance of the passivating layer. As, in general, a passivating layer is considerably thicker than the double-layer (CsL ~ CDL) and the semicircular arc grows with standing time, a single semicircular arc observed at a high frequency may be attributed to the

732 N. K U M A G A I ET AL.
formation of passivating layer on the surface of the alloy. In Fig. 10, Rsr and CsL values deduced from the circular arcs are given as a function of standing time. The RsL increased by a factor of three with increasing time (5-80 h), while the CSL decreased by a factor of a half with increasing time. These suggest that the passivating layer may grow with standing time (~-, 80 h) during the electrochemical measurements, because the thickness of the layer l is given by the equation: l = ~ o A / C s L (~ is the permitivity of the passivating layer). There was a tendency for the/) values obtained from a galvanostatic and a.c, impedance methods to decrease with increase in standing time (Fig. 5 and Table 2), and the values obtained from a potentiostatic method depended upon the amplitude of overpoten- tial (Table 1). These facts may be related to the forma- tion of the passivating layer with standing and the disruption through the application of a current pulse and a constant potential.
Acknowledgement
The authors wish to thank Mr S. Akita and Mrs
Nobuko Kumagai for their helpful assistance with the experimental work,
References
[I] A.N. Dey, J. Electrochem. Soc. 118 (1971) 1547. [2] B . M . L . Rao, R. W. Francis and H. A. Christopher, ibid.
124 (1977) 1490. [3] J .O. Besenhard, J. Electroanal. Chem. 94 (1978) 77. [4] I. Epelboin, M. Froment, M. Garreau, J. Thevenin and
D. Warin, J. Electrochem. Soc. 127 (1980) 2100. [5] A.S. Baranski and W. R. Fawcett, ibid. 129 (1982) 901. [6] T .R. Jow and C. C. Liang, ibid. 129 (1983) 1429. [7] Y. Geronov, P. Zlatilova and R. V. Moshtev, J. Power
Sources 12 (1984) 145. [8] W.C. Maskell and J. R. Owen, J. Electrochem. Soc. 132
(1985) 1602. [9] N. Kumagai, Y. Kikuchi and K. Tanno, J. Appl. Electro-
chem., in press (1992). [10] F. Lantelme, D. Derja, N. Kumagai and M. Chemla, Elec-
trochim. Acta 34 (1989) 1371. [11] H . J .S . Sand, Phil. Mag. I (1906) 229. [12] Z. Karaogranoff, Z. Electrochem. 12 (1906) 5. [13] C. Ho, I. D. Raistrick and R. A. Ruggins, J. Electrochem.
Soc. 127 (1980) 343. [14] A. Honders and G. H. Broers, Solid State Ionics 15 (1985)
I73. [15] N. Kumagai and K. Tanno, Electrochim. Acta 36 (1991)
935. [16] R.D. Armstrong, O. R. Brown and R. P. Pram, A Power
Sources 28 (1989) 259.