electrochemical fabrication of energetic thin films
TRANSCRIPT

University of New MexicoUNM Digital Repository
Chemical and Biological Engineering ETDs Engineering ETDs
Fall 11-14-2016
Electrochemical Fabrication of Energetic ThinFilmsJonathan J. ColemanUniversity of New Mexico - Main Campus
Follow this and additional works at: https://digitalrepository.unm.edu/cbe_etds
Part of the Chemical Engineering Commons
This Dissertation is brought to you for free and open access by the Engineering ETDs at UNM Digital Repository. It has been accepted for inclusion inChemical and Biological Engineering ETDs by an authorized administrator of UNM Digital Repository. For more information, please [email protected].
Recommended CitationColeman, Jonathan J.. "Electrochemical Fabrication of Energetic Thin Films." (2016). https://digitalrepository.unm.edu/cbe_etds/59

i
Jonathan Joseph Coleman Candidate
Chemical and Biological Engineering
Department
This dissertation is approved, and it is acceptable in quality and form for publication:
Approved by the Dissertation Committee:
Plamen Atanassov , Chairperson
Dimiter Petsev
Chris Apblett
David R. Wheeler
Mehran Tehrani
ii
ELECTROCHEMICAL FABRICATION OF
ENERGETIC THIN FILMS
by
JONATHAN JOSEPH COLEMAN
B.S., Chemical Engineering, University of New Mexico, 2010
DISSERTATION
Submitted in Partial Fulfillment of the
Requirements for the Degree of
Doctor of Philosophy
Engineering
The University of New Mexico
Albuquerque, New Mexico
December, 2016

iii
Acknowledgements
I would like to acknowledge and thank the immense number of people that have
helped me get to where I am today. Notably my Advisor, Dr. Chris Apblett, for teaching
me a great deal and for his support on this project, I would be nowhere without him. Dr.
Petsev for his encouragement even as an undergraduate. Dr. Atanassov for consistently
helping when I needed something fixed (which was often). Dr. David Wheeler for moral
and chemistry support. Adam Rowen for believing in me and bringing me into this field,
I would not have been the same person without him (so blame him). For all of the help
with specific focuses in this project, Dr. Alam with NMR and Gaussian, Dr. Tappan and
Dr. Knepper for calorimetry, Dr. Kotula for his work with the TEM and Bonnie
McKenzie for her work with on the SEM. Along with everyone else on my team and that
I’ve meet along the way, just to name a few: Christian, Jamin, Brian, Hannah, Arthur,
Serena, Chelsea, Kelsey, Chris, Josey, Jaclyn, Kyle, Mani, Harry, Travis, Ed, Drew,
Sarah, Sara, Dennis, Graham, Eric and my family.

iv
ELECTROCHEMICAL FABRICATION OF
ENERGETIC THIN FILMS
By
Jonathan Coleman
B.S. Chemical Engineering, University of New Mexico
Albuquerque, New Mexico 2010
Ph.D., Engineering, University of New Mexico, 2016
Abstract
Energetic thin films have use in many technologies and are currently fabricated as
either pressed pellets that suffer from low packing density, or expensive physical vapor
deposition techniques. The stringent material and structuring requirements that make
these films effective limit the fabrication and material choices. My aim was to investigate
the design of a new fabrication process, using some of the current best commercially
available films as a design guide while reducing the process cost. These films are
nanostructured aluminum and nickel compounds.
Electrochemical codeposition allows for fabrication of a multi-phase film at low
temperatures with high control over the structuring and composition. Because of the ratio
of the components that are desired in the film, it is necessary that the matrix phase be
aluminum and the particle phase be nickel, where the free floating particles are
incorporated into the growing electrodeposited matrix metal. The particles become
incorporated based on the number of particles in solution as well as fluid flow in the

v
reactor and the electrodeposited matrix growth rate. The growth of the matrix is crucial to
the process of particle incorporation and must be well understood.
The diffusion rate of the electroactive species and the kinetics of the reduction
process are important parameters in an electrocodeposition process. The matrix growth
rate must be high enough to incorporate particles, and the flux of the electroactive species
to the electrode, a combination of diffusion and convection, must be higher than the rate
of consumption. It was found that the diffusion rates of the reducible species can be
modified heavily with the addition of dilution agents in the electrolyte. The optimal
conditions for dilution correlate to the maximum conductivity of the solution, which
exhibits a maximum based on the increasing diffusion rates and decreasing ionic
concentration with added dilution, and different dilutions have varied effects. The
diffusion also shifts with changing ionic liquid composition, which modifies the open
volume of the electrolyte and improves hole mobility. There is a two to four-fold increase
in diffusion rates between static and dynamic conditions, and this is thought to be
attributed to decreasing electrostatic attractions between the ions, evidenced by the shear
thinning properties of the ionic liquid electrolyte.
The kinetics can be modified with both temperature and the overpotential applied
and does not change with composition. Increasing temperature also increases the
diffusion rates, although to a lesser extent than the kinetics. Control of the diffusion and
kinetics of the matrix growth will lead to optimization of particle incorporation.
The codeposition of particles is a complex process and empirical tests as well as
theoretical modeling are used to determine improved conditions to reach the desired
composition and dispersion. At high agitation the particles experience too much shear

vi
force, leading to too low of residence time on the electrode and no incorporation. Too
low of flow leads to a buildup of particles on the electrode surface and a spongy porous
film. Initial tests of codeposited films show ~12-20% nickel incorporation, shy of the 30-
40% target and ~5 nanometer interfacial mixing properties, matching that of the
commercially available films.

vii
Table of Contents Acknowledgements .......................................................................................................... iii
Abstract ............................................................................................................................. iv
Table of Contents ............................................................................................................ vii
Chapter 1: Introduction ................................................................................................... 1
1.1 Thermal Batteries and Heat Sources ................................................................................. 1
1.1a Heat Source Requirements ............................................................................................ 2
1.1b Current Heat Source Materials .................................................................................... 3
1.1c Improving Heat Sources Using Intermetallic Films .................................................... 4
1.1d Current Fabrication of Intermetallic Film .................................................................. 6
1.1e Electrodeposition Fabrication Methods to Reduce Cost ............................................ 8
1.1 Electrocodeposition ...................................................................................................... 11
1.2a Fabrication of Intermetallic Films – Nanoscale and Conductive Incorporations .. 12
1.2b Sedimentary Deposition Techniques to Increase Incorporation ............................. 14
1.2c Mitigating Particle Agglomeration ............................................................................. 18
1.2e Matrix Deposition ......................................................................................................... 20
1.2 Aluminum Deposition History .................................................................................... 22
1.3a Aprotic and Hydride Baths ......................................................................................... 22
1.3b Aromatic and Dimethyl Sulfone Baths ...................................................................... 23
1.3c Molten Salts and Ionic Liquids ................................................................................... 24
1.3 Ionic Liquids for Aluminum Deposition .................................................................... 24
1.4a Cations, Anions and Co-solvents ................................................................................ 25
1.4b Properties – Viscosity, Conductivity and Mobility ................................................... 28
Chapter 2: Aim of This Work ........................................................................................ 32
Chapter 3: Experimental ................................................................................................ 35
3.1 Chemical Cleaning – Ionic Liquid Preparation .............................................................. 35
3.2 Karl Fisher Titration ......................................................................................................... 38
3.3 Density ................................................................................................................................. 39
3.4 Rheology ............................................................................................................................. 39
3.5 NMR .................................................................................................................................... 41
3.5a Al27 NMR ..................................................................................................................... 41

viii
3.5b Proton Pulse Field Gradient Spin Echo Nuclear Magnetic Resonance
Spectroscopy ......................................................................................................................... 42
3.6 Electrochemistry ................................................................................................................ 43
3.6a Cottrell Model .............................................................................................................. 44
3.6b Rotating Disc Electrode ............................................................................................... 45
3.6c Nucleation Mode Tests ................................................................................................. 46
3.7 Conductivity ....................................................................................................................... 46
3.8 Falling Ball Viscosity ......................................................................................................... 47
3.9 Scanning Electron Microscopy and X-ray Dispersive Spectroscopy ............................ 49
3.10 Energy Release Differential Scanning Calorimetry ...................................................... 49
3.11 Transmission Electron Microscopy ................................................................................ 49
3.12 Modelling .......................................................................................................................... 50
3.12a COMSOL .................................................................................................................... 50
3.12b Gaussian...................................................................................................................... 50
Chapter 4: Aluminum Deposition - General ................................................................ 51
4.1 Aprotic Solvents ................................................................................................................. 51
4.2 Aromatic Solvents .............................................................................................................. 53
4.3 Ionic Liquids General ........................................................................................................ 55
4.3a Ionic Liquid Water Content Reduction ..................................................................... 56
Chapter 5: Butyl Methyl Imidazolium AlCl3 Ionic Liquids and Co-Solvents ........... 58
5.1 NMR Speciation Analysis .................................................................................................. 58
5.2 Electrochemical Testing – Cyclic Voltammetry .............................................................. 61
5.3 Deposition Testing and Results ......................................................................................... 62
5.4 Optimization of Deposition with Dilutions ...................................................................... 64
5.4a Diffusion vs. Dilution – Cottrell .................................................................................. 64
5.4b: Conductivity vs. Dilution, Optimal Conditions ....................................................... 66
5.5 Room Temperature Kinetics – Rotating Disk Electrode ................................................ 68
5.6 Tafel Model and Low Charge Transfer Kinetics at Room Temperature ..................... 70
5.7 BMImCl and Dilutions Conclusion .................................................................................. 72
Chapter 6: Increasing Kinetics with Elevated Temperature – Ethyl Methyl
Imidazolium Cations ....................................................................................................... 74
6.1 Density ................................................................................................................................. 74
6.2 Diffusion – Cottrell ............................................................................................................ 76

ix
6.3 Aluminum Reduction in Dynamic Conditions ................................................................ 78
6.3a Rheology - Composition, Temperature and Shear Dependence .............................. 80
6.3b Reaction Kinetics and Temperature – RDE Levich ................................................. 82
6.3c Profiling Diffusion and Kinetic Limitations .............................................................. 93
6.4 Analysis of Anionic Mobility ............................................................................................. 95
6.5 Mobility in Static Regimes ................................................................................................ 98
6.5a Conductivity ................................................................................................................. 99
6.5b PGSE – Imidazolium Diffusivity .............................................................................. 101
6.5c AlCl4- Diffusivity from Conductivity ........................................................................ 102
6.5d Ionic Size Comparison and Mobility Differences – Gaussian ................................ 108
6.6 EMImCl AlCl3 IL Electrolytes Summary ...................................................................... 111
Chapter 7: Particle Incorporation and Testing – SEM, EDS, DSC ......................... 115
7.1 Incorporation onto Rotating Disk Electrodes ............................................................... 115
7.2 Increase Incorporation with Sedimentary Codeposition.............................................. 117
7.3 Decrease Agglomeration with Surfactants .................................................................... 120
7.4 Improve Plating with Reactor Design – COMSOL ...................................................... 124
7.4a Modelling CFD and Particle Tracing ....................................................................... 126
Chapter 8: Intermetallic Alloying and Passivation – TEM ...................................... 128
Chapter 9: Conclusions ................................................................................................ 130
Appendices ..................................................................................................................... 138
Appendix A: Nucleation and Growth Mode Testing .............................................................. 138
Appendix B: Material Compatibility ................................................................................... 140
Appendix C: BMImCl ILs and Dilutions, Images/SEMs ................................................... 142
Appendix D: Viscosity Data .................................................................................................. 154
References ...................................................................................................................... 161

1
Chapter 1: Introduction
1.1 Thermal Batteries and Heat Sources
Thermal batteries are composed of inorganic salt electrolytes that are solid at
room temperature and use elevated temperatures to operate. Prior to activation, the solid
electrolytes are relatively nonconductive and inert, leading to very long shelf lives with
negligible self-discharge. Thermal batteries can be used up to 25 years after production
with very high reliability and negligible degradation [1]. The components of a thermal
battery are shown in Figure 1.
Figure 1: Thermal battery design, temperature is determined by calorific output of heat pellets and insulation design
To activate the battery, a heat source is ignited and the temperature increases to
melt the electrolyte. The heat source is an integral component of the thermal battery and
the battery activation time is dependent on the ramp up of temperature of the system.

2
Systems can be activated in milliseconds to hundreds of milliseconds in larger systems.
The battery use time is primarily dependent on the ability to keep the electrolyte above
the melting point, which is determined by the energy supplied by the heat source and the
insulation of the system. Once activated the battery can last anywhere from seconds to a
few hours providing high capacity electrical energy in primary, one-time use
applications. All thermal batteries are designed for specific power output and application,
and improving certain components of the battery will allow for wider use. Many factors
are important in the design of thermal batteries including the electrolyte, electrodes,
insulation, heat source and stack [1]. The primary focus here will be the heat source.
1.1a Heat Source Requirements
Although there are many factors that dictate the performance and applicability of
a heat source, foremost are energetic density and heat output rate. These films are often
required to be stable over long periods of time to prevent degradation or misfires but
energy release should also be easily and reliably initiated when desired. The reaction
must also be gasless due to the battery being in a sealed case, and will be either a
conductive or insulating product film, based on specific design needs. Traditional heat
sources are based upon deflagrating reaction couples such as oxide exchange processes or
fuel and oxidizer mixes[2]. While these are widely applied to thermal batteries, they
suffer from slow reaction rates, low conductivity, and significant gas generation. The heat
source is a crucial component of the system and improvements will lead to better overall
thermal battery performance and improving reliability, capability and reducing costs
would allow it to reach larger markets. Improvements that can be made over current heat
3
source technology are faster ignition times that result in faster activation times for the
battery, lower gas generation, and increased energy density. Careful consideration of
components is a first step in designing improved energetic thin films.
1.1b Current Heat Source Materials
There are currently two principle types of heat sources in thermal batteries, heat
paper and heat pellets. Both of these produce acute high temperatures and the choice
between pellet and paper is determined by the need for electrical conductivity. Heat paper
is insulating and can be used to transfer heat between cell stacks without shorting,
providing a heat source and eliminating electrical conduction between cells and to the
cell case. Heat pellets conduct electricity and can be used in between cells in a stack
negating the need for additional conducting wires or components. The iron powder heat
pellets can’t be manufactured with the highest energy stoichiometry, as excess iron is
needed to improve the electrical conductivity after combustion, producing 920 J/g (3082
J/cc at 53% packing) at 88% Fe [1]. The fabrication of these heat pellets starts from
powder forms which are mixed and then pressed into wafer like discs to be inserted into
the thermal batteries. These pellets are formed with approximately 60 tons of forming
force and are generally highly porous, with about 50% of the theoretical density which
leads to lower volumetric energy output [3]. The unpressed and pressed Fe KClO4
powder are demonstrated below in Figure 2.

4
Figure 2: Heat pellets formed from powder pressing
1.1c Improving Heat Sources Using Intermetallic Films
Recently, intermetallic reactions between elemental metals have received
attention as a thin film template that is fast, high energy, easily initiated and gasless.
These energetic reactions have immediate use in thermal battery, microbrazing/soldering
and MEMS device applications as well as any other area where point heating is required
[4-11].
Intermetallic heat films will be electronically conductive before and after firing
and therefore are comparable to the conducting heat pellets that are commonly made of
iron powder and potassium perchlorate. These intermetallic films require nanostructuring
of the elemental components to minimize the solid state diffusion distances and increase
reaction rates. Nickel aluminum composite films release a large amount of energy when
mixed at the atomic level and achieve high temperatures (1500 C) in millisecond
timescales, having 8451 J/cc heat release at the optimal stoicheometry [1, 8, 9, 12-15].
The heat output of these nickel aluminum flms have been calculated at varying
compositions and it is shown that the maximum heat generation is at the one to one
stoichiometric ratio, shown in Figure 3. This is the target composition for film fabrication
although many films only reach Al3Ni2 final composition [5, 14, 16].

5
Figure 3: Theoretical energy released during alloying
Total heat release is determined by the overall quantity of heat source material,
and the reaction rate can be modified by the geometry of the separate phase volumes. If
the phases are large the long diffusion distances may limit the reaction and leave unmixed
components in the film, or release heat too slowly to achieve desired temperature ranges.
The structuring of the components is therefore critical to the function of these films,
necessitating a complex fabrication process. Theoretically, decreasing the diffusion
distances should always increase the reaction propagation rate; however, in practice other
factors demonstrate an optimum phase size as shown in Figure 4, demonstrating a
difference between calculated and experimental results. The theoretical reaction rate
increases continually with the progress to smaller phase sizes while the experimental
drops to zero at approximately 10 nm. The reaction velocity decreases at very low

6
thicknesses is attributed to intermixing of the Ni and Al reactants at the phase interface,
which becomes more relevant as the volume of interfaces increase [4, 17].
Figure 4: Reaction velocity dependence on bilayer thickness, experimental vs. theoretical [12]
Special consideration must be taken so that the film dissipates energy at a rate that
satisfies the fast activation desired in thermal batteries, that the film are reacted
efficiently to minimize material waste, and that the reaction rate is controlled such that it
reaches temperatures high enough for the cell to operate but not too rapid such that it
reaches temperatures high enough to damage components of the cell (e.g. the electrolyte
generally has limited stability against the electrode at temperatures 600° C and above)
[1].
1.1d Current Fabrication of Intermetallic Film
While the thermodynamics will dictate the total energy released by the reaction,
the initiation and self-propagation properties are primarily controlled by diffusive
limitations. The components are solid state and therefore demonstrate minimal
diffusivities. This makes them useful as heat sources, because they have a long shelf life.

7
The self-propagating reaction characteristics of these films, once initiated, require the
heat generation to greatly exceed the rate of heat dissipation to allow the temperature in
the film to rise. The increased temperatures create a regime where diffusion rates are high
enough for the components to continue mixing. As the diffusion rates can only be
accelerated by temperature to a certain extent, it is necessary that the mixing phases be
nanostructured to decrease the diffusion distances. The nanostructuring between reactant
phases improves reaction speed and self-propagation reliability [4, 5, 7, 8, 11]. The
higher reaction rates can also generate higher reaction temperatures, though the
maximum temperatures reached are also dependent on the insulation and heat loss of the
system.
There are as many or more methods of processing the various aluminum alloys as
there are aluminum alloys, but fabricating these thin films presents challenges as the
aluminum and nickel phases must be distinct, relatively pure and have high contact
surface area. The necessary nanostructuring in these films is currently fabricated using
physical vapor deposition (PVD) methods. This sputtering process deposits layers of
nickel and aluminum that are alternatively coated onto a substrate at 20-30 nanometers
(nm) each, and this step is repeated until a suitable thickness is achieved (40-150
micrometers). A diagram of these sputtered films and their energetic reaction is shown in
Figure 5. The multiple layer process demonstrates relatively poor material and time
efficiency. The remedy of this issue is the subject of this dissertation.
8
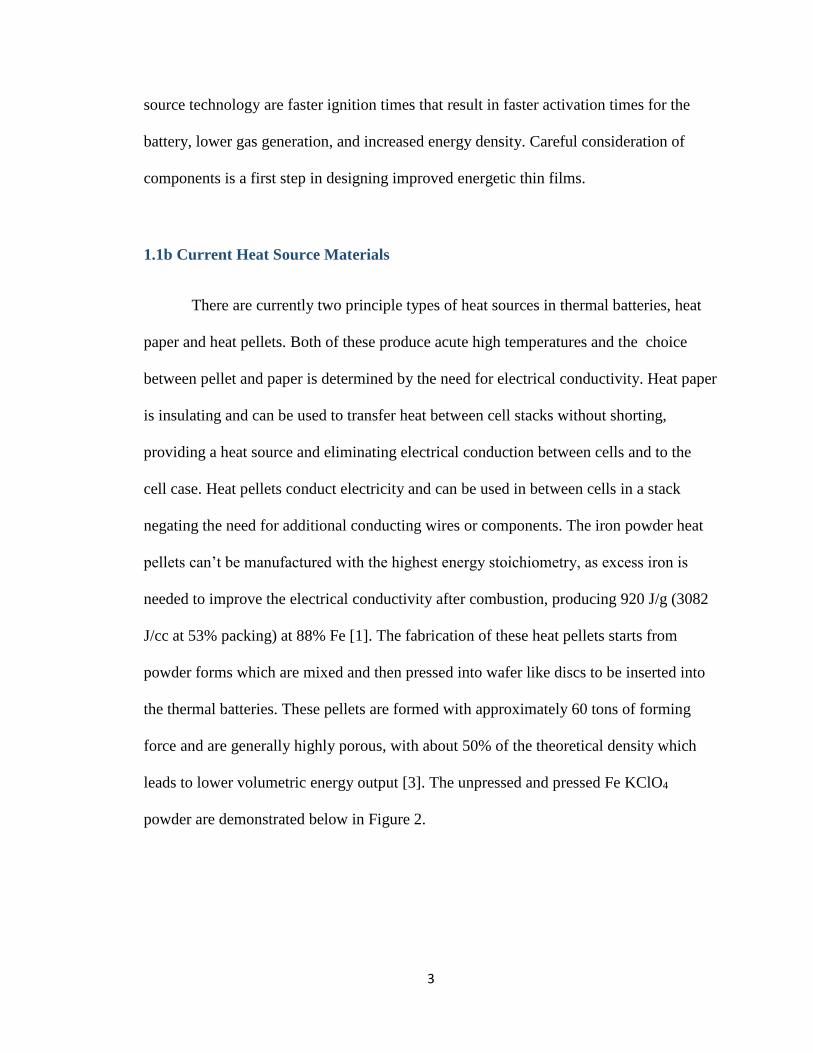
Figure 5: Reaction Initiation in Bilayer Foil Thin Films [12]
The many steps required in this PVD process, as well as operations performed
under high vacuum, lend to long processing time requirements and expensive equipment,
all of which contribute to a high unit cost (on the order of $100/cm2 for certain
commercial foils). The electrochemical deposition of multiple phase films has been
accomplished for decades and is a prime candidate for the fabrication of intermetallic
energetics. Electrodeposition is inherently material efficient and the process could
produce a composite film faster and cheaper than currently used physical vapor
deposition (PVD) methods. The capability to electrochemically deposit aluminum nickel
films will prove useful for many fields of industry.
1.1e Electrodeposition Fabrication Methods to Reduce Cost
The technology of electrodeposition has been implemented for centuries in
industry for both decorative and functional coatings and more recently in the MEMS and
electronics fields [18]. Advantages for the use of electrodeposition over evaporation
techniques include the ability to grow films at ambient pressures, inherent material
efficiency and the capability to deposit multiple phases in a single step with codeposition
methods. Since the films are reactive and intermetallic alloying is accelerated by
increased temperature, the fabrication temperature is limited. The alloying reaction is
very fast beginning around 130˚ C, so the maximum temperature option for fabrication

9
techniques was set to 100˚ C. There are several methods to produce an aluminum and
nickel composite film; they are detailed below as well as reasons for and against their
use.
The immediate counterpart to the physical vapor deposition (PVD) process would
be to electrochemically deposit alternating nickel and aluminum layers, each from
separate chemistries. In this way we could enhance the material efficiency of the process,
but would likely increase the fabrication time. To achieve the desired results it will be
required to fabricate the film in a single step.
It is possible to change the deposited phase composition during electrodeposition
in an electrolyte without changing the electrolyte composition. This is done by changing
the applied parameters (e.g. voltage, temperature, flow characteristics, etc.). In this way it
is possible to develop a mixed electrolyte with both nickel and aluminum precursors and
change the deposition parameters to produce distinct layers. This will result in a compact
and uniform film; but while it would be possible to deposit a pure nickel phase,
depositing a pure aluminum phase is likely impossible. The potential for any energy
release will be reduced or eliminated if the aluminum phase already has nickel
incorporated in it during fabrication.
Another approach is to deposit the phases as already solid composites, and not
allow any mixing to happen until the desired ignition time. Although not technically an
electrochemical deposition process, electrophoretic deposition, where particles
electrophoretically migrate to the electrode and deposit onto the substrate, is a potential
candidate in the fabrication of the energetic films. The concept would be to mix nickel
and aluminum particles in a specific ratio, suspend them in a liquid with appropriate

10
conductivity, viscosity and stability, and then drive them to deposit on the substrate with
electronic potential. This approach does not require any chemical reactions during
fabrication and therfore is simpler than the other methods. This process is very similar to
sintering powders and shares some the same problems, such as low packing density and
difficulty in controlling particle composition distribution. The low packing density can
hinder reaction propagation and will result in a significantly lower energy density in the
film.
The best option for producing a composite film in a single step is electrochemical
codeposition. This entails the electrochemical reduction of one phase as the matrix, while
a second phase exists in the electrolyte as suspended particles and is incorporated in the
film through entrapment. This method will produce a compact film that is distinctly two
separate and pure phases. The nickel and aluminum binary system can be created through
the reduction of nickel species as the matrix and the incorporation of aluminum particles
or vice a versa. A codeposited film is shown in Figure 6.
Figure 6: Codeposited film example [16]

11
1.1 Electrocodeposition
Electrodeposition is a powerful fabrication technique that is inherently efficient
and scalable. Electrochemical codeposition is an extension of this process where
composite structures can be formed. This process entails incorporating particulates of one
constituent into an electrodeposited matrix of another constituent. By adjusting the
concentrations of the components, their transport properties, and reaction properties, the
stoichiometry can be tailored and controlled[19]. This method leads to phase separated
deposits with control over the inclusion phase size and distribution, as well as the ability
to electroform molds at thicknesses unachievable in comparable lift-off processes, with
significant decreases in time and cost.
While this process has been used to good effect for nonconductive particle
inclusions, to date there is less reported work on nano or all metal composites formed in
this manner [18-50]. The use and capability of the codeposition process can be traced
back to incorporating graphite particles in copper coatings for self-lubricating
components in car engines in 1928[19]. The study of these methods steadily increased
until the 1990s, where the advantages of composite coatings became apparent in new
areas such as electro and photocatalysts and continued with the increasing interest in
micro and nanostructured materials[51]. Karbasi et al. worked with incorporating TiC in
nickel films to improve wear resistance and claims that “among the processes used to
produce nano structured composites, the electrodeposition technique has been shown to
have a smoother surface, a better bonding between particles and metal and higher micro
hardness”[23]. While the principles of codeposition have been known for decades the

12
mechanism and optimized conditions are not well understood. This is likely due to the
immense number of variables that are inconsistent in each chemistry and application.
Some parameters that influence the particle incorporation are the current density,
convection in the cell, particle concentration, type, size and shape. The important
concepts of a codeposited particles are broken into two sections, the first is the transport
of the particle and its adsorption to the substrate surface and the second is the concurrent
metal deposition. The forces on the particle are summarized in Figure 7, and are the
stagnation forces, shear forces from flow of the electrolyte, friction opposing the
direction of shear and the adhesion forces from the particle [50].
Figure 7: Forces on a particle adsorbed on the substrate [50]
1.2a Fabrication of Intermetallic Films – Nanoscale and Conductive Incorporations
The parameters and forces that are involved in the codepostion process to be
developed in this work need to be systematically controlled to acheive the required
particle incorporation. The particles must be nanoscale, as the necessary structuring

13
requires nanoscale diffusion distances. The nanoparticles exhibit low body force to
surface force ratios, necessitating high control over many deposition parameters sionce
the shear forces will be relatively large compared to the other forces.
The Guglielmi model is a mostly empirical representation of the adsorption and
matrix growth process and is a physisorption of the particle from the electrolyte followed
by chemisorption and incorporation [52]. This is shown in Figure 8 and is influenced by a
Langmuir type adsorption constant, deposition current density and particle loading.
Figure 8: Particle Entrapment
Generally, when incorporating conductive particles, the film is spongy and porous
as the particles allow the reducible species to deposit on the surface of the film and
matrix growth is not restricted to the substrate. On the other hand, if the particles are not
in contact with the surface for enough time (beyond the critical residence time) the
particles get preferentially coated with the matrix metal and removed without being
incorporated. The rate of particle arrival to the substrate, the residence time of the particle
and the growth rate of the metal must be matched and optimized to minimize lost
particles and porosity in the deposited film. Examples of circumstances with too high or
too low of shear on the substrate with respect to matrix growth rate is shown in Figure 9.

14
Again, the shear forces due to fluid flow are exceptionally influential as the particles are
nanoscale, and the surface forces are exceedingly strong, and balancing particle loading,
electrolyte flow and deposition rate will be critical in acheiving the deseired
stoichiometric ratios, qualtiy depositions and satisfactory deposition rates.
Figure 9: Examples of too Low or High of Shear During Codeposition
1.2b Sedimentary Deposition Techniques to Increase Incorporation
Development of this process would find use in thermal batteries,
microbrazing/soldering, joining, cauterization and microelectromechanical systems
(MEMS) device applications as well as any other area where point heating is required [5,
8, 10, 17, 53]. The energy output of the codeposited film will depend on the ability to
incorporate particles into the matrix at the desired stoichiometry, size and geometry. This
process can be optimized by modifying the electrolyte, particle chemistry/dimensions,
reaction vessel, temperature, and matrix deposition mechanism [18]. To achieve the high
15
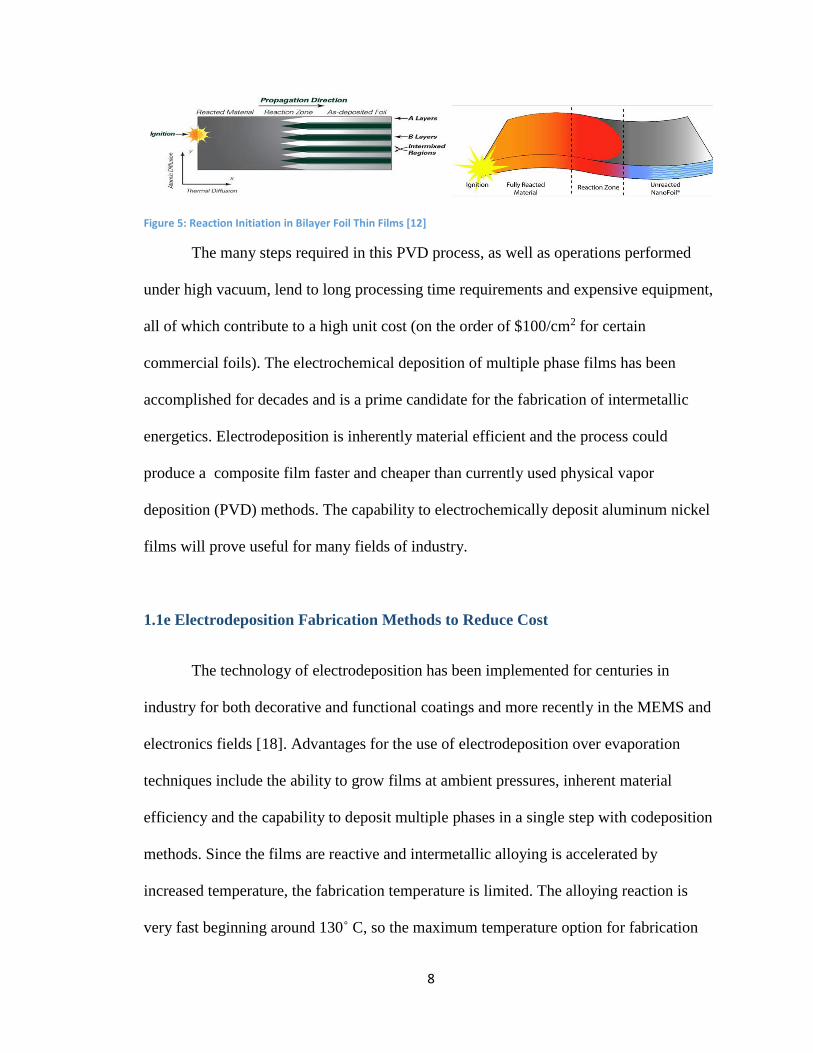
required particle loadings, sedimentary codepositon may been implemented.
Sedimentary codeposition adds the influence of gravity to bring more particles to the
substrate and increase their residence time. A schematic of the sedimentary codepostion
apparatus is shown in Figure 10.
Figure 10: Sedimentary Codeposition Processes
The incorporation of particles needs to be well controlled, as poor dispersion of
particles, low particle incorporation or too large a particle size will lead to long diffusion
distances and times in the thin film, causing the energetic reaction to quench. The
structuring of the components necessitates a fabrication process that controls this
distance.
Codeposition for the specific purpose of producing energetic thin films is an
applicable process because it has the capacity to produce nanostructured composites at
high rates, potentially 100 of um/hour, and temperatures low enough to minimize solid
state reactions. Success relies on the depositing matrix phase being smooth and dense and

16
the particulate suspension homogeneously dispersed in the electrolyte and have adequate
transport to the electrode.
The electrochemical codeposition depends on the ability to transport the
suspended particles to the electrode. Particle transport is influenced by several
fundamental forces including diffusion, convection, electromigration, gravitational, and
magnetic depending on particle properties. A higher concentration of particles in the
electrolyte leads to a higher incorporation in the film but reaches a maximum and further
loading increases the solution viscosity and reduces the conductivity without benefit [30].
Conditions must be optimized considering all factors, as differing particles sizes and
systems require different conditions, as shown in Figure 11.
Figure 11: Particle Incorporation Dependence on Particle Size [27]
Physical agitation is the primary method for keeping particles suspended and
bringing them into contact with the electrode. This trend exhibits a maximum but then
also decreases rapidly [30]. Low agitation near the electrode does not seem to exhibit
much influence on particle incorporation in the case of micron sized particles, but
increases as the regime shifts towards more turbulence. The trend then begins to decrease

17
as increased turbulence decreases the residence time. This is likely due to increased
particle convection towards the electrode with increasing agitation and then at a critical
point, depending on solution viscosity and particle size, the shear forces drive the
particles off of the electrode before they can be entrapped. This trend is shown in Figure
12.
Figure 12: Particle incorporation dependence on particle size and agitation [27]
The Guglielmi model describes the incorporation of particles by first a weak
agglomeration on the surface and then a kinetically controlled irreversible adsorption and
entrapment by the metal matrix [26]. This model has been shown to be viable in many
codeposition systems, including metal particle inclusions although only in aqueous
chemistries[54]. Other models have expanded on the Guglielmi model but system
responses vary on a case by case basis, the Guglielmi model remains a good measure of
important initial parameters.
The reduction of the matrix material to its metallic state is also central to the
codeposition process. Higher percentages of the matrix material result in a decrease in

18
particle incorporation volume, so controlling the relation of particle arrival to matrix
deposition rate is essential. It has been shown that increasing the particle loading in the
electrolyte will lead to increased particle incorporation in the film, and decreasing the
matrix precursor concentration in the electrolyte will also lead to increased particle
incorporation at a given reduction potential [41]. To further increase the particle
incorporation, it has been observed that decreasing the deposition rate allows more
particles to adsorb to the surface during film growth, increasing the particle concentration
in the film[30]. Decreasing the rate can be achieved through decreasing the current
density applied or moving to a pulsed deposition. The pulsed deposition is preferred as
the deposition characteristics of a certain plating regime can be kept, and too low of a
current density can result in poor deposit qualities. Optimum micron and submicron
particle incorporation is in the realm of lower current densities, while nanoparticle
incorporation benefits from slightly higher current densities [28]. These trends are
consistent with most experimental and theoretical results, but the correlation values can
vary significantly depending on the system under investigation; most of the properties
and trends have to be confirmed for a specific system in question [19].
1.2c Mitigating Particle Agglomeration
Physical and chemical methods can be used to improve migration of the particles
to the cathode. Surfactants will slow particle agglomeration, improve suspension stability
and can control zeta potentials increasing electromigration toward the electrode[28].
Many particles have been incorporated in various metals in aqueous solutions, namely
copper composites with particles kept in solution by rapid stirring [54]. The size

19
distribution shifts if the particles agglomerate. Particle agglomeration can have important
consequences for particle transport, as larger particles tend to settle more rapidly under
gravity but diffuse more slowly. Stable dispersions result from modifying attractive and
repulsive forces. The theoretical background for stable colloidal solutions is derived from
DLVO (Derjaguin-Landau-Verwey-Overbek) theory [55]. The attractive Van der Waals
forces and repulsive electrostatic forces compete and are modified by controlling the zeta
potential. Figure 13 emphasizes the importance of surface modifications to control the
electrostatic charge, generally zeta potentials of 30 mV or higher result in stable colloid
solutions.
Figure 13: Colloid stability based on zeta potential [55]
Sodium dodecyl sulfate is a common additive in aqueous chemistries and was
reported to improve dispersion, uniformity and quantity of SiC particles in a nickel
deposit[22], but the additive used will have varying efficacy depending on both the
particle and electrolyte properties. Accurate investigation of particle properties in the
electrolyte is important for understanding suspension, transport and incorporation. Ionic
liquids tend to keep particle suspensions stable over relatively long times, due to both
increased viscosity as well as increased charge screening. Surface modifications could be
oxide layers, adsorbed ionic species or long chain surfactants. Controlling particle

20
agglomeration is crucial as agglomerated particles reduce surface area and will decrease
component mixing rates if translated into the energetic thin film.
1.2e Matrix Deposition
In a nickel aluminum film it is evident there are 2 choices for configuration, use
of Ni as a matrix phase with Al particles, or the use of Al as the matrix phase with Ni
particles. Nickel ion reduction occurs at -0.23 V vs. NHE, which is well within the
electrochemical limits of water (water will reduce at potentials more negative -0.83 V vs.
NHE). Since nickel can be deposited in aqueous chemistries this process was developed
in the early 1800s, a nickel deposition process was first patented in 1840, and has been
used regularly since [56]. This process would be ideal but there are some limiting factors.
The greatest benefit would be the use of an aqueous electrolyte, but aluminum particles
readily form an oxide layer in water and it can be a substantial portion of the particle
volume. The codeposition process is also limited in ability to incorporate high volumes
of particles, as the matrix is almost always a significantly higher volume portion of the
film, and stoichiometrically desired mixtures are NiAl or Ni2Al3 because of the higher
energy density, and these are Al rich by volume. Given the density differences of nickel
and aluminum, the film must be 60% or greater aluminum and therefore aluminum is
required to be the matrix material to achieve optimal stoichiometric ratios for the
maximum heat output. Achieving this ratio with conventional electrocodeposition
processes is not possible (limited to <30% volume particles, increases to 40% with
sedimentary codeposition processes).

21
Aluminum is the most abundant metal on the earth’s crust, and its low cost makes
it a good material candidate in most fabrication processes. It has a variety of properties
that make it ideal for use in many applications such as high thermal and electrical
conductivity (59% of copper and 30% less weight), a high strength to weight ratio when
alloyed with other metals, and good resistance to corrosion [57]. The properties of
aluminum and aluminum alloys have value in applications of almost every field from
aerospace to micro-electronics. The original production of aluminum from aluminum ore,
primarily bauxite, is a complex, long and energy intensive process that involves high
temperature melts and electrochemical methods. Recycling of this metal, however, is
theoretically capable of 100% material efficiency and can require as little as 5% of the
energy of original production [57].
Since aluminum reduction occurs at -1.67 V vs. NHE, aqueous solutions are not
applicable as electrolytes (water reduces to hydrogen gas at -0.83 V, nickel reduces at a
more noble potential as well, this is why the use of a combined bath for layer by layer
growth is limited; a pure aluminum phase can’t be deposited with the exclusion of nickel
in a mixed chemistry). Aluminum deposition requires an electrolyte with an
electrochemical window that is stable during the aluminum reduction, it must facilitate
the aluminum reduction process and must have high precursor solubility and suitable
ionic conductivity. There are many electrolytes that could fit these criteria, they include
high and low temperature molten salts as well as many aprotic solvents. From an
engineering standpoint it is important to choose an electrolyte that is low cost, easy to use
and has high quality control [18, 52].

22
1.2 Aluminum Deposition History
Many variables need to be considered when choosing or designing an electrolyte,
especially so when objectives such as high quantity conductive nanoparticle codeposition
are involved. In general, there are 4 classes of components. The solvent is usually the
largest portion of the electrolyte. A precursor is the source of material or ions that lead to
the desired reaction (in this case an aluminum salt that will reduce to aluminum metal).
Conducting salts are used to increase the ionic conductivity of the chemistry and are
stable in the operating regime and do not react with the ions or electrodes. Addition
agents can adsorb on the electrode surface and modify deposition morphology
characteristics, while complexing agents can shift reduction potentials of components in
the electrolyte, making them more or less active [18, 52].
1.3a Aprotic and Hydride Baths
Early aluminum deposition revolved around aprotic solvents that were typically
volatile [58]. Many organic solvents have unsuitable electrochemical windows (e.g.
acetone, alkyl halides etc.). Some of the first production electrolytes used diethyl ether,
and there was significant work done to improve this chemistry. Initially the chemistry
was 2-3 mol/L AlCl3 in diethyl ether, with 1 mol/L LiH. LiAlH4 was substituted out for
LiH in lower concentrations, which improved the deposition properties, but the bath
suffered drawbacks such as high fire hazard, limited lifetime, need of frequent
composition control and low current efficiency at the anode, as well as hydrogen
generation and subsequent embrittlement [59]. Many replacement solvents were found,

23
one of the more notable systems based around Tetrahydrofuran (THF) [60-64]. Addition
of aromatic solvents to the THF bath improved preparation and operating conditions but
reduced the total throwing power of the chemistry, likely due to the increased viscosity
and reduced conductivity [65].
1.3b Aromatic and Dimethyl Sulfone Baths
Since the solutions made from early aprotic solvents are typically volatile,
hygroscopic and difficult to handle, deposition of aluminum from lower vapor pressure
aromatic hydrocarbons became a concurrent/next gen low temperature aluminum
deposition process [58, 59, 66, 67]. Since AlF3 is insoluble in aromatic hydrocarbons and
AlCl3 shows very low solubility, AlBr3 was used and these electrolytes are known as
bromine baths. Non-complexed bromine baths are simple two component electrolytes but
suffered from low conductivity and throwing power. To increase the conductivity various
additives were implemented, mainly alkali halides. These baths showed high current
efficiency and homogeneous deposits with good adherence but these properties were
mostly only seen at very low current densities (~1 mA/cm2). The dimethylsulfone and
AlCl3 bath is a prime candidate for electrodeposition of aluminum and has already
demonstrated high deposition rates and thicknesses [68-72]. These DMSO2 solutions
have successfully codeposited Si, SiO2, Al2O3, TiB2, and hexagonal BN particles in an Al
matrix, while the only drawbacks are the required operating temperatures of 120-150°C
and slight impurity incorporation (sulfur and chlorine) although Al purity is >99% [73,
74].
24
1.3c Molten Salts and Ionic Liquids
Molten salts (MSs) are unique electrolytes, for example, NaCl and AlCl3 salts at
the right ratio is liquid at ~150 C, since it is a liquid additional solvents are not required
and this allows for extremely high salts concentrations. The NaCl also complexes with
the Al precursor to form a reducible species, and the entirety of the solution is ionic
which contributes to its ionic conductivity [75, 76]. There has been an initiative to
produce MSs with lower operating temperatures, and salts with melting points below
100° C are commonly referred to as ionic liquids (ILs), in this dissertation IL will refer to
salts that are liquid at room temperature [77, 78]. Ionic liquids (ILs) are relatively new
electrolytes that have gained growing interest and understanding in the past 2 decades.
They are good candidates for electrochemistry because they can be designed to have wide
electrochemical windows, high salt solubility and negligible vapor pressures [79, 80].
Problems with molten salts usually include high viscosity, high operating temperature or
the room temperature ILs are relatively expensive.
1.3 Ionic Liquids for Aluminum Deposition
Chloroaluminate ILs have chloroaluminate anions and are considered first
generation. These chemistries are well designed for aluminum plating. The synthesis of
larger cation species has pushed the melting point and glass transition temperatures of
these salts below room temperature, although viscosities as still usually high compared to
molecular solvents. These viscosities are mostly due to the high electrostatic attraction
forces between the ions. When a salts such as butyl-methylimidazolium chloride

25
(BMImCl) or trimethyl phenyl ammonium chloride (TMPAC) is mixed with aluminum
trichloride (AlCl3) the Lewis acidity of AlCl3 forces a reaction that forms aluminum
anionic species including AlCl4- or Al2Cl7
- or higher order species depending on the
stoichiometry of the mixture [81, 82]. These cations and anions are bulky and have
delocalized charges, which decrease their attraction to each other and lower their ability
to orient and form solids. At appropriate ratios these chemistries melt well below room
temperature validating their use at ambient conditions. With regards to aluminum
deposition, the Al2Cl7- complex has been found to be the species that takes part in the
reduction process. For this reason, most aluminum plating in ILs utilize chemistries with
around a 2:1 AlCl3 to Cl component, as this promotes generation of the stoichiometric
Al2Cl7- species. Considerations such as cost, electrochemical stability, throwing power,
conductivity and efficiency need to be considered in determining the best system for
aluminum thin film fabrication.
1.4a Cations, Anions and Co-solvents
Ionic liquids were implemented to try and improve upon the organic solvents
listed above, the first that saw more widespread use was AlCl3 and ethylpyridinium
bromide (EPB) (2:1 molar) and saturated with benzene or toluene [59]. These deposits
were suitable for applications at the time, but suffer from photodecomposition, room
temperature melting only at the 2:1 ratio, and limited electrochemical window. N-(1-
butyl)pyridinium chloride (BPC) AlCl3 was a very popular IL of study about 25 years
ago, this solution had a wider electrochemical window than EPB, but it’s high viscosity
resulted in low ionic conductivity although it was still higher than typical non-aqueous
electrolytes. It was confirmed that the electrolyte could be improved with no drawbacks
26
by dilution up to 50 vol. % benzene [83, 84]. The benzene was shown to have no effect
other than decreasing the viscosity and increasing the solution conductivity [85].
Trimethylphenylammonium chloride (TMPAC) received considerable attention
due to its relatively low cost but has not seen use recently as the deposition quality was
always rough and thick compact coatings are difficult to achieve. AlCl3 TMPAC
solutions are liquid at room temperature only around the 2:1 molar ratio, however, at this
composition the freezing point is depressed to -70 ˚ C [58, 86]. Alkyl imidazolium
chloroaluminates such as 1-methyl-3-ethylimidazolium (EMImCl) and 1-butyl-3-
ethylimidazolium (BMImCl) seem to be the most widely investigated and used aluminum
deposition electrolytes presently. These solutions have electrochemical windows that
allow for significant overpotential with regards to aluminum reduction and much higher
conductivities that the previous generations. BMImCl AlCl3 solutions show higher ionic
conductivity and better quality deposition than TMPAC, and with 30 vol% dilution with
toluene give smooth adherent aluminum coatings [87]. The dilutions with aromatics
heavily influence the properties of the electrolyte, decreasing the solution viscosity,
breaking up electrostatic interactions and increasing the ionic mobility. Dilution with
aromatics such as benzene, toluene or ortho-dichlorobenzene (DCB) result in an increase
of ionic mobility and overall conductivity, as well as reduction in overall cost [85]. The
effects of these dilution agents vary with type and concentration, for example toluene has
very low viscosity but also low permittivity, high vapor pressure and limited miscibility
with chloraluminate ILs. DCB has higher viscosity and cost than toluene, but shows full
miscibility and higher permittivity. Diffusion of both the reduced species and particles
will influence the film composition, morphology and limiting growth rates. It is possible

27
to modify the viscosity of the electrolyte with temperature adjustments. ILs have been
measured to undergo several factors reduction in viscosity in only 60C change, this will
have a significant impact on the deposition and is investigated in chapter 6. Co-solvents
have a more dramatic and immediate effect as they can be as low as .5 cP and impart
their properties instantly when mixed in solution. Co-solvents however, greatly change
the electrolyte properties, regardless of how inert they are. The most negative
consequence of this is the imparted vapor pressure to the IL, as well as the possibility of
side reactions over the life of the chemistry. Optimal deposition parameters may require
a mixture of salts and solvents as well as additives and modified temperature of
operation. Neat EMImCl and AlCl3 mixtures deposit aluminum readily, these solutions
are higher conductivity and lower viscosity than the neat BMImCl solutions [58].
Much investigation has been done on the EMImCl solutions but it is still in the
early stages of development as a commercially applicable aluminum deposition
electrolyte [88-96]. This is evidenced by the continual publication of new papers
attempting to optimize and investigate the deposition process, as well as negligible
commercial use [87, 97-102]. Most of these papers investigate the temperature, potential
and composition parameters. It has been shown that quality deposits are nearly
impossible to achieve in low or no agitation regimes. This is likely due to the low
diffusion rates of the reducible species. The diffusion limitations can be overcome by
incorporating significant agitation of the solution but studies in this regard have not been
carried out thoroughly [96, 101, 103]. As evidenced by the strong influence of intentional
ionic species changes and addition of co-solvents, impurities strongly affect the ionic
liquid properties [104]. To minimize the impact of impurities in high precision

28
electrochemical and physical property investigations, cleanliness and purification is
required and has been developed quite thoroughly in the literature. As the Aluminum
species is extremely reactive and forms stable conformations when mixed with water or
oxygen is it very difficult to remove these components once the ionic liquid has already
been synthesized. Starting with clean components is the best and only way to ensure
consistent chemistries are produced [105, 106].
It has also been shown that ionic liquids do not function like molecular solvents in
regards to double layers near the electrode [79, 107-112]. ILs have a multilayer
architecture in the vicinity of electrodes and the electrodeposition of aluminum and
tantalum are strongly influenced [98]. These layers are affected by reduction potential
and shear, which force mixing and property changes in the IL. Development of the
understanding of these properties under dynamic conditions used for plating is vital in an
electrodeposition system. These properties effect the diffusion and availability of
reducing species, and the balance between diffusion and kinetics is fundamental to
controlling the growth mode and generating a smooth and compact composite film. The
kinetics are predominately controlled by the reduction potential and the temperature of
operation, and these variables also need to be investigated on a system by system basis.
1.4b Properties – Viscosity, Conductivity and Mobility
The viscosity is especially important in IL electrolytes as it is one of the weaker
points, typically the viscosity in ILs are an order of magnitude or higher than molecular
solvents, but most that are considered for use are below 100 cP. The viscosity of ionic
liquids is attributed to different inherent aspects. One theory is that ionic liquids are

29
viscous because the ionic mobility is restricted to hole transport and limited by the open
volume in the solution. These holes are typically small compared to the large ionic
species [113], and the higher attractive forces from the charged species result in smaller
free volumes than most molecular solvents (15-20% in ILs compared to 22-26% in
molecular solvents) [114]. The viscosity is also attributed specifically to the high
attractive electrostatic forces, although van der waals forces contribute some as well. This
has been shown by Tokuda et al in their extensive study of the physiochemical properties
of ionic liquids with varying cationic chain lengths, demonstrating that increasing the
chain length on imidazolium cations with a consistent anion species results in increasing
viscosity [115-119]. Tokuda et al. did a comprehensive study including the diffusivities
of the ionic species derived from pulse field gradient spin echo NMR and showed that
there is significant alignment with the summation mobility of the anion and cation and
viscosity trends, with increasing mobility resulting in decreasing viscosity. They also
show that increasing cationic chain lengths in imidazolium cations decreases the mobility
of the cations, which decreases the conductivity but disproportionately compared to the
decrease in mobility. Increasing chain lengths was also shown to increase viscosity and
this is assumed to be from increasing inductive forces between the ions, showing that
electrostatic forces are dominant, but there are other intramolecular forces that are
relevant under certain circumstances. Anastasia et al used vibrational spectroscopy to
demonstrate in certain TFSi ILs with carbon chain lengths from 0-3, the coulombic
interactions dominate and with carbon chains >3 van der waals and pi-pi interactions
become important [120]. The method of investigation is centered around the PGSE
technique, which is described in Chapter 3. It is well accepted this technique gives

30
accurate measurements of the self-diffusion coefficients. The theoretical conductivity is
calculated from the diffusion coefficients and ionic concentrations using the Nernst
Einstein equation, Equation 1: Nernst Einstein Ionic Mobility and Conductivity
RelationEquation 1.
Equation 1: Nernst Einstein Ionic Mobility and Conductivity Relation
Λ =𝑁𝐴𝑒2(𝐷𝐶𝑎𝑡𝑖𝑜𝑛 + 𝐷𝐶𝑎𝑡𝑖𝑜𝑛)
𝑘𝑇
These calculated conductivities are consistently higher than the experimental
values, indicating there may be more contributions toward the conductivity than directly
applied mobility, possibly ion pairing that decreases conductivity contributions. They do
however show correlation and it is understood that these factors are strongly correlated
[121, 122]. The ILs properties can vary significantly by changing anions and cations, and
as one would expect, the properties are strongly correlated to the size and charge of each
species [123]. Spohr and Patey demonstrate that the properties are influenced by the
relation of size of the species, charge location and charge dispersion [124-126]. The
interactions of these species may be broken up under shear conditions, possibly
generating the significant number of non-Newtonian ILs that are consistently thixotropic
[127-129].
The experimental rheology of ionic liquids is very complex [130]. The different
ionic components in the various ILs display varying degrees of clustering and at different
temperatures. These clusters break up under shear stresses and can be probed by
rheological studies. Breaking up these clusters and decreasing the interaction energy of
the components should result in changes in mobility either from reduced electrostatic
attraction or increasing probability of an ion interacting with an appropriately sized hole

31
to diffuse through. The deviations that the ionic liquids undergo when experiencing shear
are not accounted for in many experiments, where the properties are tested under static
conditions (NMR, Cottrell, density, conductivity etc.). Using rheology to probe how the
ionic interactions change under shear will allow for investigation into how these
properties are shifted in dynamic conditions.

32
Chapter 2: Aim of This Work
The focus of this reasearch is the fabrication of an exothermic aluminum nickel
thin film. The process parameters, the energetic properties of the codeposited film, and
the correlation between the fabrication and the film properties are to be investigated. To
reduce costs, the film will be fabricated with the codeposition of an aluminum matrix and
nickel particles as outlined in Figure 14.
Figure 14: Electrochemical Codeposition Outline
At time 1, the metal (aluminum) deposition begins on the electrode. At time 2,
particles make their way to the surface due to convection and gravity. At time 3, the
metal matrix grows around particles locking them in place. At time 4 the particles are

33
imbedded in the film. Composition is determined by metal deposition rate, flux of
particles to the electrode surface and residence time.
The self-propagating intermetallic mixing of aluminum and nickel reaction
requires intimate and high surface area contact of distinct separate phases. High speed
and uniform reaction rates will improve the performance of the energetic film, and this
mixing reaction rate is determined by diffusion limitations of the components, as they are
initially in the solid state. Faster rates and shorter battery activation times can be achieved
by nanostructuring the composite, through the increase in surface area, and therefore the
incorporated particle phase must be nanoscale. As detailed in chapter 1, the components
are targeted to be 1:1 Al:Ni atomic ratios since this is the most energetic composition,
necessitating 60 volume percent aluminum. The particle incorporation volume in the film
is the lower volume component, so the particles must be nickel and the deposited matrix
material must be aluminum.
Particle incorporation 40 volume percent is still quite high, and requires
significant optimization to be reached. Increasing the particle loading in the electrolyte
increases incorporation into the deposited film, but has limitations when the particulates
are conductive as in this process. If conductive particles are allowed to accumulate on the
electrode they will produce a porous spongy deposit, thus the particle loading in the
electrolyte is limited. The particle incorporation volume is dependent on particle arrival
rates to the electrode and residence times there. The residence times are determined by a
balance of forces between attractions to the electrode and shear forces from the
electrolyte flow. The particle motion through convection is necessary to bring particles to
the electrode surface, but as the shear forces are relatively large since particles are

34
nanoscale, even low flow rates have a tendency to remove particles before they can be
incorporated. Balancing particle arrival rates with the shear forces that remove them,
along with developing the matrix growth parameters under these conditions requires
extensive knowledge and control of the matrix growth and particle motion in parallel.
The growth of the matrix material is central to the codeposition process and all
variables must be investigated and understood. As the requirements for particle
incorporation will likely limit electrolyte flow, the electrodeposition will need to be
accomplished with minimal agitation. This limits the mass transfer of reducible species
and the deposition must be significantly optimized to provide high quality compact
deposits in this regime. The nanoparticles will have low residence times, and therefore
the matrix growth rate will have to be fast enough to ensure incorporation. While
aluminum electrodeposition is not uncommon it is a relatively new and unexplored
process, with limited information on surfactants and addition agents that modify and
improve the deposition.
Achieving high particle loading in the film while limiting the loading in the
electrolyte, along with depositing high rate and compact aluminum with limited
electrolyte mixing, necessitates extreme optimization. Theoretical modelling,
electrochemical measurements, and study of physical properties of the electrolyte and
particles will be used to reach these goals. Understanding and control of the aluminum
deposition, particle properties and fluid dynamics is crucial in fabricating a film with the
desired energetic properties and developing that process is the subject of this work.

35
Chapter 3: Experimental
3.1 Chemical Cleaning – Ionic Liquid Preparation
Electrochemistry in general is a high precision technique and impurities have
significant impact on results of experiments. The electrolytes and deposited films are
highly reactive with oxygen, water and other impurities so significant steps must be taken
to ensure tests are repeatable and accurate. To minimize contamination all experiments
and purification steps were performed either in a VAC Atmospheres Omni glovebox
under argon and less than 1 PPM water and oxygen content or on a Schlenk line under
vacuum or with Argon (99.999%, UHP, Matheson).
Ethyl methyl imidazolium chloride (EMImCl) aluminum chloride (AlCl3)
electrolytes were purified using chemical and electrochemical techniques. Ethyl-Methyl
imidazolium >99% was received from TCI America with a 99.7% assay specifically
requested lot. The EMImCl was dried in a Yamato ADP300C vacuum oven, Figure 15,
for at least 12 hours at 90˚ C and brought into the glovebox antechamber at elevated
temperature. It was allowed to cool under vacuum in the antechamber overnight to further
reduce water content.

36
Figure 15: Yamato ADP300C Vacuum Oven
AlCl3 (Fluka, puriss, anhydrous, crystallized, ≥99.0% (AT)) was cleaned by
sublimation at 130˚ C and deposited on a liquid nitrogen cold finger five times to ensure
purity. Sublimation was done with 1% NaCl (99.9% Sigma Aldrich) and aluminum wire
(Alfa Aesar, annealed, Puratronic®, 99.9995%) in the sublimation vessel in a process
given previously by Wessercheid [106]. Initial sublimations were yellow, Figure 16, and
became whiter with successive sublimations. The final product was pure white powder
and small flakes.

37
Figure 16: Sublimed Aluminum Trichloride
EMImCl-AlCl3 solutions were made by slow mixing of the purified chemicals
and underwent electrochemical purification by running 1 V potential (Solartron Modulab
potentiostat) between Aluminum wire or foil (99.999%Alfa Aesar) counter electrode and
aluminum wire working electrode (99.999% Alfa Aesar). The cleaned solutions were
then filtered over Cellite 550 (Sigma Aldrich) for large volumes or through .45 um GHP
lur lock filters (Pall) for volumes under 30 mL, to remove any solids that may have been
present or generated. The solutions were then an optically clear very light yellow tint
regardless of AlCl3 content. Visible differences can be seen between the electrolyte
purified in this manner vs. as received, Figure 17.

38
Figure 17: Cleaning Results in EMIm Tetrachloroaluminate ILs
BMImCl (95% BASF) and TMPAC (98% Sigma Aldric) were vacuum dried
overnight at 90˚ C and brought into the glovebox hot. These solutions were mixed with
>99% AlCl3 (sigma Aldrich) that was used without further cleaning. The IL, once
prepared, was cleaned via electrochemical methods by applying 1 V (Solartron Analytical
potentiostat) between 2 aluminum wire electrodes (Alfa Aesar 99.9995%).
3.2 Karl Fisher Titration
Solutions were tested for water content with a Mettler Toledo model C20
Coulometric Karl Fisher titrator with 99.999% UHP argon carrier gas (Matheson trigas).
The mass measurements were done with the Mettler Toledo XS204 scale.

39
3.3 Density
Density measurements were taken with 2 mL pycnometers for all solutions,
shown in Figure 18: 2 mL Pycnometers for Density MeasurementsFigure 18. The temperature
was controlled by a Thermo Scientific Thermolyne oven inside of a glovebox
atmosphere. The temperature was allowed to equilibrate in the solution and pycnometer
for 2 hours at each setting to ensure uniform and complete heating. The mass was then
measured with a DHAUS Adventurer Pro scale.
Figure 18: 2 mL Pycnometers for Density Measurements
3.4 Rheology
Viscosity in the shear regime was measured with a Brookfield DV2T viscometer
and analyzed using Rheocalc T software. The spindle was a serial number SC4-27,
designed for small samples. The sleeve was the matching pair for the spindle, SC4-

40
13RPY and had an incorporated temperature probe for accurate local temperature
measurement and control, shown in Figure 19.
Figure 19: DV2T Programmable Rheometer and y-21 Spindle and Cup Pair with Temperature Probe
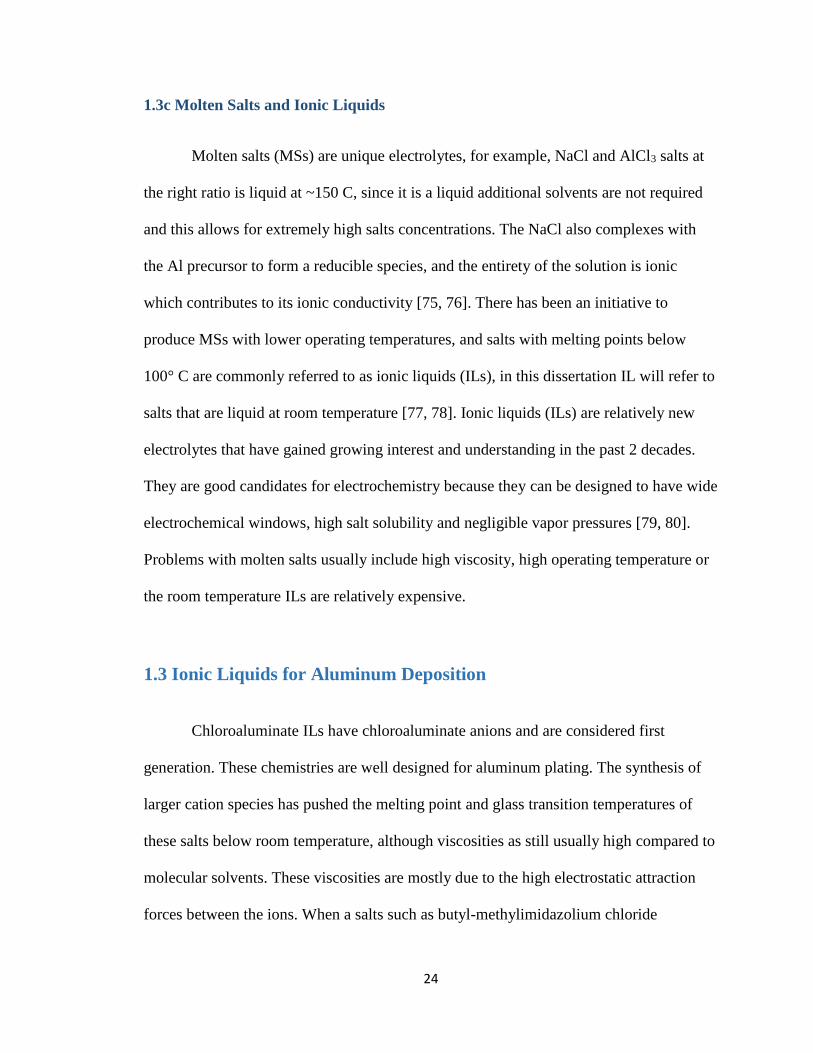
The temperature was controlled by a cooling and heating bath sleeve with a
Brookfield temperature control unit pumping silicon oil instead of water mixtures to
minimize chance of contamination of the glovebox atmosphere with water, shown in
Figure 20.
41
Figure 20: Silicon Oil Jacket in Glovebox
3.5 NMR
3.5a Al27 NMR
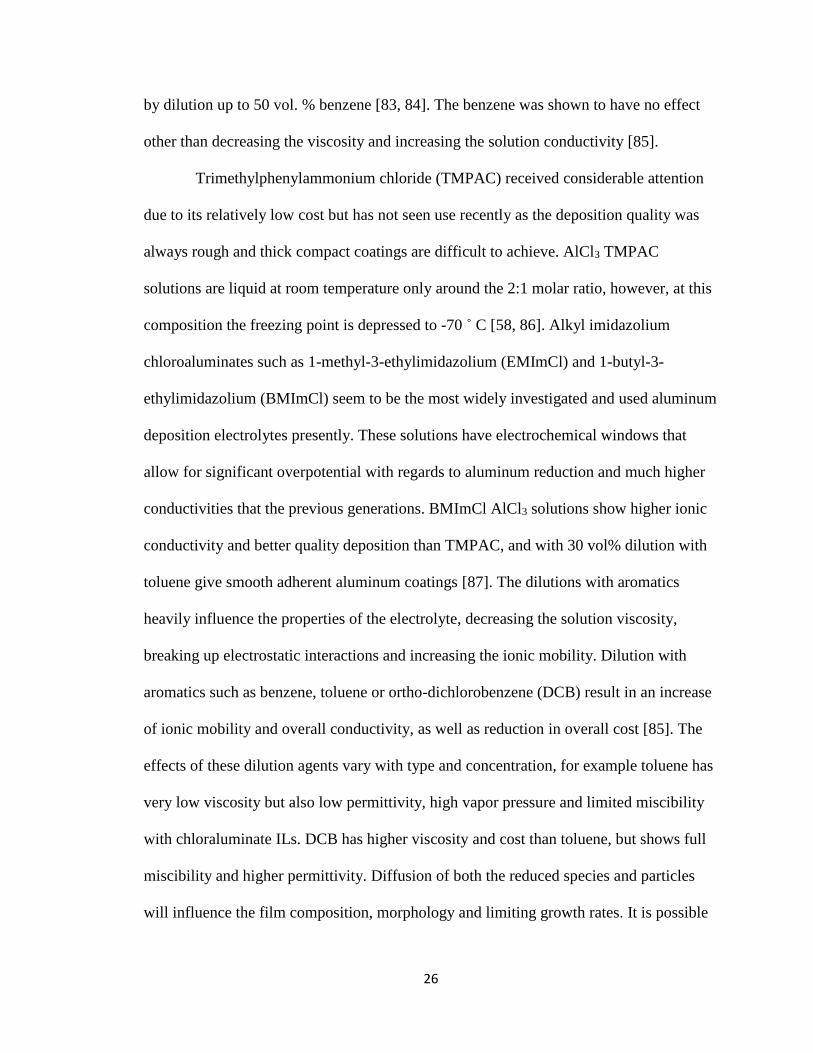
Speciation of the chloroaluminum anions was verified with Al 27 NMR, all NMR
spectra were obtained on a Bruker Avance-III 500 using standard conditions, and teflon
sealed vacuum tubes shown in Figure 21. The probe background signal has been subtracted
for some of the expansion figures. Chemical shifts referenced to 1M Al(H2O)6 δ = 0.00
ppm at RT.
Figure 21: Vacuum Sealed NMR Tube with Ionic Liquid

42
3.5b Proton Pulse Field Gradient Spin Echo Nuclear Magnetic Resonance
Spectroscopy
Diffusion of the cationic species was determined with PGSE NMR with a Bruker
Avance-III 500 using standard conditions and sealed vacuum tubes. Self-diffusion
coefficients of certain NMR active nuclei (and the molecules or anions they are a part of)
can be measured with pulse field gradient spin echo nuclear magnetic resonance
spectroscopy (PGSE) [131]. This technique uses gradient pulses to tag the nuclei with
respect to their z position. The nuclei are free to diffuse for a short time and are flipped
with a 180-degree pulse, then another gradient pulse is used to reorient the atoms. This
second gradient pulse is the same as the first, and as the nuclei have been flipped 180
degrees should cancel the previous shifts. The more a nucleus moves with respect to the
direction of the gradient, the more disparate the influence of the first and second gradient
pulse is. Therefore, the nuclei are not rephased and contributes less to the echo signal.
Changing either the time between pulses or the strength of the pulses and measuring the
change in signal allows for measurement of the self-diffusion coefficients of the nuclei.
Increasing times results in a lower signal, as the atoms have moved farther, or increasing
the gradient pulse reduces the signal, as the impact of the distance travelled is stronger.
The signal intensity follows the Stejskal-Tanner equation, Equation 2.
Equation 2: Stejskal-Tanner Equation
𝑆𝑖𝑔𝑛𝑎𝑙 = 𝑒𝑥𝑝 (−𝐷𝐺2𝛿2𝛾2 (𝛥 − 𝛿
3))
Where δ and Δ are Constants of the NMR tool and pulse design (pulse width and
separation, respectively), γ is the gyromagnetic ratio, D is the diffusion constant and G is
the Gradient strength.

43
Plotting the gradient strength squared vs. the signal decay gives and exponential
decay function, as the remaining components are constants of the instrument the diffusion
constant can be determined.
3.6 Electrochemistry
Electrodes were prepared by initial polishing with 15 and 10 um diamond polish,
but these were not necessary after the initial polished finish was achieved. The electrodes
were then polished with Buehler Alumina micropolish at 1 um and 0.3 um particle sizes
to a mirror finish shown in Figure 22.
Figure 22: BASi Electrodes and Alumina Polishing Slurry
The electrodes were always repolished with 0.3 um particles before each
experiment set. After polishing, the electrodes were immersed in tap water under
ultrasonic agitation (Branson 3510) to remove any particles that may have become
imbedded in the surface. The electrodes were then rinsed with deionized water and dried
with isopropanol (99.9% Sigma Aldrich) before vacuum drying and transfer into the
glovebox. The electrochemical cell was a 100 mL Pyrex glass beaker with 1 mm

44
99.999% Al foil (Alfa Aesar) as a counter electrode around the circumference to
maximize counter electrode area. The reference electrode was Al wire (Alfa Aesar,
annealed, Puratronic®, 99.9995%) in 1.5:1 AlCl3 EMImCl solution separated from the
chemistry by a glass frit. The working electrode is 0.5 cm diameter polished glassy
carbon disk in a Pine adjustable speed rotator (ASR) rotating disk electrode (RDE)
configuration. All RDE measurements were done at temperature values of 30, 50 and
80C measured by a PTFE coated thermocouple immersed in solution, the setup is shown
in Figure 23.
Figure 23: Rotating Disc Electrode and Electrochemical Cell
3.6a Cottrell Model
Cottrell scans were done in quiescent solutions (no rotation) at -400 mV mV
overpotential vs. the Al reference (Quasi Reference Electrode (QRE) in BMImCl
45
solutions, 1.5:1 AlCl3:EMImCl in EMIm Electrolytes). The Cottrell model implements a
potential step and monitors the current response. The profile of this response vs. time
indicates if the system is diffusion limited or not, and if so should follow the Cottrell
equation, Equation 3.
Equation 3: 𝐂𝐨𝐭𝐭𝐫𝐞𝐥𝐥 𝐄𝐪𝐮𝐚𝐭𝐢𝐨𝐧
𝒊 =𝒏𝑭𝑨𝒄√𝑫
√𝝅𝒕
The factors of this equation are constant except for current and time and plotting
current vs. inverse square root time should produce a linear plot. The diffusion can be
calculated from this slope.
3.6b Rotating Disc Electrode
The rotating disk electrode is used to determine the kinetic and diffusion
limitations in an electrolyte through the control of convective parameters. Linear
voltammetry is used in conjunction to measure the regime of the reduction process over
changing kinetic rates. The model incorporates Fick’s first law, stating that components
in a solution move from areas of high concentration to areas of low concentration at a rate
proportional to the concentration gradient as well as the velocity profile on the rotating
disk, originally solved by Cochran and von Karman in 1921. These parameters are
accumulated in the Levich model, following Equation 4.
Equation 4: Levich Equation
𝑰𝑳 = (. 𝟔𝟐𝟎)𝒏𝑭𝑨𝑫𝟐𝟑𝒘
𝟏𝟐𝒗
−𝟏𝟔 𝑪

46
Where IL is the diffusion limited current, n is the number of electrons transferred
during the reaction, F is faraday’s constant, A is the electrode area, D is the diffusion
constant, w is the rotation rate, v is the kinematic viscosity and C is the bulk solution
concentration. Increasing the overpotential with linear voltammetry should increase the
reaction kinetics so the system is diffusion limited, using the and Levich limited current
at a rotation rate the diffusion rates can be calculated. RDE experiments were carried out
at 50 to 1000 RPM rotation rates.
3.6c Nucleation Mode Tests
The nucleation mode is determined by the current response of the system after an
overpotential has been applied. The maximum current is determined and the entire
response is normalized (time and current) to this point. The data is then mapped to
equations based on the system and the profile is considered instantaneous, where
nucleation sites are generated instantly and the continual film growth perpetuates from
those locales, or progressive where the nucleation sites continue to spawn.
3.7 Conductivity
Conductivity measurements were taken with a Yellow Scientific Instruments
conductivity meter and YSI-3401 conductivity probe. 40 mL of solution was used in a 100
mL graduated cylinder (Figure 24) and the temperature was controlled through the use of
heat tape on the exterior and omega PID controller.

47
Figure 24: Conductivity Meter and Probe
The solution temperature was measured from a thermocouple in the IL outside of
the probe volume to ensure accurate measurements. Temperature measurements on the
exterior of the glassware were unreliable and inconsistent.
3.8 Falling Ball Viscosity
The spheres were silver coated poly(methyl methacrylate) PMMA 1.44g/cc 63-
75um (Cospheric) and chosen for their density and size, shown in Figure 25.
Figure 25:Cospheric Silver Coated PMMA Microspheres

48
To measure the viscosity in very low (zero) shear regimes requires a balance of
drag forces from viscosity and the particle surface and body forces due to gravity so that
the terminal velocity falls in the 10-6 - 10-4 Reynold’s number regime.
The rectangular tubes used to hold the particles and electrolyte were fused quartz
with openings that were 2x4 mm. The ends were capped with Viton tubing and additional
seal was provided by vac seal epoxy. The ends of the tubes incorporated polyethylene
swagelock valves to allow solution filling and closing of the vessel to the environment.
The terminal velocity was determined by recording video of the falling spheres on a
digital light microscope (Keyence VT-1000) with 200x magnification turned 90 degrees
to horizontal, as shown in Figure 26.
Figure 26: Rectangular Quartz Tube he Held at 90 Degrees for Microscope viewing of Falling Ball Experiments

49
Correlating the terminal velocity to the viscosity of solution was done with the
stokes equation (Equation 5), and temperature was controlled with a Omega Benchtop
thermocontroller and heat tape wrapped around the exterior.
Equation 5: 𝐒𝐭𝐨𝐤𝐞𝐬 𝐄𝐪𝐮𝐚𝐭𝐢𝐨𝐧
𝑽 =𝟐
𝟗
(𝝆𝒑 − 𝝆𝒇)
𝝁𝒈𝑹𝟐
3.9 Scanning Electron Microscopy and X-ray Dispersive Spectroscopy
Surface and composition analysis of the deposited films were done with a Zeiss
Supra 55VP field emission gun scanning electron microscope. EDS analysis was with a
Bruker quad SDD (Silicon Drift Detector) using Bruker Esprit acquisition software.
3.10 Energy Release Differential Scanning Calorimetry
Thermal analysis was performed by Robert Knepper, using a TA Instruments
DSC Q2000 differential scanning calorimeter. Between 5 and 8 mg samples were placed
in copper pans for analysis. The DSC was operated at 40ºC/min between 50 and 725ºC
for two cycles with 50 mL/min argon gas flow.
3.11 Transmission Electron Microscopy
Analysis of the particle and aluminum interactions were performed by Paul
Kotula, with an FEI Company Titan G2 80-200 operated at 200kV and equipped with a
high-brightness Schottky field emission source, spherical aberration corrector on the
probe-forming optics, and four silicon-drift X-ray detectors with a combined solid angle
of 0.7 sr.

50
3.12 Modelling
3.12a COMSOL
Fluid dynamics calculations in the reaction vessel were done with COMSOL
Multiphysics software version 5.2. Laminar flow and particle tracing physics were solved
for in 2 simulations in series. The Laminar flow in the reactor was calculated based on
the power law viscosity profile determined by the rheology experiments in a stationary
equilibrium study. The particle tracing physics was solved for in a time dependent study,
at time 0, 100 particles were released at the inlet of the reactor and initial velocities
determined by the fluid flow expression at the inlet. The simulation times were carried
out for 5-20 seconds dependent on the flow rate in the reactor (slower flow rates
necessitate longer simulation times).
3.12b Gaussian
Molecular dynamics simulations were performed with Gaussian 09 with the DFT
B3PW91 Method and 6-311G basis set along with increased “tight” tolerances for
volume calculations. The volume is determined by a 3 dimensional boundary wherein the
electron density is greater than .001 electrons/Bohr3. The given stokes radius is .5 A
larger than the radius that corresponds to the calculated volume, as this is assumed to be
more representative of radii correlated to diffusion.

51
Chapter 4: Aluminum Deposition - General
4.1 Aprotic Solvents
The aluminum matrix characteristics are central in controlling the codeposition
process, therefore multiple electrolyte options were investigated, as they all have
challenges and benefits. Electrolytes were assessed on ease of use, quality of deposit and
cost of materials. Initial investigations in aprotic solvents were focused into the THF
electrolyte and its aluminum complexing agents since this chemistry has a large presence
in the literature [60-64], as well as other well-known battery electrolytes used in other
electrochemical systems. Most solvents were very reactive with the aluminum salts and
therefore not applicable for use; these include ethylene and propylene carbonates and
DMSO, while others had poor solubility for the salts. Addition of salts were done slowly
as the exothermic heating during the solvation of the Aluminum could cause breakdown
in all the solvents. Complexing agents in these aprotic solvents were LiCl and LiAlH4,
where the lithium aluminum hydride was the more effective in improving the amount of
reducible aluminum species in solution and increasing deposition rates. Electrodeposition
results were smooth and adherent under certain conditions but the high vapor pressure
and difficulty of use lead to the ultimate decision against their use. Some solutions are
shown in Figure 27, most of the typical battery solvents have poor solubility towards the
precursors and complexing agents and these are gray or opaque from undissolved
remaining components.

52
Figure 27: Aprotic Electrolytes with Al Precursors
Ethylene carbonate was initially promising as it showed high aluminum chloride
solubility and the reduction of melting point decreased the melting point to well below
room temperature while the vapor pressure was still low. The solutions did not show any
aluminum reduction on a copper cathode, which is presumed to be because the solution
does not produce an electroactive complex. To prove this, cyclic voltammetry was used
on the solution. Scans showed a slight peak in current at -1.6 V vs. Ag (scan rate 5 mV/s),
Figure 28.
Figure 28: Reduction Peak in EC AlCl3 at -1.6 V vs. Ag (5 mV/s)

53
Even with LiAlH4 additions to the ethylene carbonate electrolyte, voltammetric
testing for extended periods of time at -1.5 V showed very little current and no evidence
of aluminum reduction, Figure 29.
Figure 29: Low Sustained Current In EC AlCl3 at -1.5 V vs. Al
The negligible current and absence of noticeable aluminum deposition lead to the
conclusion that EC would not be a good solvent for aluminum plating. It was unclear
whether the EC itself hindered the process of if the aluminum precursors were not
forming reducible aluminum complexes.
4.2 Aromatic Solvents
The next set of solutions investigated were toluene and benzene aromatics. The
aromatics are lower vapor pressure, lower flammability and easier to handle than the
ether based aprotic solvents. The aromatic solvents do not have solubility towards
chloroaluminum salts so larger anions were used. The bromo aluminum salts had high
solubility and went into solution quickly, with no noticeable exothermic reaction. These
salts turned the solution yellow and showed no activity until addition agents were again
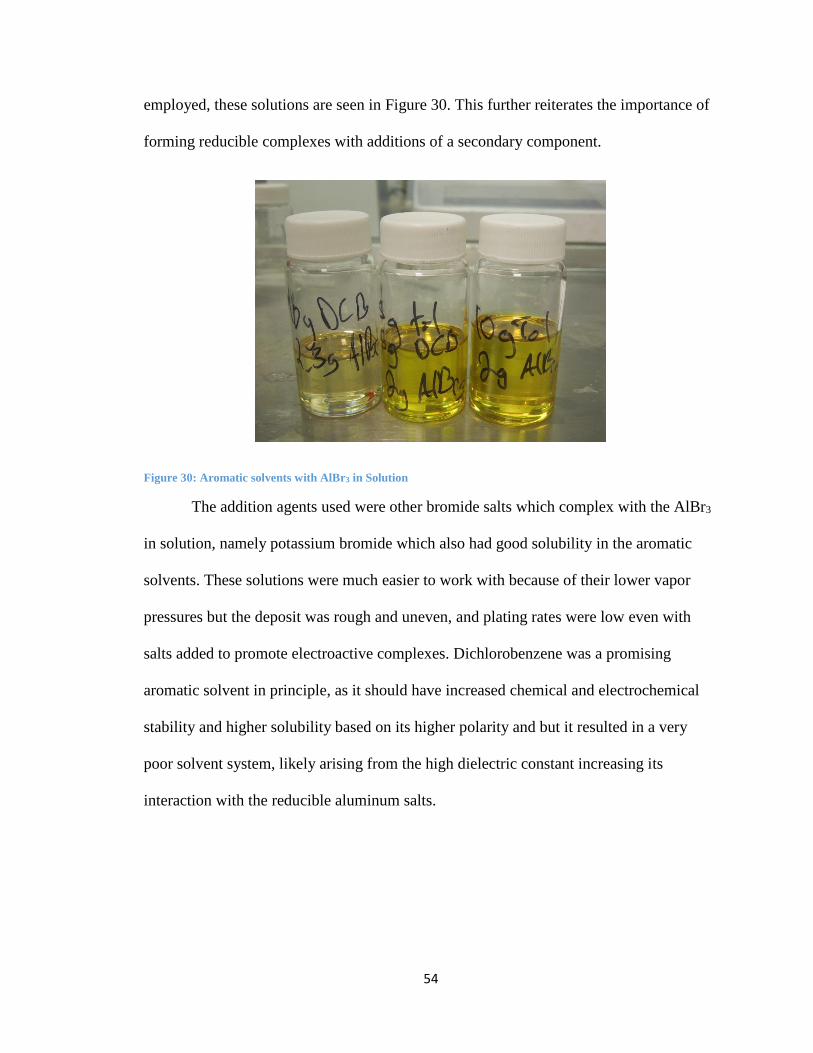
54
employed, these solutions are seen in Figure 30. This further reiterates the importance of
forming reducible complexes with additions of a secondary component.
Figure 30: Aromatic solvents with AlBr3 in Solution
The addition agents used were other bromide salts which complex with the AlBr3
in solution, namely potassium bromide which also had good solubility in the aromatic
solvents. These solutions were much easier to work with because of their lower vapor
pressures but the deposit was rough and uneven, and plating rates were low even with
salts added to promote electroactive complexes. Dichlorobenzene was a promising
aromatic solvent in principle, as it should have increased chemical and electrochemical
stability and higher solubility based on its higher polarity and but it resulted in a very
poor solvent system, likely arising from the high dielectric constant increasing its
interaction with the reducible aluminum salts.

55
4.3 Ionic Liquids General
The last set of options that were investigated were ionic liquids. There are
multiple cation and anion choices that have been used in the literature, and the focus was
directed to the chloroaluminates as they promote clean, facile electrodeposition of
aluminum. These solutions, like other aluminum electrolytes require inert environments
due to the reactive nature of the precursors and the deposited aluminum. Some air and
water stable ionic liquids that incorporate highly fluorinated anions were tested, but after
aluminum additions they are still strongly and irreversibly affected by air and water
contamination. These hydrophobic solutions are also significantly more expensive than
the first generation chloroaluminate ILs. The anion was chosen to be the standard
chloroaluminum reducible complex the next focus was on cation choices as discussed in
chapter 1. TMPACl received interest since its cost is significantly lower than the other
ILs but the aluminum deposit was always rough, dark and had poor adhesion.
Dialkylimidazolium cations are very chemically and electrochemically stable, and are on
the lower end of cost. The BMImCl solution’s high viscosity was mostly due to the Van
der Waal forces on the alkane chains and this limits the diffusion and mobility of all
components in the solution. EMImCl solutions are lower viscosity since they have shorter
alkane chains and lower van der Waals attractions. To reduce the viscosity of BMImCl
solutions, dilution agents are added, and this is required to achieve smooth
electrodeposits. EMImCl AlCl3 solutions deposit aluminum readily in neat solutions, but
BMImCl is less expensive and dilutions could also reduce cost, these electrolytes are
discussed in detail in sections 6 and 5 respectively. The other ionic liquids that were
investigated were ruled out for either cost or incompatibility with aluminum precursors.

56
They were however useful in testing chemical methods as they are more air and water
stable than the ILs containing aluminum species.
4.3a Ionic Liquid Water Content Reduction
Multiple cleaning methods were tested for their ability to reduce water content
with Karl Fischer titrations. These were baking, electrochemical cleaning and molecular
sieves. EMIm dicyanimide was used for this testing as it does not react with air and water
like aluminum ILs. It was investigated as an electrolyte because it has one of the highest
conductivities of commercially available ILs but it is highly reactive with aluminum
complexes and cannot be used for deposition. Ionic liqudis with TFSA hydrophobic
anions show the lowest water content when tested with Karl-Fisher. Standard, as received
EMIm DCA was the control sample and has roughly 370 ppm water. The water content is
reduced by baking at 90-150C, cyclic voltammetric cleaning and 3A molecular sieves, in
order from least to most effective, the resulting data is shown in Figure 31.
Figure 31: Water Content of ILs and Cleaning Methods

57
An example of the shift with electrochemical purification is shown in Figure 32.
The scans are 100 mV/s and room temperature in a glove box atmosphere.
Figure 32: Cyclic Voltammetry on EMIm DCA IL for Impurity Removal (100 mV/s, RT),
changes between the two are attributed to removal of impurities.
The softening of peaks indicates decreased impurity content, the peaks negative of
-1 V may be due to electrolyte breakdown, but this solution was not used in further
testing so these reductions were not investigated at this time. The chloroaluminate
imidazolium ILs showed the most promise for aluminum deposition, with high aluminum
salt content, activity, and stability and were the focus of further investigation. The first of
which is BMImCl AlCl3 mixtures for their low cost and high chemical stability.

58
Chapter 5: Butyl Methyl Imidazolium AlCl3 Ionic Liquids and Co-
Solvents
BMImCl AlCl3 electrolytes deposit aluminum very poorly as neat solutions but
improve greatly with additions of co-solvents and dilution agents that reduce the
viscosity. The diluents used were toluene and ortho-dichlorobenzene (DCB). The toluene
was lower viscosity than the DCB (.7 cp vs 1.3 cp) but the DCB had much lower vapor
pressure and was more chemically stable. The slight instability of toluene dilutions is
known and the halide substituents deactivate the aromatic ring [85]. Ethylene carbonate
was also tested as it has high miscibility and applicable electrochemical windows. It was
later determined that the EC is not chemically stable with the aluminum chloride and
results in a non-reducible complex. Conductivity and other experiments may not correlate
well to deposition results if the assumed speciation is not accurate and the reducible
species differ from the expected. Recall that solutions must be Lewis acidic (greater than
1:1 AlCl3 ratio) to generate electroactive species, Al2Cl7-. Because of this, understanding
the speciation in a given IL is important and was investigated with Al27 NMR.
5.1 NMR Speciation Analysis
The bonding environment of the aluminum is consistently tetrahedral
coordination to chlorine and always results in a 103 ppm downshift. The AlCl4- species is
very symmetric and therefore gives a very sharp NMR spectrum. As the electrolyte is
made more Lewis acidic by adding AlCl3, the composition shifts toward more Al2Cl7-
species until all of the Al is in this state. The Al2Cl7- is still tetrahedrally coordinated with
respect to Al and Cl, but the asymmetry of the chlorine sharing leads to peak broadening.

59
Speciation can be determined in the neat IL by comparing the FWHM of the Al27 NMR
peaks. The equation is straightforward using constants of FWHM signals of prepared 1:1
and 1:2 Cl: AlCl3 (A and C, respectively), shown as Equation 6.
Equation 6: Aluminum Speciation Based on NMR Equation
FWHM( ) FWHM( )=
FWHM( ) FWHM( )A
sample Cp
A C
NMR results match well to expected values and the Al speciation does match the
stoichiometric balance consisting of Al2Cl7- and AlCl4
-. NMR peaks of progressively
higher AlCl3 concentration solutions are shown in Figure 33.
.
Figure 33: Al27 NMR of the Chloroaluminate IL at varying AlCl3 Concentrations
Temperature variation shows little effect on the speciation, as shown in Figure 34.
The FWHM increase with temperature for all solutions, but the end point FWHMs shift

60
accordingly, so the formula can still be used to determine speciation as long as the end
points are corrected for.
Figure 34: Temperature Variation of FWHM in Al27 NMR at Varying AlCl3 Concentrations
Additions of aromatics may cause changes in the speciation, Abbott et al. show
that the heavily acidic ionic liquids are not affected but the intermediate mixes may be
[87]. Solutions tested with dilutions were restricted to the most acidic 2:1 AlCl3:BMImCl
chemistries, as these had the highest concentrations of electroactive species.
Since there is only one peak in the Al27 NMR, the data indicates that there are
only tertrahedrally coordinated aluminum species present, presumably only Al2Cl7- and
AlCl4- anions and they are in equilibrium at the stoichiometric values of free chlorine.
This allows easy control of the concentration of each species by modifying the AlCl3 to

61
Cl ratio. This control is crucial in determining the amount of electroactive species that are
present for electrochemical measurements.
5.2 Electrochemical Testing – Cyclic Voltammetry
BMImCl AlCl3 will deposit smooth coatings with additions of dilutions and cyclic
voltammetry was tested with neat and co-solvent diluted solutions to get a general idea of
interactions. Three scans are shown in Figure 35.
Figure 35: Cyclic Voltammetry in BMImCl AlCl3 ILs with Co-solvent Additions (5 mV/s, RT)
Additions of toluene to the IL showed similar trends to the neat IL, with EC
additions suppressed the electrochemical response significantly. The solvents change the
ionic interactions of the IL and modify the diffusion properties.

62
5.3 Deposition Testing and Results
The best depositions from the initial testing were seen to be reduction potentials
between -200 and -600 mV vs. Al quasi reference electrode and with dilutions. The
toluene solutions were tested from 20% - 60% and DCB was used for higher dilutions
because it had higher miscibility with the IL. Some deposits on copper with their
respective conditions are shown in Figure 36, and more detailed SEM and EDS data is
shown in Appendix C.
Figure 36: Electrodeposition of Aluminum on Copper from Various Electrolyte baths
It is very common in electrodeposition that edges and corners are exposed to
higher current densities than the average over the electrode. This leads to dendritic or
poor growth characteristics in these areas. It is beneficial to mask these areas and ensure
that the whole of the cathode experiences similar polarization. These effects are apparent

63
when using the ILs to plate Al [11], but are suppressed when using dichlorobenzene as a
co-solvent over toluene as shown Figure 37 for comparison. This may be due to the
higher dielectric properties of the dichlorobenzene.
Figure 37: Edge Effects in Diluted Ionic Liquid Electrolytes (-600 mV vs. Al QRE)
A comparison of the properties such as cost and deposition quality are shown in
Table 1. Of the solutions tested 3:1:2 Tol:BMImCl:AlCl3 solutions and 11:1:2
DCB:BMImCl:AlCl3 solutions and -600 mV overpotential were the highest quality
deposits. Increasing dilution percentages decreases plating rates while also decreasing
electrolyte cost, as the IL is the more expensive component.
AlCl3 BMImCl Toluene DCB mV (-) vs. Al QRE Appearance Purity Cost ($/L)
2 1 600 Acceptable Acceptable 1468
2 1 1 600 Good Medium 1120
2 1 3 600 Best High 768
2 1 6.8 500 Good Medium 492
2 1 6.8 1000 Poor Low 492
2 1 6.8 1500 Black powdery Low 492
2 1 11 600 Best High 384
2 1 16 600 Not Complete High 312 Table 1: Comparison of BMImCl and Co-Solvent Electrolytes Deposition Quality

64
In an Al2Cl7- rich electrolyte the anode is significantly affected by polarization
and mass transfer limitations. It’s well known that when designing an electrolyte plating
bath, the anode must have sufficient area and reactants to undergo oxidation equivalent to
the rate desired at the cathode. Shifting the composition of the electrolyte to contain more
AlCl4- species may be useful to improve the anodic reaction efficiency. However, in
these studies the 2:1 electrolyte was still used and the anode size was the only correction
implemented. The dilution and overpotential options were determined in this preliminary
study and investigating trends that determine these qualities allows for optimization of
deposition quality and rate.
5.4 Optimization of Deposition with Dilutions
The viable electrolyte systems were down selected and investigated with
electrochemical testing to determine optimal conditions, improving aluminum deposition
rate and morphology. Dendritic growth is very common in the neat IL, indicating
diffusion limitations. Investigating the mobility of the reducible species and improving its
net diffusion rates will improve the deposition quality.
5.4a Diffusion vs. Dilution – Cottrell
The diffusion rate of the reducible species was determined using
chronoamperommetry, with and without dilutions of aromatic co-solvents. The diffusion
rate model (Cottrell) is based on reduction of an electroactive species, its depletion and
the development of the diffusion layer. A representative plot of the data derived from

65
room temperature chronoamperommetry of 50% toluene diluted 2:1 AlCl3:BMImCl
solution is shown in Figure 38. The current response is plotted vs. the inverse of the
square root of time.
Figure 38: Cottrell Plot from chronoamperommetry, room temperature 2:1 AlCl3:BMImCl IL and 50% toluene
dilution
The linear response of data plotted this way indicates a diffusion layer growth and
diffusion limitations. The diffusion constants are calculated from the slope of the line.
The diffusion rates in neat solutions and dilutions of toluene and DCB are shown in
Figure 39. As expected, the diffusivity increases consistently with increasing co-solvent
addition.

66
Figure 39: Diffusion of Al2Cl7- in 2:1 AlCl3:BMImCl IL and Dilutions with Aromatic Co-Solvents
Reddy et al. reported 2 x 10 -11 m2/s in similar IL at 90°C [132]. The
dichlorobenzene dilutions show significant increases in diffusivity with dilution but the
toluene increases are much larger. This is likely due to the toluene having lower viscosity
as well as significantly lower dielectric constant, where the higher interaction between
the salts and DCB solvent retard the transport capabilities.
5.4b: Conductivity vs. Dilution, Optimal Conditions
The ionic conductivity is representative of both the trends of the salt species
concentration its mobility, and mobility is heavily influenced by viscosity. The
conductivity was tabulated over the dilution range and measurements are shown in Figure
40, comparing the increased conductivity seen over neat solutions and the increase in
conductivity seen in toluene dilutions over DCB dilutions.
0
1
2
3
4
5
6
7
0 0.1 0.2 0.3 0.4 0.5 0.6 0.7
Dif
fusi
on
(1
0-9
m2
/s)
Fraction Dilution
Dilution Affect on Diffusion
Dichlorobenzene
Toleuene

67
Figure 40: Plot of Conductivity vs. DCB and Toluene Dilutions in BMImCl ILs
The dilution specific properties are shown in Figure 41 and Figure 42. Comparing
the ionic concentration along with diffusivity measurements obtained from Cottrell
measurements with their influence on the solution conductivity shows expected trends.
There is a significant increase in the diffusion rate but the concentration is reduced,
leading to a maximum in the conductivity curve.
Figure 41: Dichlorobenzene Dilution, Conductivity and Diffusion Constants
0
50
100
150
200
0 0.5 1
Co
nd
uct
ivit
y (m
U)
Fraction Ionic Liquid
Conductivity vs. Dilution
Dichlorobenzene
Toluene

68
Figure 42: Toluene Dilution, Conductivity and Diffusion Constants
The ionic concentrations change linearly with decreases of mole fraction of the
IL, and the larger increase in mobility seen in toluene dilutions shifts the maximum
conductivity to lower concentrations than the DCB dilutions. The maximum conductivity
seen at 50% dilution in the toluene chemistry aligns with the best observed deposition
characteristics that were seen in previous testing, verifying the conductivity is a good
indicator of deposition quality and reiterating the 3:2:1 Toluene: AlCl3:BMImCl
chemistry is a top choice for high rate and low diffusion limitation regimes.
5.5 Room Temperature Kinetics – Rotating Disk Electrode
A Pine model AFR fitted with a removable glassy carbon electrode tip allowed
deposits to be studied by SEM/EDS without having to remove them from the substrate.
0
0.2
0.4
0.6
0.8
1
1.2
0.3 0.4 0.5 0.6 0.7 0.8 0.9 1
No
rmal
ize
d Q
uan
tity
Mole fraction Ionic Liquid
Toluene Solutions
Conductivity
Concentration
Diffusion

69
The glassy carbon is polished as described previously ensuring consistent and clean
analysis. The rate of the reaction is controlled by the diffusion of reactants to the
electrode surface and the reaction overpotential. The diffusion constants and reaction
kinetics can be determined by controlling the diffusion distances with the flow
parameters at the electrode surface and the reaction kinetics with potential. Since the
polarization of the anode and cathode are so significant a step pulse was implemented.
This allows time for equilibrium polarization to be achieved in between each
measurement and removes the polarization factor. The IL double and diffusion layers
take much longer to develop and have a greater impact on measurements than in other
electrolyte systems, and slow scan rates lead to significant deposition on the electrode
that changes the surface area and measured current. The step pulse, including a stripping
and rest period between each measurement was used as a precautionary measure. Results
of the linear voltammertic scans at various rotation rates on the rotating disc electrode are
shown in Figure 43.
Figure 43: Linear Voltammetry on RDE in Neat BMImCl ILs
-14
-12
-10
-8
-6
-4
-2
0
-700 -600 -500 -400 -300 -200 -100 0
Cu
rren
t D
ensi
ty (
mA
/cm
2 )
Potential vs. Al Quasi reference electrode
Neat 2:1 AlCl3:BMImCl Solution RDE Data RT
100 RPM
200 RPM
300 RPM
400 RPM
600 RPM
700 RPM
800 RPM

70
The rotation rate had little effect on the deposition rate, and no conditions tested
reached the Levich diffusion limited regime in the range of the tests. It was clear these
systems are predominately kinetically limited. Recall, previous work on the
chronoamperometry indicated that these systems were diffusion limited, not kinetically
limited. Clearly, different tests were giving inconsistent results. The kinetic limitation of
this reaction at room temperature were lower than desired and were investigated
specifically
5.6 Tafel Model and Low Charge Transfer Kinetics at Room
Temperature
To investigate the kinetics specifically, the butler-volmer and tafel equations can
be used and the exchange current density will be another indication of limiting deposition
rates. The Tafel equation is shown in Equation 7.
Equation 7: 𝐓𝐚𝐟𝐞𝐥 𝐄𝐪𝐮𝐚𝐭𝐢𝐨𝐧
𝜼 = 𝑨 ∗ 𝐥𝐧 (𝒊
𝒊𝟎)
The Tafel model investigates charge transfer rate by extrapolating overpotential
vs. Log(current) plot to zero overpotential. The electrochemical scan used for this
measurement is shown in Figure 44 and the plot used to calculate the exchange current
density is shown with it Figure 45.
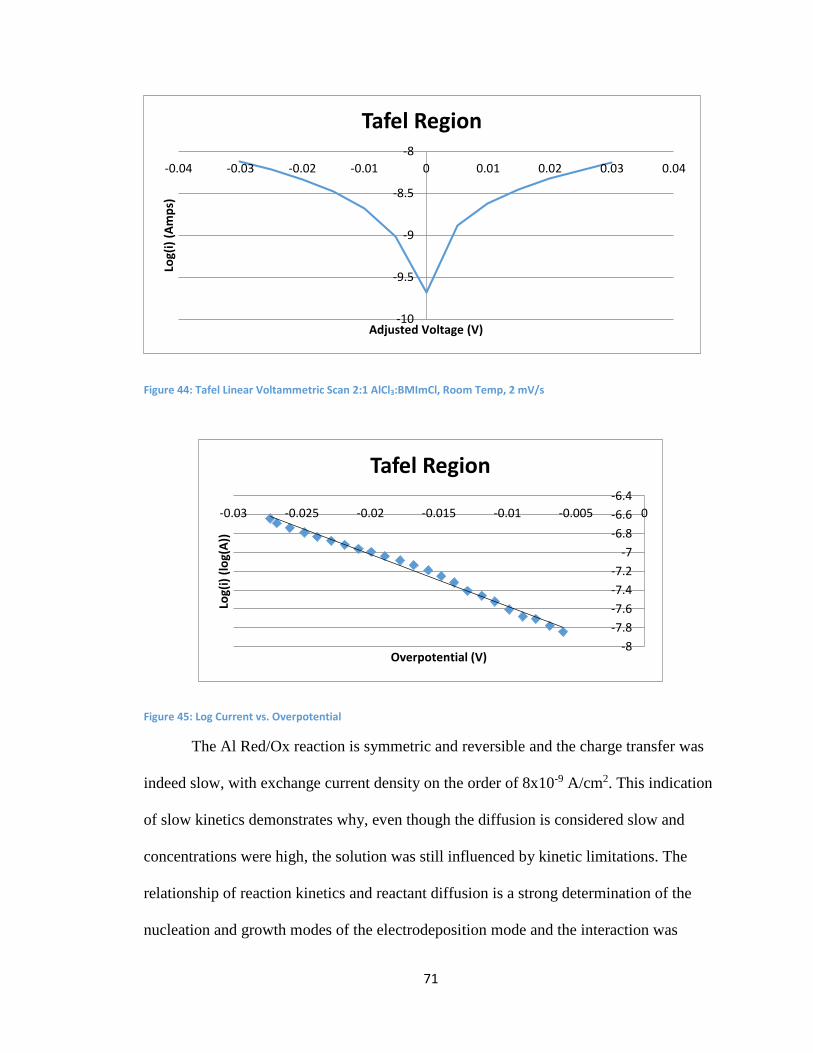
71
Figure 44: Tafel Linear Voltammetric Scan 2:1 AlCl3:BMImCl, Room Temp, 2 mV/s
Figure 45: Log Current vs. Overpotential
The Al Red/Ox reaction is symmetric and reversible and the charge transfer was
indeed slow, with exchange current density on the order of 8x10⁻⁹ A/cm2. This indication
of slow kinetics demonstrates why, even though the diffusion is considered slow and
concentrations were high, the solution was still influenced by kinetic limitations. The
relationship of reaction kinetics and reactant diffusion is a strong determination of the
nucleation and growth modes of the electrodeposition mode and the interaction was
-10
-9.5
-9
-8.5
-8
-0.04 -0.03 -0.02 -0.01 0 0.01 0.02 0.03 0.04Lo
g(i)
(A
mp
s)
Adjusted Voltage (V)
Tafel Region
-8
-7.8
-7.6
-7.4
-7.2
-7
-6.8
-6.6
-6.4
-0.03 -0.025 -0.02 -0.015 -0.01 -0.005 0
Log(
i) (
log(
A))
Overpotential (V)
Tafel Region

72
investigated specifically and detail can be seen in Appendix A. It has been reported that
the nucleation model in ILs is instantaneous[86, 93], likely due to the low diffusion rates
and possible effects of the aluminum precursor being negatively charged. The literature
tests are generally at several hundred mV of overpotential so testing lower values was
performed, as the decreased kinetic rate may have shifted the regime toward more
progressive modes. This was not the case and all conditions tested were showed
instantaneous growth modes.
5.7 BMImCl and Dilutions Conclusion
The data fit certain trends well but shows discrepancies when comparing between
the kinetic, dynamic and different dilution conditions, as diffusion or kinetic limitations
dominate separately depending on the concentration and agitation. There are many other
factors that come into play when using ionic liquids, such as high viscosity and the
precursors being strongly interacting with other components in the solvent. Rotating disk
electrodes showed the Al2Cl7- reduction at room temperature has a kinetic current limit of
~10 mA/cm2, although the reaction is commonly diffusion limited when under quiescent
conditions.
The neat BMImCl chemistry and dilutions were either difficult to plate with or
reached kinetic limitations easily. Adding dilution agents greatly increased the plating
quality but the vapor pressure and possible chemical reactions argue against their use in
increased temperature conditions. Competing aluminum deposition baths are consistently
run at much higher temperatures to reach higher deposition rates, and DMSO2

73
chemistries reach 200 mA/cm2 at 130˚ C [133]. Controlling the matrix growth rate is
crucial in the codeposition process, and options to increase the rates are necessary. It was
evident there are kinetic limitations at room temperature operation and investigating
increased operating temperatures would lead to more options for optimization. The
diluted BMImCl bath is ideal for low temperatures but according to literature, the pure
EMImCl chemistry runs better at increased temperatures and without dilutions [134]. The
increased temperatures that are needed to increase kinetics were investigated directly
without the added variable of dilutions. Understanding the neat solution properties will
improve its direct use and the transition to a diluted system if needed.

74
Chapter 6: Increasing Kinetics with Elevated Temperature – Ethyl
Methyl Imidazolium Cations
The focus for this chapter is on the kinetics and diffusion of EMImCl electrolytes
at varying composition, temperature, overpotential and electrolyte flow. There are many
optimizations that are required to accomplish a compact nanostructured electrodeposited
film. As will be shown temperature has significant effects on both the deposition kinetics
and mass transport properties, with differing shifts in each. The electrolyte composition
changes the concentration of reducible species, modifying the reaction properties on the
anode and cathode. The viscosity and solution flow is critical in both the particle
transport and mass transport. Balancing particle arrival rate with aluminum matrix growth
to achieve the needed solid ratio requires knowledge of the reduction kinetics and
diffusion as well as the flow properties of the solution around the electrode.
6.1 Density
The basic physical properties are required for solving equations in more complex
experiments. The density was measured and the plot of density vs composition and
temperature is shown in Figure 46.
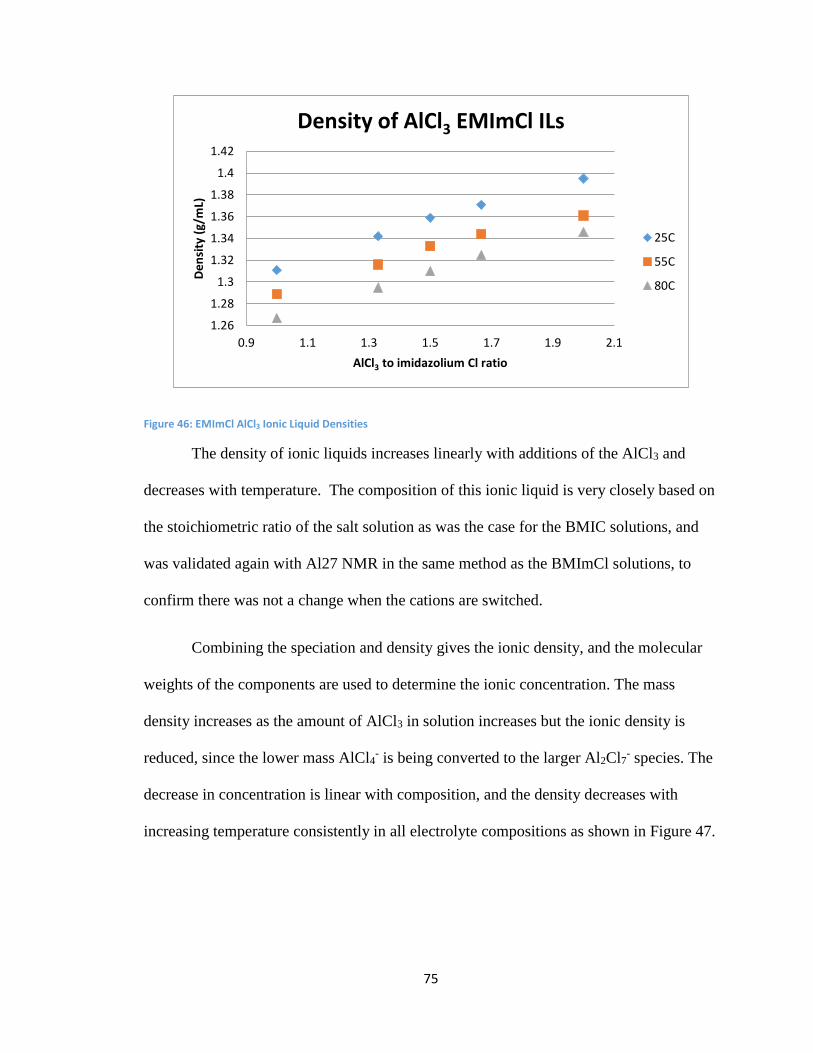
75
Figure 46: EMImCl AlCl3 Ionic Liquid Densities
The density of ionic liquids increases linearly with additions of the AlCl3 and
decreases with temperature. The composition of this ionic liquid is very closely based on
the stoichiometric ratio of the salt solution as was the case for the BMIC solutions, and
was validated again with Al27 NMR in the same method as the BMImCl solutions, to
confirm there was not a change when the cations are switched.
Combining the speciation and density gives the ionic density, and the molecular
weights of the components are used to determine the ionic concentration. The mass
density increases as the amount of AlCl3 in solution increases but the ionic density is
reduced, since the lower mass AlCl4- is being converted to the larger Al2Cl7
- species. The
decrease in concentration is linear with composition, and the density decreases with
increasing temperature consistently in all electrolyte compositions as shown in Figure 47.
1.26
1.28
1.3
1.32
1.34
1.36
1.38
1.4
1.42
0.9 1.1 1.3 1.5 1.7 1.9 2.1
De
nsi
ty (
g/m
L)
AlCl3 to imidazolium Cl ratio
Density of AlCl3 EMImCl ILs
25C
55C
80C

76
Figure 47: EMImCl AlCl3 Ionic Liquid Ionic Densities
6.2 Diffusion – Cottrell
With the concentrations known, the diffusion of the reducible species was
investigated with the Cottrell method. The Cottrell data for the 5 to 3 electrolyte at 50˚ C
is shown below, and all other compositions and temperatures were measured using the
same method. The analysis is the same as run previously in chapter 5.3 but is shown
again here with the different electrolyte. The study analysis begins with the current
response to a step to -400 mV vs. Al (1.5:1 AlCl3:EMImCl) reference electrode to initiate
the development of the diffusion layer, shown in Figure 48.
0.003
0.0032
0.0034
0.0036
0.0038
0.004
0.0042
0.0044
0.0046
0.0048
0.8 1 1.2 1.4 1.6 1.8 2 2.2
De
nsi
ty (
mo
l/m
L)
Composition Ratio AlCl3 to EMImCl
Ionic Density
25C
55C
80C

77
Figure 48: Experimental data for Cottrell diffusion measurements
The current response of the system is then plotted vs. the inverse of the square
root of time, and the linear region is extracted, Figure 49. The slope of this line is used to
determine the diffusion rate constant.
Figure 49: Cottrell plot for diffusion measurement
-0.008
-0.007
-0.006
-0.005
-0.004
-0.003
-0.002
-0.001
0
0 20 40 60 80 100 120 140C
urr
ent
(A)
Time (s)
Chronoamperommetry Step, -400 mV 50C 5 to 3 Electrolye
y = 0.0227x + 0.0007R² = 0.9923
0
0.001
0.002
0.003
0.004
0.005
0.006
0.007
0.008
0.1 0.15 0.2 0.25 0.3 0.35
Cu
rren
t (-
A)
Inverse square root time (s-1/2)
Cottrell Linear region 50˚ C 5 to 3

78
The mobility of the reducible species shown by the Cottrell equation demonstrates
an increasing trend in mobility with increasing AlCl3 concentration. There is also a
significant increase in mobility with temperature as expected. The data is shown in Figure
50.
Figure 50: All Cottrell Data EMImCl:AlCl3 Ionic Liquid Electrolyte
All of the electrolyte compositions at all temperatures tested show Cottrell
dependent diffusion layer growth
6.3 Aluminum Reduction in Dynamic Conditions
The Levich equation requires information on the electrolyte viscosity and this was
measured at varying temperature, composition and shear rate. The viscosity in ILs
dependence on temperature is determined by the cation and anion interactions. It is
expected that this IL system could see 4 times reduction in viscosity when heated from
room temperature to 80˚ C (BMIM BF4 4.66 x reduction from 20C (112 cP) to 70C (24
0.00E+00
2.00E-08
4.00E-08
6.00E-08
8.00E-08
1.00E-07
1.20E-07
1.40E-07
1.60E-07
1 1.2 1.4 1.6 1.8 2 2.2
Dif
fusi
vity
(cm
2/s
)
Axis Title
Cottrell Diffusivity
30C
50C
80C
79
cP)) [135]. It will be shown that the ionic liquids are shear thinning under all conditions.
This makes it difficult to apply the Koutecky-Levich analysis directly, as the there is
significant increase in shear rate over the changing RPMs, from 50 to 1000, and this has
significant impact on the viscosity, diffusion layer size and also the diffusion itself.
Initially this was thought to be a small contribution as the viscosity is only a 1/6th power
contribution to the Koutecky-Levich and Levich equation.
The implications of this were more thoroughly investigated in section 6.4 but the
Levich analysis is shown here. As an approximation of the viscosity for application in
calculating diffusion rates the experimentally determined viscosity was fit with
exponential decay equations and the best fit parameters were used in calculations of
viscosity in each rotation rate regime. The viscosity was integrated over the r=0 (center of
the electrode) to r=2.5 mm (edge of the electrode area) with regards to increasing shear
for each of the rotation rates and this approximation of the average viscosity was used
directly in the Levich equation for each solution and temperature. The response of the
electrolyte with varying potential was tested with linear voltammetry, sweeping the
current from 0 mV to -700 mV vs. Al (1.5:1 AlCl3:EMImCl) at 2 mV/s, and the multiple
rotation rates are shown on a single graph. Each linear scan is an average of 3 repeated
scans after stripping and rest steps to ensure clean electrodes and equilibrium initial
conditions. The density and concentration measured at each condition (temperature and
composition) were used in conjunction and the current value was measured at -500 mV
vs. the reference electrode to calculate and compare diffusion rates.

80
6.3a Rheology - Composition, Temperature and Shear Dependence
The 1 to 1 ionic liquid is the extreme condition where the solution is Lewis
neutral and therefore is only composed of the AlCl4- anion and EMIm+ cations and does
not deposit aluminum in the potential window of the electrolyte. This chemistry was used
as a control and end condition. The physical properties such as viscosity and the
electrochemical window of this solution were used as the viable window for the higher
concentration electrolytes that deposit aluminum. The viscosity is shown in Figure 51 and
is representative of the viscosity trends seen in all solutions regardless of composition,
these solutions are shear thinning and reach near Newtonian characteristics around 50
RPM. The other compositions viscosity and parameters were calculated in the same
fashion and results are shown in Appendix D.
Figure 51: Rheology 1 to 1 Ionic Liquid
0
5
10
15
20
25
30
35
0 20 40 60 80 100 120 140
Vis
cosi
ty (
cP)
Shear Rate RPM
Viscosity vs. Shear 1 to 1 IL
9.95C
24.95C
40C
60.1C
79.95C

81
The shear thinning follows the power law (Equation 8),
Equation 8: Shear Thinning Power Law
𝜼 = 𝑲𝜸𝒏−𝟏
Where η is the viscosity, γ is the shear rate, and the K and n constants are derived
from a best fit to the experimental data. The viscosity decreases significantly with
temperature increase, this is a logarithmic relation to temperature and is demonstrated
with a plot of the shear equation constants, Figure 52.
Figure 52: Shear Equation Viscosity Constants 1 to 1 EMImCl:AlCl3 Ionic Liquid
The shear thinning properties increase as the temperature increases, but the
variance is small, shown in Figure 53.
0
5
10
15
20
25
30
35
40
0 10 20 30 40 50 60 70 80 90
Co
nst
ant
Temperature (C)
Shear Equation Constants 1 to 1

82
Figure 53: Shear Equation Exponential Constants 1 to 1 EMImCl:AlCl3 Ionic Liquid
In the 1 to 1 electrolyte conditions the shear thinning property increases at higher
temperatures. This is a minor change, and is less evident as the viscosity is much less in
higher temperatures, and the shear thinning decrease in viscosity is much lower quantity
than in the lower temperature regimes.
6.3b Reaction Kinetics and Temperature – RDE Levich
The electrochemical plot, Figure 54, shows the comparison between the Lewis
neutral solution and a Lewis acidic solution, demonstrating the negligible electrochemical
activity and the reduction of aluminum in higher concentration electrolytes.
0.9
0.905
0.91
0.915
0.92
0.925
0.93
0.935
0.94
0.945
0 10 20 30 40 50 60 70 80 90
n
Temperature (C)
Shear Equation n values 1 to 1

83
Figure 54: Lewis Neutral vs. Lewis Acidic Electrolyte Reduction Characteristics
This negligible reduction of any component in the electrolyte is due to the
absence of the reducible Al2Cl7- anion species. The viscosity gives insight to the physical
properties to the EMIm+ AlCl4- ionic liquid, which will be used in comparison.
The 4 to 3 ionic liquid is the lowest concentration of Al2Cl7- speciation solution
that was tested. This solution is critical for testing because the relatively low
concentration of the reducible species is the only way to investigate the diffusion of said
species. The higher ratio solutions show almost no pure diffusion limitation conditions,
and applying information about the diffusion derived from this system is crucial in
determining other influences and constants. This solution has limited use as an aluminum
depositing chemistry, as the low concentration of reducible species is unnecessary and
causes issues in deposition quality. The 30˚ C scans are shown in Figure 55.
-30.00
-25.00
-20.00
-15.00
-10.00
-5.00
0.00
-1 -0.8 -0.6 -0.4 -0.2 0 0.2 0.4
Cu
rre
nt
(mA
/cm
2)
Voltage vs. Al (V)
Ionic Liquid Deposition Properties
2 to 1 IL 1 to 1 IL

84
Figure 55: 4:3 EMImCl:AlCl3 Linear Voltammetry Scans, 30˚ C
In the 30C bath, the 50 and 100 RPM rotation rate show typical Levich limiting
current at -300mV and stay consistent to around -680 mV, where there is a slight
indication of a new reduction reaction beginning at the tail end. Since the 500 and 1000
RPM rotation rate scans are both linear and overlap they are kinetically limited, because
if there were diffusion influences there would be discrepancies between the different
rotation rates.
The higher RPMs do not show a Levich diffusion limited current and the current
in the 500 RPM scan is much higher than the 50 or 100 RPM scans, the shift to dynamic
conditions also show an increase in diffusion rate over the diffusion rates measured in
static conditions from the Cottrell model. The Levich calculated diffusion rate is roughly
20% higher than the lower rotation rates. Additionally, this is the completely kinetically
limited rate, so the actual diffusion is likely much higher, as the reaction rate continues to
-70
-60
-50
-40
-30
-20
-10
0
10
-0.8 -0.7 -0.6 -0.5 -0.4 -0.3 -0.2 -0.1 0
Cu
rren
t d
ensi
ty m
A/c
m2
Voltage vs. Al (1.5:1 AlCl3 EMImCl)
4 to 3 30˚ C Kinetics
50 RPM
100 RPM
500 RPM
1000 RPM

85
increase as the potential becomes more negative, still following the kinetically limited
current. The reasoning behind the discrepancy between the diffusion rates calculated by
the Cottrell method and the Levich equation, as well as the increased rate at higher
RPMs, along with the Levich kinetic and diffusion data compiled, is presented and
discussed in chapter 6.3c.
Figure 56: 4:3 EMImCl:AlCl3 Linear Voltammetry Scans, 50˚ C
The linear scans at 50˚ C are very similar to those at 30˚ C, with increased kinetic
rates leading to higher reduction currents in all cases. The 500 and 1000 RPM scans are
again linear and again overlapping, indicating the solution surpasses diffusion limitations
at an RPM of lower than 500.
-100
-80
-60
-40
-20
0
20
-0.8 -0.7 -0.6 -0.5 -0.4 -0.3 -0.2 -0.1 0
Cu
rren
t d
ensi
ty m
A/c
m2
Voltage vs. Al (1.5:1 AlCl3 EMImCl)
4 to 3 50˚ C kinetics
50 RPM
100 RPM
500 RPM
1000 RPM

86
Figure 57: 4:3 EMImCl:AlCl3 Linear Voltammetry Scans, 80˚ C
As the temperature increases the deposition current in the 500 and 1000 RPM
scans separate, showing that the diffusion implications are having more effect, as the 500
RPM conditions in lower temperatures are only kinetically limited. This shows that the
increase in kinetic rate due to temperature increases faster than the diffusion implications
in this composition.
The kinetic limitations become less influential in the higher temperature scans and
the diffusion becomes a stronger contributing factor in the electrochemical reduction. The
500 RPM condition is mixed kinetic and without more information it is not possible to
determine the true kinetic limitations, as the 1000 RPM may still have diffusion
limitations and there were not conditions to compare it to.
-200
-150
-100
-50
0
50
-0.8 -0.7 -0.6 -0.5 -0.4 -0.3 -0.2 -0.1 0
Cu
rren
t d
ensi
ty m
A/c
m2
Voltage vs. Al (1.5:1 AlCl3 EMImCl)
4 to 3 80˚ C Kinetics
50 RPM
100 RPM
500 RPM
1000 RPM

87
The 5 to 3 solution at 30˚ C shows the 500 and 1000 RPM rates very consistently
overlaid so they are kinetically limited (not diffusion limited or mixed, because the
different rotation rates do not change reduction rates), somewhat similar, low
temperatures show diffusion limitations on the 50 RPM, mixed on the 100 RPM and only
kinetic limitations on the 500 and 1000 RPM conditions. Diffusion limitations are
observed at higher temps and once again the kinetic rate increases faster than the
increased contribution due to diffusion, as was seen in the 4:3 case.
Figure 58: 5:3 EMImCl:AlCl3 Linear Voltammetry Scans, 30C
There is evidence of diffusion limitations in the 50 RPM scans while the higher
rotation rates (100, 500 and 1000 RPMs) are linear, indicating kinetic or mixed diffusion
and kinetic limitations. There is a slight increase in the tail end of the of the 50 RPM
chemistry that is not shown in the kinetically limited scans. The reducing current does
-80
-70
-60
-50
-40
-30
-20
-10
0
10
-0.8 -0.7 -0.6 -0.5 -0.4 -0.3 -0.2 -0.1 0
Cu
rren
t d
ensi
ty m
A/c
m2
Voltage vs. Al (1.5:1 AlCl3 EMImCl)
5 to 3 30˚ C Kinetics
50 RPM
100 RPM
500 RPM
1000 RPM

88
increase with increasing rotation rate demonstrating at least mixed diffusion and kinetic
influences. As the 100 RPM scan does not show a Levich diffusion limited current
plateau, it is influenced by kinetic limitations. As it is much lower current than the 500
and higher RPM scans it must also be influenced by diffusion limitations, putting it in the
mixed limitation regime.
Figure 59: 5:3 EMImCl:AlCl3 Linear Voltammetry Scans, 50˚ C
The 50˚ C conditions shift the curves slightly, the 100 RPM scans now show
slight diffusion limitations and Levich profiles are present but still show increasing rate
overpotential shifts and are therefore not completely diffusion limited. The 500 RPM and
1000 RPM align showing pure kinetic limitations in both. This indicates more diffusion
limitations at lower RPM (100 and below) and reaches purely kinetic limitations at an
RPM value that is below 500 RPM.
-140
-120
-100
-80
-60
-40
-20
0
20
-0.8 -0.7 -0.6 -0.5 -0.4 -0.3 -0.2 -0.1 0
Cu
rren
t d
ensi
ty m
A/c
m2
Voltage vs. Al (1.5:1 AlCl3 EMImCl)
5 to 3 50˚ C Kinetics
50 RPM
100 RPM
500 RPM
1000 RPM

89
Figure 60: 5:3 EMImCl:AlCl3 Linear Voltammetry Scans, 80˚ C
The 5 to 3 bath at 80˚ C shows the same overlap of the 500 and 1000 RPM scans.
This again indicates only kinetic limitations. The 50 and 100 RPM scans show slight
Levich profiles but never plateau and never purely diffusion limited. although the
currents do not match up as well at this higher temperature. Using the Levich relations
the predicted diffusion limitation currents for 500RPM are 210 to 250 mA/cm2, well
above the observed currents which explains why the 500 and 1000 RPM overlap so
closely, they are truly kinetically limited. All of the scans in the 5 to 3 bath at 80˚ C show
significant kinetic influence.
-200
-180
-160
-140
-120
-100
-80
-60
-40
-20
0
-0.8 -0.7 -0.6 -0.5 -0.4 -0.3 -0.2 -0.1 0C
urr
ent
den
sity
mA
/cm
2
Voltage vs. Al (1.5:1 AlCl3 EMImCl)
5 to 3 80˚ C Kinetics
50 RPM
100 RPM
500 rpm
1000 RPM

90
The 2 to 1 electrolyte scans weren’t purely diffusion limited under any dynamic
conditions measured here. All scans were linearly increasing with overpotential, but do
increase in current with the rotation rate as well, indicating strong kinetic and diffusion
influence and limitations.
Figure 61: 2:1 EMImCl:AlCl3 Linear Voltammetry Scans, 30˚ C
The 2 to 1 30˚ C bath shows all scan rates as both kinetically and diffusion
limited. The simple explanation is that the concentration in this chemistry is too high to
fully reach a diffusion limited regime, while the diffusion still influences the reduction
rates. All of these scans are linear with potential but all of them also change with rotation
rate. Since the 1000 RPM does not align with the 500 RPM condition, it is apparent that
there are still mixed diffusion and kintetic limitations at 500 RPM. However we cannot
determine that the 1000 RPM condition still has any diffusion implications without
further analysis. Compared to the 4 to 3 electrolyte at 30˚ C and accounting for the 120
-90
-80
-70
-60
-50
-40
-30
-20
-10
0
-0.8 -0.7 -0.6 -0.5 -0.4 -0.3 -0.2 -0.1 0
Cu
rren
t d
ensi
ty m
A/c
m2
Voltage vs. Al (1.5:1 AlCl3 EMImCl)
2 to 1 30˚ C Kinetics
50 RPM
100 RPM
500 RPM
1000 RPM

91
mV concentration polarization shows the kinetic limit senen here in the 1000 RPM scan
matches the kinetic limits in the other electrolyte. It is unclear at this point why the mixed
diffusion limitations reduce the current at the 500 RPM scan rate.
Figure 62: 2:1 EMImCl:AlCl3 Linear Voltammetry Scans, 50˚ C
In the 2 to 1 chemistry at 50˚ C all scans are purely linear with potential,
indicating either complete kinetic or mixed kinetic and diffusion limitations. The 500
RPM and 1000 RPM scans overlap at this temperature, indicating they are both purely
kinetically limited.
-120
-100
-80
-60
-40
-20
0
-0.8 -0.7 -0.6 -0.5 -0.4 -0.3 -0.2 -0.1 0
Cu
rren
t d
ensi
ty m
A/c
m2
Voltage vs. Al (1.5:1 AlCl3 EMImCl)
2 to 1 50˚ C Kinetics
50 RPM
100 RPM
500 RPM
1000 RPM

92
Figure 63: 2:1 EMImCl:AlCl3 Linear Voltammetry Scans, 80˚ C
In the 2 to 1 chemistry at 80˚ C there was continual increase in reaction rate. The
50 and 100 RPM rotation rate scans are mixed kinetic and diffusion limitations, as they
show heavy diffusion limited profiles but continually increase in current with increasing
overpotential. This electrolyte exhibits the same trend as the 4 to 3 bath, the kinetics seem
to increase faster than the diffusion, at 80 C, there is a slightly more diffusion limited
characteristics in the lowest rotation rate condition. No conditions measured here led to
Levich limited current regimes, and therefore the diffusion constants determined by
applying the Levich equation are all underestimated.
-250
-200
-150
-100
-50
0
-0.8 -0.7 -0.6 -0.5 -0.4 -0.3 -0.2 -0.1 0C
urr
ent
den
sity
mA
/cm
2
Voltage vs. Al (1.5:1 AlCl3 EMImCl)
2 to 1 80˚ C Kinetics
50 RPM
100 RPM
500 RPM
1000 RPM

93
6.3c Profiling Diffusion and Kinetic Limitations
The complete dataset is represented below, with emphasis on the profile of the
linear voltammetry scan. The diffusion rates for the diffusion and mixed limitation
regimes are given, and the current density at -500 mV vs. reference are also displayed.
The blue areas are pure diffusion limited, the green areas are mixed limitations and the
orange regions are kinetically limited. Most solutions at high rotation rates reach the
kinetic limitations and they are consistent between electrolyte compositions, the
difference in values shown on the graphs is the result of shifted concentration
polarization vs. a consistent concentration reference electrode.
Figure 64: EMImCl Electrolyte Rotating Disc Linear Scan Profiles, 30˚ C

94
Figure 65: EMImCl Electrolyte Rotating Disc Linear Scan Profiles, 50˚ C
Figure 66: EMImCl Electrolyte Rotating Disc Linear Scan Profiles, 80˚ C

95
Since the solutions shift to diffusion limitations at higher temperatures it shows
that the kinetic rates are increasing with temperature faster than the diffusion rate. This is
amplified since at increased temperatures the viscosities are drastically reduced,
decreasing diffusion layers’ thicknesses and reducing the diffusion distances and the
reactions still become more diffusion limited. This must be taken account when trying to
increase deposition kinetics rates with temperature, as it could transition to diffusion
limited regimes and cause poor film quality.
6.4 Analysis of Anionic Mobility
The viscosity measurements gave unexpected trends when compared across the
composition range. Comparing the rheology data with the Cottrell diffusivity data for the
Al2Cl7- anionic species (the Levich data had many kinetically limited influences so
Cottrell was used) showed inverse correlations as expected. The viscosity is highest in the
4 to 3 solution and decreases consistently to the 2 to 1 chemistry (the 1:1 chemistry has
low viscosity as well, on par with the 2:1 solution, but does not have any Al2Cl7-
speciation so it is not shown here). The Al2Cl7-- mobility increases over this range as
shown in Figure 67, and the viscosity measurements are taken from the values of the
rheology measurements at 25 RPM and 25˚ C.

96
Figure 67: Viscosity vs. Al2Cl7- Diffusivity, Normalized
The diffusion of the of the reducible species increases with composition, and it
also increases with shear. This is evident from the increased mobility measured from the
Cottrell method under static conditions and those measured from the Levich method
under dynamic conditions, the comparison is shown in Figure 68, where the Levich
calculated rates is divided by the Cottrell rate. The 2 to 1 solution has underestimated
diffusion rates as all of the measurements are kinetically limited, and therefore actual
diffusion is at least this high but cannot be determined exactly.
0
0.2
0.4
0.6
0.8
1
1.2
1 1.2 1.4 1.6 1.8 2
No
rmal
ized
Val
ue
AlCl3 to EMImCl ratio
Viscosity and Al2Cl7- Mobility
Al2Cl7
Viscosity

97
Figure 68: Increase in Diffusion From Static to Dynamic Measurements
Viscosity decreases with both increasing composition and shows significant
decrease with shear, as seen in the shear thinning property. The correlated increase in
diffusion of the reducible species is likely influenced from this by decreased interactions
between ions that are disrupted under shear. Since the viscosity is lowest at the 1 to 1 and
2 to one compositions, the anionic interactions, either AlCl4- or Al2Cl7
-, with the cation is
likely not associated with the increased viscosity trends. This indicates that the increased
viscosity is possibly due to the AlCl4- or Al2Cl7
- interaction with each other. The
suppressed mobility in the mixed AlCl4-, Al2Cl7
- compositions was thought to be
attributed to fluctuance, attractive interactions between the anionic species, much like van
der Waals attraction commonly seen in cations with long side chains. Gaussian
simulations of the intermediate species in the fluctuance, an Al3Cl102- component
indicates that it would be stable, even though it is comprised of 2 anionic species. This
indicates that anionic attraction is feasible in this case, even with the electrostatic
repulsion. The predicted stable configuration is shown in Figure 69.
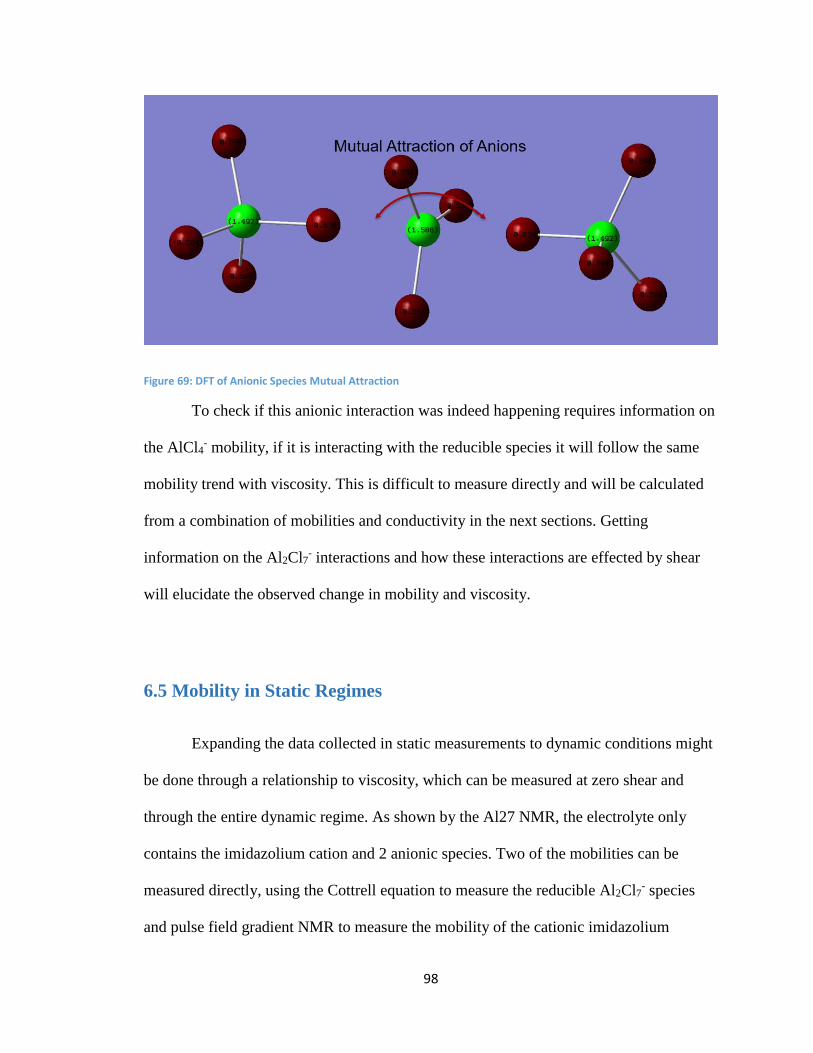
98
Figure 69: DFT of Anionic Species Mutual Attraction
To check if this anionic interaction was indeed happening requires information on
the AlCl4- mobility, if it is interacting with the reducible species it will follow the same
mobility trend with viscosity. This is difficult to measure directly and will be calculated
from a combination of mobilities and conductivity in the next sections. Getting
information on the Al2Cl7- interactions and how these interactions are effected by shear
will elucidate the observed change in mobility and viscosity.
6.5 Mobility in Static Regimes
Expanding the data collected in static measurements to dynamic conditions might
be done through a relationship to viscosity, which can be measured at zero shear and
through the entire dynamic regime. As shown by the Al27 NMR, the electrolyte only
contains the imidazolium cation and 2 anionic species. Two of the mobilities can be
measured directly, using the Cottrell equation to measure the reducible Al2Cl7- species
and pulse field gradient NMR to measure the mobility of the cationic imidazolium

99
species. The third specie’s, the anionic AlCl4-, mobility cannot be measured directly but
should be accounted for in the total conductivity of the solution. Measuring the
conductivity and accounting for the contribution of the two known ionic components
should allow for extraction of information about the AlCl4- mobility.
6.5a Conductivity
The conductivity is a strong indicator of ionic liquid optimized concentration and
diffusion parameters, and measuring the conductivity at varying compositions and
temperatures will give information on the mobility of the ionic components and the
optimal conditions for electrodeposition. The conductivity was measured from room
temperature to 80˚ C in the range of ionic liquid compositions and the data is shown in
Figure 70.
Figure 70: Conductivity of EMImCl:AlCl3 Electrolytes
0
10
20
30
40
50
60
70
20 30 40 50 60 70 80
Co
nd
uct
ivit
y (m
Mh
o/c
m)
Temperature (C)
Conductivity vs. Temperature
2:1 IL
1:1 IL
1.5:1 IL
1.67:1 IL
1.33:1 IL

100
The conductivity increases linearly in each composition over the temperature
range and increases linearly with decreasing AlCl3 composition at all temperatures.
At 25˚ C, the conductivity decreases linearly with increasing AlCl3 composition.
This indicates that the AlCl3 additions that shift the concentration away from the AlCl4-
species are promoting a less mobile Al2Cl7- speciation, but this shift also incorporates a
decrease in total ionic concentrations, as shown by the measurements in Chapter 4. The
summation of this data is shown in Figure 71, comparing the ionic concentrations of each
components to the change in conductivity over the composition range.
Figure 71: Conductivity Trends vs. Ionic Concentrations
The decreasing ionic concentration and shift towards Al2Cl7- both contribute to
the conductivity decrease.
0
0.2
0.4
0.6
0.8
1
1.2
1 1.2 1.4 1.6 1.8 2
No
rmal
ized
Val
ue
AlCl3 to EMImCl ratio
Conductivity and Ionic Concentration
Conductivity
Imidazolium Density
AlCl4 Density
Al2Cl7 Density

101
6.5b PGSE – Imidazolium Diffusivity
Pulse field gradient spin echo NMR was used, as described in chapter 2, to
determine the diffusion rates of the cationic imidazolium species. Data from a scan of the
IL is shown in Figure 72. The profile of this curve along with constants based on pulse
length, time between pulses and instrument specific constants are used to calculate
diffusion constants.
Figure 72: PGSE Data Signal Decay and Diffusion Constant
The PGSE NMR was run for different composition solutions through a
temperature range from 25˚ to 80˚ C, and the results are shown in Figure 73.

102
Figure 73: Cationic Diffusion Data
The proton NMR diffusion data showed increasing rates with increasing
temperature as expected, however there is no significant change in diffusion rate with
varying composition, indicating there is no significant structure change or coordination
with the larger or smaller anionic species that affects the cationic mobility. This is
contrary to the viscosity data and the opposite of the Al2Cl7- trends.
6.5c AlCl4- Diffusivity from Conductivity
While the conductivity decreases as the composition shifts from AlCl4- to Al2Cl7
-,
the ionic concentration also decreases. The conductivity follows the same trend as the
imidazolium concentration and there is likely some contribution of from the anionic
species, with higher contribution from the smaller AlCl4- anion. This ion is smaller and
should have more contribution to the conductivity and the effect is reduced as its
concentration is depleted. The relationship between ionic concentration and mobility to
0.00E+00
5.00E-07
1.00E-06
1.50E-06
2.00E-06
2.50E-06
3.00E-06
3.50E-06
4.00E-06
290 300 310 320 330 340 350 360
Dif
fusi
on
(cm
2 /s)
Temperature (K)
PGSE Cationic Diffusion Data
1
1.33
1.67
2

103
the electrolyte conductivity are given by the Nernst Einstein equation. Applying the
Nernst Einstein equation to only the cationic charge carrier shows it can account for
nearly all of the conductivity in all conditions, as seen in Figure 74 and Figure 75. The
cationic mobility is much higher than the Al2Cl7- species, as was shown previously. The
anionic and cationic diffusivities predict a higher conductivity than is experimentally
measured in some cases and this makes it difficult to determine the anionic species actual
contribution to the conductivity, as. This is very common and has been used as a method
to attempt to determine the “iconicity” of ionic liquids [119].
Figure 74: Nernst Predicted Conductivity of the Cationic Species EMIm+
0.00
10.00
20.00
30.00
40.00
50.00
60.00
0 20 40 60 80 100
Co
nd
uct
ivit
y (m
Mh
o/c
m)
Temperature (C)
Cationic Nernst Predicted Conductivity Contribution
1
1.33
1.67
2
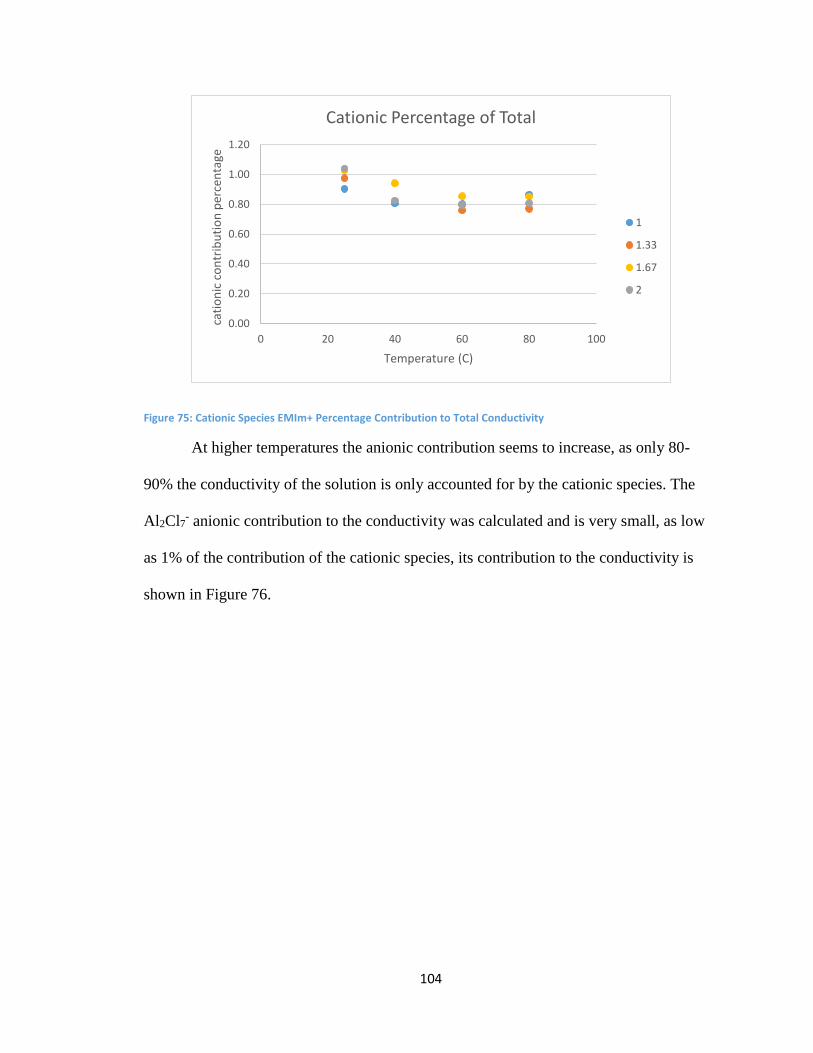
104
Figure 75: Cationic Species EMIm+ Percentage Contribution to Total Conductivity
At higher temperatures the anionic contribution seems to increase, as only 80-
90% the conductivity of the solution is only accounted for by the cationic species. The
Al2Cl7- anionic contribution to the conductivity was calculated and is very small, as low
as 1% of the contribution of the cationic species, its contribution to the conductivity is
shown in Figure 76.
0.00
0.20
0.40
0.60
0.80
1.00
1.20
0 20 40 60 80 100
cati
on
ic c
on
trib
uti
on
per
cen
tage
Temperature (C)
Cationic Percentage of Total
1
1.33
1.67
2

105
Figure 76:Nernst Predicted Conductivity of the Anionic Species Al2Cl7-
If the AlCl4- conductivity is assumed to make up only the difference between the
Nernst predicted and the total conductivity it is also a relatively small contributor. Once
the conductivity contributions of the imidazolium cation and the Al2Cl7- anion are
calculated their participation was subtracted from the experimentally measured
conductivity of each solution. The unaccounted for conductivity is shown in Figure 77
and is assumed to be from only the remaining AlCl4- anionic species.
0.00
0.20
0.40
0.60
0.80
1.00
1.20
1.40
1.60
0 10 20 30 40 50 60 70 80 90
Co
nd
uct
ivit
y (m
Mh
o/c
m)
Temperature (C)
Al2Cl7- Nernst Predicted Conductivity Contribution
1.33
1.67
2

106
Figure 77: Unaccounted for Conductivity from EMIm+ and Al2Cl7- Conductivity Contributions
There are obvious discrepancies as the 2 to 1 electrolyte at elevated temperatures
still has remaining unaccounted for conductivity, even though there is assumed to not be
any remaining species that can contribute. While the 1 to 1 and 1.33 to one show the
largest unaccounted for conductivity they also have the highest concentration of the
AlCl4- species. Applying the Nernst Einstein relation in reverse allows conversion the
conductivity contribution and the AlCl4- concentration to predict the mobility of the
remaining AlCl4- species, shown in Figure 78.
-2.00
0.00
2.00
4.00
6.00
8.00
10.00
12.00
14.00
20 30 40 50 60 70 80
Co
nd
uct
ivit
y R
eal-
EMIm
(+)
Al2
CC
l7(-
) (m
Mh
o/c
m)
Temperature (C)
Unaccounted for Conductivity
1
1.33
1.67
2

107
Figure 78: AlCl4- Diffusivities
Once the concentration has been corrected for, the 1 to 1 solution actually shows
the least contribution from the AlCl4- species at higher temperatures. The intermediate
concentrations show approximately linear increase in diffusion with temperature and are
relatively consistent with each other. AlCl4- is not present in the 2 to 1 solution so it
cannot participate in the conductivity. These values predict diffusivities that are in
between the mobilities of the other two measured species. Since the mobility of the
AlCl4- solution is higher in the mixed chemistries than in the 1 to 1 solution it indicates
that it is not interacting with the Al2Cl7-.
Electron structure theory modelling was done to look more closely at the
reasoning for such variable diffusivities. Since the total conductivity is not necessarily a
direct combination of the mobilities of the ions in solution and their concentration the
mobility AlCl4- species is difficult to directly determine. Using density functional theory
to model the ionic structures it is possible to get size ratios of the components and an
approximation of the mobility based on a comparison. This will also allow for
-4.0E-07
-2.0E-07
0.0E+00
2.0E-07
4.0E-07
6.0E-07
8.0E-07
1.0E-06
1.2E-06
1.4E-06
1.6E-06
1.8E-06
0 10 20 30 40 50 60 70 80 90
Dif
fusi
on
co
effi
cien
t (c
m2
/s)
Temperature (C)
Diffusivity of AlCl4- anion
1
1.33
1.667

108
approximations of the theoretical density, which will give indications of the open volume
of the solution and information on the hole type transport that is potentially important in
these electrolyte systems.
6.5d Ionic Size Comparison and Mobility Differences – Gaussian
Density functional theory was done to determine the size and size ratio of the
ionic species in solution. The size ratios are a method to determine the probability of
motion, as the AlCl4- anionic species mobility is not easily measured, doing a theoretical
size comparison gives insight to its mobility. Molecular mechanics of solutions this
would require significant effort, but the size analysis alone verifies the size discrepancy
between ions and validates the varied mobilities as well as the high contribution of the
smaller cationic species to the conductivity of the solution. The predicted optimized low
energy configurations are shown in the next Figure 79.
Figure 79: DFT Modelling EMImCl AlCl3 Ionic Components

109
The actual density divided by theoretical density gives an approximation of the
filled space in the solution, and the difference indicates the amount of free space, leading
to holes in the solution that allow for hole type transport. Using Gaussian with DFT
B3PW91 method and 6-311G basis set with “tight” restrictions to volume calculations the
theoretical volume and predicted solvation radii of the cationic and anionic species were
determined, these values are shown in Table 2: Ionic Size Calculations. These simulations
did not give identical results but the convergence tolerance could not be set to any tighter
constraints. To correct for the variation, the simulations were run repeatedly until the
resulting data gave a standard deviation of below 5%.
Table 2: Ionic Size Calculations
Al2Cl7- AlCl4
- EMIm+
Stokes radius (A) 5.004 4.33 4.14
Volume (cm3) 2.88E-22 1.76E-22 1.52E-22
Normalized values Al2Cl7- AlCl4
- EMIm+
Stokes radius 1 0.87 0.83
Volume 1 0.61 0.53
Simulations of multiple ions together were optimized to minimum energy
conditions and the volume was calculated and in call cases the volume was consistent to
additions of the individual ionic species volumes in combination, so there were no shown
effects of ionic interactions affecting the theoretical density. Using the solution
concentrations and the theoretical volume of each ion the theoretical density of the
solution was calculated. The theoretical and experimental densities are shown in Figure
80 for comparison.

110
Figure 80: Density Comparison, Theoretical vs. Real
The ratio of theoretical density to experimentally measured density is shown in
Figure 81, and this is a representation of the free volume between ions in solution, and is
considered a strong indicator of transport properties of the components in solution.
Figure 81: Theoretical Open Volume of EMImCl AlCl3 Ionic Liquids
The percentage open volume increases with increasing AlCl3 concentration, these
values are likely underestimated as there is some overestimation of ionic volume built
1.25
1.3
1.35
1.4
1.45
1.5
1.55
1.6
0 0.2 0.4 0.6 0.8 1 1.2
Den
sity
(g/
cm3
)
Composition of Al2Cl7-
Theoretical vs. Real Density
Theoretical
Real
0
2
4
6
8
10
12
0 0.2 0.4 0.6 0.8 1 1.2
Per
cen
tage
of
theo
reti
cal v
olu
me
Composition Al2Cl7-
Percentage Open Volume

111
into the modelling software to be more representative of real systems, but the trend will
be consistent. This theoretical density calculation for volume does not relate to the
decreasing conductivity with increasing composition, as the trends should be the opposite
of observed. Therefore, the hole mobility mechanism does not affect the mobility of the
EMIm+ cations. The larger Al2Cl7- species diffusion increases with composition shifts
and may be influenced by the increased open volume. The observed decreasing viscosity
trend with increasing AlCl3 content may be attributed to increasing hole volume
competing with increasing ionic size, and levels back to the 1 to 1 composition viscosity
value by the time the 2 to 1 composition is reached. It is evident from the conductivity,
viscosity and diffusivity data that there are unequal contributions from the various ions.
6.6 EMImCl AlCl3 IL Electrolytes Summary
It is clear that viscosity is well correlated to the mobility of the Al2Cl7- anion. To
investigate the shift in mobility that may be associated with the shear thinning of the
electrolyte, the viscosity in the static regime was determined and compared to the reduced
viscosity due to shear thinning. The viscosity in the shear regime, as well as the
mobilities in the static (Cottrell) and dynamic (Levich) conditions have been calculated.
Falling ball measurements were done to find the viscosity in zero shear conditions, and
the stokes calculated viscosities from the falling ball experiments were variable between
electrolyte compositions but may still be valuable as predictions of low shear viscosity.
The spheres interact differently with the solutions depending on the Lewis acidity and
this appears to strongly influence the mobility and therefore the viscosity measurement as
a whole, this data is shown in Figure 82.

112
Figure 82: Zero Shear Viscosity Measurements
The more acidic solutions show significantly lower viscosities; this may be
accurate but may require more testing to show they are not strongly influenced by particle
electrolyte interactions. Measuring the viscosity in a static electrolyte with the falling ball
technique showed a significant decrease in viscosity with increasing temperature in all
cases. The temperature dependence of the viscosity in each solution is used assuming that
the particle-electrolyte interactions are also consistent. The falling ball measurements
were made to elucidate the variance in Al2Cl7- mobility between static and dynamic
conditions. For this comparison, Figure 83 again shows the ratio of increase in Al2Cl7-
mobility from static to dynamic regimes, and Figure 84 shows the ratio of decrease of
viscosity from static measurements to dynamic measurements.
0
10
20
30
40
50
60
70
80
90
0.9 1.1 1.3 1.5 1.7 1.9 2.1
Vis
cosi
ty (
cP)
Ionic Liquid AlCl3 to EMImCl ratio
Falling ball Viscosity Calculations
25 C
40 C
60 C

113
Figure 83: Increase in Diffusion From Static to Dynamic Measurements
Figure 84: Viscosity Change from Static to Dynamic Conditions
It is evident that the two are closely related as the changing viscosity again
correlates to increasing Al2Cl7- mobility.
0
0.5
1
1.5
2
2.5
3
1 1.2 1.4 1.6 1.8 2 2.2
Mu
ltip
lier
Composition AlCl3:EMImCl
Viscosity Multiplier of Zero Shear to Dynamic Regime
25 C
40 C
60 C

114
Comparing the conductivity to viscosity shows discrepancies, the viscosity has a
peak at the 4 to 3 ratio electrolyte and then decreases, while the conductivity decreases
over the entire composition regime, shown in Figure 85.
Figure 85: Conductivity and Viscosity Comparison
These two qualities should be inversely correlated and are not, indicating that
there are different mechanisms dictating the trends in each. The decreasing viscosity at
increasing AlCl3 compositions does not match the mobility trends of the smaller AlCl4-
and EMIm+ species in solution. It does show a strong correlation to anionic Al2Cl7-
motion. This demonstrates that this trend of viscosity is dictated by the Al2Cl7- anion, and
separately, the conductivity is determined from the smaller species that are more mobile.
The mobility of Al2Cl7- and viscosity are related, and shear forces that decrease the
viscosity are expected to increase the Al2Cl7- diffusion.
0
0.2
0.4
0.6
0.8
1
1.2
1 1.2 1.4 1.6 1.8 2
No
rmal
ized
Val
ue
AlCl3 to EMImCl ratio
Conductivity and Viscosity
Conductivity
Viscosity

115
Chapter 7: Particle Incorporation and Testing – SEM, EDS, DSC
The deposition characteristics of aluminum in different electrolyte compositions
was thoroughly explored and codeposition began. Initially codeposition was performed in
the optimized low temperature conditions, in the 50% diluted toluene BMImCl chemistry
with 50g/L Ni particulates. This was to test the incorporation properties and would allow
us to modify the electrolyte to accommodate the codeposition process.
7.1 Incorporation onto Rotating Disk Electrodes
While the aluminum deposition was smooth and compact, there was no particle
incorporation under any conditions using the RDE alone. Incorporating NIB magnets
behind the electrode enhanced the attraction of particles to the electrode and ultimately
led to particle incorporation. The particles incorporated under these conditions were
loosely agglomerated and incorporation quantity was lower than the stoichiometric target
of 40% nickel by volume. These were expected outcomes because the particles were only
weakly attracted to the surface and the target high particle loading is difficult to achieve
without significant optimization. The incorporation values that were achieved were
enough to test the interface of the particulates in the deposited matrix and also test for
calorific output. A EDS map of a FIB cross section of the codeposited film are shown in
Figure 86.

116
Figure 86: SEM and Elemental Analysis of Codeposited Film
The SEM image with EDS mapping shows particle incorporation in the ~10%.
The film was tested for energetic alloying with differential scanning calorimetry. The
data indicates that there is indeed aluminum and nickel present in the codeposited films.
The DSC plot is shown in Figure 87 and the nanofoil film is shown as an ideal
comparison.
Figure 87: Calorific Output of Initial Codeposited Film

117
The large endotherm at 660˚ C is the melting point of aluminum and the
absorption of aluminum from the large excess remaining of the pure metal. The shift to
higher temperatures for the initiation of the exothermic reaction is possibly due to a
native oxide on the nickel particles that were incorporated. At this point there was no
chemical cleaning done specifically to remove this oxide. It should be attacked by the
Lewis acidic electrolyte chemistry. The shift and poor stoichiometry may also be due to
larger particle sizes than optimal or agglomeration of the particles in the incorporation.
This is in correlation with the limited calorific output, and indicates among other things
the non-optimized stoichiometric ratios of reactants. Incorporating particles require
significant increase in attractive forces and switching to sedimentary codeposition
conditions was utilized to improve incorporation volumes.
7.2 Increase Incorporation with Sedimentary Codeposition
The stoichiometric ratio was improved with a shift to sedimentary codeposition,
the reaction vessel is shown in Figure 88.

118
Figure 88: First Generation Sedimentary Deposition Reaction Vessel
The deposition became much more complicated as particles tend to accumulate on
the surface, and the films became porous and low quality as seen in Figure 89.
Figure 89: Film Deposited in Sedimentary Reaction Vessel

119
The DSC test was much improved and was approaching roughly half of the
expected energetics, Figure 90.
Figure 90: Calorific Output of Sedimentary Codeposited Film
There is still a significant shift toward higher temperatures but not as drastic as
the previous test. There is also the remaining aluminum endotherm but this is also
diminished when compared to the previous test, indicating better reaction stoichiometry.
Improving the aluminum deposition quality was the driving force of further investigation
of the electrolyte properties and the development of the new reaction vessel and
optimized parameters.

120
7.3 Decrease Agglomeration with Surfactants
There was a significant problem with particle flocculation in regimes that allowed
for sedimentary codeposition. These agglomerrations of particles become quite large, on
the order of 100 um as shown in Figure 91.
Figure 91: SEM of Agglomerated Particles in Sedimentary Deposition Vessel
A variety of surfactants were looked into to mitigate these agglometrations and
improve stable colloidal solutions. These were predominately surfactants that have been
used in aqueous solutions and the first step was to test the solubility and chemical
compatibility with the ionic liquid. The solubility of tartaric acid diammoinium salt was
very low and ethylene diamin tetraacetic acid had no solubility. Sodium dodecyl sulfate,
Centronium Bromide, saccharin and sodium saccharin salt all have solubility that meet
the criteria as a pass (>2wt%). Oleic acid is liquid and seems to be miscible in the ionic
solution as well. Cyclic voltammetrically testing these mixtures in nuetral ionic liquids
that are not electrochemically reducible in the window tested will verify if they are
electrochemically stable in the needed range, the results are shown in Figure 92.
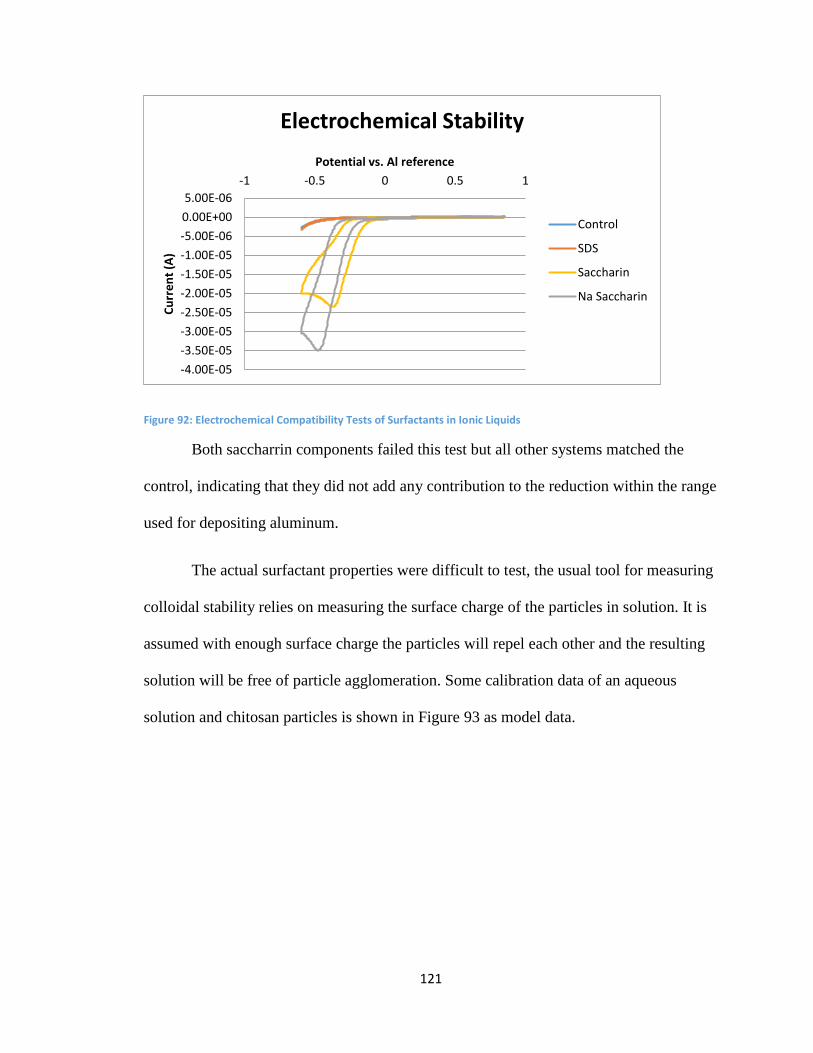
121
Figure 92: Electrochemical Compatibility Tests of Surfactants in Ionic Liquids
Both saccharrin components failed this test but all other systems matched the
control, indicating that they did not add any contribution to the reduction within the range
used for depositing aluminum.
The actual surfactant properties were difficult to test, the usual tool for measuring
colloidal stability relies on measuring the surface charge of the particles in solution. It is
assumed with enough surface charge the particles will repel each other and the resulting
solution will be free of particle agglomeration. Some calibration data of an aqueous
solution and chitosan particles is shown in Figure 93 as model data.
-4.00E-05
-3.50E-05
-3.00E-05
-2.50E-05
-2.00E-05
-1.50E-05
-1.00E-05
-5.00E-06
0.00E+00
5.00E-06
-1 -0.5 0 0.5 1C
urr
en
t (A
)Potential vs. Al reference
Electrochemical Stability
Control
SDS
Saccharin
Na Saccharin

122
Figure 93: Zeta potential of Chitosan Nanoparticles in Aqueous Solution
It is apparent that the peak is well resolved, with a maximum count of around
30000. These are non-conducting particles in a well understood aqueous medium. In
contrast, the data derived from running the same tool on the ionic liquid solution and
Nickel particles shows no resolution even at much greater count numbers, Figure 94. This
is caused by either the ionic nature of the electrolyte or the conductive properties of the
particles. Changing either of these would lead to data that was not relatable to our current
system, so implementing a control for correlations was not possible and other options
were looked into.

123
Figure 94: Zeta Potential Measurement of Nickel Particles in Toluene Diluted Ionic Liquid
To test if the solution was stabilized, particles were mixed in uniform ionic liquid
solutions each containing different surfactants and compared against a control solution
without surfactants. The solutions were checked at regular times to see if the surfactants
had any effect on settling rate. It was determined that there was little to no effect with any
surfactants, likely they do not contribute to surface charging in a significant way in the
strongly ionic medium. Measuring the particle settling was attempted with a quartz
crystal microbalance but the frequency shifts of the quartz due to particle settling was
very small and undetectable. Since the particles were only settling on the surface and not
being incorporated onto it the mass change was negligible and the microbalance was only
measuring the change in viscosity in the solution due to particle presence. The continuing
increase of particles at the surface with increased settling would likely influence the
viscosity further but determining this dependence would take another endeavor into
properties that was beyond the scope of this work.
124
The particles can be separated with physical agitation and are temporarily stable in the
ionic liquid, partially due to the relatively high viscosity.
7.4 Improve Plating with Reactor Design – COMSOL
Physical agitation is the best approach to suspending the particles in solution. This
is achieved without affecting the plating conditions by implementing a separate reservoir
that has a stir bar and the fluid flow into the reaction vessel is basically unperturbed from
these conditions. A reaction vessel where the codeposition occurs was designed with an
impinging jet fluid flow to replicate conditions of the rotating disk electrode as closely as
possible with an increased area allowing for larger films to be produced. The reactor
vessel continues to use sedimentary deposition techniques to improve incorporation as
gravity assists particle motion to the electrode surface. The reaction vessel and separate
reservoir is shown in Figure 95 and Figure 96. The tubing and materials were tested by
immersion in the electrolyte and testing both for color changes and details are shown in
Appendix B. Viton tubing and Teflon were the materials of choice for chemical and
temperature compatibility.

125
Figure 95: Electrodeposition Reaction Vessel
Figure 96: Two Chamber Reaction Vessel for Controlled Solution Flow and Solution Mixing

126
7.4a Modelling CFD and Particle Tracing
It is crucial to understand the viscosity and reaction properties in order to
optimize the arrival rate of particles as well as optimize the electrochemical reduction of
the matrix. These properties can be modelled with multiphysics software, which is
utilized to determine computed fluid dynamics and particle motion in the system. Some
representative solutions of the system are shown in Figure 97.
Figure 97: Comsol CFD and Particle Tracing in Reaction Vessel
The fluid flow follows a consistent path in each model tested, with increasing
velocities as the flow rate is increased. In all cases the electrolyte enters the reaction
vessel and impinges on the electrode surface before spreading out uniformly and making
its way towards the outlet. Particle tracing in the system shows that at high flow rates of
>100 mL/min roughly half the particles come into direct contact with the electrode center
but are swiftly sheared away. The lower flow rates from 3-10 mL/min show particles
following the bulk solution flow and no electrode contact, while intermediate conditions
show intermediate results, increasing contact quantity with flow rate but also increasing

127
shear at the surface. Increasing the forces to bring particles to the surface without
increasing flow rate will be important, and the assistance due to gravity in sedimentary
codeposition may not be enough. Magnetic attraction was under initial investigations and
was showed to be promising results.
The only forces that act on the particles that we have control over are the shear
due to agitation, gravity and possibly magnetic attraction. Agitation is utilized to bring
particles to the electrode but is also the key factor that removes them. It is required to
utilize gravity as much as possible by reducing the fluid flow and adjusting the particle
loading. This will ensure that the correct number of particles make it to the surface. The
optimization is required so that the particle arrival rate matches the matrix growth rate, as
the arrival of too many particles will lead to a spongy porous film, and not enough
particles will give low loading. The deposition rate is determined by the residence time of
particles on the electrode, as the nanoparticles have limited time to be incorporated before
being removed by electrolyte flow. The low flow leads to high diffusion distances of the
aluminum precursors, and the diffusion rate and replenishment are important to note. The
conditions were determined from the RDE data, which details the deposition regime
based on fluid flow. Ensuring that the regime is not diffusion limited is paramount to
generating a quality film, and the agitation can be calculated to ensure significant
overhead and solution replenishment. Comsol modelling was used to determine the
probability of particles coming into contact with the electrode, the non-Newtonian fluid
flow was simulated at different flow rates with 100 particles initially dispersed at the
beginning of the simulation. The number of particles that interacted with the electrode

128
was strongly dependent on flow rate, with more particles contacting the surface with
increased flow rates but also significantly higher shear rates under these conditions.
Chapter 8: Intermetallic Alloying and Passivation – TEM
Comparisons are made between the electrochemically produced film and the
commercial PVD film. These are characterized by energy release and interphase size. The
high interfacial area of these films is subject to atomic diffusion which can reduce the
burn characteristics. TEM analysis of the interfacial layers seems to indicate that the
lower temperature process associated with codeposition can reduce this pre-reaction
mixing, and is equivalent or better than the sputtered films in our first deposition attempt.
Accelerated aging is being performed on film from both fabrication methods and
increased temperature heavily influences interatomic mixing. TEM of the nickel particle
and aluminum interface are shown in Figure 98 and the Spectrum is shown in Figure 99.
Figure 98: TEM and Elemental Mapping of a Particle Codeposited in Aluminum Film

129
Figure 99: Elemental Spectrum of Codeposited Particle and Interface with Electrodeposited Aluminum
The interface shows slight mixing of the aluminum and nickel at the interface as
well as some oxygen impurity which is likely why the energetic output is shifted towards
initiating at higher temperatures.

130
Chapter 9: Conclusions
The aim of this project was to codeposit an energetic thin film, with aluminum
matrix and nickel nanoparticle inclusions. The codeposition process is complicated with
variables including particles size, particle loading, electrolyte choice, plating parameters
and fluid flow. The flow is determined by the electrolyte viscosity and reactor design,
where the viscosity depends on composition and temperature. The nanoscale particles in
this project have very high shear forces because of their high surface area and low mass,
which decreases their residence time on the electrode surface. This necessitates
maximizing the forces that bring them into contact with the electrode and minimizing
shear forces that quickly remove them before they can become entrapped. The particles
are conductive and it is important that they not accumulate on the electrode at more than
monolayer thicknesses, as this leads to porous and spongy coatings. This necessitates
control over the fluid dynamics and matrix growth. The aluminum deposition is central to
the codeposition process, where the growth rate must be high enough to entrap particles
but balanced with their arrival rate, to increase the volume percent of the particles. The
presence of electroactive species at the electrode must be sufficient to supply whatever
growth rate is needed, and the reaction kinetics and diffusion were investigated in full.
Initial solutions tested included aprotic solvents and aromatics. Most aprotic
solutions were difficult to work with due to high volatility and reactive components. The
aromatics required significant additions of complexing salts such as KBr but gave low
rate deposition, although they were easier to work with than the higher volatility THF
baths.

131
A handful of ionic liquid electrolytes were looked at, and the imidazolium
chloroaluminates showed the most promise with large electrochemical windows, high
aluminum precursor concentration, chemical stability and low vapor pressures. The
TFSA electrolytes were more expensive and complicated without benefit. The
dicyanimide electrolyte was looked at because of its high conductivity and low viscosity
but the complex was reactive with aluminum and was not capable of aluminum
deposition.
BMImCl and AlCl3 solutions were tested with dilution agents. The speciation of
the aluminum complex was verified with NMR and is solely dependent on composition
and independent of temperature. Toluene and dichlorobenzene were used as co-solvents
and were found to be suitably chemically inert, while ethylene carbonate influenced the
chemistry significantly. Both aromatic co-solvents impart much lower viscosity to the
ionic liquid electrolyte vs. the neat solution, and in doing so change the properties
dramatically. The solutions were tested at varying overpotentials to examine the deposit
morphology and purity. Optimum deposition at room temperature was found at -600 mV
vs. Al QRE, increasing the overpotential to -1000 mV resulted in breakdown of the
electrolyte and impurity incorporation, specifically chlorine. The deposits from these
solutions also became dendritic and dark, especially around the edges. Deposition at -
1500 mV continued this trend, and the electrolyte breakdown lead to large quantities of
chlorine and carbon in the deposit. Additions of dilution agents improved the deposit
quality and smoothness while cutting the electrolyte cost. Increasing the co-solvent also
lowers the deposition rate since the precursor concentration decreases.

132
Once a range of working solutions were found, ionic mobility and conductivity
were tested to find the optimal electrolyte for deposition. The diffusivity increases
continually with co-solvent addition and the ionic carrier concentration is decreases,
resulting in a maximum in the conductivity. This maximum of conductivity was
confirmed to be the best plating chemistry, although further dilutions give suitable
deposits and a lower cost per unit volume, with decreasing plating rate.
Rotating disk electrode tests at room temperature on the neat BMIm+ Al2Cl7-
solution show kinetic limitations at roughly 10 mA/cm2 and minimal dependence on
diffusion limitations. The Tafel behavior of the reaction shows that the charge transfer
coefficient was 10-8 mA/cm2, which is quite slow. Even at the low overpotential range,
the nucleation properties were found to still be very much instantaneous. At low or no
agitation, the diffusion rates are slow and distances are high, potentially explaining the
constant instantaneous nucleation result even though most tests in dynamic systems are
kinetically limited. The instantaneous results also indicate that the overpotential for
continuing deposition on a metal substrate is lower than the carbon electrode. This has
significant impact on particle deposition, as the conductive particles are much more likely
to be coated when in contact with the electrode than the matrix growth around from a
carbon electrode surface.
Increasing the deposition rate can be accomplished by increasing temperature.
The static condition diffusion rates were determined with chronoamperommetry and the
Cottrell equation and showed trends of increasing diffusion with temperature and AlCl3
composition. Dynamic conditions were investigated with the rotating disc electrode. The
EMImCl AlCl3 ionic liquid system was tested at varying compositions and temperatures,

133
which change the ionic concentration, density and viscosity. The density and rheology of
all EMImCl AlCl3 solutions at temperatures from 25-80˚ C was investigated for use in
electrochemical measurements. These solutions were found to be shear thinning. The
rotating disk electrode was capable of measuring the diffusion and kinetic limitations
under most of the conditions. The lower concentration aluminum electrolytes show pure
diffusion limitations at low temperatures and low shear rates, while increasing the
aluminum concentration as well as increasing rotation rates lead to either mixed kinetic
and diffusion limitations or purely kinetic limitations. Increasing the temperature
increases both the diffusion rate and reaction kinetics, but it increases the reaction rate
more so. The diffusivities calculated from the Levich equation under shear conditions
were always higher than the diffusivities calculated in the static conditions in the same
electrolyte and at the temperature.
The increased viscosity and low mobility of the Al2Cl7- species was thought to be
attributed to an anionic interaction, since it only occurred in the mixed anionic species
solutions. The mobility of the AlCl4- species would also be retarded in this case, so it was
determined through 2 more experiments. The conductivity is based on the Nernst-
Einstein equation and is an accumulation of the concentration and mobilities of all ions in
solution. The conductivity increases linearly with temperature and decreases with AlCl3
content. This is the opposing trend compared to Al2Cl7- mobility and viscosity. The
mobility of the cationic species was directly measured with PGSE over changing
temperatures and composition. These results showed increase over the range of 25 to 80˚
C and no trend based on composition, indicating the cation did not coordinate more
strongly with either anionic species and the structure was not changing significantly

134
enough to impact its mobility. The mobility of the cationic species is up to 40 times
higher than the Al2Cl7- anion, and contributes much more strongly to the conductivity.
The AlCl4- anionic species mobility was calculated by subtracting the contributions of the
imidazolium and Al2Cl7- determined from PGSE and Cottrell, respectively, from the
experimentally determined conductivity. The AlCl4- diffusion is the lowest at the pure
EMIm and AlCl4- solution, which was not expected and indicates it likely does not
coordinated strongly with the Al2Cl7-. Its mobility was found to be much higher than the
Al2Cl7-, but is still lower than the cationic species. The viscosity and Al2Cl7
- complex is
significantly correlated, as the viscosity and Al2Cl7- trend similarly with changes in
composition whereas the other components do not match. The mobility of the Al2Cl7- is
certainly much lower than the cationic species, clarifying the minimal contribution of the
large ion to conductivity, where the EMIm+ and AlCl4- contributions dominate.
Gaussian was used for density functional theory molecular optimizations, and
based on size comparisons of the ions the stokes size of the AlCl4- is 10% larger than the
cationic species and only 60% the size of the larger anion, verifying that it’s mobility is
should be similar to the cation. The theoretical density of the solution was calculated and
compared to the experimentally measured density, giving insight into the open volume.
This trends toward increasing open volume with increasing AlCl3, and the increase in
viscosity in the mixed solutions can be attributed to two competing trends, increasing
ionic size as more Al2Cl7- is produced and increasing open volume that allows for more
ionic motion. The larger Al2Cl7- species benefits more from the increasing hole volume
whereas the smaller ions are free to move in the smaller holes present in the lower

135
concentration solution. This is the reasoning for consistent mobility of the EMIm+ in all
compositions.
The viscosity decreases with shear, and this is likely due to breaking up of
electrostatic attractions in solution. The mobility of the Al2Cl7- species increases with the
decreasing viscosity, potentially from reduced resistance from ionic attractions or
increased probability of interacting with an open volume large enough to traverse. These
trends clearly show that the cationic mobility and AlCl4- contribute to the conductivity
and the Al2Cl7- influences the viscosity, and in turn, is influenced by changes in viscosity.
Particle incorporation using the RDE alone lead to no particle incorporation in
pure aluminum films. Utilizing magnetic attraction allowed for increased particle
residence time and incorporation around 12% by volume. Sedimentary codeposition was
used to increase the residence time, but led to poor quality deposits due to particles
settling and accumulating on the electrode. The films with low agitation were porous and
rough but had much higher nickel content, near 20% by volume. It was apparent the
particles tended to flocculate under relatively static conditions and it was also apparent
that the particles would require significant optimization of the flow parameters on the
electrode to balance their arrival rate and residence time.
To stabilize the colloidal solutions, many surfactants were tested for solubility and
electrochemical stability and it was determined that the surfactants that passed
preliminary chemical compatibility testing still had no measurable effect in the ionic
liquid system. The chosen method to keep particles suspended in solution was to have
sufficient agitation to separate the particles from each other. To allow for the physical
agitation required to keep the particles separated and also the control of the flow over the

136
electrode the reactor vessel was broken up into two components, one to stir the solution
and keep it well mixed and one to deliver the electrolyte and particles in a controlled
manner onto the electrode.
The second chamber was designed to bring particles directly to the cathode
surface and spread them uniformly so they could be incorporated in the growing
aluminum film. This is a complex system as the faster flow rates bring more particles to
the surface while also decreasing their residence time and removing them from the
surface. The balance of particle arrival and the electrodeposition parameters is vital, and
the flow parameters were modelled with Comsol CFD simulations to determine particle
motion. The particle tracing module shows that at high flow rates of >100 mL/min in our
system roughly half the particles come into direct contact with the electrode center but
are swiftly sheared away. The lower flow rates, from 3-10 mL/min show particles
following the bulk solution flow and minimal electrode contact. Increasing the forces to
bring particles to the surface without increasing flow rate will be important, and the
assistance due to gravity in sedimentary codeposition may not be enough. Magnetic
attraction was under initial investigations and was shown to be promising.
Optimization of the flow and electrolyte system could easily be done with the
information found in this project, further testing that needs to be accomplished would be
more tests in the reaction vessel to determine Langmuir absorption constants and better
approximations of the particle critical residence time. Higher temperature solutions with
dilution agents can be implemented, as well as magnetic forces to increase the particle
residence time and attraction to the electrode surface. Based on the kinetics of the tested

137
EMImCl chemistry at 80˚ C the codeposited film growth rate could reach as high as 150
µm/hour.
Differential scanning calorific output of the codeposited films showed exothermic
properties, with low roughly half the heat of the ideal film due to lower than desired
nickel content. The temperature of activation is shifted towards higher temperatures as
most likely due to a native nickel oxide on the particles, decreasing the interfacial
interaction. Testing the particles that were incorporated with TEM showed they have
similar interaction distance between the different metals when compared the PVD films,
which is deemed acceptable and methods are under review for decreasing or remove the
oxide formation.

138
Appendices
Appendix A: Nucleation and Growth Mode Testing
It has been reported that the nucleation model in ILs is instantaneous [86, 93],
likely due to the low diffusion rates and possible effects of the aluminum precursor being
negatively charged. The nucleation was studied as described in chapter 2, and the
instantaneous growth mode was present under all circumstances tested involving a 2:1 IL
composition at different dilutions with toluene and dichlorobenzene dilution agents. This
growth mode may shift to progressive at lower AlCl3 ratios (below 1.5:1) or with high
additions of LiCl (<10%) [102]. The tests in the literature are generally at several
hundred mV of overpotential [136], so testing lower values was performed, as the
decreased kinetic rate may have shifted the regime toward more progressive modes. This
was not the case. A selected set of results are shown below (Figure 100) compared to the
theoretical models of progressive and instant nucleation, they are clearly instantaneous
[136].
Figure 100: Nucleation Testing at Low Overpotentials
0.0
0.2
0.4
0.6
0.8
1.0
1.2
0 2 4 6 8
No
rmal
ize
d C
urr
en
t
Normalized Time
160 mV
Progressive
Instant
70 mV

139
Under these static conditions, the diffusion rates were slow and diffusion distances were
high, potentially explaining the constant instantaneous nucleation results seen here, even
though most tests in dynamic systems were kinetically limited.

140
Appendix B: Material Compatibility
The fluid in the reactor vessel is pumped with a Cole-Parmer Masterflex
peristaltic system. The tubing must be temperature capable and chemically compatible
with the ionic liquids up to 100 C. Most of the chemically resistant tubings are only
suitable to moderate temperatures, probably due to the fact they have to be malleable to
compress and flow fluids. Chem-Durance has the great chemical resistance but is only
suitable up to 74˚ C and Tygon only up to 57˚ C. These were ruled out and Viton
(suitable to 205˚ C) and Norprene (135˚ C) were tested for chemical compatibility. They
were tested by immersion in the ionic liquid. The ionic liquid before and after exposure is
shown in Figure 101.
Figure 101: Norprene and Viton Compatibility Testing with Chloroaluminate ILs

141
It is apparent from this test that the Norprene resulted in strong color change in the
ionic liquid and failed with regards to chemical compatibility. The Viton in solution
showed no change to either the solution or the tubing, and was used for all further
applications (reaction vessel and falling ball apparatus).

142
Appendix C: BMImCl ILs and Dilutions, Images/SEMs
Films deposited in neat and diluted systems were prepared and investigated with
SEM and EDS, the results are shown in the proceeding section. Utilizing a more dilute,
3:2:1 Toluene:BMImCl: AlCl3 solution at -600mV produced a white, dull and compact
deposit with the highest plating rates measured, shown in Figure 102.
Figure 102: Aluminum Deposited on Cu in a 3:2:1 Toluene:AlCl3:BMImCl Electrolyte at -600 mV vs. Al QRE
The SEM shows the relative smoothness of the deposition as well as the minor
surface roughness that prevents the film from being shiny, shown in Figure 103.
Figure 103: SEM of 3:2:1 Toluene:AlCl3:BMImCl Electrolyte at -600 mV vs. Al QRE Deposition
At higher magnification and focusing on the edge there are evident edge effects
from increased current density in this region, Figure 104.
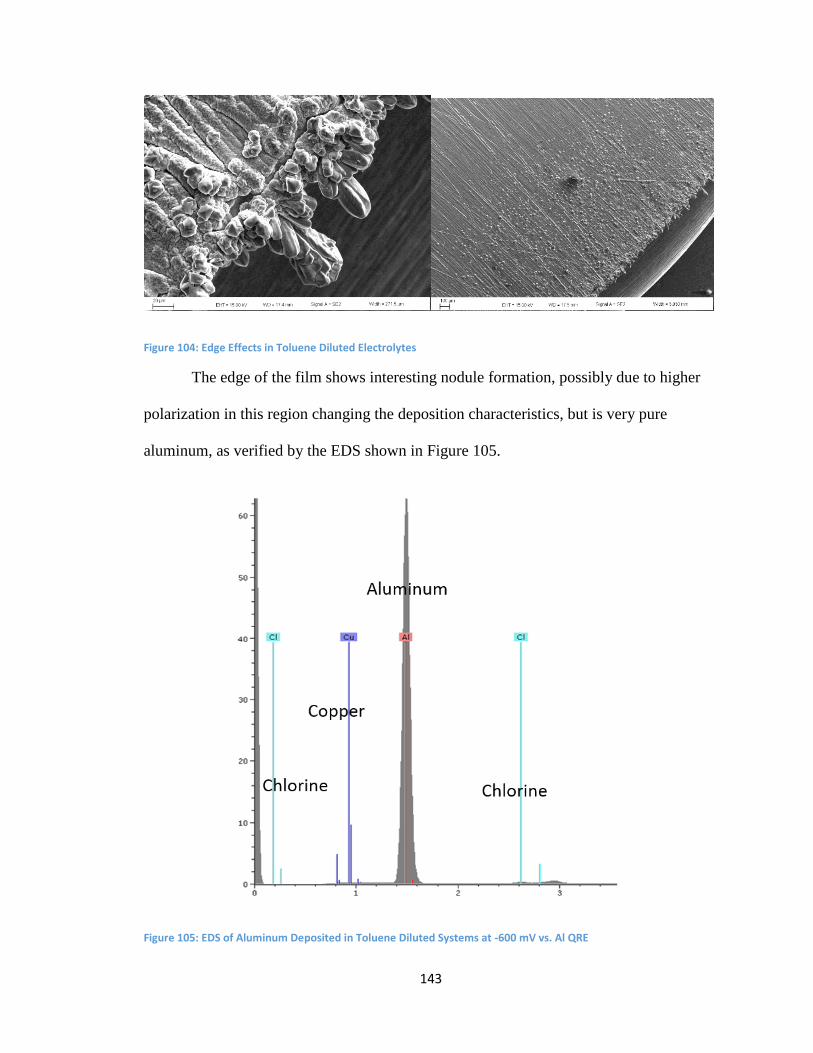
143
Figure 104: Edge Effects in Toluene Diluted Electrolytes
The edge of the film shows interesting nodule formation, possibly due to higher
polarization in this region changing the deposition characteristics, but is very pure
aluminum, as verified by the EDS shown in Figure 105.
Figure 105: EDS of Aluminum Deposited in Toluene Diluted Systems at -600 mV vs. Al QRE

144
The EDS measurement in this film shows significant reduction in impurities and a
nearly pure aluminum deposit. Moving to the maximum dilution solution of 6.8:2:1
Toluene:BMIC: AlCl3 and depositing at -500mV decreases edge effects, either due to the
slightly reduced overpotential or increased dilution, or both, which independently reduce
the deposition rate (Figure 106).
Figure 106: SEM of 6.8:2:1 Toluene:AlCl3:BMImCl Electrolyte edge effects at -500 mV vs. Al QRE Deposition
These films are again very smooth but the plating rate is lower than the 3:2:1
system at -600 mV. The platelike growth is seen in as with the other depositions in this
overpotential range, Figure 107.
Figure 107: SEM of 6.8:2:1 Toluene:AlCl3:BMImCl Electrolyte at -500 mV vs. Al QRE Deposition
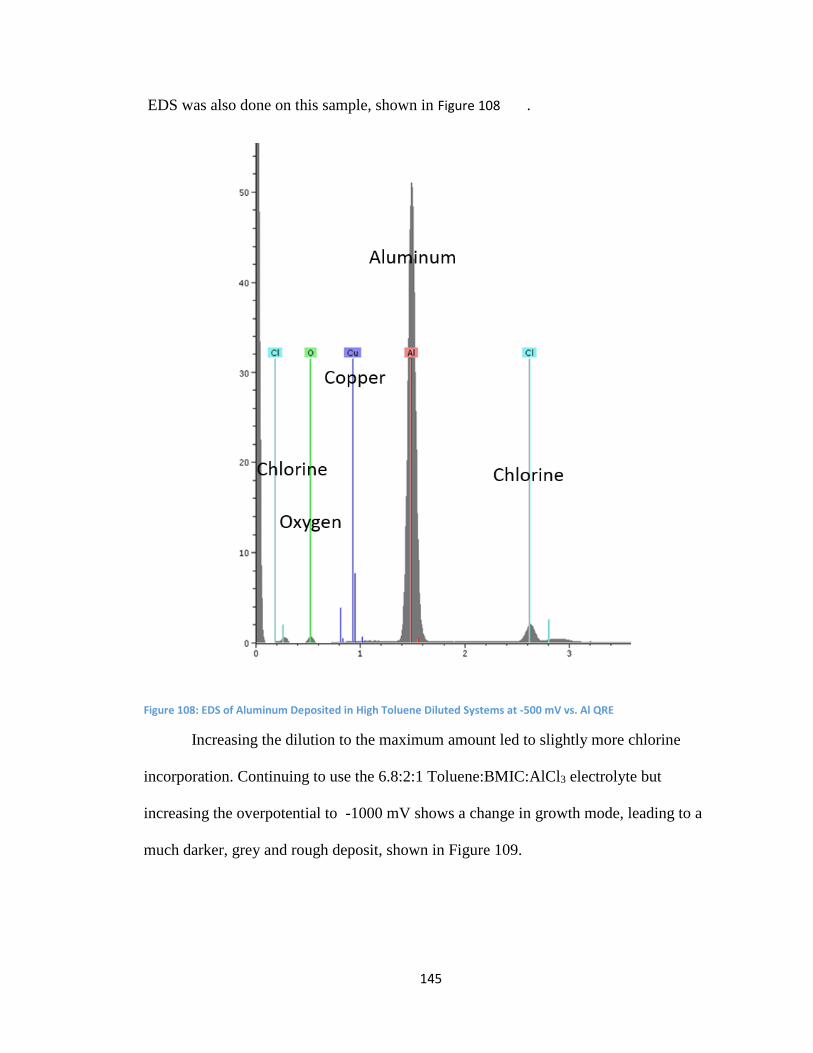
145
EDS was also done on this sample, shown in Figure 108 .
Figure 108: EDS of Aluminum Deposited in High Toluene Diluted Systems at -500 mV vs. Al QRE
Increasing the dilution to the maximum amount led to slightly more chlorine
incorporation. Continuing to use the 6.8:2:1 Toluene:BMIC:AlCl3 electrolyte but
increasing the overpotential to -1000 mV shows a change in growth mode, leading to a
much darker, grey and rough deposit, shown in Figure 109.

146
Figure 109: Aluminum Deposited on Cu in a 6.8:2:1 Toluene:AlCl3:BMImCl Electrolyte at -1000 mV vs. Al QRE
The SEM images show more nodule formation as well as signs of electrolyte
breakdown, .
Figure 110: SEM of 6.8:2:1 Toluene:AlCl3:BMImCl Electrolyte at -1000 mV vs. Al QRE Deposition
The edge effects are more pronounced as the overpotential is increased, indicating
the increased polarization and current are indeed influencing them. The module growth is
also more pronounced, as seen in .

147
Figure 111: SEM of 6.8:2:1 Toluene:AlCl3:BMImCl Electrolyte edge effects at -1000 mV vs. Al QRE Deposition
Deposition at -1000 mV starts to incorporate more carbon and chlorine impurities,
shown in .
Figure 112: EDS of Aluminum Deposited in High Toluene Diluted Systems at -1000 mV vs. Al QRE

148
Further increasing the deposition overpotential of the 6.8:2:1 Toluene:BMIC:
AlCl3 electrolyte to -1500mV leads to poor morphology and severe electrolyte
breackdown. The macroscopic quality is black and rough, shown in .
Figure 113: Aluminum Deposited on Cu in a 6.8:2:1 Toluene:AlCl3:BMImCl Electrolyte at -1500 mV vs. Al QRE
A very different growth is seen in the SEM images, shown in Figure 114.
Figure 114: SEM of 6.8:2:1 Toluene:AlCl3:BMImCl Electrolyte at -1500 mV vs. Al QRE Deposition

149
This strange growth was investigated with EDS mapping, Figure 115.
Figure 115: EDS of Aluminum Deposited in High Toluene Diluted Systems at -1500 mV vs. Al QRE
The EDS spectrum shown a lot of chlorine, carbon, nitrogen and oxygen
impurities. The carbon, oxygen, and chlorine are localized in the surrounding film while
the aluminum stays relatively pure and forms nodules in the open spaces, seen in Figure
116.
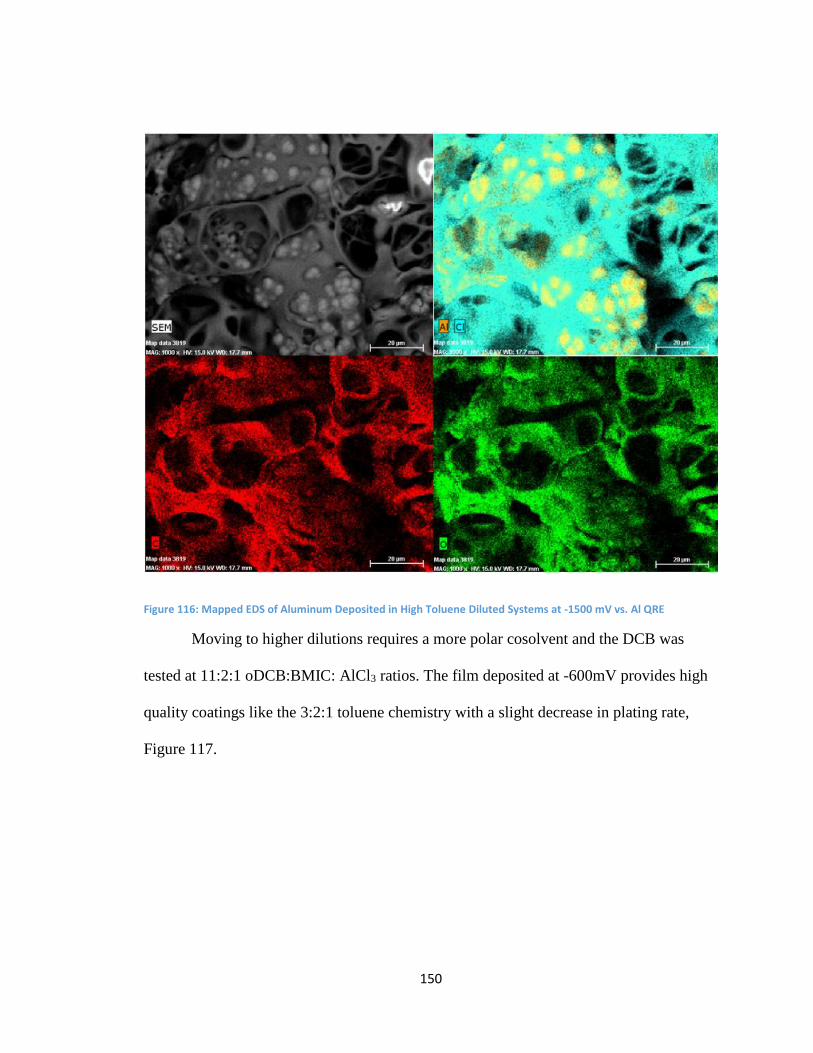
150
Figure 116: Mapped EDS of Aluminum Deposited in High Toluene Diluted Systems at -1500 mV vs. Al QRE
Moving to higher dilutions requires a more polar cosolvent and the DCB was
tested at 11:2:1 oDCB:BMIC: AlCl3 ratios. The film deposited at -600mV provides high
quality coatings like the 3:2:1 toluene chemistry with a slight decrease in plating rate,
Figure 117.

151
Figure 117: Aluminum Deposited on Cu in a 11:2:1 DCB:AlCl3:BMImCl Electrolyte at -600 mV vs. Al QRE
The SEM images show very minor surface roughness, Figure 118.
Figure 118: SEM of 11:2:1 DCB:AlCl3:BMImCl Electrolyte at -600 mV vs. Al QRE Deposition
DCB dilutions at this ratio decreases edge effects seen in other depositons, this is
caused by plating rate reduction and higher permittivity. The edges of the deposits in
these solutions are very consistent with the bulk deposition characteristics. Even further
dilution to 16:2:1 DCB:BMIC: AlCl3 and -600mV depositions result in severe decreases
in deposition rate due to low concentrations of the reducing aluminum complex. The
macroscopic quality is visably satisfactory, but the deposition rates are slower than the
more concentrated chemistries, Figure 119.

152
Figure 119: Aluminum Deposited on Cu in a 16:2:1 DCB:AlCl3:BMImCl Electrolyte at -600 mV vs. Al QRE
At -600 mV in higher dilutions the deposit results in poor coverage after 30
minutes as seen in the SEM images, seen in Figure 120 . This is again due to the low
concentration forcing low plating rates. If the concentration is to be use the low plating
rates must be accounted for.
Figure 120: SEM of 16:2:1 DCB:AlCl3:BMImCl Electrolyte at -600 mV vs. Al QRE Deposition
EDS of the heavily diluted solutions show very pure aluminum with no sign of
electrolyte breakdown, shown in Figure 121.

153
Figure 121: EDS of Aluminum Deposited in High DCB Diluted Systems at -600 mV vs. Al QRE
The deposit is still pure aluminum with no electrolyte breakdown or incorporation
but the copper substrate is observed in the EDS spectrum due to incomplete surface
coverage.
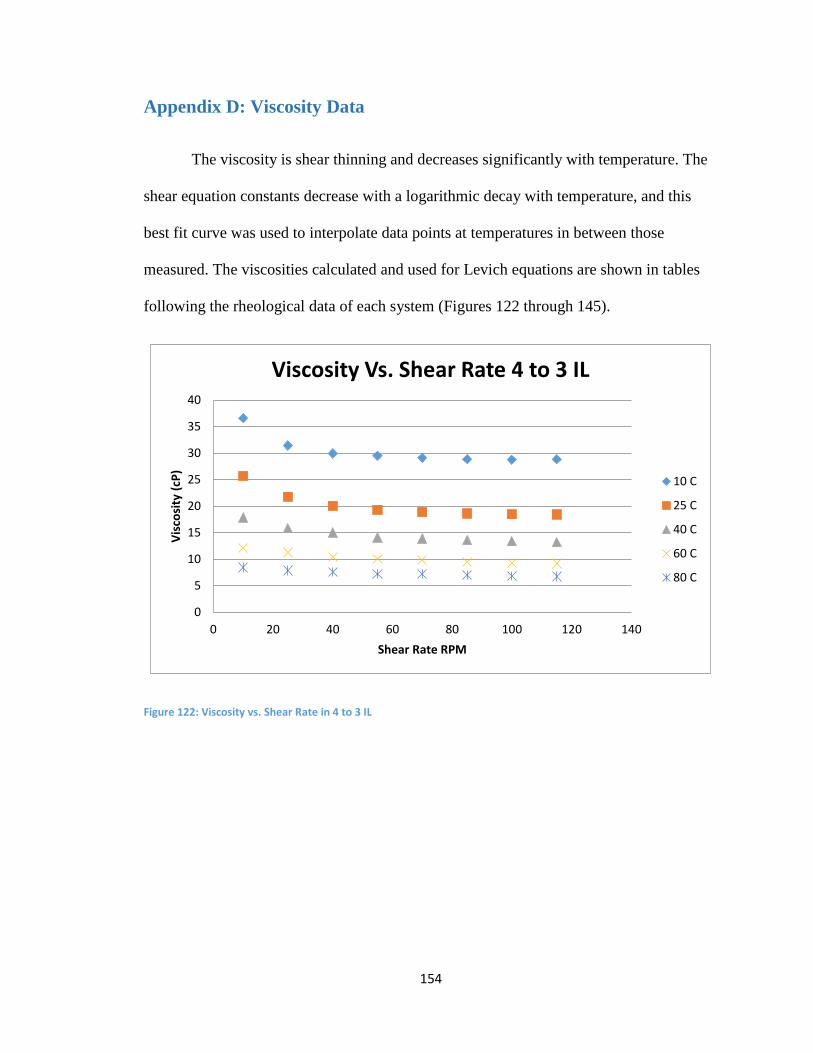
154
Appendix D: Viscosity Data
The viscosity is shear thinning and decreases significantly with temperature. The
shear equation constants decrease with a logarithmic decay with temperature, and this
best fit curve was used to interpolate data points at temperatures in between those
measured. The viscosities calculated and used for Levich equations are shown in tables
following the rheological data of each system (Figures 122 through 145).
Figure 122: Viscosity vs. Shear Rate in 4 to 3 IL
0
5
10
15
20
25
30
35
40
0 20 40 60 80 100 120 140
Vis
cosi
ty (
cP)
Shear Rate RPM
Viscosity Vs. Shear Rate 4 to 3 IL
10 C
25 C
40 C
60 C
80 C

155
Figure 123: Shear Equation Constants in 4 to 3 IL
The shear thinning exponential shows a minimum in the intermediate temperature
range of the values tested, although none of them vary significantly. Since they are fairly
consistent, no analysis was done on why the trend exhibited a minimum.
Figure 124: Shear Equation Power Law Values in 4 to 3 IL
0
10
20
30
40
50
60
0 10 20 30 40 50 60 70 80 90
Co
nst
ant
Temperature (C)
Shear Equation Constants 4 to 3
0.83
0.84
0.85
0.86
0.87
0.88
0.89
0.9
0.91
0.92
0 10 20 30 40 50 60 70 80 90
n
Temperature (C)
Shear Equation n values 4 to 3
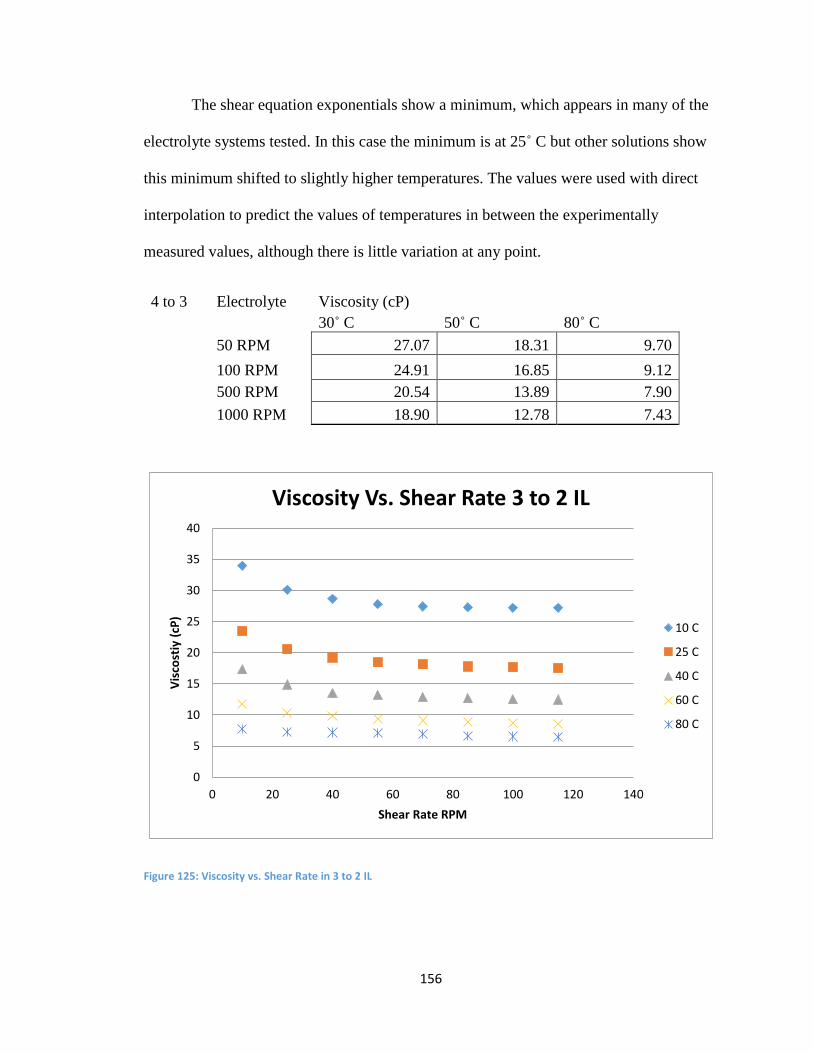
156
The shear equation exponentials show a minimum, which appears in many of the
electrolyte systems tested. In this case the minimum is at 25˚ C but other solutions show
this minimum shifted to slightly higher temperatures. The values were used with direct
interpolation to predict the values of temperatures in between the experimentally
measured values, although there is little variation at any point.
4 to 3 Electrolyte Viscosity (cP)
30˚ C 50˚ C 80˚ C
50 RPM 27.07 18.31 9.70
100 RPM 24.91 16.85 9.12
500 RPM 20.54 13.89 7.90
1000 RPM 18.90 12.78 7.43
Figure 125: Viscosity vs. Shear Rate in 3 to 2 IL
0
5
10
15
20
25
30
35
40
0 20 40 60 80 100 120 140
Vis
cost
iy (
cP)
Shear Rate RPM
Viscosity Vs. Shear Rate 3 to 2 IL
10 C
25 C
40 C
60 C
80 C

157
Figure 126: Shear Equation Constants in 3 to 2 IL
The shear equation shows a linear decrease in shear constants in the 3 to 2
chemistry, while it exhibits a minimum of n value at the 40˚ C condition.
Figure 127: Viscosity vs. Shear Rate in 5 to 3 IL
0
5
10
15
20
25
30
35
40
45
0 10 20 30 40 50 60 70 80 90
Co
nst
ant
Temperature (C)
Shear Equation Constants 3 to 2
0
5
10
15
20
25
30
35
40
0 20 40 60 80 100 120 140
Vis
cosi
ty (
cP)
Shear rate RPM
Viscosity Vs. Shear Rate 5 to 3 IL
9.75C
24.9C
40C
60C
80.1C

158
Figure 128: Shear Equation Constants in 5 to 3 IL
5 to 3 Electrolyte Viscosity (cP)
30˚ C 50˚ C 80˚ C
50 RPM 25.41 17.73 10.20
100 RPM 23.39 16.31 9.59
500 RPM 19.28 13.45 8.31
1000 RPM 17.74 12.37 7.81

159
Figure 129: Viscosity vs. Shear Rate in 2 to 1 IL
Figure 130: Shear Equation Constants in 2 to 1 IL
0
5
10
15
20
25
30
35
0 20 40 60 80 100 120 140
Vis
cosi
ty (
cP)
Shear rate RPM
Viscosity vs. Shear 2:1 IL
9.9C
24.9C
40.3C
60.6C
80.4C
0
5
10
15
20
25
30
35
40
45
0 10 20 30 40 50 60 70 80 90
Co
nst
ant
Temperature (C)
Shear Equation Constants 2 to 1 Bath
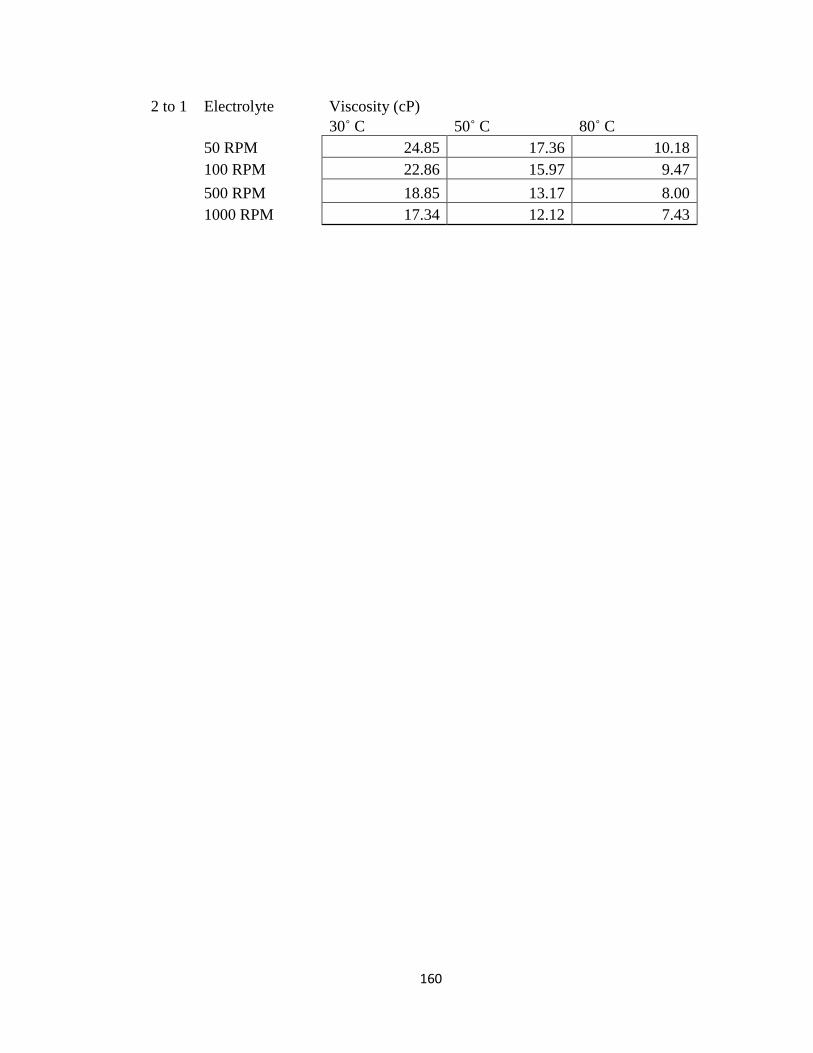
160
2 to 1 Electrolyte Viscosity (cP)
30˚ C 50˚ C 80˚ C
50 RPM 24.85 17.36 10.18
100 RPM 22.86 15.97 9.47
500 RPM 18.85 13.17 8.00
1000 RPM 17.34 12.12 7.43

161
References
1. David Linden, T.B.R., Handbook of Batteries. Third Edition ed. 2001: McGraw-
Hill.
2. Linden, D.R., Thomas B., Handbook of Batteries. 2002: McGraw-Hill
Handbooks.
3. Reed, J.W., et al. Burn-rate studies with iron/potassium perchlorate heat pellets.
in Power Sources Symposium, 1992., IEEE 35th International. 1992.
4. Zhang, K., et al., Development of a nano-Al/CuO based energetic material on
silicon substrate. Applied Physics Letters, 2007. 91(11).
5. Gavens, A.J., et al., Effect of intermixing on self-propagating exothermic
reactions in Al/Ni nanolaminate foils. Journal of Applied Physics, 2000. 87(3): p.
1255-1263.
6. Martirosyan, K.S. and S.E. Lyshevski, MEMS Technology Microthrusters and
Nanoenergetic Materials For Micropropulsion Systems. 2012 2nd International
Conference Methods and Systems of Navigation and Motion Control (Msnmc),
2012: p. 133-136.
7. Mann, A.B., et al., Modeling and characterizing the propagation velocity of
exothermic reactions in multilayer foils. Journal of Applied Physics, 1997. 82(3):
p. 1178-1188.
8. Rossi, C., et al., Nanoenergetic materials for MEMS: A review. Journal of
Microelectromechanical Systems, 2007. 16(4): p. 919-931.
9. Simões, S., F. Viana, and M. Vieira, Reactive Commercial Ni/Al Nanolayers for
Joining Lightweight Alloys. Journal of Materials Engineering and Performance,
2014. 23(5): p. 1536-1543.
10. Duckham, A., et al., Reactive nanostructured foil used as a heat source for
joining titanium. Journal of Applied Physics, 2004. 96(4): p. 2336-2342.
11. Eakins, D. and N.N. Thadhani, Shock-induced reaction in a flake nickel plus
spherical aluminum powder mixture. Journal of Applied Physics, 2006. 100(11).
12. T. Acchione, J.H., Measuring the Performance of Low- Melting Metallic
Sputtering Targets Bonded at Room Temperature (Ambient). SVC - 53rd Annual
Technical Conference Proceedings. Society of Vacuum Coaters., 2010.
13. Henderson, A.L. and J. Gryko, CHED 1166-Enthalpy of nickel-aluminum
reaction. Abstracts of Papers of the American Chemical Society, 2008. 235.

162
14. Kovalev, O.B. and V.A. Neronov, Metallochemical analysis of the reaction in a
mixture of nickel and aluminum powders. Combustion Explosion and Shock
Waves, 2004. 40(2): p. 172-179.
15. Morsi, K., Review: reaction synthesis processing of Ni-Al intermetallic materials
(vol A299, pg 1, 2000). Materials Science and Engineering a-Structural Materials
Properties Microstructure and Processing, 2001. 308(1-2): p. 296-296.
16. Dreizin, E.L., Metal-based reactive nanomaterials. Progress in Energy and
Combustion Science, 2009. 35(2): p. 141-167.
17. Gunduz, I.E., et al., Modeling of the self-propagating reactions of nickel and
aluminum multilayered foils. Journal of Applied Physics, 2009. 105(7): p.
074903.
18. Milan Paunovic, M.S., Fundamentals of Electrochemical Deposition. 2nd ed.
2006: Wiley. 373.
19. Hovestad, A. and L.J.J. Janssen, ELECTROCHEMICAL CODEPOSITION OF
INERT PARTICLES IN A METALLIC MATRIX. Journal of Applied
Electrochemistry, 1995. 25(6): p. 519-527.
20. Muller, B. and H. Ferkel, Al2O3-nanoparticle distribution in plated nickel
composite films. Nanostructured Materials, 1998. 10(8): p. 1285-1288.
21. Wang, S.C. and W.C.J. Wei, Characterization of electroplated Ni/SiC and
Ni/Al2O3 composite coatings bearing nanoparticles. Journal of Materials
Research, 2003. 18(7): p. 1566-1574.
22. Lee, H.K., H.Y. Lee, and J.M. Jeon, Codeposition of micro- and nano-sized SiC
particles in the nickel matrix composite coatings obtained by electroplating.
Surface & Coatings Technology, 2007. 201(8): p. 4711-4717.
23. Karbasi, M., N. Yazdian, and A. Vahidian, Development of electro-co-deposited
Ni-TiC nano-particle reinforced nanocomposite coatings. Surface & Coatings
Technology, 2012. 207: p. 587-593.
24. Kuo, S.L., Effect of nickel ion concentration on Ni/Al2O3 composite coatings.
Journal of the Chinese Institute of Engineers, 2005. 28(1): p. 1-8.
25. Corni, I., et al., Electro co-deposition of Ni-Al2O3 composite coatings. Journal of
Materials Science, 2012. 47(14): p. 5361-5373.
26. Ger, M.D., Electrochemical deposition of nickel/SiC composites in the presence of
surfactants. Materials Chemistry and Physics, 2004. 87(1): p. 67-74.
163
27. Cui, X., et al., Electrochemical study of codeposition of Al particle—
Nanocrystalline Ni/Cu composite coatings. Electrochimica Acta, 2008. 54(2): p.
415-420.
28. Talbot, J.B., Electrocodeposition of nanocomposite films. Plating and Surface
Finishing, 2004. 91(10): p. 60-65.
29. Liu, H. and W. Chen, Electrodeposited Ni–Al composite coatings with high Al
content by sediment co-deposition. Surface and Coatings Technology, 2005.
191(2–3): p. 341-350.
30. Low, C.T.J., R.G.A. Wills, and F.C. Walsh, Electrodeposition of composite
coatings containing nanoparticles in a metal deposit. Surface & Coatings
Technology, 2006. 201(1-2): p. 371-383.
31. Gyftou, P., et al., Electrodeposition of Ni/SiC composites by pulse electrolysis.
Transactions of the Institute of Metal Finishing, 2002. 80: p. 88-91.
32. Singh, V.B. and P. Pandey, Electrodeposition of nickel composites from water-
diethanolamine bath. Surface & Coatings Technology, 2006. 200(14-15): p.
4511-4514.
33. Arghavanian, R. and N.P. Ahmadi, Electrodeposition of Ni-ZrO2 composite
coatings and evaluation of particle distribution and corrosion resistance. Surface
Engineering, 2011. 27(9): p. 649-654.
34. Zheng, H.Y. and M.Z. An, Electrodeposition of Zn-Ni-Al2O3 nanocomposite
coatings under ultrasound conditions. Journal of Alloys and Compounds, 2008.
459(1-2): p. 548-552.
35. Webb, P.R. and N.L. Robertson, ELECTROLYTIC CODEPOSITION OF NI-
GAMMA-AL2O3 THIN-FILMS. Journal of the Electrochemical Society, 1994.
141(3): p. 669-673.
36. Pavlatou, E.A., et al., Hardening effect induced by incorporation of SiC particles
in nickel electrodeposits. Journal of Applied Electrochemistry, 2006. 36(4): p.
385-394.
37. Thiemig, D. and A. Bund, Influence of ethanol on the electrocodeposition of
Ni/Al2O3 nanocomposite films. Applied Surface Science, 2009. 255(7): p. 4164-
4170.
38. Thiemig, D., A. Bund, and J.B. Talbot, Influence of hydrodynamics and pulse
plating parameters on the electrocodeposition of nickel-alumina nanocomposite
films. Electrochimica Acta, 2009. 54(9): p. 2491-2498.

164
39. Tuaweri, T.J. and G.D. Wilcox, Influence of SiO2 particles on zinc-nickel
electrodeposition. Transactions of the Institute of Metal Finishing, 2007. 85(5): p.
245-253.
40. Lee, D., et al., Influence of ultrasonic irradiation on the microstructure of
Cu/Al2O3, CeO2 nanocomposite thin films during electrocodeposition. Materials
Science and Engineering a-Structural Materials Properties Microstructure and
Processing, 2007. 447(1-2): p. 209-216.
41. Shao, I., et al., Kinetics of particle codeposition of nanocomposites. Journal of the
Electrochemical Society, 2002. 149(11): p. C610-C614.
42. Asadi, A., et al., New procedure for electrochemical production of Ni-TiC
composite powder. Powder Metallurgy, 2010. 53(1): p. 47-50.
43. Shrestha, N.K. and T. Saji, Non-aqueous composite plating of Ni-ceramic
particles using ethanol bath and anti-wear performance of the coatings. Surface
& Coatings Technology, 2004. 186(3): p. 444-449.
44. Feng, Q.Y., T.J. Li, and J.Z. Jin, Research on the mechanism of composite
electroplating and its latest progress. Rare Metal Materials and Engineering,
2007. 36(3): p. 559-564.
45. Yang, X., X. Peng, and F. Wang, Size effect of Al particles on the structure and
oxidation of Ni/Ni3Al composites transformed from electrodeposited Ni–Al films.
Scripta Materialia, 2007. 56(6): p. 509-512.
46. Kim, J.S., et al., STUDY ON NANO-OXIDE POWDER DISPERSED Ni-
ELECTROPLATED COMPOSITES FOR COMPONENTS MATERIALS OF
NPPs. Icone 17: Proceedings of the 17th International Conference on Nuclear
Engineering, Vol 1. 2009, New York: Amer Soc Mechanical Engineers. 687-692.
47. Shao, I., et al., Synthesis and characterization of particle-reinforced Ni/Al2O3
nanoconiposites. Journal of Materials Research, 2002. 17(6): p. 1412-1418.
48. Sen, R., S. Das, and K. Das, Synthesis and Properties of Pulse Electrodeposited
Ni-CeO2 Nanocomposite. Metallurgical and Materials Transactions a-Physical
Metallurgy and Materials Science, 2012. 43A(10): p. 3809-3823.
49. Narasimman, P., M. Pushpavanam, and V.M. Periasamy, Synthesis,
characterization and comparison of sediment electro-codeposited nickel-micro
and nano SiC composites. Applied Surface Science, 2011. 258(1): p. 590-598.
50. Narasimman, P., M. Pushpavanam, and V.M. Periasamy, Wear and scratch
resistance characteristics of electrodeposited nickel-nano and micro SiC
composites. Wear, 2012. 292: p. 197-206.
165
51. Musiani, M., Electrodeposition of composites: arm expanding subject in
electrochemical materials science. Electrochimica Acta, 2000. 45(20): p. 3397-
3402.
52. Plieth, W., Electrochemistry for Materials Science. 2008: Elsevier. 410.
53. Dong, S.S., et al., Synthesis of intermetallic NiAl by SHS reaction using coarse-
grained nickel and ultrafine-grained aluminum produced by wire electrical
explosion. Intermetallics, 2002. 10(3): p. 217-223.
54. Liu, H.F. and W.X. Chen, Electrodeposited Ni-Al composite coatings with high Al
content by sediment co-deposition. Surface & Coatings Technology, 2005. 191(2-
3): p. 341-350.
55. John Duffy, A.H. Suspension stability: Why particle size, zeta potential and
rheology are important. 2011 [cited 2016.
56. Ian Rose, C.W., Nickel Plating Handbook. 2013.
57. Haarberg, M.G.-E.G.M., Molten Salts Chemistry and Technology. 2014: Wiley.
58. VanderNoot*, Y.Z.a.T.J., Review: Electrodeposition of aluminium from
nonaqueous organic electrolytic systems and room temperature molten salts.
Electrochimica Acre,, 1997. 42(1): p. 3-13.
59. Garai, T., ELECTRODEPOSITION OF ALUMINUM IN NON-AQUEOUS
SOLVENTS. Materials Chemistry and Physics, 1983. 8(5): p. 399-434.
60. Galova, M. and D. Kladekova, Basic Parameters of the Electrode Process of
Aluminum Deposition from Tetrahydrofuran Solutions .1. Exchange Current-
Density. Surface Technology, 1980. 11(5): p. 371-376.
61. Eckert, J. and M. Galova, Electrode-Kinetics of the Aluminum Deposition from
Tetrahydrofuran Electrolytes. Electrochimica Acta, 1981. 26(8): p. 1169-1175.
62. Galova, M., D. Kladekova, and L. Lux, Basic Parameters of the Electrode
Process in Aluminum Deposition from Tetrahydrofuran Solutions .2. Mechanism
of the Electrode-Reaction. Surface Technology, 1981. 13(4): p. 315-324.
63. Howarth, J.N. and D. Pletcher, The Study of Aluminum Deposition from
Tetrahydrofuran Solutions of Alcl3-Lialh4 Using Microelectrodes .2. The
Influence of Solution Composition. Journal of the Chemical Society-Faraday
Transactions I, 1987. 83: p. 2795-2802.
64. Howarth, J.N. and D. Pletcher, The Study of Aluminum Deposition from
Tetrahydrofuran Solutions of Alcl3-Lialh4 Using Microelectrodes .1. 1-1 Alcl3-
Lialh4. Journal of the Chemical Society-Faraday Transactions I, 1987. 83: p.
2787-2794.

166
65. Biallozor, S., V. Mazin, and M. Lieder, The Electrodeposition of Aluminum from
Xylene and Ether-Hydride Electrolytes. Journal of Applied Electrochemistry,
1993. 23(3): p. 253-256.
66. Simanavicius, L., et al., Electrodeposition of Aluminum from Xylene and Toluene
Electrolytes by Pulsed Current. Protection of Metals, 1995. 31(5): p. 467-470.
67. Shavkunov, S.P. and T.L. Strugova, Electrode processes during aluminum
electrodeposition in aromatic solvents. Russian Journal of Electrochemistry,
2003. 39(6): p. 642-649.
68. Legrand, L., A. Tranchant, and R. Messina, Behavior of Aluminum as Anode in
Dimethylsulfone-Based Electrolytes. Electrochimica Acta, 1994. 39(10): p. 1427-
1431.
69. Legrand, L., et al., Raman study of aluminum chloride dimethylsulfone solutions.
Inorganic Chemistry, 1996. 35(5): p. 1310-1312.
70. Jiang, T., et al., Studies on the AlCl3/dimethylsulfone (DMSO2) electrolytes for
the aluminum deposition processes. Surface & Coatings Technology, 2007.
201(14): p. 6309-6317.
71. Matsui, I., et al., Fabrication of bulk nanocrystalline Al electrodeposited from a
dimethylsulfone bath. Materials Science and Engineering a-Structural Materials
Properties Microstructure and Processing, 2012. 550: p. 363-366.
72. Legrand, L., et al., RDE and impedance study of anodic dissolution of aluminium
in organic AlCl3/dimethylsulfone electrolytes. Electrochimica Acta, 1998. 43(21-
22): p. 3109-3115.
73. Hirato, T., J. Fransaer, and J.P. Celis, Electrolytic codeposition of silica particles
with aluminum from AlCl3-dimethylsulfone electrolytes. Journal of the
Electrochemical Society, 2001. 148(4): p. C280-C283.
74. Fransaer, J., et al., Aluminium composite coatings containing micrometre and
nanometre-sized particles electroplated from a non-aqueous electrolyte. Journal
of Applied Electrochemistry, 2002. 32(2): p. 123-128.
75. Stewart, G. and C.L. Hussey, Electrodeposition of transition metal aluminum
alloys from molten AlCl3-NaCl. Proceedings of the Eleventh International
Symposium on Molten Salts Xi, 1998. 98(11): p. 21-33.
76. Jafarian, M., et al., Electrodeposition of aluminum from molten AlCl3-NaCl-KCl
mixture. Journal of Applied Electrochemistry, 2006. 36(10): p. 1169-1173.
77. Okoturo, O.O. and T.J. VanderNoot, Temperature dependence of viscosity for
room temperature ionic liquids. Journal of Electroanalytical Chemistry, 2004.
568(0): p. 167-181.
167
78. Freemantle, M., An Introduction to Ionic Liquids. 2010: RSC Publishing.
79. Ohno, H., Electrochemical Aspects of Ionic Liquids. 2011: Wiley.
80. Hayyan, M., et al., Investigating the electrochemical windows of ionic liquids.
Journal of Industrial and Engineering Chemistry, 2013. 19(1): p. 106-112.
81. Franzen, G., et al., THE ANIONIC STRUCTURE OF ROOM-TEMPERATURE
ORGANIC CHLOROALUMINATE MELTS FROM SECONDARY ION MASS-
SPECTROMETRY. Organic Mass Spectrometry, 1986. 21(7): p. 443-444.
82. Karpinski, Z.J. and R.A. Osteryoung, DETERMINATION OF EQUILIBRIUM-
CONSTANTS FOR THE TETRACHLOROALUMINATE ION DISSOCIATION IN
AMBIENT-TEMPERATURE IONIC LIQUIDS. Inorganic Chemistry, 1984.
23(10): p. 1491-1494.
83. Heerman, L. and W. Dolieslager, POTENTIOMETRIC STUDY OF THE
SOLVENT EQUILIBRIA IN ALCL3-N-N-BUTYLPYRIDINIUM CHLORIDE
MELTS. Inorganic Chemistry, 1985. 24(26): p. 4704-4707.
84. Chryssoulakis, Y., J.C. Poignet, and G. Manoli, ELECTROCHEMICAL STUDY
OF ALUMINUM ION REDUCTION IN ACIDIC ALCL3-NORMAL-BUTYL-
PYRIDINIUM CHLORIDE MELTS. Journal of Applied Electrochemistry, 1987.
17(4): p. 857-867.
85. Moy, R. and F.P. Emmenegger, Cosolvents for Chloroaluminate Electrolytes.
Electrochimica Acta, 1992. 37(6): p. 1061-1068.
86. Jiang, T., et al., Electrodeposition of aluminium from ionic liquids: Part II -
studies on the electrodeposition of aluminum from aluminum chloride (AICl(3)) -
trimethylphenylammonium chloride (TMPAC) ionic liquids. Surface & Coatings
Technology, 2006. 201(1-2): p. 10-18.
87. Abbott, A.P., et al., Double layer, diluent and anode effects upon the
electrodeposition of aluminium from chloroaluminate based ionic liquids.
Physical Chemistry Chemical Physics, 2010. 12(8): p. 1862-1872.
88. Liao, Q. and C.L. Hussey, Densities, viscosities, and conductivities of mixtures of
benzene with the Lewis acidic aluminum chloride plus 1-methyl-3-
ethylimidazolium chloride molten salt. Journal of Chemical and Engineering Data,
1996. 41(5): p. 1126-1130.
89. Pitner, W.R., C.L. Hussey, and G.R. Stafford, Electrodeposition of Nickel‐Aluminum Alloys from the Aluminum Chloride‐1‐methyl‐3‐ethylimidazolium
Chloride Room Temperature Molten Salt. Journal of The Electrochemical
Society, 1996. 143(1): p. 130-138.

168
90. Pitner, W.R., C.L. Hussey, and G.R. Stafford, Electrodeposition of nickel-
aluminum alloys from the aluminum chloride-1-methyl-3-ethylimidazolium
chloride room temperature molten salt. Journal of the Electrochemical Society,
1996. 143(1): p. 130-138.
91. Trulove, P.C., et al., Electrodeposition and pitting corrosion of aluminum-
manganese alloys from room temperature chloroaluminate molten salts. Molten
Salts Xii, Proceedings, 2000. 99(41): p. 517-526.
92. Zhu, Q. and C.L. Hussey, Electrodeposition of silver-aluminum alloys from room-
temperature chloroaluminate molten salts. Molten Salts Xii, Proceedings, 2000.
99(41): p. 494-504.
93. Jiang, T., et al., Electrodeposition of aluminium from ionic liquids: Part I -
electrodeposition and surface morphology of aluminium from aluminium chloride
(AlCl3)-l-ethyl-3-methylimidazolium chloride ([EMIm]Cl) ionic liquids. Surface
& Coatings Technology, 2006. 201(1-2): p. 1-9.
94. Chang, J.K., et al., Electrodeposition of aluminum on magnesium alloy in
aluminum chloride (AlCl(3))-1-ethyl-3-methylimidazolium chloride (EMIC) ionic
liquid and its corrosion behavior. Electrochemistry Communications, 2007. 9(7):
p. 1602-1606.
95. Chang, J.K., et al., Electrodeposition of Al on Magnesium Alloy from Aluminum
Chloride/1-ethyl-3-methylimidazolium Chloride Ionic Liquids. Electrochemistry,
2009. 77(8): p. 585-587.
96. Yue, G.K., et al., A Promising Method for Electrodeposition of Aluminium on
Stainless Steel in Ionic Liquid. Aiche Journal, 2009. 55(3): p. 783-796.
97. Liu, Q.X., S.Z. El Abedin, and F. Endres, Electrodeposition of nanocrystalline
aluminum: Breakdown of imidazolium cations modifies the crystal size. Journal of
the Electrochemical Society, 2008. 155(5): p. D357-D362.
98. El Abedin, S.Z., et al., Electrodeposition of nanocrystalline aluminium from a
chloroaluminate ionic liquid. Electrochemistry Communications, 2010. 12(8): p.
1084-1086.
99. Zhang, L.P., et al., Electrodeposition of aluminum on magnesium from ionic
liquid (EMIM)Br-AlCl3. Transactions of Nonferrous Metals Society of China,
2010. 20: p. S245-S248.
100. Tang, J.W. and K. Azumi, Optimization of pulsed electrodeposition of aluminum
from AlCl3-1-ethyl-3-methylimidazolium chloride ionic liquid. Electrochimica
Acta, 2011. 56(3): p. 1130-1137.

169
101. Giridhar, P., S.Z. El Abedin, and F. Endres, Electrodeposition of aluminium from
1-butyl-1-methylpyrrolidinium chloride/AlCl3 and mixtures with 1-ethyl-3-
methylimidazolium chloride/AlCl3. Electrochimica Acta, 2012. 70: p. 210-214.
102. Pradhan, D. and R.G. Reddy, Dendrite-Free Aluminum Electrodeposition from
AlCl3-1-Ethyl-3-Methyl-Imidazolium Chloride Ionic Liquid Electrolytes.
Metallurgical and Materials Transactions B-Process Metallurgy and Materials
Processing Science, 2012. 43(3): p. 519-531.
103. Vaughan, J. and D. Dreisinger, Electrodeposition of aluminum from aluminum
chloride-trihexyl(tetradecyl) phosphonium chloride. Journal of the
Electrochemical Society, 2008. 155(1): p. D68-D72.
104. Fitchett, B.D., T.N. Knepp, and J.C. Conboy, 1-Alkyl-3-methylimidazolium
bis(perfluoroalkylsulfonyl)imide water-immiscible ionic liquids - The effect of
water on electrochemical and physical properties. Journal of the Electrochemical
Society, 2004. 151(7): p. E219-E225.
105. Burrell, A.K., et al., The large scale synthesis of pure imidazolium and
pyrrolidinium ionic liquids. Green Chemistry, 2007. 9(5): p. 449-454.
106. Welton, P.W.T., Ionic Liquids in Synthesis. 2nd ed. 2008: Wiley.
107. Yokota, Y., T. Harada, and K.I. Fukui, Direct observation of layered structures at
ionic liquid/solid interfaces by using frequency-modulation atomic force
microscopy. Chemical Communications, 2010. 46(45): p. 8627-8629.
108. Abbott, A.P., et al., Double layer effects on metal nucleation in deep eutectic
solvents. Physical Chemistry Chemical Physics, 2011. 13(21): p. 10224-10231.
109. Kirchner, K., et al., Electrical double layer in ionic liquids: Structural transitions
from multilayer to monolayer structure at the interface. Electrochimica Acta,
2013. 110: p. 762-771.
110. Merlet, C., et al., Computer simulations of ionic liquids at electrochemical
interfaces. Physical Chemistry Chemical Physics, 2013. 15(38): p. 15781-15792.
111. Uysal, A., et al., Structural Origins of Potential Dependent Hysteresis at the
Electrified Graphene/Ionic Liquid Interface. Journal of Physical Chemistry C,
2014. 118(1): p. 569-574.
112. Ivanistsev, V., et al., Restructuring of the electrical double layer in ionic liquids
upon charging. Journal of Physics-Condensed Matter, 2015. 27(10).
113. Abbott, A.P., G. Capper, and S. Gray, Design of Improved Deep Eutectic Solvents
Using Hole Theory. ChemPhysChem, 2006. 7(4): p. 803-806.
114. Alhaji, A., Electrodeposition of Alloys from Deep Eutectic Solvents. 2012.

170
115. Tokuda, H., et al., Physicochemical properties and structures of room
temperature ionic liquids. 1. Variation of anionic species. Journal of Physical
Chemistry B, 2004. 108(42): p. 16593-16600.
116. Tokuda, H., et al., Physicochemical properties and structures of room
temperature ionic liquids. 2. Variation of alkyl chain length in imidazolium
cation. Journal of Physical Chemistry B, 2005. 109(13): p. 6103-6110.
117. Tokuda, H., et al., Physicochemical properties and structures of room-
temperature ionic liquids. 3. Variation of cationic structures 10.1021/jpO53396f.
Journal of Physical Chemistry B, 2006. 110(6): p. 2833-2839.
118. Tokuda, H. and M. Watanabe, Ionicity of room temperature ionic liquids: A
parameter controlling the physicochemical properties. Abstracts of Papers of the
American Chemical Society, 2006. 231.
119. Watanabe, M. and H. Tokuda, PHYS 53-How ionic are ionic liquids? An
indicator of the physicochemical properties. Abstracts of Papers of the American
Chemical Society, 2006. 232.
120. Moschovi, A.M., V. Dracopoulos, and V. Nikolakis, Inter- and Intramolecular
Interactions in Imidazolium Protic Ionic Liquids. The Journal of Physical
Chemistry B, 2014. 118(29): p. 8673-8683.
121. Ueno, K., H. Tokuda, and M. Watanabe, Ionicity in ionic liquids: correlation with
ionic structure and physicochemical properties. Physical Chemistry Chemical
Physics, 2010. 12(8): p. 1649-1658.
122. Fredlake, C.P., et al., Thermophysical properties of imidazolium-based ionic
liquids. Journal of Chemical and Engineering Data, 2004. 49(4): p. 954-964.
123. Tsuzuki, S., et al., Magnitude and directionality of interaction in ion pairs of ionic
liquids: Relationship with ionic conductivity. Journal of Physical Chemistry B,
2005. 109(34): p. 16474-16481.
124. Spohr, H.V. and G.N. Patey, Structural and dynamical properties of ionic liquids:
The influence of ion size disparity. Journal of Chemical Physics, 2008. 129(6).
125. Spohr, H.V. and G.N. Patey, Structural and dynamical properties of ionic liquids:
The influence of charge location. Journal of Chemical Physics, 2009. 130(10).
126. Spohr, H.V. and G.N. Patey, Structural and dynamical properties of ionic liquids:
Competing influences of molecular properties. Journal of Chemical Physics,
2010. 132(15).
127. Kulkarni, P.S., et al., Comparison of physicochemical properties of new ionic
liquids based on imidazolium, quaternary ammonium, and guanidinium cations.
Chemistry-a European Journal, 2007. 13(30): p. 8478-8488.

171
128. Burrell, G.L., N.F. Dunlop, and F. Separovic, Non-Newtonian viscous shear
thinning in ionic liquids. Soft Matter, 2010. 6(9): p. 2080-2086.
129. Yu, G.R., et al., Viscosity of ionic liquids: Database, observation, and
quantitative structure-property relationship analysis. Aiche Journal, 2012. 58(9):
p. 2885-2899.
130. Pogodina, N.V., et al., Molecular dynamics of ionic liquids as probed by
rheology. Journal of Rheology, 2011. 55(2): p. 241-256.
131. Noda, A., K. Hayamizu, and M. Watanabe, Pulsed-Gradient Spin−Echo 1H and
19F NMR Ionic Diffusion Coefficient, Viscosity, and Ionic Conductivity of Non-
Chloroaluminate Room-Temperature Ionic Liquids. The Journal of Physical
Chemistry B, 2001. 105(20): p. 4603-4610.
132. Zhang, M., V. Kamavarum, and R.G. Reddy, New electrolytes for aluminum
production: Ionic liquids. JOM, 2003. 55(11): p. 54-57.
133. Jiang, T., et al., Studies on the AlCl3/dimethylsulfone (DMSO2) electrolytes for
the aluminum deposition processes. Surface and Coatings Technology, 2007.
201(14): p. 6309-6317.
134. Zhao, Y.G. and T.J. VanderNoot, Electrodeposition of aluminium from
nonaqueous organic electrolytic systems and room temperature molten salts.
Electrochimica Acta, 1997. 42(1): p. 3-13.
135. Okoturo, O.O. and T.J. VanderNoot, Temperature dependence of viscosity for
room temperature ionic liquids. Journal of Electroanalytical Chemistry, 2004.
568(1-2): p. 167-181.
136. Pradhan, D. and R.G. Reddy, Mechanistic study of Al electrodeposition from
EMIC–AlCl3 and BMIC–AlCl3 electrolytes at low temperature. Materials
Chemistry and Physics, 2014. 143(2): p. 564-569.