electrochemical corrosion behavior of backward extruded mg
TRANSCRIPT
Int. J. Electrochem. Sci., 8 (2013) 2551 - 2565
International Journal of
ELECTROCHEMICAL SCIENCE
www.electrochemsci.org
Electrochemical Corrosion Behavior of Backward Extruded
Mg-Zn-Ca Alloys in Different Media
Daqing Fang1, 2
, Xuejun Li1, Hui Li
1, Qiuming Peng
1,*
1 State Key Laboratory of Metastable Materials Science and Technology, Yanshan University,
Qinhuangdao, 066004, P.R China. 2
School of Materials Science and Engineering, Taiyuan University of Science and Technology,
Taiyuan, 030024, P.R China. *E-mail: [email protected]
Received: 22 November 2012 / Accepted: 14 December 2012 / Published: 1 February 2013
Mg-1.0Zn-xCa (x=0.2, 0.5, 0.8, 1.0; wt. %) alloys were prepared by zone purifying solidification
followed by backward extrusion technology. The microstructures, electrochemical corrosion behaviors
and the mechanisms in 0.9 wt. %, 3.5 wt. % NaCl solutions and simulated body fluid (SBF) were
evaluated at ambient temperature. The corrosion properties of the specimens were remarkably
influenced by the compositions of the media. According to electrochemical impedance spectroscopy
(EIS), it revealed that the samples (lower 1.0 wt. % Ca) in the 0.9 wt. % and 3.5 wt. % NaCl solutions
showed a single conductive loop. Conversely, Mg-1.0Zn-1.0Ca alloy was combined of a conductive
loop and an inductive loop. In the case of SBF, EIS of all the samples turned to two conductive loops
and an inductive loop. The BE-Mg-1.0Zn-0.5Ca alloy exhibited the most anti-corrosion properties in
both 0.9 wt. % NaCl solution and SBF, while it changed to BE-Mg-1.0Zn-0.8Ca alloy in 3.5NaCl
solution. The corrosion mechanism confirmed that the micro-alloying Ca element can purify the melts
to improve the corrosion resistance. On the contrary, much Ca element contributed to form the
secondary phase, accelerating the pitting corrosion.
Keywords: Mg-Zn-Ca alloys; Microstructure; Electrochemical impedance spectroscopy; Corrosion
mechanism
1. INTRODUCTION
Magnesium (Mg) is an essential element in the human body, and both its specific strength and
Young’s modulus are closer to human bone than the conventional used metallic implant materials.
Moreover, Mg alloys can decrease the stress shield between the interfaces of bone/implant materials
and stimulate the growth of bone [1]. Herein, Mg alloys have been tentatively designed as orthopedic
implants [2]. At the early stage of the researches about Mg biomaterials (bio-Mg), some commercial

Int. J. Electrochem. Sci., Vol. 8, 2013
2552
structural Mg alloys have been adopted as biomedical implants directly, such as AZ31, AM50 and
WE54 alloys. However, the potential toxicity of products restricts the development of bio-Mg implants
[3]. Therefore, it becomes a very urgent issue to develop some novel bio-Mg alloys.
Mg-Zn-Ca system is regarded as a most suitable one to develop Mg based biomaterials. Both
zinc (Zn) and calcium (Ca) have been confirmed as beneficial metabolizing elements in human body
and they can improve the mechanical properties simultaneously [4]. A recent study suggested that the
adverse effects on chromatins and structure or function of heart, liver, kidney, or spleen have hardly
observed in Mg-Zn alloys [5]. Lei et al. [6] have reported that Mg-based alloys reinforced by Mg-Zn
intermetallic can enhance the mechanical properties and corrosion resistance. More recently, Li et al.
[7] point out that Mg-1.0Ca (wt. %) exhibits good mechanical, high corrosion resistance and
acceptable biocompatibility.
However, to data, there exists one key problem about Mg-Zn-Ca biomaterials. Namely, the
fluctuation of degradation rate greatly affects the degradation process owing to strong local pitting
corrosion [8]. It is well known that the degradation rate is closely related to the microstructure [9]. The
homogenous microstructure becomes the prerequisite to obtain the uniform degradation rate. Wang et
al. [10] have reported that the enrichment of metallic Zn can improve the corrosion properties of melt-
spun glassy Mg67Zn28Ca5 alloy. Recently, Gao et al. [11] pointed out that the Mg-2.0Zn-0.24Ca (wt.
%) alloy treated by high pressure possesses the lowest biodegradation rate compared with the as cast
and conventional extrusion samples. Nevertheless, the melt-spun glassy Mg-Zn-Ca is deficient in
formability, whilst the high pressure sample possesses secondary phase, which is prone to pitting
corrosion. Sun et al. [12] found that the addition of Zn and Ca into the Mg matrix can enhance the
corrosion potential and reduce the degradation rate of the extruded Mg-Zn-Ca alloy in SBF.
Unfortunately, the effects of Ca content and different media on the corrosion properties and their
mechanisms in Mg-Zn-Ca system are unclear.
In the present work, backward extrusion technology (BE), confirmed as an effective approach
to improve the degradation properties of Mg-xZn biomaterial in our previous work [13], has been
employed to prepare Mg-1.0Zn-xCa (x=0.2, 0.5, 0.8, 1.0; wt. %) alloys. The influences of Ca content
and different media on the corrosion properties of the alloys were investigated and the corrosion
mechanisms were discussed.
2. EXPERIMENTAL PART
2.1 Preparation of materials
Mg-1.0Zn-xCa (x=0.2, 0.5, 0.8, 1; wt. %, all the following is the same if no special comment)
alloys have been prepared by zone solidification technology. Briefly, the alloys have been prepared in
a tantalum (Ta) crucible under protection by a mixture of CO2 and SF6. After mixing at 730 ℃ for 1.5
h, the alloy was cast into a mold preheated at 500 ℃. The filled mold was held at 670 ℃ for 1 h under
the protective gas. Subsequently, the whole Ta crucible with the melt was immersed into the flowing
water at 30 mm/s. As soon as touched the water, the bottom of the Ta crucible stopped for 2 s. The
Int. J. Electrochem. Sci., Vol. 8, 2013
2553
solidification process was finished when the liquid level of the crucible inside was aligned with the
height of water outside. The size of the ingot was φ70 mm × 180 mm.
The ingot was held at 530 ℃ for 10 h, and then quenched into hot water (60 ℃). Before BE
process was taken, the ingot was preheated at 400 ℃ for 1 h. The extruded ratio and speed were 12.25
and 50 mm/min, respectively. After extrusion, the samples were heat treated at 150 ℃ for 30 minutes
to eliminate the residual stress.
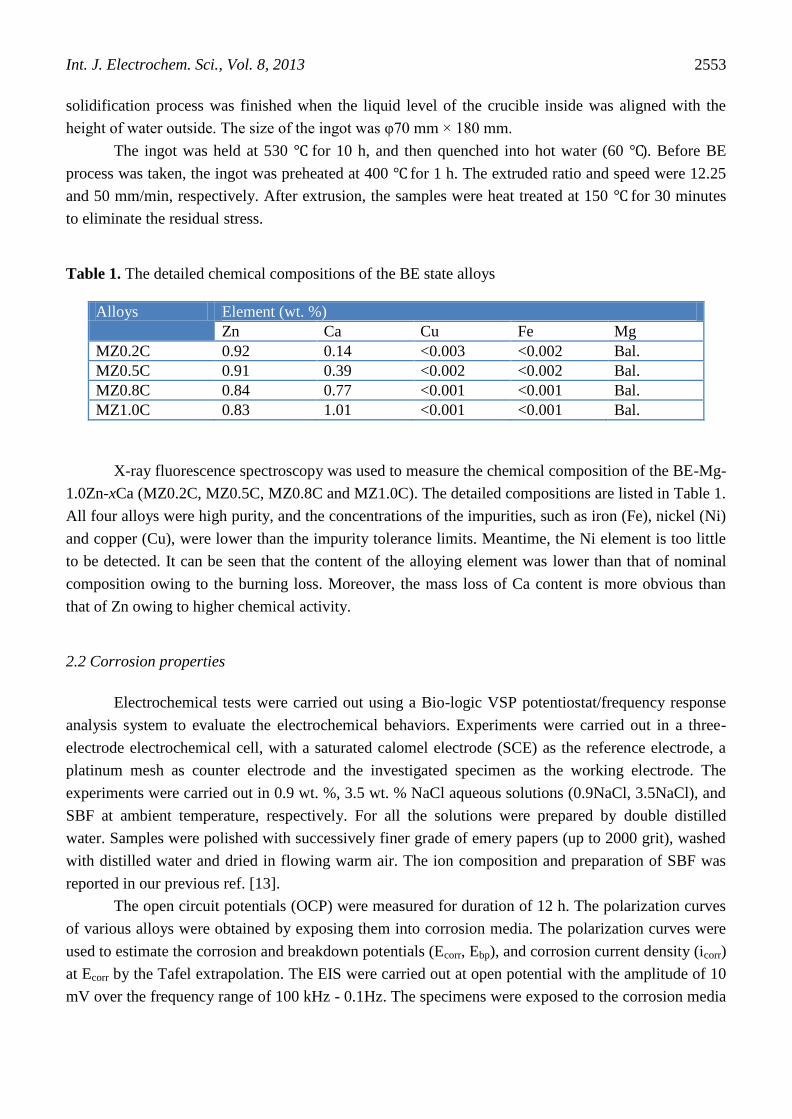
Table 1. The detailed chemical compositions of the BE state alloys
Alloys Element (wt. %)
Zn Ca Cu Fe Mg
MZ0.2C 0.92 0.14 <0.003 <0.002 Bal.
MZ0.5C 0.91 0.39 <0.002 <0.002 Bal.
MZ0.8C 0.84 0.77 <0.001 <0.001 Bal.
MZ1.0C 0.83 1.01 <0.001 <0.001 Bal.
X-ray fluorescence spectroscopy was used to measure the chemical composition of the BE-Mg-
1.0Zn-xCa (MZ0.2C, MZ0.5C, MZ0.8C and MZ1.0C). The detailed compositions are listed in Table 1.
All four alloys were high purity, and the concentrations of the impurities, such as iron (Fe), nickel (Ni)
and copper (Cu), were lower than the impurity tolerance limits. Meantime, the Ni element is too little
to be detected. It can be seen that the content of the alloying element was lower than that of nominal
composition owing to the burning loss. Moreover, the mass loss of Ca content is more obvious than
that of Zn owing to higher chemical activity.
2.2 Corrosion properties
Electrochemical tests were carried out using a Bio-logic VSP potentiostat/frequency response
analysis system to evaluate the electrochemical behaviors. Experiments were carried out in a three-
electrode electrochemical cell, with a saturated calomel electrode (SCE) as the reference electrode, a
platinum mesh as counter electrode and the investigated specimen as the working electrode. The
experiments were carried out in 0.9 wt. %, 3.5 wt. % NaCl aqueous solutions (0.9NaCl, 3.5NaCl), and
SBF at ambient temperature, respectively. For all the solutions were prepared by double distilled
water. Samples were polished with successively finer grade of emery papers (up to 2000 grit), washed
with distilled water and dried in flowing warm air. The ion composition and preparation of SBF was
reported in our previous ref. [13].
The open circuit potentials (OCP) were measured for duration of 12 h. The polarization curves
of various alloys were obtained by exposing them into corrosion media. The polarization curves were
used to estimate the corrosion and breakdown potentials (Ecorr, Ebp), and corrosion current density (icorr)
at Ecorr by the Tafel extrapolation. The EIS were carried out at open potential with the amplitude of 10
mV over the frequency range of 100 kHz - 0.1Hz. The specimens were exposed to the corrosion media

Int. J. Electrochem. Sci., Vol. 8, 2013
2554
at different times, viz., 2, 4, 6, 8 and 12 h, to investigate the mechanism of corrosion. The EC-Lab
software was employed to fit the EIS by the equivalent circuit.
2.3 Phase identification and microstructural characterization
The microstructure of BE-Mg-1.0Zn-xCa (BE-MZxC) before and after corroded was studied by
optical microscopy. The samples were prepared by standard metallographic procedures and were
etched in picral. After the samples were exposed into SBF for 12 h, corrosion morphology observation
and ingredient identification of the corrosion products were carried out by energy dispersive spectrum
(EDS).
3. RESULTS AND DISCUSSION
3.1 Microstructures
Figure 1. Microstructures of BE-MZxC, (a) x=0.2; (b) x=0.5; (c) x=0.8; (d) x=1.0
The microstructures of BE-MZxC alloys are shown in Fig. 1. The microstructures of the alloys
are homogeneous and uniform. All the specimens are composed of regular equiaxed grains with some
black precipitates in the grain interior or along the grain boundary. The average grain size is decreased
with the increment of Ca content. The value of BE-MZ0.2C alloy is about 25 ± 5 μm, which is 1.7
times as high as that of BE-MZ1.0C alloy. Furthermore, a large number of fine grains in the triple
junction are detected in BE-MZ1.0C alloy owing to the dynamic recrystallization. With increasing the
concentration of Ca, the fraction of secondary precipitates is increased correspondingly. Thus, the

Int. J. Electrochem. Sci., Vol. 8, 2013
2555
more precipitates can act as effective cores to form new grain during the dynamic recrystallization,
leading to the reduction of grain size. In addition, some twins are clearly observed in BE-MZ0.2C
alloy in contrast to other three samples. It reveals that the addition of Ca can impede the formation of
twin during the mechanical polishing. The similar results are also found in other Mg alloys [14].
3.2 Electrochemical behavior
Figure 2. Evolution of open circuit potentials as a function of exposing time for BE-MZxC in different
solutions, (a) 0.9NaCl; (b) 3.5NaCl; (c) SBF

Int. J. Electrochem. Sci., Vol. 8, 2013
2556
Fig. 2 shows the time dependence of the potential in BE-MZxC alloys immersed in different
media, where OCPs of alloys in both 0.9NaCl and 3.5NaCl show the similar tends. Namely, the
potential drifts rapidly toward the noble side at the initial stage of immersion, and then follows by a
slight fluctuation. Furthermore, the addition of Ca element is attributed to enhance the potential of the
alloys in both of the two solutions. Conversely, as the immersion time is increased, the continuous
increment of potential is observed in SBF during the whole immersion process. It is demonstrated the
corrosion mechanisms of the alloys in NaCl and SBF solutions are different. The amount of Ca hardly
plays a role on OCP in SBF.
The OCP usually varies with the immersion time because of the changed composition of the
surface during exposure to a corrosion medium. Basically, OCP is determined by both the anodic and
cathodic reactions [15]. As soon as the alloy is immersed into NaCl and SBF media, electrochemical
reactions generate on the surface of the alloy with the formation of a passivation layer. And then the
anodic current decrease and the OCP shifts toward noble side. Finally, both OCP and anodic current
maintain at a steady level accordingly providing a stable passivation layer is achieved [16]. In addition,
the fluctuation is elucidated of the occurrence of pitting corrosion or the process of depassivation-
repassivation caused by the loss and re-growth of the passivation layer [17]. The slightly increment of
the potential in SBF is associated to the infections of buffer solution on passivation behavior.
Table 2. Evaluated corrosion potential (Ecorr) and breakdown potential (Ebp), passive potential region
(△E) [mV] and corrosion current density (icorr) [×10-5
mA/mm2]
Alloys 0.9NaCl 3.5NaCl SBF
Ecorr Icorr Ebp Ecorr Icorr Ebp Ecorr Icorr Ebp
MZ0.2C -1524 1.482 -815 -1575 0.907 -1448 -1569 1.411 -1500
MZ0.5C -1529 0.167 -960 -1569 1.658 -1452 -1538 0.079 -1513
MZ0.8C -1537 0.816 -1106 -1527 0.112 -1353 -1505 0.048 -1504
MZ1.0C -1411 0.432 -729 -1496 2.290 -1368 -1449 0.205 -1178
The potentiodynamic polarization behaviors of BE-MZxC in different solutions are shown in
Fig. 3. The Ecorr, icorr and Ebp were derived from the plots by Tafel extrapolation. The detailed values
are shown in Table 2. As far as Ecorr is concerned, four alloys exhibit the similar trends in three
solutions. With the increased Ca content, the Ecorr shifts towards the positive position. Namely,
compared with other three samples, the increment of Ecorr is higher for BE-MZ1.0C alloy. The current
plateau (the passive potential region, △E=Ebp - Ecorr) is related to the passivative behavior [18]. In this
work, the △E is decreased with the increment of Ca content. It starts to slightly increase after reaching
the inflexion value. Namely, the approximate “V-shaped” trend is observed in three solutions. The
corrosion rate is generally determined by the icorr [19]. The corrosion rate is reduced with the addition
of micro-alloying Ca when the content of Ca is less than 1.0 wt. %. For example, the corrosion current
density of BE-MZ0.2C is 1.482×10⁻⁵
mA/mm2, which is 1.8 time as high as that of BE-MZ0.8C in
0.9NaCl.

Int. J. Electrochem. Sci., Vol. 8, 2013
2557
Figure 3. Potentiodynamic polarization curves of BE-MZxC alloys immersed in the (a) 0.9NaCl; (b)
3.5NaCl; (c) SBF

Int. J. Electrochem. Sci., Vol. 8, 2013
2558
Figure 4. Nyquist diagrams of BE state (a) MZ0.2C; (b) MZ0.5C; (c) MZ0.8C; (d) MZ1.0C exposed
to 0.9NaCl for different immersion times
Figure 5. Nyquist diagrams of BE state (a) MZ0.2C; (b) MZ0.5C; (c) MZ0.8C; (d) MZ1.0C exposed
to 3.5NaCl for different immersion times

Int. J. Electrochem. Sci., Vol. 8, 2013
2559
Figure 6. Nyquist diagrams of BE state (a) MZ0.2C; (b) MZ0.5C; (c) MZ0.8C; (d) MZ1.0C exposed
to SBF for different immersion times
Figure 7. Equivalent electrical circuit models for BE state (a) MZxC (x=0.2, 0.5, 0.8); (b) MZ1.0C
alloys in 0.9NaCl and 3.5NaCl; (c) MZxC (x=0.2, 0.5, 0.8, 1.0) alloys in SBF

Int. J. Electrochem. Sci., Vol. 8, 2013
2560
Figure 8. Non-linear least square fitting obtained for the EIS data of BE-MZxC (x=0.2, 0.8) in (a)
0.9NaCl; (b) 3.5NaCl; (c) SBF

Int. J. Electrochem. Sci., Vol. 8, 2013
2561
The EISs of BE-MZxC alloys were detected after immersion in different solutions for different
time. Four alloys exhibit the similar trend in both 0.9NaCl and 3.5NaCl (Fig. 4 and Fig. 5). Namely,
when the Ca content is lower than 1.0 wt. %, the EIS mostly contains a capacitive loop in high
frequency (HF) and medium frequency (MF). However, an inductive loop in low frequency (LF) is
also detected in BE-MZ1.0C alloy apart from a capacitive loop in HF and MF. In the case of SBF
solution (Fig. 6), the same configuration of EIS of the four samples is identified. The EIS is mostly
composed of two capacitive loops in HF and MF and an inductive loop in LF. It is well known that a
HF capacitive loop is mostly associated with the charge transfer resistance and double layer
capacitance at the metal/solution interface [20]. The capacitive loop at MF is related to the diffusion of
ions through the corrosion product layer. The inductive behavior at LF is generally attributed to high
concentration of Mg ions on relatively film-free areas or with an intermediate step in the corrosion
process involving the presence of adsorbed surface species. The existence of inductive loop commonly
displays the occurrence of pitting corrosion [21].
Figure 9. Resistances of BE-MZxC (x= 0.2, 0.5, 0.8, 1.0) estimated from the Nyquist diagram in (a)
0.9NaCl; (b) 3.5NaCl; (c) SBF
To analyze the EIS spectra of BE-MZxC alloys, the equivalent electrical circuit models are
shown in Fig. 7. For 0.9NaCl and 3.5NaCl, the fitting plots can be represented by
Rs(CPE1Rct)(CPE2(W1Rw)). The BE-MZ1.0C can be represented by Rs(CPE1Rct)(CPE2(L1RL)). In the
case of immersion in SBF solution, the model turned to be Rs(CPE1Rct)(CPE2(Rf(RLL1))). In all of the

Int. J. Electrochem. Sci., Vol. 8, 2013
2562
equivalent circuits, Rs was solution resistance. Since the Nyquist plots exhibited depressed semicircles,
the constant phase elements (CPE1 and CPE2) were employed instead of Cdl in the proposed model.
CPE1 and Rct in parallel were attributed to the charge transfer resistance and capacitance in the electric
double layer, respectively. W1 was Warburg diffusion element. Rw was the Warburg resistance. W1 and
CPE2 were in parallel, which accounted for the corrosion process of film-free areas dominated by the
diffuse procedure. Rf and CPE2, were introduced for the capacitance and resistance of the mass transfer
procedure in the matrix. To account for the inductive behavior, an inductor, L1 and a resistance, RL
were introduced into the second and third models. The fitting obtained for the EIS data of the BE-
MZxC (x=0.2, 0.8) are shown in the Fig. 8. The validity of the model was confirmed based on the
better non-linear least square fitting of the experiment date within 5% error. The detailed data for the
fitting are shown in Fig. 9. The corrosion resistance immersed into the solutions is increase with the
increment of the immersion time. It indicates that the BE-MZxC alloys can be well resistant to the
corrosion medium during a certain long time despite of the composition of the medium. The BE-
MZ1.0C shows a lower resistance in all the corrosion media compared with the other samples. In the
0.9NaCl and SBF, the corrosion resistance is enhanced by the addition of Ca when the content is no
more than 0.5 wt. %. However, BE-MZ0.8C shows the most resistance among all the samples in
3.5NaCl.
3.3 Corrosion mechanism
Figure 10. (a) SEM graph of the surface morphology; (b) optical microstructure of cross section of the
BE-MZ1.0C alloys after immersed in SBF for 12 h
The microstructure of the corroded BE-MZ1.0C immersed in SBF for 12 h is shown in Fig. 10.
After immersed in corrosion media for 12 h, the surface of the sample was covered by a film of
corrosion products. Some circular-like oxides were segregated on the surface (Fig. 10a). Some small

Int. J. Electrochem. Sci., Vol. 8, 2013
2563
pits were found among the corrosion products. Furthermore, the corrosion expands along the grain
boundaries (Fig. 10b). It reveals that the pitting corrosion emerges during the corrosion process.
Figure 11. EDX of the different sections on the surface, (a) the etch pit; (b) the film-free area; (c) the
mass of corrosion products.
SEM morphology and the chemical composition of different areas on the surface of BE-
MZ1.0C are shown in Fig. 11. The Ca concentration in etched pit (noted A) is lower than other area
(noted B and C). On the contrary, the contents of Zn and Mg in “A” area are higher. It demonstrates
that the addition of Ca was dissolved into the medium or segregated in corrosion products (noted C).
The relative concentration of both Zn and Mg is enhanced since the dissolution of Ca. According to the
result of cross section (Fig. 10b), it can be confirmed that the aggregated Ca near to the grain
boundaries during the solidification acts as the cathode during the immersion process.
The maximum solid solubility of Ca in Mg matrix is 1.34 wt. % at 516 ℃ [22]. When the
added content is lower than 0.8 wt. %, the Ca is well distributed in the matrix. At the same time, due to
the high chemical activity, the impurities, such as Fe, Ni and Cu, can be effective separated from the
melt by formation of compounds. Therefore, anti-corrosion properties are improved correspondingly.
For example, Ca element is one of effective slag agents in the smelting industry of iron [23].
Conversely, when the content of Ca is 1.0 wt. %, it is prone to form the secondary phase (Mg2Ca) in
MZ1.0C alloy during the solidification. The increased fraction of particle accelerates the pitting

Int. J. Electrochem. Sci., Vol. 8, 2013
2564
corrosion. Consequently, the anti-corrosion properties are decreased in BE-MZ1.0C alloy. The similar
phenomena have also been confirmed in other Mg alloys [24].
4. CONCLUSIONS
The addition of 1.0 wt. % Ca can significantly promote the dynamic recrystallization, leading
to the grain refining.
The potential shifts to positive direction as the content of Ca is increased based on the results
of open circuit potential and polarization curves.
As the concentration of Ca is increased, backward extruded Mg-1.0Zn-xCa exhibits concave-
shaped trend in three solutions. Namely, the corrosion rate is decreased by getting rid of impurities at
the initial stage, and then increased with the formation of secondary phase.
The backward extruded Mg-1.0Zn-0.5Ca alloy exhibits the most anti-corrosion properties in
both 0.9 wt. % NaCl and SBF solutions, while it turns to backward extruded Mg-1.0Zn-0.8Ca in 3.5
wt. % NaCl solution.
ACKNOWLEDGEMENTS
This research is financially supported by National Natural Science Foundation of China (Grant No.
51101142 and 50821001), Postdoctoral Science Foundation (2012M510766) and Science Foundation
for the Excellent Youth Scholars of Hebei Province (Y2012019).
References
1. G. Song, Corr. Sci. 49 (2007) 1696
2. H. X. Wang, S. K. Guan, X. Wang, C. X. Ren, L. G. Wang, Acta Biomaterialia. 6 (2010) 1743
3. M. E. Ferreira, M. D. L. Pereira, F. G. E. Costa, J. P. Sousa, G. Simões De Carvalho, Journal of
Trace Elements in Medicine and Biology. 17 (2003) 45
4. K. Oh-Ishi, R. Watanabe, C. L. Mendis, K. Hono, Mater. Sci. Engin.: A. 526 (2009) 177
5. S. Zhang, X. Zhang, C. Zhao, J. Li, Y. Song, C. Xie, et al., Acta Biomater. 6 (2010) 626
6. T. Lei, W. Tang, S.-H. Cai, F.-F. Feng, N.-F. Li, Corr. Sci. 54 (2012) 270
7. Z. Li, X. Gu, S. Lou, Y. Zheng, Biomaterials. 29 (2008) 1329
8. X. N. Gu, W. Zheng, Y. Cheng, Y. F. Zheng, Acta Biomater. 5 (2009) 2790
9. H. R. B. Rad, M. H. Idris, M. R. A. Kadir, S. Farahany, Materials & Design. 33 (2012) 88
10. Y. Wang, M. J. Tan, J. Pang, Z. Wang, A. W. E. Jarfors, Mater. Chem. Phys.. 134 (2012) 1079
11. J. H. Gao, S. K. Guan, Z. W. Ren, Y. F. Sun, S. J. Zhu, B. Wang, Mater. Letters. 65 (2011) 691
12. Y. Sun, B. Zhang, Y. Wang, L. Geng, X. Jiao, Materials & Design. 34 (2012) 58
13. Q. Peng, X. Li, N. Ma, R. Liu, H. Zhang, J Mech Behav Biomed Mater. 10 (2012) 128
14. N. Ma, Q. Peng, X. Li, H. Li, J. Zhang, Y. Tian, Int. J. Electrochem. Sci. 7 (2012) 8020
15. M. Liu, P. Schmutz, P. J. Uggowitzer, G. Song, A. Atrens, Corr. Sci.. 52 (2010) 3687
16. X. Gu, Y. Zheng, S. Zhong, T. Xi, J. Wang, W. Wang, Biomaterials. 31 (2010) 1093
17. S. González, E. Pellicer, J. Fornell, A. Blanquer, L. Barrios, E. Ibáñez, et al., J Mech Behav
Biomed Mater. 6 (2012) 53
18. S. Z. Qiuming Peng, Hui Li, Ning Ma, Xuejun Li, Yongjun Tian, Int. J. Electrochem. Sci.. 7 (2012)
19. Z. Shi, M. Liu, A. Atrens, Corr. Sci.. 52 (2010) 579

Int. J. Electrochem. Sci., Vol. 8, 2013
2565
20. T. Lei, W. Tang, S.-H. Cai, F.-F. Feng, N.-F. Li, Corr. Sci.. 54 (2012) 270
21. A. P. R. Arrabal, M.C. Merino, M. Mohedano, P. Casajus, K. Paucar, G. Garces, Corrosion
Science. 55 (2012)
22. T. V. Larionova, W.-W. Park, B.-S. You, Scripta Materialia. 45 (2001) 7
23. C. Li, H. Sun, L. Li, Cement and Concrete Research. 40 (2010) 1341
24. T. J. Luo, Y. S. Yang, Y. J. Li, X. G. Dong, Electrochimica Acta. 54 (2009) 6433
© 2013 by ESG (www.electrochemsci.org)