electrochemical behavior of ammonia on ni98pd2 nano-structured catalyst
TRANSCRIPT
ww.sciencedirect.com
i n t e r n a t i o n a l j o u rn a l o f h y d r o g e n en e r g y 3 9 ( 2 0 1 4 ) 4 1e4 8
Available online at w
ScienceDirect
journal homepage: www.elsevier .com/locate/he
Electrochemical behavior of ammonia on Ni98Pd2
nano-structured catalyst
Anis Allagui 1, Saad Sarfraz, Spyridon Ntais, Fares Al momani,Elena A. Baranova*
Department of Chemical & Biological Engineering, University of Ottawa, 161 Louis-Pasteur, Ottawa, ON K1N 6N5,
Canada
a r t i c l e i n f o
Article history:
Received 17 April 2013
Received in revised form
24 September 2013
Accepted 3 October 2013
Available online 8 November 2013
Keywords:
Ammonia electrooxidation
pH effect
Electrolysis
Ni hydroxides
* Corresponding author. Tel.: þ1 (613) 562 58E-mail addresses: elena.baranova@uottaw
1 Present address: Department of Sustaina27272, Sharjah, United Arab Emirates.0360-3199/$ e see front matter Copyright ªhttp://dx.doi.org/10.1016/j.ijhydene.2013.10.0
a b s t r a c t
Small amounts of Pd served as a reducing agent to produce sub-100 nm polygonally-shaped
Ni98Pd2 materials in ethylene glycol. As-synthesized particles were crystallized into fcc Ni
with a fraction of b-Ni(OH)2, and exhibited very low to no activity towards ammonia
electrooxidation. Their catalytic activity has been significantly improved by building up a
layer of Ni(OH)2 by cyclic voltammetry between �0.95 and 1.35 V vs. HgO/Hg in NaNO3 at
pH 9. XPS analysis before and after the electrochemical treatment confirmed the trans-
formation of Ni0 to higher state of oxidation. Ammonia electrooxidation on Ni(OH)2/NiPd
occurred at around 1.28 V vs. HgO/Hg and was highly pH-dependent. At concentrations less
than 100 mM, the direct electron transfer took place, whereas at higher ammonia con-
centrations it was the indirect electron transfer mechanism. A 9-h galvanostatic electrol-
ysis at 20 mA cm�2 showed that 64% of the initial ammonia was degraded at 38% average
current efficiency.
Copyright ª 2013, Hydrogen Energy Publications, LLC. Published by Elsevier Ltd. All rights
reserved.
1. Introduction requirements of recent electrochemical studies to oxidize
Ammonia is a major toxic pollutant in discharged waters that
leads to the eutrophication of the ecosystem [1]; thus its
removal is essential for ecological and environmental reasons.
On the other hand, anhydrous liquid ammonia is a compact
hydrogen carrier, as well as a distribution and storage me-
dium: its specific volume of hydrogen content is higher by 70%
than liquid hydrogen with 50% increase in the specific energy
density [2e7]. Ammonia can also be directly used as a fuel in
direct ammonia fuel cells, as the theoretical specific charge of
complete ammonia oxidation to N2 is 4.75 A h g�1 which is 95%
of the charge of methanol oxidation to CO2 [8]. The
00x6302; fax: þ1 (613) 562a.ca, obaranov@uottawa
ble & Renewable Energy E
2013, Hydrogen Energy P24
ammonia consist on finding high-performance electro-
catalysts with low overpotential and low production of ni-
trogen and carbon oxides.While platinum groupmetals (PGM)
and their bi-metallic alloys (e.g. PtIr, PtRu, PtPd, PtSnO2)
exhibit the highest degradation strength and stability towards
this process [7e14], their application at industrial scale is
restricted due to economical constraints, and therefore, there
is an urgent need to develop non-PGM catalysts.
To date, very few works are reported on the ammonia
electrooxidation reaction on non-PGM. Despic et al. [15] re-
ported that Raney nickel showed insignificant activity for the
anodic oxidation of ammonia in 5 M KOH because of the
5172..ca (E.A. Baranova).ngineering, College of Engineering, University of Sharjah, P.O. Box
ublications, LLC. Published by Elsevier Ltd. All rights reserved.
i n t e rn a t i o n a l j o u r n a l o f h y d r o g e n en e r g y 3 9 ( 2 0 1 4 ) 4 1e4 842
immediate and spontaneous oxidation of the electrode sur-
face at the potential coinciding with the ammonia oxidation
process itself. This has been supported by Yao and Cheng [16]
where they assumed that the ammonia electrooxidation
mechanism of Gerischer and Mauerer [4] is applicable on Ni
electrode and that its spontaneous oxidation, once in contact
with alkaline media, prevents the adsorption of NH3 needed
for the subsequent dehydrogenation reactions to N2. The
oxidation of NHþ4 on Ni oxide electrode is also believed by Yao
and Cheng to be ineffective because, as a p-type semi-
conductor, the negatively charged cation vacancies in the
oxides playing the role of charge carriers will cause a reverse
electron generation in Gerischer and Mauerer mechanism [4]
and the fast deactivation of the Ni anode [16]. However, it
has been recently shown that Ni electrode with a surface layer
of Ni(OH)2 can be a potential candidate for efficient ammonia
oxidation in alkaline media [17]. Kapalka et al. found that the
oxidation of ammonia to N2 with traces of nitrate takes place
in the oxyhydroxide region via a direct electron transfer
mechanism. The 12-h 20 mA cm�2 bulk electrolysis with
passivated nickel wire in 1 M NaClO4 þ 50 mM NH4ClO4 at pH
11 indicated a degradation rate of 0.14 mmol cm�2 h�1, cor-
responding to the transformation of 55% of the initial con-
centration of ammonia into volatile nitrogenous species and
nitrate [17].
It was shown in our recent reports [18,19] that Ni-rich
NixPd1�x nanostructured materials are promising catalysts
for ammonia electrooxidation when activated by a long pre-
treatment using cyclic voltammetry (200 cycles) in alkaline
NaNO3 solution. This electrochemical treatment was neces-
sary to build the Ni(OH)2 phase, the active species towards
ammonia electrooxidation [17]. In this study we present a
detailed investigation on the Ni98Pd2 type of nanoparticles
includingmainly the XPS surface analysis before and after the
electrochemical treatment. The physicochemical character-
izations were carried out by TEM-EDS, ICP-AES and XRD an-
alyses. The detailed electrochemical study at various
ammonia concentrations and solution pH is presented and
discussed. Galvanostatic electrolysis at optimized conditions,
accompanied with preliminary reaction kinetics results are
demonstrated.
2. Experimental
2.1. Synthesis of nanostructured NiPd materials
All chemicals used in this work were reagent grade products
and were used without further purifications. The detailed
description of the modified polyol method used for the syn-
thesis of NiPd materials of this study is reported elsewhere
[20e22]. In brief, it consists consisted on mixing 0.4 g of
Ni(OH)2 salt (Acros Organics) with 150 mL of ethylene glycol
(Sigma Aldrich) for 1 h in a three-neck flask and refluxing for
10 min. On the other hand, 8.7 mg of PdCl2 (Alfa Aesar) was
dissolved in ethylene glycol and adjusted to pH 5 with HCl. At
198 �C, the boiling point of the polyol, the Pd-containing so-
lutionwas quickly injected into the former. The small amount
of Pd salt was used to activate the heterogeneous nucleation
and acted as a reducing agent and a catalyst for the growth of
the Ni-rich materials. The NiPd powder was separated from
the synthesis solution by a neodymium (NdFeB) magnet, fol-
lowed by several cycles of centrifugation and washing with
deionized water, and then stored in isopropanol.
2.2. Physicochemical characterization
Nanostructured NiPd sample preparation for transmission
electron microscopy (TEM) that is coupled to an energy
dispersive X-ray detector (EDS) consisted of depositing and
air-drying a droplet from the NiPd-in-isopropanol solution,
onto a carbon-coated copper micro-grid. TEM micrographs
were carried out with a JEOL JEM 2100F FETEM at 200 kV
accelerating voltage, and EDS elemental analysis was per-
formed during 100 s live time at the same operating voltage.
The powder X-ray diffraction (XRD) patterns were recorded
with Rigaku Ultima IV multi-purpose diffractometer with Cu
Ka radiation (l¼ 1.5418�A) at 40 kV and 44mA in the 2q range of
35e90� 2qwith 0.02� 2q s�1 scanning rate. Surface composition
of NiPd catalysts was analyzed by X-ray photoelectron spec-
troscopy (XPS) using a Kratos Axis Ultra DLD with a Hybrid
lens mode. XPS measurements were conducted at 140 W and
20 eV pass energy using a monochromatic Al Ka. The binding
energy scale was assigned by adjusting the C 1s peak at
284.6 eV.
2.3. Electrochemical measurements
The electrochemical experiments were carried out with a
BioLogic VSP potentiostat together with the EC-Lab software
at ambient temperature. For the potentiodynamic measure-
ments, a 75mL three-compartment Pyrex electrochemical cell
was used with HgO/Hg�KOH as a reference electrode (Koslow
Scientific Company) separated from the working electrode
compartment. All potentials are reported vs. HgO/Hg elec-
trode. A large surface area Ptmesh served as counter electrode
and was situated in a separate compartment. Thoroughly
polished and washed glassy carbon (GC) disc (Pine Research
Instrumentation) of 19.62 mm2-exposed surface served as the
current collector. The working electrode was prepared by
depositing onto the GC disk and air drying 5 mL of NiPd ink
prepared by mixing the following: (i) 0.6 g of NiPd particles, (ii)
45mg of carbon black VulcanXC-72 (Cabot Corp.), (iii) 0.5mL of
a 5%Nafion solution (SigmaeAldrich), (iv) 1 mL of isopropanol,
and (v) 10 mL of deionized water. The cyclic voltammetry
experiments at 100 mV s�1 scan rate were performed in a
supporting solution of NaNO3 (SigmaeAldrich, ACS reagent,
�99.0%) at unit molarity with varying concentrations of
NH4NO3 (SigmaeAldrich, �99.0%) under controlled pH,
adjusted with a 3 M NaOH solution.
For the bulk electrolysis experiment, the used electro-
chemical cell is a closed two-compartment cell with 1 M
NaNO3 þ 0.2 M NH4NO3 at pH 10.5 and under continuous
stirring. The counter electrode was a large stainless steel coil
of grade 304. The applied current was set to 20 mA per geo-
metric cm2 during 9 h. Total nitrogen was determined using
Appollo total nitrogen analyzer (Teledyne Tekmar) pre-
calibrated with a standard solution of NH4OH. Ammonia
was determined according to the procedure stipulated in
Standard Methods [23]. 2 mL samples were collected from the
i n t e r n a t i o n a l j o u rn a l o f h y d r o g e n en e r g y 3 9 ( 2 0 1 4 ) 4 1e4 8 43
electrolysis solution at 0, 20, 40 and 60min and then every one
hour, and have been analyzed three times with a reproduc-
ibility of �0.1 mg-N L�1. The reported concentration values in
this work were averaged over the three measurements. Con-
trol samples were also taken and analyzed to correct the real
ammonia removal values with the stripping amounts which
did not surpass the 1%.
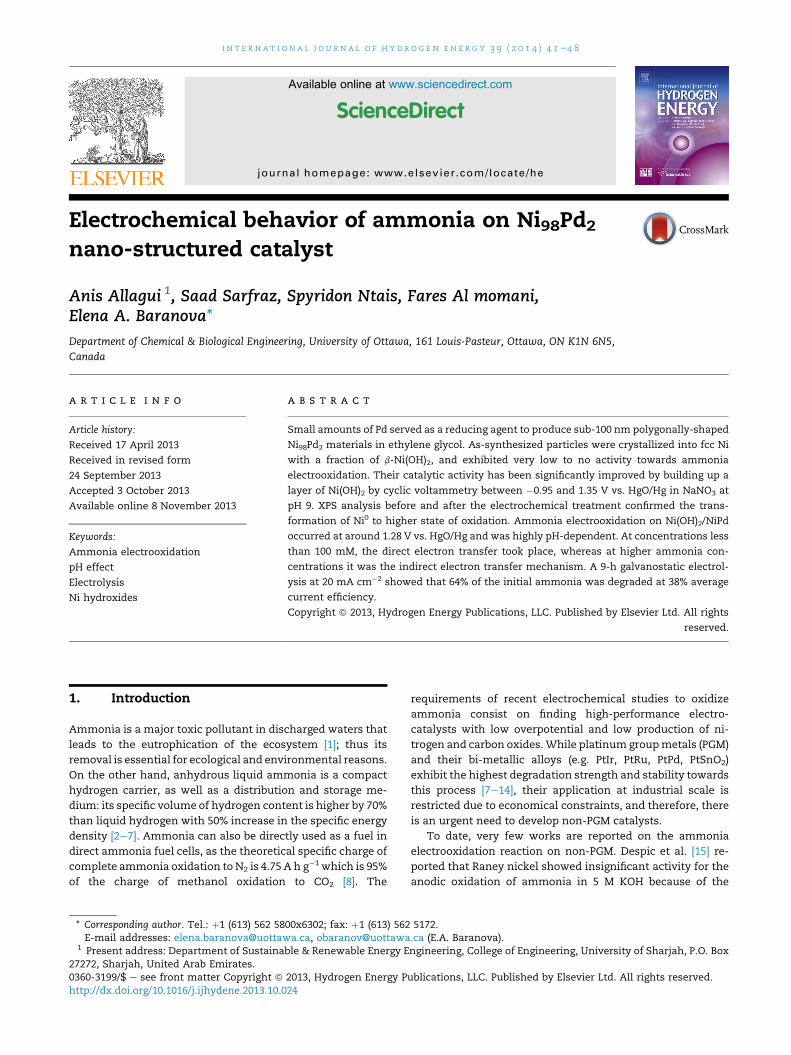
Fig. 2 e X-ray diffraction patterns of as-synthesized NiPd
particles.
3. Results and discussion
3.1. TEM/EDS and XRD
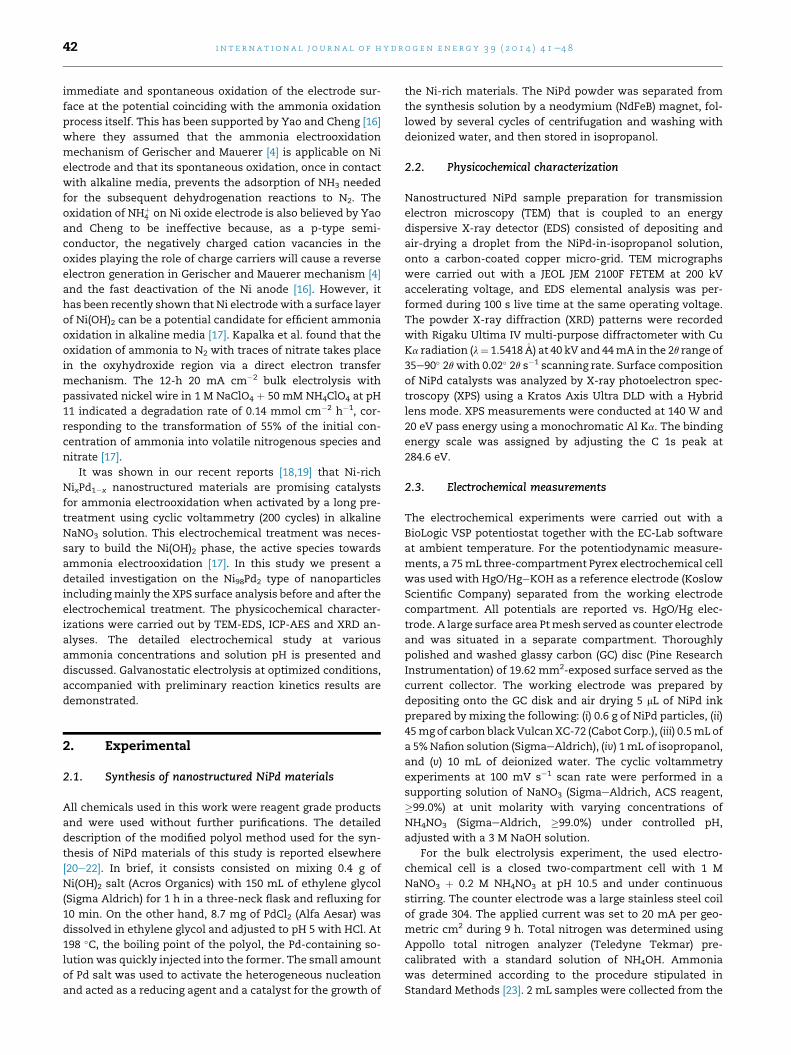
Fig. 1 shows a typical TEM micrograph of the NiPd particles.
Elemental composition by EDS (Ni98.8Pd1.2) and inductively
coupled plasma atomic emission spectroscopy (ICP-AES,
Ni98.2Pd1.8) analyses are in close agreement with the initial
nominal atomic content of metals used to prepare the nano-
catalyst. The difference between the nominal 1 at. % of Pd and
the 1.8 measured by ICP-AES indicates that not all of the Ni
ions have effectively taken part in the heterogeneous nucle-
ation process on Pd nuclei. From now on we will refer to the
investigated nanocatalyst of this study to either NiPd or
Ni98Pd2. Two types of particles are seen in the TEM micro-
graph. Some are large in the 50e100 nm range with three
dimensional polygonal shapes and straight sharp features
that show some surface defects due to their size range, and
are assigned to Ni materials. Others are spherically shaped
within the 5e10 nm size range, decorating the surface of the
latter, and are assigned to the Pd nanoparticles.
Fig. 2 shows the powder XRD patterns of NiPd catalyst that
crystallized into a face-centered cubic (fcc) structure of Ni
(JCPDS card # 04-0850) with diffraction peaks at 44.51�, 51.85�,76.46� corresponding to hkl planes (111), (200) and (220)
respectively. b-Ni(OH)2 (101), (110) and (111) (JCPDS card # 01-
Fig. 1 e Typical TEM micrograph of NiPd particles.
1047) are also detected. Pd (111) with the diffraction peak
centered at 40.36� (JCPDS card 05-0681) is identified in the
patterns but it represents a negligible contribution. The XRD
reflections are characterized by sharp and well-defined peaks
with strong intensity indicating the high crystallinity of the
powder. The mean crystallite size estimated using Scherrer’s
formula [24] using the most intense Ni (111) peak parameters
and the shape factor 0.89 is 22.4 nm.
3.2. Electrochemical activation & XPS of NiPd particles
An electrochemical pre-treatment was applied to the NiPd
particles to form Ni hydroxide on the surface, being the
electro-active species for ammonia oxidation [17,18]. This was
performed by carrying out 200 cyclic voltammograms in 1 M
NaNO3 at pH 9 in the voltage range �0.95 to þ1.35 V at
100 mV s�1. Under alkaline conditions, in the hydroxide for-
mation region, the adsorption of OH� on Ni leads to its
oxidation and the formation of the a-phase of Ni(OH)2 such
that [25e28]:
Niþ 2OH�!aNiðOHÞ2 þ 2e� (1)
At higher potentials, the hydrous a-Ni(OH)2 is irreversibly
transformed into the anhydrous b-form of Ni(OH)2 [27]. The
latter leads to the formation of nickel oxyhydroxide NiOOH
according to [29]:
b�NiðOHÞ2 þOH�!ðb;gÞNiOOHþH2Oþ e� (2)
The continuous electrode cycling (not shown here) led to
significant currents increase associated with the process of
reaction 2 indicating the transformation of Ni surface mate-
rials into hydroxides.
a b
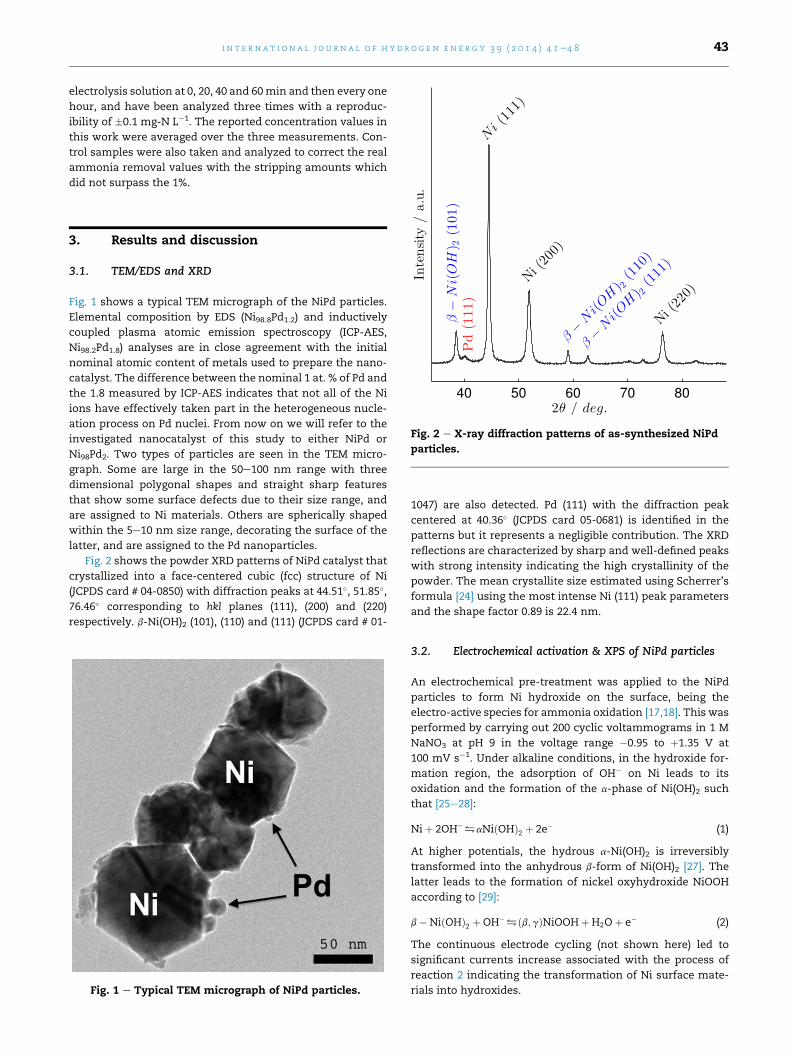
Fig. 3 e High resolution XPS spectra of (a) Ni 2p3/2 and (b) Pd 3p3/2 before and after electrochemical pre-treatment.
Fig. 4 e Effect of electrochemical pre-treatment on the
ammonia electrooxidation reaction on NiPd
nanostructured catalysts; cyclic voltammograms at
100 mV sL1 scan rate are conducted in 1 M NaNO3 D 0.2 M
of NH4NO3 at pH 9.
i n t e rn a t i o n a l j o u r n a l o f h y d r o g e n en e r g y 3 9 ( 2 0 1 4 ) 4 1e4 844
Surface analysis using XPS was carried out to elucidate the
chemical state of Ni and Pd atoms in the as-synthesized NiPd
particles after being subjected to the electrochemical pre-
treatment. The Ni 2p3/2 spectrum demonstrates a complex
structure with intense and wide satellite peaks at higher
binding energies adjacent to the primary photolines (Fig. 3(a)).
These peaks are called shake-up and are due to a charge
transfer ligand-metal process by which an excitation of a
valence ligand electron to a previously unoccupied metal
orbital takes place simultaneously with the primary core
photoelectron process [30]. The satellite band is located at
higher binding energy and its position depends on the
chemical environment of nickel atoms. The recorded Ni 2p3/2
XPS spectrum before and after treatment are presented in
Fig. 3(a). Before treatment it shows the existence of a shoulder
at around 852.3 � 0.2 eV and an intense peak at around
855.3� 0.2 eV. The former peak is attributed to nickel atoms in
themetallic state [31,32], while the latter is characteristic of Ni
atoms in the 2þ oxidation state due to Ni(OH)2 [33e35]. XPS
analysis reveals the existence of an ill-defined peak in the
characteristic energy window of Pd 3p3/2 as shown in Fig. 3(b).
The signal of this peak implies the small amount of Pd on the
surface while the centre of the peak is at 335.1 eV that is
characteristic of metallic Pd [33,36]. Thus, the existence of an
O 1s peak (not shown here) observed at around 529.2 eV can be
attributed to a small amount of nickel atoms in NiO form.
After the electrochemical treatment no Pd is detected
which suggests its complete dissolution during the treatment
process. On the other hand, the Ni 2p spectrum exhibits a
rather complicated structure. Thus, no peak at 852.2 eV is
detected implying that the treatment has caused the complete
oxidation of metallic Ni atoms. A Ni 2p3/2 peak is detected at
about 857.2 eVwhich is a position characteristic of NiOOH [31].
The corresponding satellite peak should be detected at about
863 eV and should normally have lower intensity than the
main line. Though, as it can be seen, its existence is over-
lapped by another peak at about 860.8 eV. In the literature a Ni
2p3/2 peak around 861 eV is reported for K2NiF6 [37]. At this
point we should mention that fluorine and sodium are also
detected on the surface that originate from the Nafion and the
sodium nitrate solutions. Thus, we strongly believe that this
new peak is due to the formation of a similar nickel compound
e.g. Na2NiF6 or NaNiF3. More studies are necessary so as to
further elucidate this claim. The fact that the O 1s peak does
not show any component at about 529.2 eV strongly indicates
the transformation of NiO to NiOOH.
3.3. Ammonia electrooxidation reaction
The effect of the pre-treatment of NiPd catalyst on the
ammonia electrooxidation reaction is shown in Fig. 4 which
illustrates the 100 mV s�1 cyclic voltammograms of both non-
treated and treated electrode materials in 1 M NaNO3 þ 0.2 M
of NH4NO3 at pH 9. With the presence of ammonia, the couple
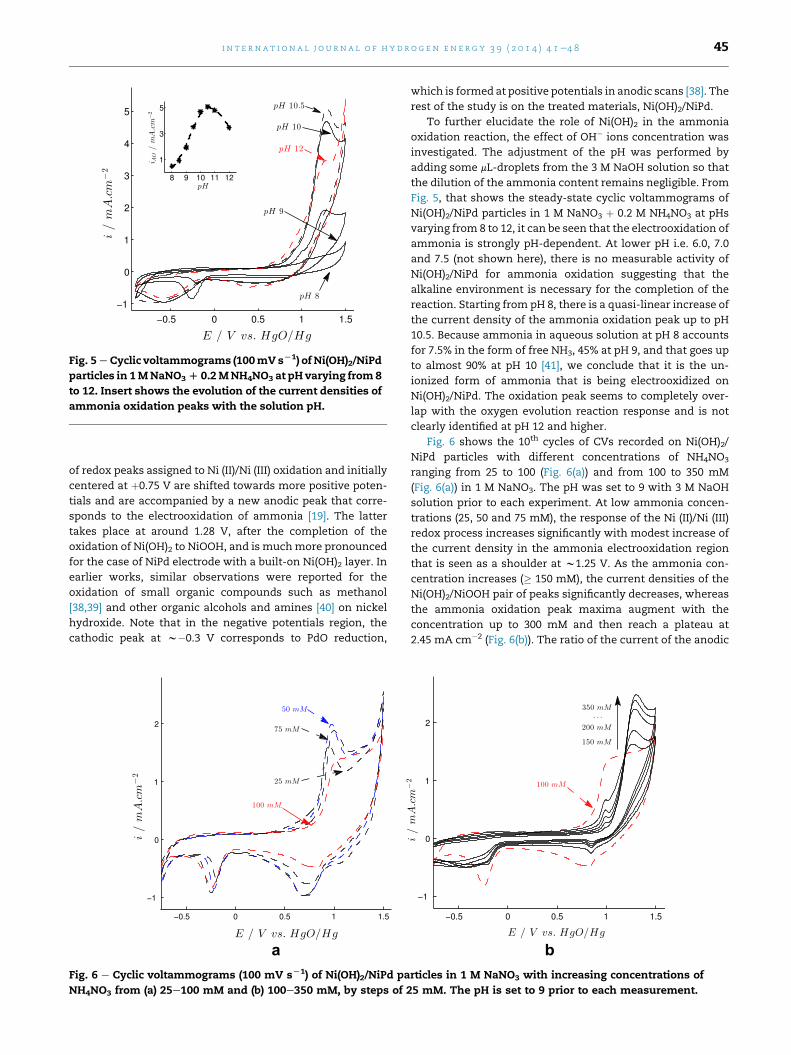
Fig. 5 e Cyclic voltammograms (100mVsL1) of Ni(OH)2/NiPd
particles in 1MNaNO3D 0.2MNH4NO3 at pH varying from8
to 12. Insert shows the evolution of the current densities of
ammonia oxidation peaks with the solution pH.
i n t e r n a t i o n a l j o u rn a l o f h y d r o g e n en e r g y 3 9 ( 2 0 1 4 ) 4 1e4 8 45
of redox peaks assigned to Ni (II)/Ni (III) oxidation and initially
centered at þ0.75 V are shifted towards more positive poten-
tials and are accompanied by a new anodic peak that corre-
sponds to the electrooxidation of ammonia [19]. The latter
takes place at around 1.28 V, after the completion of the
oxidation of Ni(OH)2 to NiOOH, and is muchmore pronounced
for the case of NiPd electrode with a built-on Ni(OH)2 layer. In
earlier works, similar observations were reported for the
oxidation of small organic compounds such as methanol
[38,39] and other organic alcohols and amines [40] on nickel
hydroxide. Note that in the negative potentials region, the
cathodic peak at w�0.3 V corresponds to PdO reduction,
a
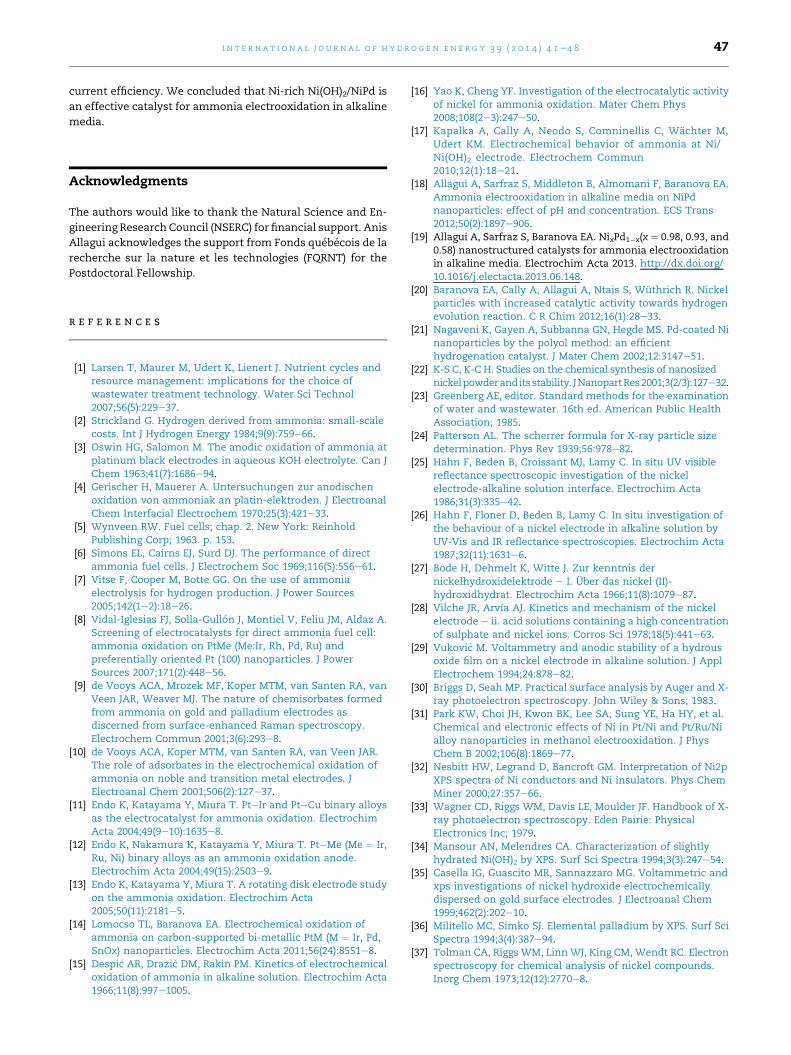
Fig. 6 e Cyclic voltammograms (100 mV sL1) of Ni(OH)2/NiPd pa
NH4NO3 from (a) 25e100 mM and (b) 100e350 mM, by steps of 2
which is formed at positive potentials in anodic scans [38]. The
rest of the study is on the treated materials, Ni(OH)2/NiPd.
To further elucidate the role of Ni(OH)2 in the ammonia
oxidation reaction, the effect of OH� ions concentration was
investigated. The adjustment of the pH was performed by
adding some mL-droplets from the 3 M NaOH solution so that
the dilution of the ammonia content remains negligible. From
Fig. 5, that shows the steady-state cyclic voltammograms of
Ni(OH)2/NiPd particles in 1 M NaNO3 þ 0.2 M NH4NO3 at pHs
varying from 8 to 12, it can be seen that the electrooxidation of
ammonia is strongly pH-dependent. At lower pH i.e. 6.0, 7.0
and 7.5 (not shown here), there is no measurable activity of
Ni(OH)2/NiPd for ammonia oxidation suggesting that the
alkaline environment is necessary for the completion of the
reaction. Starting from pH 8, there is a quasi-linear increase of
the current density of the ammonia oxidation peak up to pH
10.5. Because ammonia in aqueous solution at pH 8 accounts
for 7.5% in the form of free NH3, 45% at pH 9, and that goes up
to almost 90% at pH 10 [41], we conclude that it is the un-
ionized form of ammonia that is being electrooxidized on
Ni(OH)2/NiPd. The oxidation peak seems to completely over-
lap with the oxygen evolution reaction response and is not
clearly identified at pH 12 and higher.
Fig. 6 shows the 10th cycles of CVs recorded on Ni(OH)2/
NiPd particles with different concentrations of NH4NO3
ranging from 25 to 100 (Fig. 6(a)) and from 100 to 350 mM
(Fig. 6(a)) in 1 M NaNO3. The pH was set to 9 with 3 M NaOH
solution prior to each experiment. At low ammonia concen-
trations (25, 50 and 75 mM), the response of the Ni (II)/Ni (III)
redox process increases significantly with modest increase of
the current density in the ammonia electrooxidation region
that is seen as a shoulder at w1.25 V. As the ammonia con-
centration increases (� 150 mM), the current densities of the
Ni(OH)2/NiOOH pair of peaks significantly decreases, whereas
the ammonia oxidation peak maxima augment with the
concentration up to 300 mM and then reach a plateau at
2.45 mA cm�2 (Fig. 6(b)). The ratio of the current of the anodic
b
rticles in 1 M NaNO3 with increasing concentrations of
5 mM. The pH is set to 9 prior to each measurement.

Fig. 7 e Normalized concentration profile of NH4LN during
the electrolysis of ammonia at 20 mA cmL2 under
galvanostatic conditions on Ni(OH)2/NiPd in 1 M
NaNO3 D 0.2 M NH4NO3 at pH 10.5.
i n t e rn a t i o n a l j o u r n a l o f h y d r o g e n en e r g y 3 9 ( 2 0 1 4 ) 4 1e4 846
Ni(OH)2/NiOOH peak to the one of ammonia oxidation peak
decreases exponentially with the increase of NH4NO3 con-
centration from 0.94 at 100 mM to 0.05 at 400 mM.
In the recent work of Kapalka et al. [17] on ammonia
electrooxidation on bulk Ni wire, the authors have observed a
linear increase in the maximum current density of ammonia
oxidation with the increase of NH4ClO4 concentration from 10
to 150 mM. This was accompanied by continuous increase in
the current density corresponding to Ni(OH)2/NiOOH redox
process. Based on these observations, Kapalka et al. suggested
that ammonia oxidation on Ni(OH)2/Ni bulk electrode takes
place via a direct electron transfer mechanism from ammonia
to the anode [17]:
NiOOHþNH3/NiOOHðNH3Þads/NiOOHþ 12N2 þ 3Hþ þ 3e�
(3)
In the present work, similar behavior is observed at concen-
trations of NH4NO3 lower than 100 mM, suggesting that direct
electron transfer mechanism might be applicable. However,
as the concentration of ammonia increases (�150 mM), the
current density of Ni(OH)2/NiOOH redox couple start to
decrease significantly, possibly indicating a change in the re-
action mechanism from a direct electron transfer to an indi-
rect oxidation of ammonia which was earlier proposed for
organic compounds [42]:
NiOOHþNH3/NiðOHÞ2 þ Products (4)
The observed decrease in the cathodic peak with the increase
of ammonia concentration indicates that some NiOOH is
transformed to Ni(OH)2 (reaction 4) and ammonia oxidation
proceeds via this reduction process. This transition concen-
tration leading to the direct to indirect electron transfer
mechanism depends most probably on the ratio between the
mass of Ni(OH)2/NiPd materials vs. the ammonia concentra-
tion [19].
Ni(OH)2/NiPd electrode was subjected to a 9-h electrolysis
at 20 mA cm�2 in 1 M NaNO3 þ 0.2 M NH4NO3 at pH 10.5. Fig. 7
shows the recorded concentration profiles of NH4�N during
the electrooxidation process, normalized to the initial con-
centration. The concentration of total ammonia in the solu-
tion decreased bymore than 64% by the end of the experiment
with an average current efficiency of 38.7%. The ammonia
degradation for for the same quasi experimental conditions
with bulk Ni electrode (i ¼ 20 mA cm�2 during 9 h in 1 M
NaClO4 þ 50 mM NH4ClO4, pH 11) is reported to be 34% by
Kapalka et al. [17]. The initial kinetics of ammonia degradation
was studied based on the initial ratemethod in the first 40min
of reaction time. The concentration of nitrite in the solution
was negligible and the one of nitrate remained constant,
therefore, one can write:
�ddt
ðCNH4�NÞ��t¼0
¼ kðCNH4�NÞn (5)
with CNH4�N being the concentration of ammonia, k the reac-
tion rate constant and n the reaction order with respect to
ammonia degradation. In Fig. 7, the fit of the first three data
points results in a straight line with a slope approximatively
equal to one (n ¼ 1) indicating that the reaction follows first-
order kinetics. The initial rate constant was found to be
0.53 � 0.03 h�1. The change of slope after one hour of elec-
trolysis at which 32% of ammonia has been removed from the
initial 0.2 M NH4NO3 may be attributed to the change of
composition of the solution and also to the transition
(125e150 mM) from indirect (high concentrations) to direct
(low concentrations) mechanism pathways.
4. Conclusion
Ammonia electrooxidation on sub-100 nm NiPd nano-
structured catalyst with 98:2 at. % ratio is investigated in
NaNO3 solutions from pH 6e12. Ni(OH)2, being the active
phase for the studied reaction, was formed on NiPd materials
by 200 voltammetric cycles in alkaline pH. From the XPS
analysis results, the electrochemical treatment led to the
transformation of the metallic nickel in the as-synthesized
NiPd particles into higher oxidation state i.e. NiOOH. In the
presence of NH4NO3, the voltammograms showed the
appearance of an adjacent peak to the Ni (II)/Ni (III) redox
process at more positive potentials at w1.28 V vs. HgO/Hg,
which was assigned to the ammonia electrooxidation reac-
tion. The pH effect on the reaction showed that the current
density of ammonia oxidation peak increased significantly
with the increase of the solution pH reaching its optimal value
at pH 10.5. From the NH4NO3 concentration effect on the Ni
(II)/Ni (III) pair of peaks and the behavior of ammonia oxida-
tion peak we concluded with the following: (1) at concentra-
tions lower than 100 mM, the direct electron transfer is
supposed to be taking place, whereas (2) at higher concen-
trations it is the indirect electron transfer pathway that is
believed to occur. 20 mA cm�2 bulk electrolysis on Ni(OH)2/
NiPd nanocatalyst in 0.2 M NH4NO3 at pH 10.5 showed that
more than 64% of ammonia has been degraded at 38% average
i n t e r n a t i o n a l j o u rn a l o f h y d r o g e n en e r g y 3 9 ( 2 0 1 4 ) 4 1e4 8 47
current efficiency. We concluded that Ni-rich Ni(OH)2/NiPd is
an effective catalyst for ammonia electrooxidation in alkaline
media.
Acknowledgments
The authors would like to thank the Natural Science and En-
gineering Research Council (NSERC) for financial support. Anis
Allagui acknowledges the support from Fonds quebecois de la
recherche sur la nature et les technologies (FQRNT) for the
Postdoctoral Fellowship.
r e f e r e n c e s
[1] Larsen T, Maurer M, Udert K, Lienert J. Nutrient cycles andresource management: implications for the choice ofwastewater treatment technology. Water Sci Technol2007;56(5):229e37.
[2] Strickland G. Hydrogen derived from ammonia: small-scalecosts. Int J Hydrogen Energy 1984;9(9):759e66.
[3] Oswin HG, Salomon M. The anodic oxidation of ammonia atplatinum black electrodes in aqueous KOH electrolyte. Can JChem 1963;41(7):1686e94.
[4] Gerischer H, Mauerer A. Untersuchungen zur anodischenoxidation von ammoniak an platin-elektroden. J ElectroanalChem Interfacial Electrochem 1970;25(3):421e33.
[5] Wynveen RW. Fuel cells; chap. 2. New York: ReinholdPublishing Corp; 1963. p. 153.
[6] Simons EL, Cairns EJ, Surd DJ. The performance of directammonia fuel cells. J Electrochem Soc 1969;116(5):556e61.
[7] Vitse F, Cooper M, Botte GG. On the use of ammoniaelectrolysis for hydrogen production. J Power Sources2005;142(1e2):18e26.
[8] Vidal-Iglesias FJ, Solla-Gullon J, Montiel V, Feliu JM, Aldaz A.Screening of electrocatalysts for direct ammonia fuel cell:ammonia oxidation on PtMe (Me:Ir, Rh, Pd, Ru) andpreferentially oriented Pt (100) nanoparticles. J PowerSources 2007;171(2):448e56.
[9] de Vooys ACA, Mrozek MF, Koper MTM, van Santen RA, vanVeen JAR, Weaver MJ. The nature of chemisorbates formedfrom ammonia on gold and palladium electrodes asdiscerned from surface-enhanced Raman spectroscopy.Electrochem Commun 2001;3(6):293e8.
[10] de Vooys ACA, Koper MTM, van Santen RA, van Veen JAR.The role of adsorbates in the electrochemical oxidation ofammonia on noble and transition metal electrodes. JElectroanal Chem 2001;506(2):127e37.
[11] Endo K, Katayama Y, Miura T. PteIr and PteCu binary alloysas the electrocatalyst for ammonia oxidation. ElectrochimActa 2004;49(9e10):1635e8.
[12] Endo K, Nakamura K, Katayama Y, Miura T. Pt�Me (Me ¼ Ir,Ru, Ni) binary alloys as an ammonia oxidation anode.Electrochim Acta 2004;49(15):2503e9.
[13] Endo K, Katayama Y, Miura T. A rotating disk electrode studyon the ammonia oxidation. Electrochim Acta2005;50(11):2181e5.
[14] Lomocso TL, Baranova EA. Electrochemical oxidation ofammonia on carbon-supported bi-metallic PtM (M ¼ Ir, Pd,SnOx) nanoparticles. Electrochim Acta 2011;56(24):8551e8.
[15] Despi�c AR, Drazi�c DM, Rakin PM. Kinetics of electrochemicaloxidation of ammonia in alkaline solution. Electrochim Acta1966;11(8):997e1005.
[16] Yao K, Cheng YF. Investigation of the electrocatalytic activityof nickel for ammonia oxidation. Mater Chem Phys2008;108(2e3):247e50.
[17] Kapalka A, Cally A, Neodo S, Comninellis C, Wachter M,Udert KM. Electrochemical behavior of ammonia at Ni/Ni(OH)2 electrode. Electrochem Commun2010;12(1):18e21.
[18] Allagui A, Sarfraz S, Middleton B, Almomani F, Baranova EA.Ammonia electrooxidation in alkaline media on NiPdnanoparticles: effect of pH and concentration. ECS Trans2012;50(2):1897e906.
[19] Allagui A, Sarfraz S, Baranova EA. NixPd1�x(x ¼ 0.98, 0.93, and0.58) nanostructured catalysts for ammonia electrooxidationin alkaline media. Electrochim Acta 2013. http://dx.doi.org/10.1016/j.electacta.2013.06.148.
[20] Baranova EA, Cally A, Allagui A, Ntais S, Wuthrich R. Nickelparticles with increased catalytic activity towards hydrogenevolution reaction. C R Chim 2012;16(1):28e33.
[21] Nagaveni K, Gayen A, Subbanna GN, Hegde MS. Pd-coated Ninanoparticles by the polyol method: an efficienthydrogenation catalyst. J Mater Chem 2002;12:3147e51.
[22] K-S C, K-C H. Studies on the chemical synthesis of nanosizednickelpowderanditsstability. JNanopartRes2001;3(2/3):127e32.
[23] Greenberg AE, editor. Standard methods for the examinationof water and wastewater. 16th ed. American Public HealthAssociation; 1985.
[24] Patterson AL. The scherrer formula for X-ray particle sizedetermination. Phys Rev 1939;56:978e82.
[25] Hahn F, Beden B, Croissant MJ, Lamy C. In situ UV visiblereflectance spectroscopic investigation of the nickelelectrode-alkaline solution interface. Electrochim Acta1986;31(3):335e42.
[26] Hahn F, Floner D, Beden B, Lamy C. In situ investigation ofthe behaviour of a nickel electrode in alkaline solution byUV-Vis and IR reflectance spectroscopies. Electrochim Acta1987;32(11):1631e6.
[27] Bode H, Dehmelt K, Witte J. Zur kenntnis dernickelhydroxidelektrode e I. Uber das nickel (II)-hydroxidhydrat. Electrochim Acta 1966;11(8):1079e87.
[28] Vilche JR, Arvıa AJ. Kinetics and mechanism of the nickelelectrode e ii. acid solutions containing a high concentrationof sulphate and nickel ions. Corros Sci 1978;18(5):441e63.
[29] Vukovi�c M. Voltammetry and anodic stability of a hydrousoxide film on a nickel electrode in alkaline solution. J ApplElectrochem 1994;24:878e82.
[30] Briggs D, Seah MP. Practical surface analysis by Auger and X-ray photoelectron spectroscopy. John Wiley & Sons; 1983.
[31] Park KW, Choi JH, Kwon BK, Lee SA, Sung YE, Ha HY, et al.Chemical and electronic effects of Ni in Pt/Ni and Pt/Ru/Nialloy nanoparticles in methanol electrooxidation. J PhysChem B 2002;106(8):1869e77.
[32] Nesbitt HW, Legrand D, Bancroft GM. Interpretation of Ni2pXPS spectra of Ni conductors and Ni insulators. Phys ChemMiner 2000;27:357e66.
[33] Wagner CD, Riggs WM, Davis LE, Moulder JF. Handbook of X-ray photoelectron spectroscopy. Eden Pairie: PhysicalElectronics Inc; 1979.
[34] Mansour AN, Melendres CA. Characterization of slightlyhydrated Ni(OH)2 by XPS. Surf Sci Spectra 1994;3(3):247e54.
[35] Casella IG, Guascito MR, Sannazzaro MG. Voltammetric andxps investigations of nickel hydroxide electrochemicallydispersed on gold surface electrodes. J Electroanal Chem1999;462(2):202e10.
[36] Militello MC, Simko SJ. Elemental palladium by XPS. Surf SciSpectra 1994;3(4):387e94.
[37] Tolman CA, Riggs WM, LinnWJ, King CM, Wendt RC. Electronspectroscopy for chemical analysis of nickel compounds.Inorg Chem 1973;12(12):2770e8.

i n t e rn a t i o n a l j o u r n a l o f h y d r o g e n en e r g y 3 9 ( 2 0 1 4 ) 4 1e4 848
[38] Grde�n M, Czerwi�nski A. EQCM studies on PdeNi alloyoxidation in basic solution. J Solid State Electrochem2008;12:375e85.
[39] Taraszewska J, Roslonek G. Electrocatalytic oxidation ofmethanol on a glassy carbon electrode modified by nickelhydroxide formed by ex situ chemical precipitation. JElectroanal Chem 1994;364(1e2):209e13.
[40] Kim MS, Hwang TS, Kim KB. A study of the electrochemicalredox behavior of electrochemically precipitated nickel
hydroxides using electrochemical quartz crystalmicrobalance. J Electrochem Soc 1997;144(5):1537e43.
[41] Emerson K, Russo RC, Lund RE, Thurston RV. Aqueousammonia equilibrium calculations: effect of pH andtemperature. J Fish Res Board Can 1975;32(12):2379.
[42] Fleischmann M, Korinek K, Pletcher D. The oxidation oforganic compounds at a nickel anode in alkaline solution.J Electroanal Chem Interfacial Electrochem1971;31(1):39e49.