electrocardiogram in pulmonary embolism · the electrocardiogram in pulmonary embolism by robert h....
TRANSCRIPT
THE ELECTROCARDIOGRAM IN PULMONARY EMBOLISMBY
ROBERT H. CUTFORTH AND SAMUEL ORAM
From King's College Hospital
Received May 9, 1957
The importance of the electrocardiogram in the diagnosis of pulmonary embolism was firstdemonstrated by McGinn and White (1935) but general opinion still varies concerning the precisediagnostic value of this method of investigation. As recently as 1952 Newman stated that in only10-20 per cent of cases of pulmonary embolism is there a characteristic pattern and that electro--cardiographic examination is not a good method of making the diagnosis. By contrast, Phillipsand Levine (1950) are of the opinion that the diagnosis of pulmonary embolism can be made witha high degree of accuracy and, indeed, that the first clue to the diagnosis may often be found by thismethod.
The object of this paper is to analyse in detail the electrocardiograms of 50 undoubted cases ofpulmonary embolism and to compare these results with those of other workers in order to assessits value in making the diagnosis. In addition, an attempt is made to correlate the severity ofthe clinical picture with the electrocardiogram, and also to show how the presence or absence ofpulmonary infarction affects it.
MATERIAL AND METHOD OF SELECTIONThe material was obtained from the records of four hospitals. About a quarter of the cases
were seen personally by one of us within 24 hours of the time at which the embolism occurred. Allpatients had at least one 12-lead electrocardiogram (the three standard leads, the three unipolarlimb leads, and six chest leads, VI-6) taken after the embolism and in 25 instances serial recordswere obtained.
In a study of this kind there are two practical difficulties in obtaining suitable material. Thefirst is to obtain records from patients in whom there is no doubt whatsoever concerning the cer-tainty of the diagnosis. This is discussed below and our diagnostic criteria are given. The seconddifficulty is that those patients who die very soon after the onset of the embolism frequently do sobefore there is time for an electrocardiogram to be taken. In this series of 50 patients there are11 in whom the diagnosis was verified after death. The post-mortem examinations revealed thatthe coronary arteries were patent in all except Case 43, and this case is discussed separately.
Details of the 11 cases that came to autopsy can be seen in Table I.In addition to the autopsied cases we studied 83 other patients in whom a clinical diagnosis of
pulmonary embolism had been made but we discarded 44 of these because, in our opinion, theclinical picture was not certain enough to put the diagnosis beyond all doubt. The remaining39 patients were considered by us to be undoubted examples of pulmonary embolism, our criteriabeing as follows.
Twenty-one suffered a sudden attack of pleuritic pain followed in a few days by hrmoptysis.This attack occurred either within 14 days of a surgical operation or in the presence of a recentvenous thrombosis. In none of them did we find any cause other than pulmonary embolismthat could explain the clinical picture. In addition, every patient in this group had either
41
on March 10, 2020 by guest. P
rotected by copyright.http://heart.bm
j.com/
Br H
eart J: first published as 10.1136/hrt.20.1.41 on 1 January 1958. Dow
nloaded from

CUTFORTH AND ORAM
TABLE ISUMMARY OF FINDINGS IN PATIENTS AT NECROPSY
. EC. findingsCase Clinical findings Post-mortem findings Sur- TimeNo. vival of EC.
RBBB S1 Q3 T3 RVT* Other
40 F. 67. Sudden syncope R.L.L. infarct. Con- 13 12 RBBB - -_and fall in B.P. JVP+ gestive failure. Fe- days hours
moral thrombosis.
41 M. 50. Post-operative. Main P.A. blocked 1 8 S51 Q3 T3 RVT4 S-TSudden syncope and and multiple small day hours depr.fall in B.P. pulm. emboli.
42 M. 54. Chronic cor Massive infarction R. 5 2 RBBB SI Q3 T3pulmonale. Sudden lung. Multiple in- days dayssyncope and fall in farcts L. lung. Em-B.P. bolus in R.P.A.
43 M. 66. Myocardial in- Cardiac infarcts, old 4 2 - SI Q3 T3 - Arrhy-farct 2 years previ- and recent. Multi- days days thmiaously. Pleural pain ple recent pulmon- and 3 RBBBand haemoptysis one ary infarcts. Em- daysweek. Sudden syncope. boli in both P.A.
44 F. 58. Post-operative. Carcinoma sigmoid 23 5 _ RVT;Sudden syncope and colon and pelvic days days _ T3 RVT -fall in B.P. abscess. Two ab- 14
scesses in L.U.L. daysOrganizing embolus 21 T3 RVT -in artery to L.U.L. days
45 F. 68. After pneumo- Bilat. bronchopneu- 1 1 RBBB - RVT -nia. Sudden syncope, monia. Embolus hour hourfall in B.P., JVP++. impacted in R. and 30 20
L. P.A. min. min.
46 M. 52. Post-operative. Bilat. saphenous vein 2 12 RBBB SI Q3 T3 RVTI -Sudden dyspnoea. No thrombosis. Coiled days hourspain. JVP+. Triple clot in the L.P.A.rhythm.
47 F. 84. Diabetic pre- Multiple pulmonary 10 3 - SI T3 RVTi,coma. Sudden dys- emboli and throm- days dayspnoea and fall in B.P. bosis of both P.A.
48 F. 74. Venous throm- Embolus blocking bi- 13 1 - Sl T3 - S-Tbosis R. leg 14 days furcationofP.A. R. days day depr.previously. Sudden ext. iliac thrombo- 6 Less Lessdyspnoea and JVF+. phlebitis. days8 days later suddensyncope.
49 M. 51. Fract. fibula in Embolus blocking 1 6 RBBB SI Q3 T3 - -plaster 23 days pre- main P.A. day hoursviously. Sudden syn-cope, fall in B.P.,triple rhythm. JVP+.
50 F. 75. Sudden dyspnoea Firmly adherent em- 22 21 RBBB SI T3 - -2 weeks before admis- bolus in R.P.A. days dayssion. Triple rhythm.JVP+. I
* =Right ventricular T wave inversion.
42
on March 10, 2020 by guest. P
rotected by copyright.http://heart.bm
j.com/
Br H
eart J: first published as 10.1136/hrt.20.1.41 on 1 January 1958. Dow
nloaded from

ELECTROCARDIOGRAM IN PULMONARY EMBOLISM 43
abnormal physical signs in the chest or X-ray findings supporting the diagnosis of pulmonaryinfarction (Short, 1951).
Of the remaining 18, the pulmonary embolism occurred within 14 days of a surgicaloperation in 12 and in the presence of venous thrombosis in the legs in the other 6 patients. Cases23 to 28 suffered sudden attacks of pleuritic pain and were later found to have physical signs or anX-ray appearance suggestive of pulmonary infarction. Cases 29, 30, 31, 32, 35, and 39 sufferedattacks of syncope and were later found to have physical signs or X-ray signs suggestive ofpulmonary infarction. Cases 22 and 23 complained of a sudden gripping pain in the chest whichwas later followed by hemoptysis. Case 34 had a sudden attack of syncope which was laterfollowed by hamoptysis. Cases 36 and 37 had sudden attacks of syncope with a fall in bloodpressure and elevation of the jugular venous pressure. Case 38 complained of a gripping pain inthe chest which was rapidly followed by syncope with a fall in blood pressure.
Sex Distribution. The sex distribution was equal in this series, 25 men and 25 women.Age Incidence. The age distribution in 10-year periods was 15-24, 1; 25-34, 3; 35-44, 4;
45-54, 10; 55-64, 14; 65-74, 16; 75-84, 2. Although the average age was about 60 years or slightlyolder, the statement that pulmonary embolism is rare under 40 is not borne out, as seven were so.
Clinical Severity of the Cases. It is well recognized that while some patients with pulmonaryembolism may suffer severe disturbances of the circulation, giving rise to the classic picture ofacute cor pulmonale as described by White (1935), commonly associated with such obvious clinicalclues as dyspncea, cyanosis, pain in the chest, hemoptysis, and pyrexia, many patients, in fact, donot show these features. Barnes (1937) was the first to point out that the important clinical signsof pulmonay embolism are not cyanosis and dyspncea but shock, collapse, tachycardia, and a fallin blood pressure.
In order to discover whether there were any differences in the electrocardiographic findings inthe two clinical types, we divided our material into two groups according to the clinical findings.Cases were judged to be severe when there was syncope, fall in blood pressure, triple rhythm,elevation of the venous pressure, or any combination of these signs. Twenty-eight patients wereso classified, and in the remaining 22, which we have called the non-severe group, none of thesesigns was observed.
ELECTROCARDIOGRAPHIC FINDINGS IN PULMONARY EMBOLISMMcGinn and White (1935) described the electrocardiographic changes found in the standard
leads in seven cases of acute cor pulmonale resulting from pulmonary embolism. The changesthey described were (a) a prominent S wave and low origin of the T wave in standard lead I; (b) thegradual " staircase " ascent of the S-T segment in lead II; and (c) a Q wave and late inversion ofT in lead III. In two cases they also described the changes found in lead IV, a bipolar lead fromthe front and back of the chest.
Next, Barnes (1937) drew attention to the shift to the right in the electrical axis of the heart, andDurant et al. (1939) showed that transient right bundle-branch block patterns could result from thiscondition.
Wood (1941) found that the T wave became inverted in lead IVR and in certain other bipolarchest leads following pulmonary embolism, and it soon was clearly established that it is the T waverecorded from those prncordial electrodes facing the right ventricle that may be commonlyinverted. This is discussed later.
Since the introduction of the so-called unipolar leads, much attention has been paid by Wilson,Rosenbaum and Johnston (1947), Eliaser and Giansiracusa (1952) and Goldberger (1953) to thealteration of the electrical position of the heart. The commonest finding has been clockwiserotation of the heart about the long axis, and alteration of the electrical axis towards the verticalposition is only slightly less common.
The finding of a peaked P wave or " P pulmonale" was discussed by Katz (1946). Wood(1948) found it only occasionally in massive pulmonary embolism while Eliaser and Giansiracusa
on March 10, 2020 by guest. P
rotected by copyright.http://heart.bm
j.com/
Br H
eart J: first published as 10.1136/hrt.20.1.41 on 1 January 1958. Dow
nloaded from

CUTFORTH AND ORAM
TABLE IIELECTROCARDIOGRAPHIC ABNORMALMES OCCURRING IN PULMONARY EMBOLISM
Number NumberElectrocardiogram in 50 cases of classed
cases assevere
i. Sinus tachycardia .. .. .. .. .. .. .. .. .. 34 24ii. Alteration of electrical position (a) Vertical .. .. .. .. 33 23
(b) Clockwise rotation .. .. .. .. 30 20iii. S1 Q3 T3 pattern .. .. .. .. .. .. .. .. .. 14 11iv. SI T3 changes .. .. .. .. .. .. .. .. .. .. 4 3v. T3 inversion *. .. 9 7vi. QVF 10 6vii. T wave changed in VF 3... .. .. .. .. 0 17viii. S-T segment depression .. .. .. .. .. .. .. .. 9 8ix. Right ventricular T wave inversion .. .. .. .. 23 19x. Right bundle-branch block patterns .. .. .. .. 7 7xi. Alteration of cardiac rhythm .. .. .. .. .. .. .. .. 7 3xii. P wave abnormalities .. .. .. .. .. .. .. .. .. 6 4
(1952) regard it as a grave prognostic sign. The latter also describe the occurrence of auriculararrhythmias resulting from pulmonary embolism.
The difficulties encountered in distinguishing electrocardiographic patterns found in posteriormyocardial infarction from those resulting from pulmonary embolism have been discussed byBarnes (1937), Horn et al. (1939), Sokolow et al. (1940), Phillips and Levine (1950), and Goldberger(1953). This problem is considered below under differential diagnosis.
ANALYSIS OF THE ELECTROCARDIOGRAPHIC FINDINGS IN THIS SERIES OF CASESWe have found that there are 12 different electrocardiographic changes that may occur, either
singly or in combination, in cases of pulmonary embolism (see Table II). These 12 signs are aptto occur in particular combinations that give rise to 8 recognizable patterns, 3 of which arehighly diagnostic.
The 12 changes, their frequency and duration, are as follows:(i) Sinus Tachycardia. This is recognized as a frequent, if not invariable accompaniment of
pulmonary embolism (Fig. 1). The total number of patients showing a tachycardia of 90 aminute or more was 34. The true figure is undoubtedly higher, however, as several of the electro-cardiograms were taken many days after the embolism, and of 22 patients in whom it was takenwithin 48 hours of the embolism 19 showed a ventricular rate of 90 a minute or more. All these19 patients were in the severe group. Of the three patients with records taken within 48 hours butnot showing tachycardia, Case 46, which was also a severe case, showed a paroxysm of beats at150 a minute in one lead. In the other two patients (Cases 3 and 6) the electrocardiogramswere virtually normal and showed no evidence suggestive of pulmonary embolism. Both thesecases were in the non-severe group.
(ii) Alteration of the Electrical Position of the Heart. Both alteration of the electrical axis ofthe heart towards the vertical position and clockwise rotation of the heart about its long axis asviewed from below have frequently been reported in cases of pulmonary embolism. McGinn andWhite (1935) noted that none of their cases showed left axis deviation. Kuo and Vander Veer(1950) pointed out that alteration in the electrical axis may be an early and transient phenomenon.Phillips and Levine (1950) mention the importance of clockwise rotation and its value in differentialdiagnosis, and this point is also stressed by Goldberger (1953).
We have assumed the heart to lie in a vertical position when lead VL shows a QS or rS pattern,and in a horizontal position when VL shows a qR or QR pattern (Goldberger, 1953).
44
on March 10, 2020 by guest. P
rotected by copyright.http://heart.bm
j.com/
Br H
eart J: first published as 10.1136/hrt.20.1.41 on 1 January 1958. Dow
nloaded from

ELECTROCARDIOGRAM IN PULMONARY EMBOLISM
t
VR~~~~~V
7/10/55 .-
JrN.yN~~~~~~~~It
10/10/55
24/11/55
I
~VR FLV
~~~~~~~~~~~~~~~~~~~~V4VSV6
FIG. l.-Case 35. 7/10/55: Tachycardia (rate 150). Clockwise rotation, S-T segment
depression over the left ventricle, an SI Q3 T3 pattern, right ventricular T wave inversion,and prominent P waves. 10/10/55: Disappearance of the S-T segment depression, but
more obvious right ventricular T wave inversion. 24/11/55: Disappearance of the SIand the Q3, reversion of the T waves towards normal, a more horizontal position of the
heart, and disappearance of the prominent P waves. The T wave in lead III remains
inverted.
Of the 50 patients, 33 showed electrocardiographic evidence that the heart was in a vertical
position. Consideration of the two groups, severe and non-severe, showed that of the 28 severe
cases 23 had hearts in a vertical position: of the 5 patients in this group who did not show this
phenomenon, three were suffering from hypertension. In the 22 patients who comprised the non-
severe group, 10 had hearts in a vertical position: of the 12 patients in this group in whom the
heart was not vertical, four were suffering from hypertension and one from aortic valve disease.
Duration. Serial electrocardiograms were taken in 18 of the patients with vertical hearts and
thus the duration of the vertical position could be ascertained. In five of these the electrical axis
45
on March 10, 2020 by guest. P
rotected by copyright.http://heart.bm
j.com/
Br H
eart J: first published as 10.1136/hrt.20.1.41 on 1 January 1958. Dow
nloaded from
CUTFORTH AND ORAM
changed towards the horizontal position as the effects of the embolism wore off. These changestook place in times varying from 5 to 56 days with an average of 33 days (see Fig. 1). In theother 13 patients, the heart remained in a vertical position for an average of 34 days, the rangebeing from 2 to 120 days.
Clockwise rotation of the heart was diagnosed when the transitional zone, as shown by a complexin which the height of the R wave was equal to the depth of S, was shifted to the left of theV4 position. It was also diagnosed if a QR, Qr, or qR complex was present to lead VR (Gold-berger, 1949). Of the 50 patients 30 showed clockwise rotation; of these 20 were severe cases: 22patients showed a vertical axis combined with clockwise rotation and of these 16 were severe and6 non-severe.
Serial electrocardiograms were taken of 15 patients with clockwise rotation. In four of thesethe rotation disappeared, and in five others the rotation became less, in periods varying from2 to 120 days with an average of 29 days.
(iii) Abnormalities of SI Q3 T3; (iv) of SI T3; and (v) of T3. S1 Q3 T3 changes constitute theclassic appearances first described by McGinn and White (1935) but they occurred in only 14 ofour patients (see Fig. 1, 2, and 4). Eleven of these were severe and three were not so. In fourothers the cardiogram showed a conspicuous S wave in lead I and an inverted T wave in lead III,but no Q wave in this lead; three of these were severe. Nine patients, seven of them severe,showed an inverted T wave in lead III as the only significant finding in the standard leads.
It will be seen, therefore, that inversion of the T wave in lead III is a frequent finding in casesof pulmonary embolism, and a total of 27 patients showed this change, 21 of them being from thesevere group. The exact cause of inversion of the T wave in lead III is difficult to determine.In many cases it is probably a positional phenomenon and in this series, all but 5 of the 27patients with an inverted T wave in lead III, showed electrocardiographic evidence of a verticalposition of the heart together with clockwise rotation. An inverted T wave in lead III, whenpresent as an isolated finding, can have little diagnostic significance, but when combined withother changes it becomes of considerable importance. The relationship of these changes to thosefound in lead VF is discussed below.
Duration. The first of the S1 Q3 T3 changes to disappear was the deep S wave in lead I. Serialrecords were taken in 14 patients with this pattern. In 9 of these the SI had disappeared orbecome considerably smaller in periods varying from 5 to 42 days with an average of 17 days(see Fig. 1 and 2). In the remaining five cases the follow-up period was not long enough to enableany change to be demonstrated.
The Q wave in lead III is the next of the changes in the standard leads to revert to normal. In12 patients who had serial records taken, the Q waves disappeared or became considerably smallerin six, in periods varying from 2 to 48 days with an average of 21 days. In the remaining six theQ waves persisted, in one for as long as 68 days.
Of all the changes occurring in the standard leads in pulmonary embolism inversion of theT wave in lead III may be the most persistent. In 17 patients showing this feature of whom serialelectrocardiograms were taken, the T wave became upright in three of them after 6, 8, and 16 days,but in the remaining 14 patients the T wave in lead III was still negative after an average of38 days.
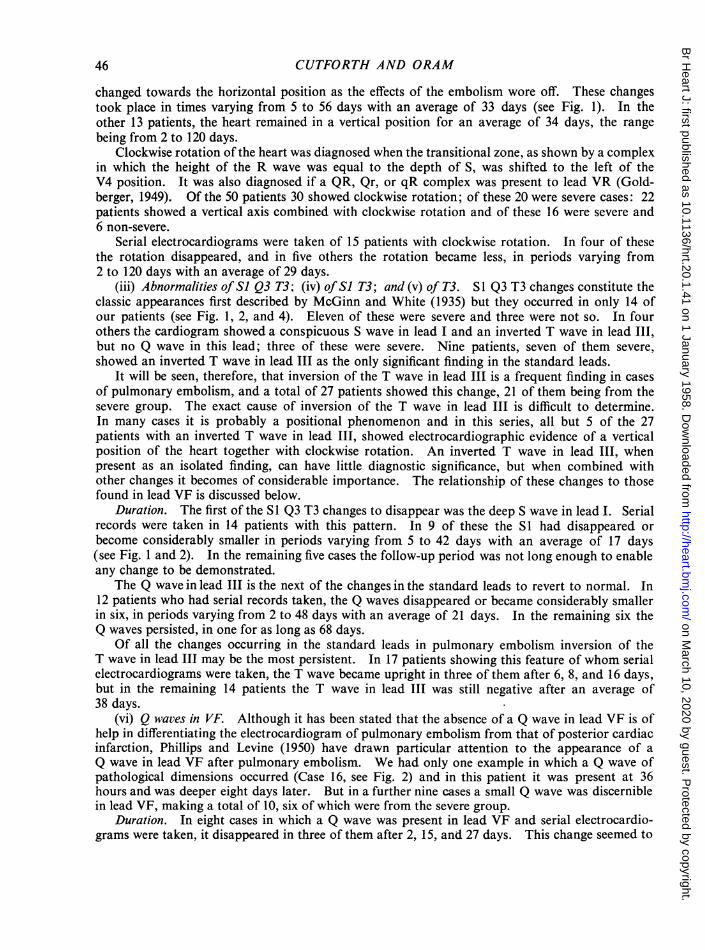
(vi) Q waves in VF. Although it has been stated that the absence of a Q wave in lead VF is ofhelp in differentiating the electrocardiogram of pulmonary embolism from that of posterior cardiacinfarction, Phillips and Levine (1950) have drawn particular attention to the appearance of aQ wave in lead VF after pulmonary embolism. We had only one example in which a Q wave ofpathological dimensions occurred (Case 16, see Fig. 2) and in this patient it was present at 36hours and was deeper eight days later. But in a further nine cases a small Q wave was discerniblein lead VF, making a total of 10, six of which were from the severe group.
Duration. In eight cases in which a Q wave was present in lead VF and serial electrocardio-grams were taken, it disappeared in three of them after 2, 15, and 27 days. This change seemed to
46
on March 10, 2020 by guest. P
rotected by copyright.http://heart.bm
j.com/
Br H
eart J: first published as 10.1136/hrt.20.1.41 on 1 January 1958. Dow
nloaded from
ELECTROCARDIOGRAM IN PULMONARY EMBOLISM
VL~~~VKvsnt#42=F *;. - II.4
. 3- V-4 VsStt'Yv
t 1; 1
'''.'Ii'i' lli il'i
t
wSlL_is_I ' I
_t.4. . J r.t -1...... 4._
vl 1 1::
FIG. 2.-Case 16. 8/9/55: An S1 Q3 T3 pattern. A small Q wave and an invertedT wave in lead VF. Right ventricular T wave inversion. 15/9/55: The S wavein leads I and VL has disappeared. The Q wave in lead VF is moreprominent and 004 sec. wide. 5/10/55: The Q3 has disappeared. The Twaves are now positive in VF and also in V4. 4/11/55: The curves are nownormal, only the flat T wave in lead lI remains.
.. ':i: :9.. _.... _
.'. '... ,...,..,.. .... ._ r r.vSS
8 9'55 1 --____
...,. ... X. 3n_
rl ::.f:9 m. .m
'.: t4
15J9, 55
5210,55
4 11i55
47
-.:,-114441TI jj-. FTTTTJ;T.-TTT--TjTI
NF VF ...:. -t-
on March 10, 2020 by guest. P
rotected by copyright.http://heart.bm
j.com/
Br H
eart J: first published as 10.1136/hrt.20.1.41 on 1 January 1958. Dow
nloaded from

CUTFORTH AND ORAM
be associated with the heart taking up a more horizontal position. In the remaining five, one ofwhich was followed up for 69 days, the Q waves persisted unaltered.
(vii) T wave in VI' Changes in the T wave in lead VF occurred in 23 patients. In 15 of thesethe T wave was negative, and in 8 of them it was flat. Seventeen of the 23 cases were in thesevere group. All those with a negative T wave in lead VF also showed a negative T wave inlead III. However, in four instances the T wave in lead III was negative while that in leadVF was positive in the initial cardiograms.
Duration. Surprisingly, and in contrast to the persistence of the inversion of the T wave inlead III, the inverted T wave in lead VF was one of the first signs to disappear. Of 15 patientswho had serial electrocardiograms and showed alteration of the T wave in lead VF, 13 showedthat the T wave had become positive in an average of 15 days (see Fig. 2 and 3). In the remain-ing two the T wave changes persisted for 18 and 24 days respectively.
(viii) S-T Segment Depression. Depression of the S-T segment in leads I and II was mentionedas a significant finding in the original paper of McGinn and White (1935). Other authors, amongthem Murnaghan et al. (1943), Zuckerman et al. (1950), and Laham and Gerbaux (1951) havesince pointed out that the S-T segment depression can also appear in lead VL and in those pre-cordial leads which face the left ventricle. Elevation of the S-T segment sometimes occurs inlead VR and, to a slight extent, in those prxcordial leads that face the right ventricle.
In our series, S-T segment depression was seen best in leads I, II, and VL, while S-T elevationwas most noticeable in lead VR. We found elevation of the S-T segment in praecordial leads overthe right ventricle to be unusual, and it was never of such a degree as to resemble the appearance ofan injury current.
Nine of our patients, eight of whom were from the severe group, had electrocardiograms showingS-T segment depression over the left ventricle (Fig. 1 and 4). However, one of them (Case 48)was a man of 74 with a blood pressure of 230/120 mm. Hg, and the depression of the S-T segmentpersisted unchanged for 13 days until his death; we think this depression was due to the effects ofhypertension rather than to the pulmonary embolus. In the other eight cases the depression of theS-T segment in left ventricular leads was an early finding (Table III).
Duration. Four of the nine patients died and therefore in these the duration of the depressionof the S-T segment could not be ascertained. In the remaining five the S-T segment depressionquickly disappeared, with an average duration of 9 days.
TABLE IIISHOWING TIME OF ONSET AND DISAPPEARANCE OF S-T SEGMENT DEPRESSION
ITimeCase between Leads showing StaircaseNo. embolism S-T depression ascent Follow-up
andEC.
45 1 hour I, II, VL Nil Died32 6 hours I, II, VL Present S-T depression gone in
19 days18 6 hours I, II Present S-T depression gone in
2 days35 8 hours I, II, VL Nil S-T depression gone in1 ~~~~~~~~~~~~3days41 8 hours I, 11, VL, V3-V6 Present Died12 2 days I, II, VL, V4-V6 Present S-T depression gone in
14 days43 2 days I, II, VL Nil Died28 3 days I, I1, VL Nil S-T depression gone in
7 days48 13 days I, II, VL, VF, V4-V6 Nil Died
48
on March 10, 2020 by guest. P
rotected by copyright.http://heart.bm
j.com/
Br H
eart J: first published as 10.1136/hrt.20.1.41 on 1 January 1958. Dow
nloaded from

ELECTROCARDIOGRAM IN PULMCIY4RY, EMBOLISM~~~~~~~~~~~~~~~~~~~~~.*-- .;'
27 7/54 1 1- .4:I. I VR . V,:..-.... .......... ........... .... ,,,,,,A.,~~~~~~~~~~~~~~~
_... ......;, ._...,..._V3 V-V6
- J. ! L 4. ,. .-
I~~~ ~~~~~~~~~~~~~~~~~~~~~~VF928 7,54 ,i;--- - . l 1- ':VR-,1VL : ;::.VF,;:,2x7,54i-- l - - ; 1 2 ^'-t ~~~~~~~~~~~~~~~~~~~~~...... .... .. j;,
29/7,54t ili
VI_29 V3454I-tsil;'..'6e'.111 JlG , , ,:.~~~~~~~~~~~VRR W<.- -V|.4,.-*,t
29/7/54 Lltlt'!fttt > '-ig 4
.... ,..VI V2
FIG. 3.-Case 38. 27/7/54: Tachycardia, a Q3 T3 pattern and a flat T wave inVF. 28/7/54: A vertical heart, an SI Q3 T3 pattern, a small Q wave and an
inverted T wave in VF, and flat T waves in the right przcordial leads.29/7/54: Inverted T waves in leads II, III, VF, and V1-V6. 2/9/54:Reversion of the above changes towards normal.
E
49
on March 10, 2020 by guest. P
rotected by copyright.http://heart.bm
j.com/
Br H
eart J: first published as 10.1136/hrt.20.1.41 on 1 January 1958. Dow
nloaded from

50 _CUT,F6RThAND ORAM
It is likely that S-T segment depression may be more frequent than our figures suggest since itappears to be an early and transient finding. The gradual " staircase ascent" of the depressedS-T segment in leads I and II described by McGinn and White (1935) does not seem to us to be avery helpful sign, and to decide whether a particular electrocardiogram shows this sign or not isboth difficult and unrewarding. Only four of our patients showed this pattern in an easily recog-nized form (Fig. 4).
12it 11* eR d S
FIG...X..X...'4-Case 41 Showing the staircase ascent ofthe S T.....
-- S----:#
4's.tl QX < 1i-w.
FIG.4.eCase 41. Showing the staircase ascent of the S-Tsegment, particularly in lead I, also in leads VL,V5, and V6.Also anS( Q3 T3patte(P, a negative T wave in VF, and rightventricular T wave inversion.
(ix) Right Ventricular T wave Inversion. Wood (1941) described 10 cases of pulmonary em-bolism in which leads IVR and bipolar leads from the left chest and right arm and the right chestand right arm were examined. He found that sharp inversion of the T wave occurred withoutappreciable displacement of the S-T segment. It has since been clearly established by Wood(1948), Myers et al. (1948), Phillips and Levine (1950), Laham and Gerbaux (1951), White (1951),Eliaser and Giansiracusa (1952), and Newman (1952) that in pulmonary embolism the T wave maybe inverted in those prxcordial leads that face the right ventricle.
In analysing our electrocardiographic findings we have disregarded T wave inversion in lead VIbecause it is so frequently a normal finding; it may be of significance, however, in those cases inwhich a record of VI taken before the embolism is available for comparison.
Of our 50 patients, 23 showed the T wave to be inverted in those precordial leads that facethe right ventricle (Fig. 1, 2, 3, and 4). Of these 23 cases 19 were severe. It was observed infour patients that the T wave inversion present in the electrocardiogram taken 24 hours after theembolism was deeper and more extensive two or three days later, though no fresh embolism hadoccurred (see Fig. 1 and 3). We have found that the T wave inversion seen in cases of pulmonaryembolism may affect leads VI and V2 only or may spread across the whole precordial range, wellbeyond the transitional point, but that the T wave becomes less deeply inverted as the electrode ismoved round towards the V6 position.
Duration. Serial electrocardiograms were taken of 13 patients with right ventricular T waveinversion. In eight of these the T wave changes gradually disappeared, starting first in the regionof V5 and V6 and spreading towards V1 (Fig. 1, 2, and 3). The time taken for the abnormalitiesto disappear varied from 16 to 120 days with an average of 41 days. Of the remaining fivepatients,'reversion of the T wave towards normal had started in three of them by the 10th, 24th,and 42nd day though it was not complete. The remaining two patients were followed only for16 and 18 days and no changes in the T wave took place during this time.
on March 10, 2020 by guest. P
rotected by copyright.http://heart.bm
j.com/
Br H
eart J: first published as 10.1136/hrt.20.1.41 on 1 January 1958. Dow
nloaded from

ELECTROCARDIOGRAM IN PULMONARY EMBOLISM
(x) Right Bundle-Branch Block. Durant et al. (1939) published an account of three cases inwhich right bundle-branch block was seen to be present during the first hour or two after theembolism and disappeared after about 12 hours. Wood (1948) found transient right bundle-branch block patterns in three of his twenty cases.
Seven of our patients showed right bundle-branch block. It is noteworthy that these sevenwere not only classed as severe from the clinical point of view but that all of them died.Further details of these are shown in Table I (Cases 40, 42, 43, 45, 46, 49, and 50). The electro-cardiograms of these patients had all been taken less than two days after the embolism, with theexception of Case 50 where the interval was 21 days. In Case 42 the patient was suffering fromchronic cor pulmonale and could possibly have had the bundle-branch block before the embolismtook place, but we have no evidence on this point. In Case 43 we know that bundle-branch blockwas not present in a cardiogram taken five months before the embolism occurred.
Duration. Serial electrocardiograms were obtained in only one patient of this group (Case 43)and in that instance they gave no information about the duration of the bundle-branch blockbecause the changes only became obvious in the second one. The time intervals between theoccurrence of the embolism and the taking of the electrocardiogram in our seven cases areas follows: Case 45, 1 hour; Cases 40 and 46, 12 hours; Cases 43 and 49, 24 hours; Case 42,2 days; and Case 50, 22 days. Durant et al. (1939) were of the opinion that right bundle-branchblock changes were an early finding and a transient one, but Case 50 in our series showed rightbundle-branch block to be present 22 days after the embolism.
(xi) Alteration in Cardiac Rhythm. Murnaghan et al. (1943) found auricular fibrillation in fourand auricular flutter in two out of a total of 92 examples of pulmonary embolism. Fliaser andGiansiracusa (1952) found auricular arrhythmia as a delayed phenomenon in three out of eightcases. Zuckerman et al. (1950) have described the production of auricular arrhythmias andA-V block of various degrees in experiments on dogs. On the other hand Newman (1952) isof the opinion that the sudden onset of sinus rhythm in a patient previously fibrillating is a signsuggesting pulmonary embolism, but we have not encountered such a case.
Seven of our 50 patients showed abnormalities of cardiac rhythm and six different types ofrhythm were found.
Case 5 (non-severe) was a man of 68 years with hypertension (blood pressure 170/120 mm. Hg).Five days after the embolism the electrocardiogram showed partial heart block with a P-R intervalof 0 24 sec. In Case 9 (non-severe) auricular fibrillation was present 24 hours after the embolism.Two days later another electrocardiogram showed sinus rhythm; a negative T3 and a flat TVFwere the only remaining signs suggestive of pulmonary embolism. Case 11 (non-severe) showedauricular premature contractions three days after the embolism, but there was no other electro-cardiographic abnormality. Case 15 (non-severe) showed auricular fibrillation two days after theembolism; two days later sinus rhythm was present and there were no other signs of pulmonaryembolism on the electrocardiogram. Case 17 (severe) showed auricular flutter with an irregularventricular response; the rhythm changed to auricular fibrillation at 12 days, back to auricularflutter at 15 days, to fibrillation once more at 21 days, and finally reverted to sinus rhythm 26 daysafter the embolism: the only other electrocardiographic signs of pulmonary embolism were atiny Q wave in VF together with a flat T wave in that lead and in lead III. Case 29 (severe) 12 hoursafter the embolism showed multiple ventricular extrasystoles which had disappeared ten days later.Case 46 (severe) showed right bundle-branch block 12 hours after the embolism: the rate was85 a minute except in lead V3 where a short bout of rapid beating was recorded, and auricularactivity was not discernible in the prncordial leads so the mechanism of the arrhythmia was notobvious. This patient died three days after the embolism.
(xii) Abnormalities of the P Wave. It is considered unusual to find any alteration of the P wavein pulmonary embolism. Wood (1948) found it occasionally in massive pulmonary embolism andZuckerman et al. (1950) mention right auricular dilatation as a late finding in experimental animalsbut they had no example in their clinical cases. Laham and Gerbaux (1951) found no P wave
51
on March 10, 2020 by guest. P
rotected by copyright.http://heart.bm
j.com/
Br H
eart J: first published as 10.1136/hrt.20.1.41 on 1 January 1958. Dow
nloaded from

CUTFORTH AND ORAM
abnormalities in 57 cases of pulmonary embolism. However, Eliaser and Giansiracusa (1952)found " P pulmonale " as a late manifestation in three out of eight cases.
Seven of our 50 patients showed abnormal P waves but one of these (Case 7) was suffering frommitral stenosis and had the typical wide bifid P waves associated with this condition, leaving sixwho showed alteration of the P pulmonale type for which no reason other than pulmonaryembolism could be found. The typical appearance was seen best in lead II in five of the six casesand four out of the six were severe (Cases 33, 35, 43, and 47).
Case 5 has been mentioned above in the section on alterations of rhythm. In addition to partialheart block and S-T segment depression the electrocardiogram showed tall and spiked P waves,particularly in lead II. The record was taken five days after a pulmonary embolism.A record taken nine days after the embolism in Case 22 showed an S1 T3 pattern, a negative
T wave in lead VF, and right ventricular T wave inversion: the P waves were tall and spiked inleads II, III, and VF. A second cardiogram was not taken until 120 days later: this showedthe P waves to be normal, a negative T wave in lead III being the only remaining abnormality.
Case 33 gave a history suggesting two pulmonary emboli at an interval of one week. In therecord taken one day after the second embolism the spiked P waves were seen best in lead II, andQ3 T3 and TVF changes were present. The next record taken 33 days later no longer showed anyP wave abnormality.
The electrocardiogram in Case 35 was taken eight hours after the pulmonary embolism: inaddition to S1 Q3 T3 changes, S-T segment depression and right ventricular T wave inversion, theP waves were seen to be tall and spiked in leads II and VF. A second record taken three daysafter the embolism showed no change in this feature but the electrocardiogram taken 47 days afterthe embolism showed the P waves had returned to normal (Fig. 1).
In Case 43 a tracing taken two days after the embolism showed no abnormality of the P waves,but a record taken the next day showed them to be typically tall and spiked and seen best in leads VIand V2. At autopsy multiple pulmonary emboli were present together with myocardial infarction.
In Case 47 the electrocardiogram taken three days after the embolism showed tall spikedP waves, best seen in lead II; an S1 T3 pattern with right ventricular T wave inversion was alsopresent. The patient died ten days after the embolism and multiple emboli were found at necropsy.
PATIENTS SHOWING No ELECTROCARDIOGRAPHIC EVIDENCE OF PULMONARY EMBOLISMIn our series of 50 cases only 12 had electrocardiograms that showed nothing diagnostic or
even suggestive of pulmonary embolism. The remaining 38 all showed electrocardiographicevidence which confirmed the diagnosis. Murnaghan et al. (1943) give figures indicating thatabout half their cases showed no electrocardiographic evidence of the diagnosis. Carlotti et al.(1947) found no electrocardiographic evidence of acute cor pulmonale in four-fifths of the casesso examined. Laham and Gerbaux (1951) found no suggestive electrocardiographic changes in58 per cent of 57 cases.A comparison of the severe and non-severe groups revealed that only one patient of the 28 in
the severe group failed to show electrocardiographic evidence of pulmonary embolism, while on theother hand, 11 out of the 22 in the non-severe group showed no such signs.
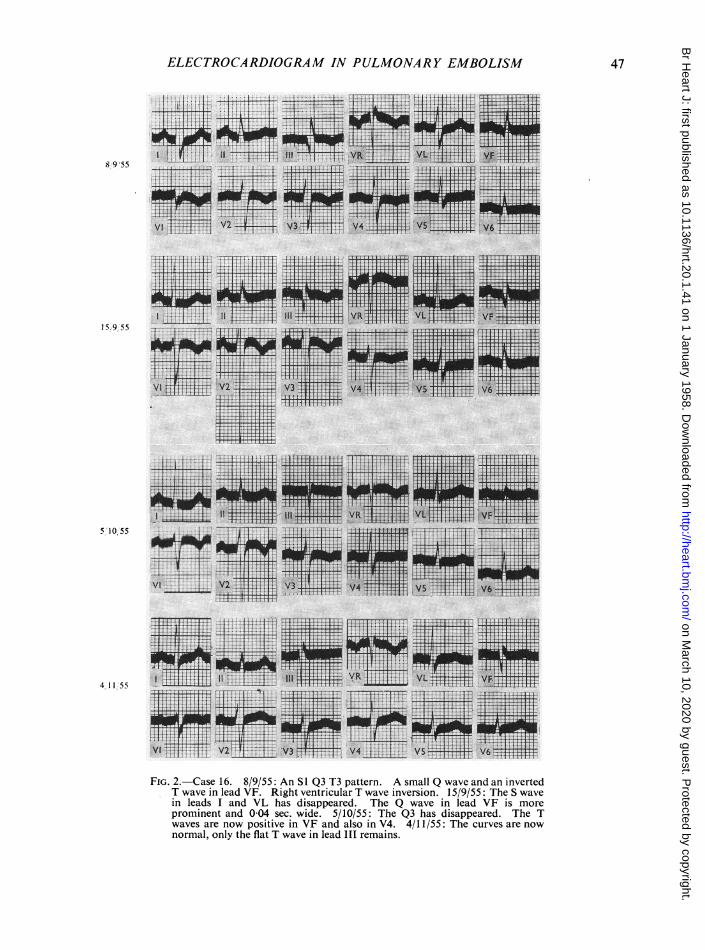
The one severe example (Case 31) showing no evidence of pulmonary embolism was a woman of59 years who had undergone a Wertheim hysterectomy 14 days before the embolism took place.She collapsed whilst at stool and was found to be distressed, dyspnceic, and cyanosed. Thrombosisof the right saphenous vein was discovered, and a little later a pleural rub developed at the baseof the right lung. An X-ray of the chest taken the next day showed the appearance of a recentpulmonary infarct in the right lower lobe. The electrocardiogram taken the same day (Fig. 5)showed poor voltage curves but the tracing was not diagnostic or even suggestive of pulmonaryembolism.
52
on March 10, 2020 by guest. P
rotected by copyright.http://heart.bm
j.com/
Br H
eart J: first published as 10.1136/hrt.20.1.41 on 1 January 1958. Dow
nloaded from
ELECTROCARDIOGRAM IN PULMONARY EMBOLISM
FIG. 5.-Case 31. From a severe case of pulmonary embolism. This tracing was taken twodays after the embolism (see text).
PULMONARY EMBOLISM ASSOCIATED WITH MYOCARDIAL INFARCTIONPhillips and Levine (1950) describe a patient (their Case 6) with evidence of old posterior
myocardial infarction, who suffered a pulmonary embolism and whose electrocardiogram showedevidence of both conditions. Newman (1952) mentions five cases in which antecedent myocardialinfarction distorted the electrocardiographic pattern of pulmonary embolism and made it un-recognizable. Goldberger (1953) states that if pulmonary embolism occurs after myocardialinfarction the tracing continues to show only the pattern of the myocardial infarct. In view of thedifficulty sometimes encountered at the bedside in differentiating cardiac infarction from pulmonaryembolism, the electrocardiographic appearances when both lesions are present are of more thanacademic importance. In one of our cases, with autopsy confirmation, the cardiographicevidence of the myocardial infarct was completely masked by that of pulmonary embolism and webelieve this to be an unusual finding.A man of 66 (Case 43) was admitted to hospital in 1952 because of anterior myocardial infarc-
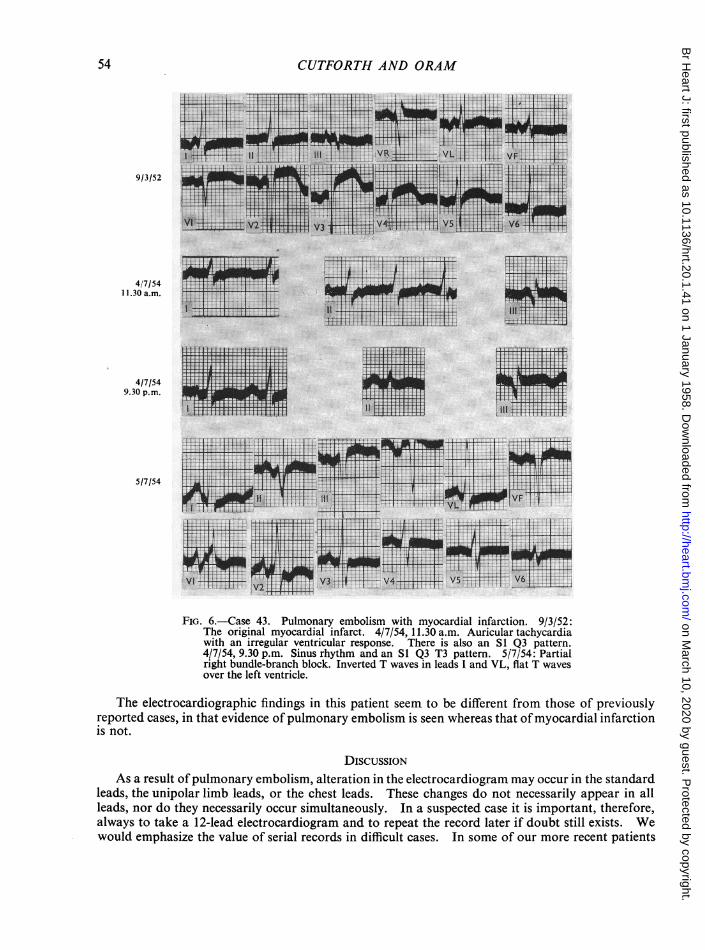
tion, from which he made a good recovery (Fig. 6, record of 9/3/52). In 1954, during the courseof one week he became increasingly short of breath, had a number of haemoptyses, and was admittedto hospital again. A few hours after his admission he collapsed and became comatose with a pulserate of 120 a minute, a raised venous pressure, triple rhythm, and diminished breath sounds overthe left lower lobe.
On 4/7/54, two days after admission to hospital, the standard leads only were recorded at11.30 a.m. These tracings showed an auricular rate of 200 a minute with a variable ventricularresponse of about 150 a minute; there was also an S1 Q3 appearance with some elevation of theS-T segment in lead III. The standard leads were recorded again at 9.30 p.m. on the same dayand these tracings showed sinus rhythm at a rate of 100 a minute; the elevation of the S-Tsegment in lead III was no longer obvious and an S1 Q3 T3 pattern had developed. On the follow-ing day a 12-lead electrocardiogram was taken and in this tracing the S1 Q3 T3 pattern had dis-appeared, the P waves were tall and bifid in leads I, VI, and V2, and partial right bundle-branchblock was visible in leads VI and V2; all the T waves were of poor voltage except those in VLwhich were negative. He died the following day and autopsy showed multiple recent infarcts inthe left lower lobe and also in the right lung. There was also evidence of both old and recentmyocardial infarction in the lower part of the anterior wall and the apex of the left ventricle.
Comment. The S1 Q3 T3 appearance in the standard leads on 4/7/54 was considered virtuallydiagnostic of pulmonary embolism. In the record of 5/7/54 the standard leads looked entirelydifferent and apart from the sudden alteration of the shape of the P wave they did not suggestpulmonary embolism; in leads VI and V2, however, the presence of a partial right bundle-branchblock pattern with a QRS interval of 0-12 sec. supported this diagnosis. There was no electro-cardiographic evidence of recent or old myocardial infarction but the flat or negative T waves overthe left ventricle suggested that the myocardium in this situation was not normal.
53
on March 10, 2020 by guest. P
rotected by copyright.http://heart.bm
j.com/
Br H
eart J: first published as 10.1136/hrt.20.1.41 on 1 January 1958. Dow
nloaded from
CUTFORTH AND ORAM
9!3/52
4/7/541 1.30 a.m.
4/7/549.30 p.m.
5/7/54
II,ti
tjIm
FIG. 6.-Case 43. Pulmonary embolism with myocardial infarction. 9/3/52:The original myocardial infarct. 4/7/54, 11.30 a.m. Auricular tachycardiawith an irregular ventricular response. There is also an S1 Q3 pattern.4/7/54, 9.30 p.m. Sinus rhythm and an S1 Q3 T3 pattern. 5/7/54: Partialright bundle-branch block. Inverted T waves in leads I and VL, flat T wavesover the left ventricle.
The electrocardiographic findings in this patient seem to be different from those of previouslyreported cases, in that evidence of pulmonary embolism is seen whereas that ofmyocardial infarctionis not.
DISCUSSIONAs a result ofpulmonary embolism, alteration in the electrocardiogram may occur in the standard
leads, the unipolar limb leads, or the chest leads. These changes do not necessarily appear in allleads, nor do they necessarily occur simultaneously. In a suspected case it is important, therefore,always to take a 12-lead electrocardiogram and to repeat the record later if doubt still exists. Wewould emphasize the value of serial records in difficult cases. In some of our more recent patients
54
on March 10, 2020 by guest. P
rotected by copyright.http://heart.bm
j.com/
Br H
eart J: first published as 10.1136/hrt.20.1.41 on 1 January 1958. Dow
nloaded from

ELECTROCARDIOGRAM IN PULMONARY EMBOLISM
we recorded leads V3R and V4R to see if they gave any further information, but so far we havenot found these leads to be of great value except that sometimes they gave a clearer indication ofright bundle-branch block.
Common Diagnostic Patterns. The 12 electrocardiographic changes that we have describedmay occur separately or combined together in various ways. When they occur alone they may beof little help in diagnosis, but when one compares the various combinations of abnormal patternswith the clinical and autopsy findings, eight recognizable different appearances can be distinguished.We have arranged these patterns in order of their diagnostic reliability (Table IV), and the firstthree we consider to be diagnostic of pulmonary embolism.
TABLE IVTHE EIGHT ELECTROCARDIOGRAPHIC PATTERNS COMMONLY FOUND IN PULMONARY EMBOLISM, IN ORDER OF
DIAGNOSTIC RELIABILITY *
Number Number NumberPattern in electrocardiogram of that were ofcases severe deaths
I.SI Q3 T3 plus right ventricular T wave inversion .. .. .. 9 7 22. S1 T3 or T3 plus right ventricular T wave inversion .. .. 9 8 13. S1 Q3 T3 plus right bundle-branch block .. .. .. 33 3 34. Right ventricular T wave inversion alone .. .. .. 33 2 05. S1 Q3 T3 alone .. .. .. .. .. .. .. .. 2 2 06. Right bundle-branch block alone .. .. .. .. 4 4 47. S1 T3 or T3 with or without T changes in VF .. .. .. 4 2 18. Sinus tachycardia, vertical heart, clockwise rotation alone .. 1 1 0
* To any of the above patterns may be added P pulmonale, depression of the S-T segment in leads over the leftventricle, and various arrhythmias (see text).
Patterns Typical of Pulmonary Embolism1. SI Q3 T3 plus Right Ventricular T wave Inversion. This pattern was the most common and
also the most reliable indication of pulmonary embolism (Fig. 1, 2, 3, and 4). To the best of ourknowledge such a pattern does not occur in any other condition. It was seen in nine cases, sevenof which were severe.
2. SI T3, or T3 Changes, plus Right Ventricular T Wave Inversion. This pattern was equallycommon, and taken in conjunction with the clinical picture is virtually diagnostic. It occurred innine cases, eight of which were severe.
3. SI Q3 T3 plus Right Bundle-Branch Block. Three of the patients with right bundle-branchblock also showed an S1 Q3 T3 appearance, all of them were severe cases and died. This com-bination we also consider to be diagnostic of pulmonary embolism.
Patterns Suggestive of Pulmonary Embolism1. Right Ventricular T wave Inversion Alone. This pattern occurred in three cases, two of
which were severe. Although the change is not in itself a specific one, we have found it of help indiagnosis since the other conditions giving rise to it are not likely to be confused with pulmonaryembolism with the possible exception of antero-septal cardiac infarction. The differences in thatcondition are discussed below in the section on differential diagnosis.
2. SI Q3 T3 Pattern Alone. Although this well-known pattern may indicate pulmonaryembolism it is not so reliable a diagnostic sign as any of the previous four patterns. It occurred intwo patients, both severely ill. At times, posterior cardiac infarction may be accompanied by adeep S wave in lead I, although this is uncommon, but when such a wave is present the appearancemay be indistinguishable from that due to pulmonary embolism.
3. Right Bundle-Branch Block Alone. The diagnostic value of this pattern is difficult to assess.
55
on March 10, 2020 by guest. P
rotected by copyright.http://heart.bm
j.com/
Br H
eart J: first published as 10.1136/hrt.20.1.41 on 1 January 1958. Dow
nloaded from

CUTFORTH AND ORAM
Right bundle-branch block unaccompanied by any other electrocardiographic evidence of pul-monary embolism was present in four of our cases, all of which were severe. It may occur, ofcourse, in other conditions that give rise to strain on the right ventricle, and for this reason recordsshowing this pattern should be interpreted only in relation to the history and physical signs. Serialtracings may help because other electrocardiographic signs more typical of pulmonary embolismare apt to appear in subsequent records.
4. SI T3 or T3 Changes Alone. Although this pattern occurs in pulmonary embolism (fourcases) it may so frequently be present for other reasons that it cannot be considered of much con-firmatory value. Simultaneous inversion of the T wave in lead VF is common to this pattern.
5. Sinus Tachycardia, Clockwise Rotation, Vertical Heart. This pattern was frequent and allthree features occurred in 22 of 50 patients, but it was usually combined with other changes, andas an isolated finding occurred in only one patient. By itself it is often a normal finding, butthere is one occasion on which it is of help as a diagnostic sign, namely when it appears suddenlyin a patient whose previous electrocardiogram showed a different pattern.
To any of the above patterns may be added the typical tall, spiked P pulmonale, usuallybest seen in standard lead II, but as mentioned previously this abnormal P wave is often of veryshort duration and was present in the records of only 6 of 50 patients. Nevertheless, whenpresent it greatly strengthens the diagnosis, particularly if it is a transient finding. Similarly,depression of the S-T segment in leads over the left ventricle may accompany any of the abovepatterns, and in eight out of nine of the patients showing this sign the illness was severe.
Although alteration of rhythm occurred in seven patients, the various arrhythmias producedare not characteristic of pulmonary embolism.
DIFFERENTIAL DIAGNOSISAs we have shown, some of the electrocardiographic patterns seen in pulmonary embolism are
diagnostic, but some are difficult to distinguish from those seen in other conditions. It should beemphasized that the diagnosis is primarily a clinical matter and that the electrocardiogram shouldbe looked upon as an aid to the history and physical signs. Unlike the high degree of accuracyshown by electrocardiography in the diagnosis of myocardial infarction, in pulmonary embolismone can expect equivocal findings more often than not. Even so, it is our opinion that moreassistance can be obtained from electrocardiography in the diagnosis of pulmonary embolism thanis currently believed.
The electrocardiogram in chronic cor pulmonale is possibly the most likely to simulate thatof pulmonary embolism. It may show right ventricular T wave inversion and an S1 T3 patterntogether with a vertical heart and clockwise rotation. On clinical grounds, however, it is usuallyeasy to distinguish this type of case from pulmonary embolism, but the occurrence of pleuritic painand hemoptysis in a patient with chronic bronchitis and emphysema may present a difficult problem,and for that matter such patients, if bedridden, may suffer embolic pulmonary infarction. Thereare two electrocardiographic points of difference between chronic cor pulmonale and pulmonaryembolism. The first is that many cases of pulmonary heart disease show a tall spiked P wave asa permanent feature in the electrocardiogram. Wood (1948) found this in 85 per cent of 100 cases.On the other hand, the finding of these abnormal P waves is rare (6 out of 50 of our cases) andalso of much shorter duration in pulmonary embolism. The second is the concomitant finding ofright ventricular hypertrophy in chronic cor pulmonale; this is not seen in uncomplicated pulmonaryembolism.
Antero-septal myocardial infarction is sometimes diagnosed in error when in fact pulmonaryembolism is present. In our view this difficulty has not been sufficiently emphasized. In antero-septal infarction the presence in the precordial leads of an injury current or of abnormal Q waveswill clarify the diagnosis in the majority of cases because neither of these signs occurs in pulmonaryembolism. In pulmonary embolism the T wave inversion is usually deepest in leads VI and V2,becoming progressively less towards V6, whereas gradual lessening of the inversion of the T wave
56
on March 10, 2020 by guest. P
rotected by copyright.http://heart.bm
j.com/
Br H
eart J: first published as 10.1136/hrt.20.1.41 on 1 January 1958. Dow
nloaded from

ELECTROCARDIOGRAM IN PULMONARY EMBOLISM
from leads VI to V5 is not necessarily a feature of anteroseptal infarction. The SI Q3 T3 patternfound in pulmonary embolism is not a feature of anteroseptal infarction, though clockwise rotationmay occur in the latter condition. Serial electrocardiograms will show the two maladies to pro-gress in different ways.
In differentiating posterior myocardial infarction from pulmonary embolism the significance ofa Q wave in association with an inverted T wave in leads III and VF has been the subject of con-siderable discussion. Phillips and Levine (1950) illustrated these difficulties with one of their casesand Newman (1952) drew up a list of differences between the electrocardiographic findings inpulmonary embolism and posterior myocardial infarction. In our series we have not encounteredmuch difficulty, and although ten cases showed a Q wave in lead VF, in only one was it ofpathological dimensions (Case 16, see Fig. 2). Phillips and Levine (1950) found a conspicuousQ in VF in two of their eight cases. Their cardiograms were taken a few hours after theembolism whereas some of ours were taken considerably later (Table V). If the heart is in avertical position and clockwise rotation together with forward rotation of the apex is present, wedo not think that the appearance of even a deep Q wave in lead VF is unexpected in pulmonaryembolism. In such instances the QR and downward T in lead VF will be accompanied by an RSin lead VL and a QR in lead VR.
TABLE V
TIME INTERVAL BETWEEN THE EMBOLISM AND FIRST ELECTROCARDIOGRAM AND THE NUMBER OF CASES WITHPOSITIVE OR NEGATIVE ELECTROCARDIOGRAPHIC FINDINGS
Time between No. of cases No. of casesembolism and with positive with negative
first EC. findings findings
12 hours or less 7 024 hours 7 22 days 7 13 days 4 34 days I 05 days 4 26 days 3 07 days 0 1More than 7 days 5 3
We find that the most important point in the diagnosis is the presence of an injury current inleads III and VF in many cases of posterior infarction, such an appearance never being found inpulmonary embolism. Also, in uncomplicated posterior infarction the T waves in the pracordialleads may be tall but they are never inverted, whereas in pulmonary embolism the prxcordialT waves may be normal, flat or inverted, but not tall. Goldberger (1953) states that the clockwiserotation of the heart. common in pulmonary embolism, is unusual in posterior infarction unlessanterior infarction is also present.
The right ventricular strain pattern from any cause shows T waves indistinguishable from thoseseen in pulmonary embolism. Transient changes can occur in rheumatic carditis, diphtheria, andpneumonia. Phillips and Levine (1950, their Case 7) described similar appearances due to massivecollapse of the lungs, though the T wave inversion was only obvious in lead VI. In normal infantsor children the T waves may be inverted in those precordial leads that face the right ventricle(Zeigler, 1951). Pulmonary embolism occurring in a young child might well present a confusingelectrocardiographic appearance, but we have not encountered such a case. Goldberger (1953)published tracings of a normal adult showing right ventricular T wave inversion with a " juvenileT wave pattern".
57
on March 10, 2020 by guest. P
rotected by copyright.http://heart.bm
j.com/
Br H
eart J: first published as 10.1136/hrt.20.1.41 on 1 January 1958. Dow
nloaded from

CUTFORTH AND ORAM
COMPARISON OF SEVERE AND NON-SEVERE GROUPSIn the group of 28 patients that we have called severe, significant electrocardiographic findings.
were far more frequent than in the non-severe cases. No fewer than 27 of them showed evidenceof pulmonary embolism in the electrocardiogram. In the same group there were 19 examples ofright ventricular T wave inversion and 11 examples of the complete McGinn and White (1935)pattern. All seven examples of right bundle-branch block, either alone or accompanied by theS1 Q3 T3 appearance, were also from the severe group.
In the 22 patients belonging to the non-severe group the figures were very different. Only11 showed any evidence of pulmonary embolism in the electrocardiogram. Among these eleventhere were four examples of right ventricular T wave inversion and three of the complete McGinnand White pattern: there were no instances of bundle-branch block (Tables II and VI).
TABLE VIA COMPARISON OF THE FINDINGS IN THE SEVERE AND NON-SEVERE GROUPS
Electro- IVTwv SIQ 3Rhythmcardiographic RV T wave pS Q3 T3 RBBB alterationschanges inversion pattern
Positive Negative Present Absent Present Absent Present Absent Present Absent
Severe .. .. 27 1 19 9 11 17 7 21 3 25Non-severe .I. II 1 4 18 3 19 - 22 4 18
Of the 22 non-severe cases it was noteworthy that 18 had pleuritic pain followed by hemoptysis.Such syndromes do not generally present diagnostic difficulties; this is fortunate because in ourseries electrocardiography yielded no information in one-half of them. It is in the clinicallyless obvious combinations of sudden dyspncea, fall in blood pressure, or syncope that electro-cardiography may be of considerable value. In them positive electrocardiographic evidence ofpulmonary embolism was found in 27 of 28 cases (Table VI).
THE RELATIONSHIP OF PULMONARY INFARCTION TO THE ELECTROCARDIOGRAPHIC FINDINGSLittle attention has been paid to the presence or absence of pulmonary infarction in relation to
the electrocardiographic pattern in pulmonary embolism. Sokolow et al. (1940) and Laham andGerbaux (1951) could not demonstrate any correlation. We have found that there is a roughrelationship between the presence of pulmonary infarction and the electrocardiographic findings,but the inherent difficulties in deciding upon the presence or absence of pulmonary infarctionmakes accurate correlation difficult. Of our 11 patients coming to necropsy, five had pulmonaryinfarction and six did not. In the others we have relied on the X-ray findings described byShort (1951) to indicate pulmonary infarction. X-rays of the chest were taken after thepulmonary embolism in 34 patients and of these 25 showed evidence of pulmonary infarction.Thus of the 45 patients with embolism, 30 showed infarction and 15 did not.
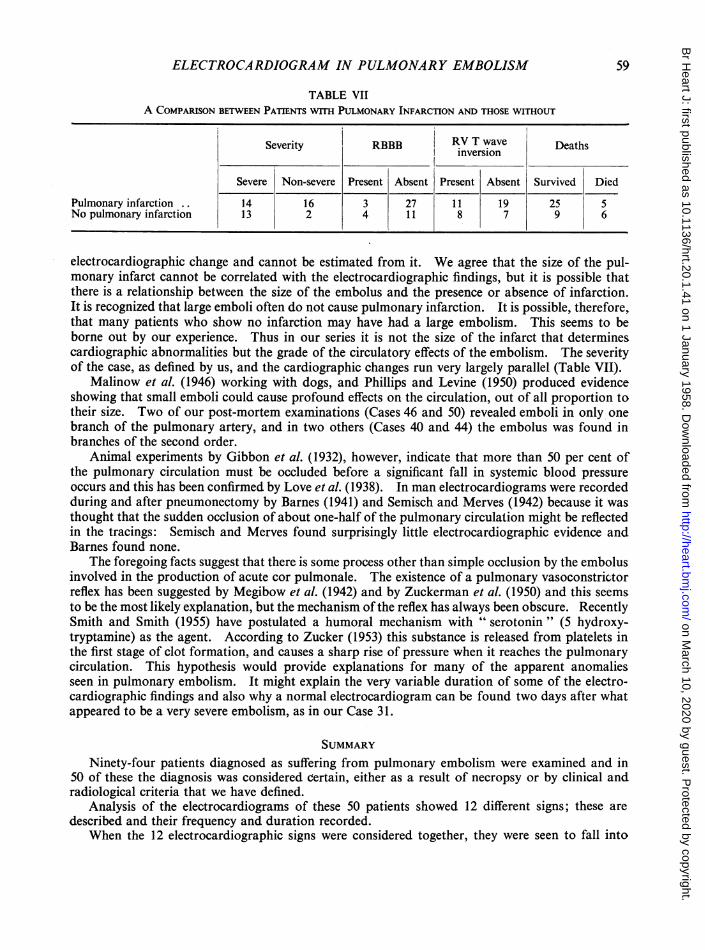
The absence of infarction meant a more serious illness. Of the 15 patients without it 13belonged to the severe group, whereas of the 30 who had pulmonary infarcts only 14 were severe(Table VII).
ELECTROCARDIOGRAPHIC CORRELATIONIn pulmonary embolism severe disturbance of the circulation with embarrassment of the right
ventricular muscle is shown electrocardiographically by right ventricular T wave inversion andright bundle-branch block. In our series these patterns occurred more frequently in the absenceof pulmonary infarction than in its presence (Table VII). Newman (1952) states that the severityand magnitude of the pulmonary infarction do not necessarily run parallel with the extent of the
58
on March 10, 2020 by guest. P
rotected by copyright.http://heart.bm
j.com/
Br H
eart J: first published as 10.1136/hrt.20.1.41 on 1 January 1958. Dow
nloaded from
ELECTROCARDIOGRAM IN PULMONARY EMBOLISM
TABLE VIIA COMPARISON BETWEEN PATIENTS WITH PULMONARY INFARCTION AND THOSE WITHOUT
Severity RBBB RV T wave Deathsinversion
Severe Non-severe Present Absent Present Absent Survived Died
Pulmonary infarction .. 14 16 3 27 11 19 25 5No pulmonary infarction 13 2 4 11 8 7 9 6
electrocardiographic change and cannot be estimated from it. We agree that the size of the pul-monary infarct cannot be correlated with the electrocardiographic findings, but it is possible thatthere is a relationship between the size of the embolus and the presence or absence of infarction.It is recognized that large emboli often do not cause pulmonary infarction. It is possible, therefore,that many patients who show no infarction may have had a large embolism. This seems to beborne out by our experience. Thus in our series it is not the size of the infarct that determinescardiographic abnormalities but the grade of the circulatory effects of the embolism. The severityof the case, as defined by us, and the cardiographic changes run very largely parallel (Table VII).
Malinow et al. (1946) working with dogs, and Phillips and Levine (1950) produced evidenceshowing that small emboli could cause profound effects on the circulation, out of all proportion totheir size. Two of our post-mortem examinations (Cases 46 and 50) revealed emboli in only onebranch of the pulmonary artery, and in two others (Cases 40 and 44) the embolus was found inbranches of the second order.
Animal experiments by Gibbon et al. (1932), however, indicate that more than 50 per cent ofthe pulmonary circulation must be occluded before a significant fall in systemic blood pressureoccurs and this has been confirmed by Love et al. (1938). In man electrocardiograms were recordedduring and after pneumonectomy by Barnes (1941) and Semisch and Merves (1942) because it wasthought that the sudden occlusion of about one-half of the pulmonary circulation might be reflectedin the tracings: Semisch and Merves found surprisingly little electrocardiographic evidence andBarnes found none.
The foregoing facts suggest that there is some process other than simple occlusion by the embolusinvolved in the production of acute cor pulmonale. The existence of a pulmonary vasoconstrictorreflex has been suggested by Megibow et al. (1942) and by Zuckerman et al. (1950) and this seemsto be the most likely explanation, but the mechanism of the reflex has always been obscure. RecentlySmith and Smith (1955) have postulated a humoral mechanism with " serotonin" (5 hydroxy-tryptamine) as the agent. According to Zucker (1953) this substance is released from platelets inthe first stage of clot formation, and causes a sharp rise of pressure when it reaches the pulmonarycirculation. This hypothesis would provide explanations for many of the apparent anomaliesseen in pulmonary embolism. It might explain the very variable duration of some of the electro-cardiographic findings and also why a normal electrocardiogram can be found two days after whatappeared to be a very severe embolism, as in our Case 31.
SUMMARYNinety-four patients diagnosed as suffering from pulmonary embolism were examined and in
50 of these the diagnosis was considered certain, either as a result of necropsy or by clinical andradiological criteria that we have defined.
Analysis of the electrocardiograms of these 50 patients showed 12 different signs; these aredescribed and their frequency and duration recorded.
When the 12 electrocardiographic signs were considered together, they were seen to fall into
59
on March 10, 2020 by guest. P
rotected by copyright.http://heart.bm
j.com/
Br H
eart J: first published as 10.1136/hrt.20.1.41 on 1 January 1958. Dow
nloaded from
CUTFORTH AND ORAM
eight common patterns, the first three of which we consider to be diagnostic of pulmonary embolism,namely: SI Q3 T3 appearance plus right ventricular T wave inversion,
SI T3 or T3 appearance plus right ventricular T wave inversion, andSI Q3 T3 appearance plus right bundle-branch block.
The remaining five patterns are highly suggestive of the diagnosis when considered in relationto the clinical history.
There was no arrhythmia particularly characteristic of pulmonary embolism. The muchquoted "staircase ascent" of the S-T segment was in our experience of little diagnostic value.A tall spiked P wave was found in six cases out of 50, four of which were severe.
The electrocardiographic findings have been correlated with the clinical severity of the cases,28 of which were classed as severe and 22 as not severe. The findings in embolism with pulmonaryinfarction are compared with those in embolism without pulmonary infarction. The latter groupshowed electrocardiographic signs more frequently than the former.
The differential diagnosis is discussed.Details are given of an example of pulmonary embolism occurring at the same time as myocardial
infarction, the cardiograms showing signs of pulmonary embolism, but not of cardiac infarct.It is our opinion that more assistance can be obtained from electrocardiography in the diagnosis
of pulmonary embolism than is commonly believed. Of the 50 cases, 38 showed cardiographicevidence of pulmonary embolism and these signs sometimes persisted for more than two months.It is particularly in the clinically less obvious illnesses with dyspncea, and fall in blood pressureor syncope that it can help, and 27 of 28 such cases showed electrocardiographic evidence ofpulmonary embolism.
REFERENCESBarnes, A. R. (1937). J. Amer. med. Ass., 109, 1347.Barnes, C. (1941). Proc. rov. Soc. Med., 34, 606.Carlotti, J., Hardy,I. B., Linton, R. R., and White, P. D. (1947). J. Amer. med. Ass., 134, 1447.Durant, T. M., Ginsberg, I. W., and Roesler, H. (1939). Amer. Heart J., 17, 423.Eliaser, M., and Giansiracusa, F. (1952). Amer. Heart J., 43, 533.Gibbon, J. H., Hopkinson, M., and Churchill, E. D. (1932). J. clin. Invest., 11, 543.Goldberger, E. (1949). Amer.J. Med., 7, 756.
(1953). Unipolar Lead Electrocardiography and Vectorcardiography. 3rd ed. London.Horn, H., Dack, S., and Friedberg, C. K. (1939). Arch. intern. Med., 64, 296.Katz, L. N. (1946). Electrocardiographv. 2nd ed. Philadelphia.Kuo, P. T., and Vander Veer, J. B. (1950). Amer. Heart J., 40, 825.Laham, J., and Gerbaux, A. (1951). Arch. Mal. Caeur, 44, 328.Love, W. S., Brugler, G. W., and Winslow, N. (1938). Ann. intern. Med., 11, 2109.Malinow, M. R., Katz, L. N., and Kondo, B. (1946). Amer. Heart J., 31, 702.McGinn, S., and White, P. D. (1935). J. Amer. med. Ass., 104, 1473.Megibow, R. S., Katz, L. N., and Steinitz, F. S. (1942). Surgery, 11, 19.Murnaghan, D., McGinn, S., and White, P. D. (1943). Amer. Heart J., 25, 573.Myers, G. B., Klein, H. A., and Stoffer, B. E. (1948). Amer. Heart J., 35, 1.Newman, D. A. (1952). J. Fla. med. Ass., 38, 701.Phillips, E., and Levine, H. D. (1950). Amer. Heart J., 39, 205.Semisch, C. W., and Merves, L. (1942). Arch. intern. Med., 69, 417.Short, D. S. (1951). Quart. J. Med. N.S., 20, 233.Smith, G., and Smith, A. N. (1955). Surg. Gynec. Obstet., 101, 691.Sokolow, M., Katz, L. N., and Muscovitz, A. N. (1940). Amer. Heart J., 19, 166.White, P. D. (1935). Ann. intern. Med., 9, 115.
(1951). Heart Disease. 4th ed. New York.Wilson, F. N., Rosenbaum, F. F., and Johnston, F. D. (1947). Advanc. intern. Med., 2, 1.Wood, P. (1941). Brit. Heart J., 3, 21.- (1948). Brit. Heart J., 10, 87.
Zeigler, R. F. (1951). Circulation (N.Y.), 3, 438.Zucker, M. B. (1953). Abstracts of Communications: Nineteenth International Physiological Congress, p. 915.Zuckerman, R., Rodriguez, M. I., Sodi Pallares, D., and Bisteni, A. (1950). Amer. Heart J., 40, 805.
60
on March 10, 2020 by guest. P
rotected by copyright.http://heart.bm
j.com/
Br H
eart J: first published as 10.1136/hrt.20.1.41 on 1 January 1958. Dow
nloaded from