electroanalysis of ethanol with a glass carbon electrode comodified with liver tissue homogenate and...
TRANSCRIPT

Full Paper
Electroanalysis of Ethanol with a Glass Carbon ElectrodeComodified with Liver Tissue Homogenate and Carbon Nanotubes
Jing Chen,a Guifang Chen,a Dong Li,b Jianbo Jia,b Genxi Lia, c*a Department of Biochemistry and National Key Laboratory of Pharmaceutical Biotechnology, Nanjing University, Nanjing 210093,P. R. China
b Department of Bioengineering and Chemical Engineering, Institute of Huaiyin Technology, Huaian 223001, P. R. Chinac School of Life Science and Shanghai Key Laboratory of Bio-Energy Crops, Shanghai University, Shanghai 200444, P. R. China*e-mail: [email protected]
Received: September 22, 2006Accepted: November 18, 2006
AbstractLiver tissue homogenate and carbon nanotubes (CNTs) are comodified on a glass carbon electrode for electroanalysisof ethanol. Alcohol dehydrogenase, which is rich in liver tissue, can catalyze the oxidation of ethanol. Experimentalresults reveal that the catalytic peak current of ethanol is linear with ethanol concentration in the range of 2� 10�8 –7� 10�7 mol/L. The limit of detection is 5� 10�9 mol/L. The relative standard deviation for six determinations of a0.5 mM ethanol sample is 4.0%. The optimal condition of the electrode modification has been obtained, and the bestoperating temperature has been known as 30 8C. The stability of the modified electrode can also be reasonablysatisfactory.
Keywords: Liver tissue, Carbon nanotube, Ethanol, Chemically modified electrode
DOI: 10.1002/elan.200603776
1. Introduction
High sensitive measurement of ethanol is very important inmany industrial and biotechnological processes, such asclinical diagnosis or treatment, production of alcoholicbeverages, food and pharmaceutical products [1 – 4]. Lots ofanalytical methods have been developed for the determi-nation of ethanol, including chemicalmethods such as redoxtitrations, colorimetric methods, chromatographic andspectroscopic methods. Meanwhile, many reports on elec-trochemical measurements have been proposed by employ-ing enzymes [4 – 8], microorganisms [9 – 11] or plant tissues[12 – 17] modified electrodes. However, animal tissue hasnot been used, although there are many obvious advantagesby using animal tissues. As is well known, liver tissue is themain ethanol decompounding place in animal body. It is richin alcohol dehydrogenase (LADH) which can speciallycatalyze the reversible oxidation of aliphatic and aromaticalcohols. So, liver tissue has been employed in this work forelectroanalysis of ethanol.Carbon nanotubes (CNTs), which have superfine elec-
tronic, chemical, and mechanical properties, have receivedthe interests ofmore andmore electrochemists for electrodemodification [18 – 24]. Especially, their nanoporous struc-ture can greatly increase the active surface area available forprotein bonding. The fine physical rigidity and springinesscan obviate the cracks and shrinkage of the modified film.The moderate hydrophilic surface after treatment is able toprovide a friendly microenvironment for enzyme to retain
its functional activity to a large extent. In this work, CNTshave been used for comodification of a glass carbon (GC)electrode with liver tissue. With the help of CNTs, livertissue can maintain its biological activity, and an electro-chemical method to detect ethanol is developed.
2. Experimental
2.1. Materials
Multiwall CNTs (MCNTs; 30 – 50 nm outside diameter,<600 nm length, >95 wt% purity) were purchased fromChengdu Organic Chemistry Company of Chinese Acad-emy of Sciences (Chengdu, China). They were used asreceived. Pig liver was purchased form the local market andstored at �18 8C in the refrigerator until use. All the otherchemicals were of analytical grade. All the solutions wereprepared with doubly distilled water. A 0.1 M phosphatebuffer solution (PBS, pH 7.0), made from Na2HPO4 andNaH2PO4, was employed as the buffer solution.
2.2. Preparation of Tissue Electrode
The GC electrode (4 mm diameter) was first polished withfine metallographic abrasive papers, then polished to amirror smoothness using slurry of 0.05 mm alumina. Afterbeing rinsed with doubly distilled water, it was sonicated
813
Electroanalysis 19, 2007, No. 7-8, 813 – 815 E 2007 WILEY-VCH Verlag GmbH&Co. KGaA, Weinheim
first with ethanol and then with doubly distilled water bothfor about 1min, respectively.MCNT (3 mg)was dispersed in1 mLwaterwith the aid of ultrasonication to give a 3 mg/mLblackMCNT suspension. 0.4 g pig liver tissue (chopped intosmall pieces) and 200 mL PBS (0.1 M) were mixed into amortar, and then ground to homogenate. The MCNTsuspension and the tissue homogenate were mixed thor-oughly, with the expected ratio. The mixture was then castonto the surface of the GC electrode surface with amicrosyringe and allowed to dry at ambient temperature.Themodified electrode was then prepared, which was takenasTissue-MCNT/GCelectrode. If not used immediately, themodified electrode was sealed and stored at 4 8C in arefrigerator. ATissue/GC electrode wasmade bymodifyingthe GC electrode only with liver tissue homogenate, and aMCNT/GC electrode was made by modifying the GCelectrode only with MCNTs.
2.3. Apparatus
Electrochemical experiments were carried out with a CHI600AElectrochemical station (CH Instruments, USA) witha conventional three-electrode cell. The working electrodewas a Tissue-MCNT/GC electrode, or a Tissue/GC elec-trode or a MCNT/GC electrode. A coiled Pt wire and asaturated calomel electrode (SCE)were used as the counterelectrode and the reference electrode, respectively. Allexperiments were performed at 30 8Cexcept for the study oftemperature effect.
3. Results and Discussion
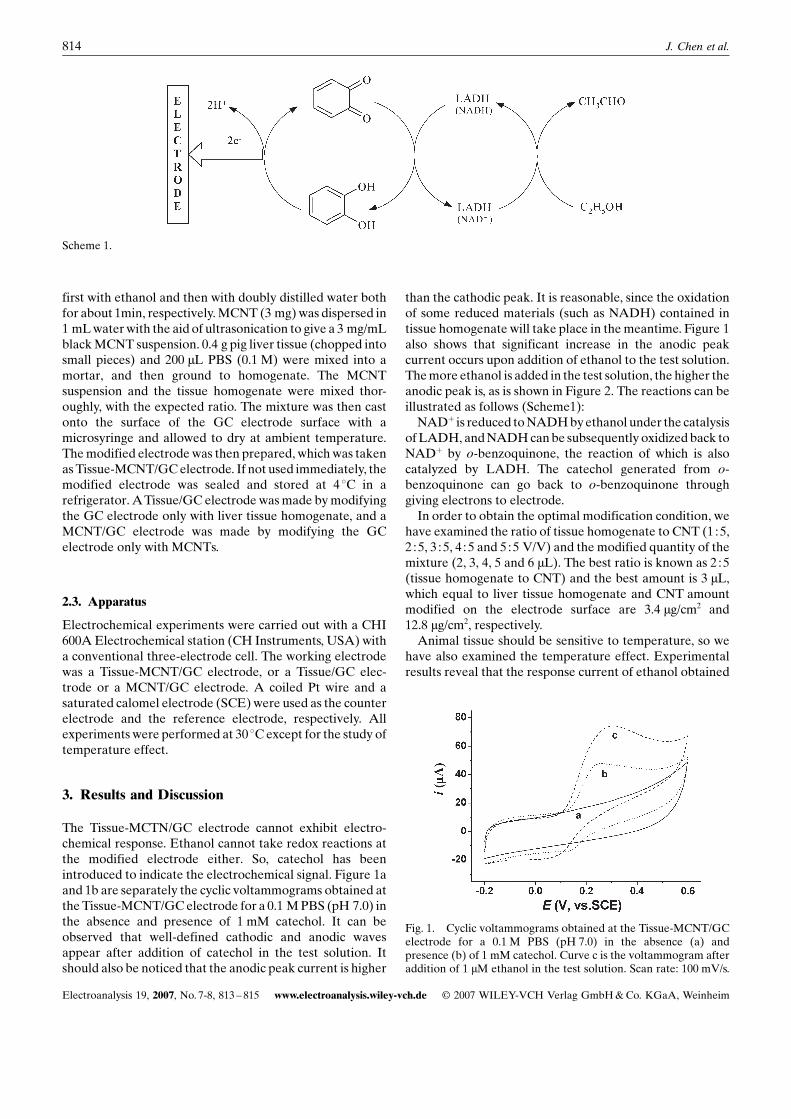
The Tissue-MCTN/GC electrode cannot exhibit electro-chemical response. Ethanol cannot take redox reactions atthe modified electrode either. So, catechol has beenintroduced to indicate the electrochemical signal. Figure 1aand 1b are separately the cyclic voltammograms obtained attheTissue-MCNT/GCelectrode for a 0.1 MPBS (pH 7.0) inthe absence and presence of 1 mM catechol. It can beobserved that well-defined cathodic and anodic wavesappear after addition of catechol in the test solution. Itshould also be noticed that the anodic peak current is higher
than the cathodic peak. It is reasonable, since the oxidationof some reduced materials (such as NADH) contained intissue homogenate will take place in themeantime. Figure 1also shows that significant increase in the anodic peakcurrent occurs upon addition of ethanol to the test solution.Themore ethanol is added in the test solution, the higher theanodic peak is, as is shown in Figure 2. The reactions can beillustrated as follows (Scheme1):NADþ is reduced toNADHbyethanol under the catalysis
of LADH, andNADHcanbe subsequently oxidized back toNADþ by o-benzoquinone, the reaction of which is alsocatalyzed by LADH. The catechol generated from o-benzoquinone can go back to o-benzoquinone throughgiving electrons to electrode.In order to obtain the optimal modification condition, we
have examined the ratio of tissue homogenate to CNT (1 :5,2 :5, 3 : 5, 4 : 5 and 5 :5 V/V) and the modified quantity of themixture (2, 3, 4, 5 and 6 mL). The best ratio is known as 2 :5(tissue homogenate to CNT) and the best amount is 3 mL,which equal to liver tissue homogenate and CNT amountmodified on the electrode surface are 3.4 mg/cm2 and12.8 mg/cm2, respectively.Animal tissue should be sensitive to temperature, so we
have also examined the temperature effect. Experimentalresults reveal that the response current of ethanol obtained
Scheme 1.
Fig. 1. Cyclic voltammograms obtained at the Tissue-MCNT/GCelectrode for a 0.1 M PBS (pH 7.0) in the absence (a) andpresence (b) of 1 mM catechol. Curve c is the voltammogram afteraddition of 1 mM ethanol in the test solution. Scan rate: 100 mV/s.
814 J. Chen et al.
Electroanalysis 19, 2007, No. 7-8, 813 – 815 www.electroanalysis.wiley-vch.de E 2007 WILEY-VCH Verlag GmbH&Co. KGaA, Weinheim
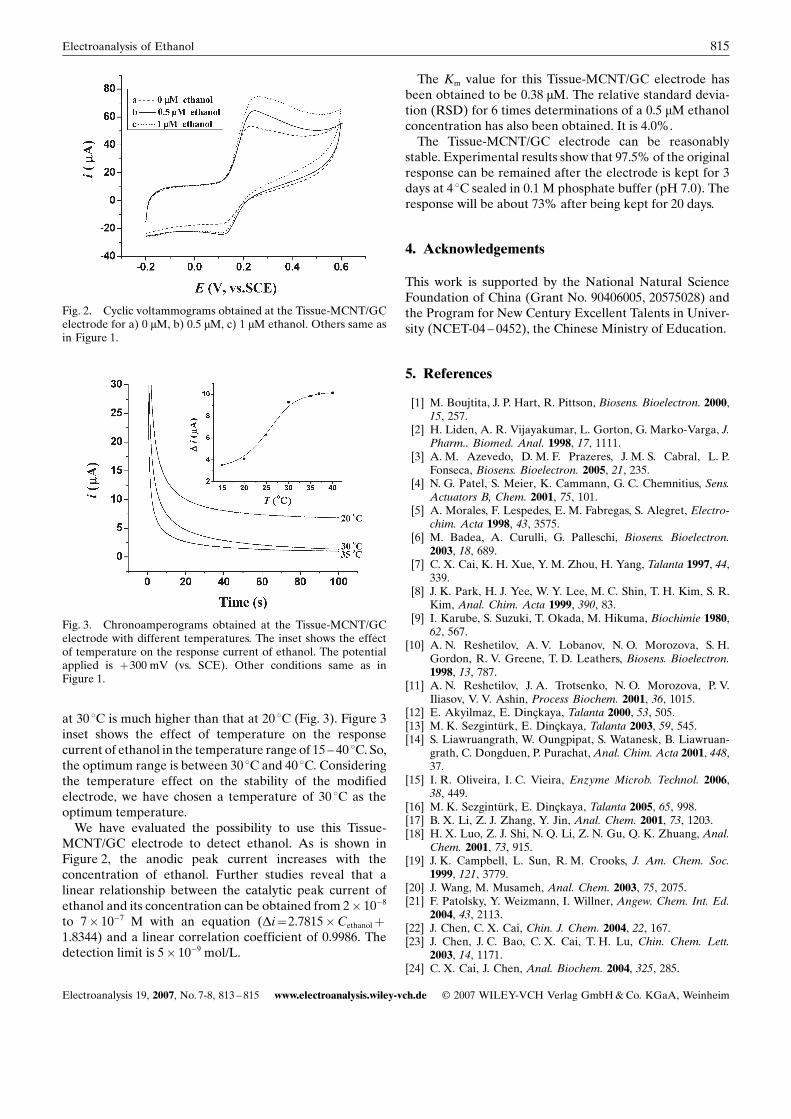
at 30 8C is much higher than that at 20 8C (Fig. 3). Figure 3inset shows the effect of temperature on the responsecurrent of ethanol in the temperature range of 15 – 40 8C. So,the optimum range is between 30 8C and 40 8C. Consideringthe temperature effect on the stability of the modifiedelectrode, we have chosen a temperature of 30 8C as theoptimum temperature.We have evaluated the possibility to use this Tissue-
MCNT/GC electrode to detect ethanol. As is shown inFigure 2, the anodic peak current increases with theconcentration of ethanol. Further studies reveal that alinear relationship between the catalytic peak current ofethanol and its concentration can be obtained from 2� 10�8
to 7� 10�7 M with an equation (Di¼2.7815�Cethanolþ1.8344) and a linear correlation coefficient of 0.9986. Thedetection limit is 5� 10�9 mol/L.
The Km value for this Tissue-MCNT/GC electrode hasbeen obtained to be 0.38 mM. The relative standard devia-tion (RSD) for 6 times determinations of a 0.5 mM ethanolconcentration has also been obtained. It is 4.0%.The Tissue-MCNT/GC electrode can be reasonably
stable. Experimental results show that 97.5% of the originalresponse can be remained after the electrode is kept for 3days at 4 8C sealed in 0.1 M phosphate buffer (pH 7.0). Theresponse will be about 73% after being kept for 20 days.
4. Acknowledgements
This work is supported by the National Natural ScienceFoundation of China (Grant No. 90406005, 20575028) andthe Program for New Century Excellent Talents in Univer-sity (NCET-04 – 0452), the Chinese Ministry of Education.
5. References
[1] M. Boujtita, J. P. Hart, R. Pittson, Biosens. Bioelectron. 2000,15, 257.
[2] H. Liden, A. R. Vijayakumar, L. Gorton, G. Marko-Varga, J.Pharm.. Biomed. Anal. 1998, 17, 1111.
[3] A. M. Azevedo, D. M. F. Prazeres, J. M. S. Cabral, L. P.Fonseca, Biosens. Bioelectron. 2005, 21, 235.
[4] N. G. Patel, S. Meier, K. Cammann, G. C. Chemnitius, Sens.Actuators B, Chem. 2001, 75, 101.
[5] A. Morales, F. Lespedes, E. M. Fabregas, S. Alegret, Electro-chim. Acta 1998, 43, 3575.
[6] M. Badea, A. Curulli, G. Palleschi, Biosens. Bioelectron.2003, 18, 689.
[7] C. X. Cai, K. H. Xue, Y. M. Zhou, H. Yang, Talanta 1997, 44,339.
[8] J. K. Park, H. J. Yee, W. Y. Lee, M. C. Shin, T. H. Kim, S. R.Kim, Anal. Chim. Acta 1999, 390, 83.
[9] I. Karube, S. Suzuki, T. Okada, M. Hikuma, Biochimie 1980,62, 567.
[10] A. N. Reshetilov, A. V. Lobanov, N. O. Morozova, S. H.Gordon, R. V. Greene, T. D. Leathers, Biosens. Bioelectron.1998, 13, 787.
[11] A. N. Reshetilov, J. A. Trotsenko, N. O. Morozova, P. V.Iliasov, V. V. Ashin, Process Biochem. 2001, 36, 1015.
[12] E. Akyilmaz, E. DinÅkaya, Talanta 2000, 53, 505.[13] M. K. SezgintOrk, E. DinÅkaya, Talanta 2003, 59, 545.[14] S. Liawruangrath, W. Oungpipat, S. Watanesk, B. Liawruan-
grath, C. Dongduen, P. Purachat, Anal. Chim. Acta 2001, 448,37.
[15] I. R. Oliveira, I. C. Vieira, Enzyme Microb. Technol. 2006,38, 449.
[16] M. K. SezgintOrk, E. DinÅkaya, Talanta 2005, 65, 998.[17] B. X. Li, Z. J. Zhang, Y. Jin, Anal. Chem. 2001, 73, 1203.[18] H. X. Luo, Z. J. Shi, N. Q. Li, Z. N. Gu, Q. K. Zhuang, Anal.
Chem. 2001, 73, 915.[19] J. K. Campbell, L. Sun, R. M. Crooks, J. Am. Chem. Soc.
1999, 121, 3779.[20] J. Wang, M. Musameh, Anal. Chem. 2003, 75, 2075.[21] F. Patolsky, Y. Weizmann, I. Willner, Angew. Chem. Int. Ed.
2004, 43, 2113.[22] J. Chen, C. X. Cai, Chin. J. Chem. 2004, 22, 167.[23] J. Chen, J. C. Bao, C. X. Cai, T. H. Lu, Chin. Chem. Lett.
2003, 14, 1171.[24] C. X. Cai, J. Chen, Anal. Biochem. 2004, 325, 285.
Fig. 2. Cyclic voltammograms obtained at the Tissue-MCNT/GCelectrode for a) 0 mM, b) 0.5 mM, c) 1 mM ethanol. Others same asin Figure 1.
Fig. 3. Chronoamperograms obtained at the Tissue-MCNT/GCelectrode with different temperatures. The inset shows the effectof temperature on the response current of ethanol. The potentialapplied is þ300 mV (vs. SCE). Other conditions same as inFigure 1.
815Electroanalysis of Ethanol
Electroanalysis 19, 2007, No. 7-8, 813 – 815 www.electroanalysis.wiley-vch.de E 2007 WILEY-VCH Verlag GmbH&Co. KGaA, Weinheim