electro-oxidation of anthracene on polyanilino-graphene composite electrode
TRANSCRIPT

Accepted Manuscript
Title: Electro-oxidation of anthracene onpolyanilino-graphene composite electrode
Author: Oluwakemi Tovide Nazeem Jahed Christopher E.Sunday Keagan Pokpas Rachel F. Ajayi Hlamulo R. MakelaneKerileng Molapo Suru V. John Priscilla G. Baker Emmanuel I.Iwuoha
PII: S0925-4005(14)00956-3DOI: http://dx.doi.org/doi:10.1016/j.snb.2014.07.116Reference: SNB 17271
To appear in: Sensors and Actuators B
Received date: 1-5-2014Revised date: 20-7-2014Accepted date: 29-7-2014
Please cite this article as: O. Tovide, N. Jahed, C.E. Sunday, K. Pokpas, R.F. Ajayi,H.R. Makelane, K. Molapo, S.V. John, P.G. Baker, E.I. Iwuoha, Electro-oxidation ofanthracene on polyanilino-graphene composite electrode, Sensors and Actuators B:Chemical (2014), http://dx.doi.org/10.1016/j.snb.2014.07.116
This is a PDF file of an unedited manuscript that has been accepted for publication.As a service to our customers we are providing this early version of the manuscript.The manuscript will undergo copyediting, typesetting, and review of the resulting proofbefore it is published in its final form. Please note that during the production processerrors may be discovered which could affect the content, and all legal disclaimers thatapply to the journal pertain.

Page 1 of 28
Accep
ted
Man
uscr
ipt
Electro-oxidation of Anthracene on Polyanilino-Graphene Composite Electrode
Oluwakemi Tovide, Nazeem Jahed, Christopher E. Sunday, Keagan Pokpas, Rachel F. Ajayi, Hlamulo R.
Makelane, Kerileng Molapo, Suru V. John, Priscilla G. Baker, Emmanuel I. Iwuoha*
SensorLab, Department of Chemistry, University of Western Cape, Moderddam Road, Bellville, Cape
Town 7535, South Africa.
*Corresponding author: Tel.: + 27 21 959 3054; e-mail: [email protected]
ABSTRACT
A novel graphenated–polyaniline (GR-PANI) nanocomposite sensor was constructed and used for the
determination of anthracene. The direct electro-oxidation behavior of anthracene on the GR-PANI modified
glassy carbon electrode (GCE) was used as the sensing principle. The results indicate that the response
profile of the oxidation of anthracene on GR-PANI-modified GCE provides for the construction of sensor
systems based on amperometric and voltammetric signal transductions. A dynamic linear range of 0.012 -
1000 µM anthracene and a detection limit of 0.0044 µM anthracene were established for the sensor system.
Keywords—Electrochemical sensors, environmental pollutants, graphenated-polymers, polyaromatic
hydrocarbon.
1. INTRODUCTION
The growing concern about the environment and human health has resulted in the search for effective
methods for detecting and analysing environmental contaminants. Polyaromatic hydrocarbons (PAHs) are
among the persistent organic pollutants (POPs) that have deleterious health effects on both aquatic
organisms and humans [1-2] . PAHs are a class of chemical compounds that have more than one fused
aromatic rings. They are products of incomplete combustion of petroleum, coal, tar and other forms of
organic materials [3]. Anthracene, phenanthrene, fluoranthene, benz[a]anthracene and benz[a]pyrene are
some examples of PAHs [4] that have been detected at all levels of the food chain [5]. Consequently, the
European Union, World Health Organization (WHO) and several countries have regulations for PAHs in
food and environment [6-7].
Sensors are necessary for real time checking of adherence to the set limits of PAHs. Intrinsically
conducting polymers (ICPs) and their composites are known to be very effective materials for the

Page 2 of 28
Accep
ted
Man
uscr
ipt
construction of sensors [8]. In particular, graphene-based polymeric nanomaterials are expected to possess
properties that make them very efficient platforms for the development of electrochemical sensors [9]. Due
to the excellent electronics of its two-dimensional sp2-hybridized carbons, electrocatalysis readily occurs on
graphene film [10-11]. This property of graphene can be modified by the incorporation of functional
nanomaterials to produce required electrochemical sensing performance [12]. Doped form of ICPs, such as
polyaniline (PANI), have been recognized as cost effective electrocatalytic sensor materials due to their
improved redox activity and conductivity [13-14].
Doped PANI has been reported [15-16] to be characterized by enhanced mechanical, electrical, thermal
and electrochemical properties [17]. In the form of nanosheets, graphene can provide active nucleation sites
for PANI as well as excellent electron transfer pathways [18]. Graphenated polyaniline (GR-PANI)
nanocomposite-based sensor for anthracene is being presented for the first time in this report.
2. EXPERIMENTAL
2.1. Reagents
Natural graphite powder (microcrystal grade, 99.9995%) (Metal base) UCP1-M grade, Ultra “F” purity
was purchased from Alfa Aesar and used for the preparation of graphene oxide (GO) by a modified
Hummers method [19]. Analytical grade aniline (99%) was obtained from Aldrich Chemical, Gillingham,
England and purified by distillation under reduced pressure prior to use. Ammonium persulphate
((NH4)2S2O8), anthracene (99%), lithium perchlorate (LiClO4, 99.99%), acetonitrile (HPLC grade),
hydrochloric acid (HCl, 37%), hydrogen peroxide (H2O2, 35 wt % water solution), sulphuric acid (H2SO4),
sodium nitrite (NaNO2) and potassium permanganate (KMnO4) were obtained from Sigma-Aldrich. 0.1 M
LiClO4 in acetonitrile was used as the supporting electrolyte. Ultra-pure water (Millipore) was used for all
preparations.
2.2. Apparatus
Cyclic voltammetry (CV) and square wave voltammetry (SWV) were performed with a BAS 100W
electrochemical workstation from BioAnalytical Systems (BAS) Technicol Ltd., Stockport, UK. A
conventional three-electrode system was used for electrochemical studies and it consisted of a glassy
carbon electrode (GCE), Ag/AgCl (with 3 M NaCl salt bridge) and platinum wire as the working, reference
and counter electrodes, respectively. The infrared spectra of PANI, graphite, graphite oxide and graphene
were recorded on a Fourier Transform Infra-Red (FTIR) spectrometer (Perkin Elmer Spectrum 100) and
their structural details were evaluated by X-ray diffraction studies performed with a Phillips X-ray
diffractometer that has Cu-Kα radiation. A tapping-mode atomic force microscope (Veeco Nanoman V)
Page 3 of 28
Accep
ted
Man
uscr
ipt
was used to evaluate the morphology of graphene and its film thickness. Antimony-doped silicon tip (with
a curvature radius of 2.5 - 3.5 μM, a force constant of 1 - 5 N m-1
and a resonance frequency of 60 - 100
kHz) was used for atomic force microscopy (AFM) experiments. The samples for AFM were prepared by
drop-coating a silicon wafer with 5 μL graphene/water dispersion. Transmission electron microscopy
(TEM) images of the materials were obtained with a Tecnai G2 F20X-Twin MAT 200KV high resolution
(HR) TEM from FEI (Eindhoven, Netherlands). Scanning electron microscopy (SEM) studies were
performed with a LEO 1450 SEM 3OKV instrument equipped with energy dispersive X-ray (EDX) and
wavelength-dispersive spectrometry (WDS) capabilities. VoltaLab PGL 402 from Radiometer Analytical
(Lyon, France) was used for electrochemical impedance spectroscopy (EIS) measurements in 1 M HCl.
2.3. Material Synthesis
Graphene oxide (GO) was synthesized from graphite powder by a modified Hummers method [19].
Accordingly, 2.0 g powdered graphite flakes and 1.0 g NaNO2 were gently added to 50 mL concentrated
H2SO4 at room temperature. The solution was then cooled to 0 °C in an ice bath while stirring vigorously.
7.0 g KMnO4 was added to the suspension and the rate of addition was carefully controlled to prevent the
temperature of the suspension from exceeding 20 °C. The ice bath was then removed and the temperature
of the suspension was raised to room temperature and maintained for 30 min. The temperature was then
raised to 35 °C in a water bath and then stirred for 2 h. As the reaction progressed, the slurry gradually
thickened with diminishing effervescence. The mixture was cooled in ice bath and excess deionized water
was added to it. The reaction mixture was treated with 35% H2O2 until gas evolution ceased, in order to
reduce the residual KMnO4 and MnO2 to colorless and soluble MnSO4. The precipitate was filtered off,
washed several times with warm deionized water/concentrated HCl mixed solvent (9/1 volume ratio) and
then dried under reduced pressure at 60 oC for 24 h to obtain graphene oxide. The GO was then exfoliated
in distilled water through ultrasonication to form thin GO sheets for subsequent use.
GR-PANI was prepared by in situ polymerization of aniline in a suspension of GO, by chemical
oxidation of aniline with (NH4)2S2O8 in an acidic medium [17], followed by the reduction of the solution
with NaBH4 [20]. The reaction product was then dispersed in 1 M HCl containing (NH4)2S2O8 and stirred
overnight at room temperature to allow the reoxidation and reprotonation of PANI to occur and form
crystalline GR-PANI. The resultant GR-PANI nanocomposite was collected by filtration and dried in
vacuum. For comparison, polyaniline film was prepared by the same procedure under the same condition
but without adding graphene oxide. Graphene nanosheets were also synthesized by the NaBH4 reduction
method. Typically 100 mg GO powder was dispersed in 100 mL deionized water and exfoliated into GO
sheets by ultrasonication for 1 h to form a stable aqueous dispersion. 200 mg NaBH4 was then added to the

Page 4 of 28
Accep
ted
Man
uscr
ipt
dispersion while stirring the mixture continuously at 125 °C for 3 h. Finally a black precipitate was
obtained and isolated by filtration and dried under vacuum at 60 °C to obtain graphene [20].
Aniline monomer Polyaniline (PANI)
graphene oxide-Polyaniline
(NH4)2S2O8,
Stir for 12 h
Sonicate , 30 min
O
O O O
O
O
O
OOO HO
O
HO
O H OH OH
OH
OH
OHHOHO
OH
HO
OH
HO
O H
O O
OHOH
Graphene oxide Graphene Graphene polyaniline (GR-PANI) Tem image
Scheme 1. Schematic illustration of the synthesis of GR-PANI nanocomposite via in situ polymerisation.
2.4. Preparation of Modified Electrodes
A 0.071 cm2 GCE was polished with slurries of 0.05, 0.3 and 1.0 µm alumina powder (Buehler, IL,
USA), rinsed with distilled water, ultrasonicated in ethanol and deionised water, and then dried at room
temperature. 1 mg GR-PANI nanocomposite was dispersed in 1 mL ethanol and ultrasonicated for 30 min
to form a homogenous suspension. The surface of the polished GCE was coated with 5 µL of the
suspension and dried at room temperature to form GR-PANI|GCE sensor. PANI|GCE and GR|GCE
systems were also prepared by drop-coating GCE with 5 µL of their respective suspensions.
3. RESULTS AND DISCUSSION
3.2. Characterization of GR-PANI Nanocomposite
The CV of GR-PANI|GCE was run in 1 M HCl within a potential window of -0.2 to +1.2 V vs. Ag/AgCl.
The electrochemical reactivities of the different electrodes are depicted in the CVs presented in Figs. 1 (a)–
(d). As shown by the innermost voltammogram (unlabeled) in Fig. 1 (a), no peak was observed for

Page 5 of 28
Accep
ted
Man
uscr
ipt
unmodified GCE, but after modification with graphene, i.e. CVs (i - v), a pair of redox peaks was observed.
The peaks increased as scan rate increased, accompanied by an anodic and cathodic shifts in oxidation and
reduction peak potentials, respectively. This behaviour is typical of carbon materials because of the
transition between quinone and hydroquinone electrochemistry [15]. The PANI|GCE system depicted in
Fig. 1 (b) has two redox couples, labeled Ip.c1/Ip.c 1 and Ip.a 2/Ip.c 2, as is typical with polyaniline redox
transitions of the semiconductive leucomeraldine form (Ip.c 1) to the conductive polaronic-leucomeraldine
form (Ip.a 1)); and the Faradaic transformation of emeraldine (Ip.c 2) to penigraniline (Ip.a 2) [21]. The CV of
GR-PANI-modified GCE is characterized by well-defined redox peaks and an enhancement of the peak
currents relative to those of PANI-modified and unmodified GCE. The current density and the anodic to
cathodic peak separation (∆Ep) analyses of the CVs drawn in Fig. 1 (b) gave ∆Ep(1) and ∆Ep(2) values of 184
and 137 mV, respectively, for PANI|GCE. The corresponding values for GR-PANI|GCE were 83 and 51
mV. The results demonstrate a graphene-induced reduction in the ∆Ep values of PANI by a factor of 2.2 for
the leucomeraldine/polaronic-leucomeraldine transition, and 2.7 for the emeraldine/penigraniline process.
The reduction in the ∆Ep value means that the electrochemistry of the graphenated system is faster and the
material is more conducting
In addition to the good conductivity of graphene, its excellent catalytic properties as a result of its higher
surface-to-volume ratio, provides greater surface accessibility of the polymer matrix [22-23]. The anodic
peak currents (Ip,a 1 and Ip,a 2) of GR-PANI|GCE (Fig. 1 (c)) were found to be linearly dependent on scan
rates, in accordance with the equations: Ip,a 1 = 2.0461× 10⁻⁴
+ 2.7413 × 10⁻⁵ (r
2 = 0.9980); Ip,a 2 = 3.0782 ×
10-4
+ 3.3360 × 10⁻⁵ (r
2 = 0.9930). This behavior is in agreement with that of a thin film of adsorbed
electroactive species undergoing a Nernstian reaction [24-25]. The surface concentration, Γ* (mol cm-2
), of
the adsorbed electroactive species can be estimated from Equation 1:
TR
ΓAFnI
4
PANI-GR22
ap,
(Equation 1)
where n is the number of electron transferred, F is Faraday constant (96500 C mol-1
), Γ*GR-PANI is the
surface concentration of GR-PANI film (mol cm-2), A is surface area of GCE (0.071 cm
2), is scan rate
(mV s-1
), R is gas constant (8.314 J mol-1
K-1
) and T is temperature (298 K). The evaluation of n from the
slope of the linear Ip,a 1 vs. plot predicted a one electron process for the leucomeraldine/polaronic-
leucomeraldine transition, as reported by other workers [26-27]. The Γ*GR-PANI value was evaluated to be
3.073 × 10⁻⁹
mol cm-2
.

Page 6 of 28
Accep
ted
Man
uscr
ipt
3.3. EIS of GR-PANI|GCE
Electrochemical impedance spectroscopy was used to investigate the conductivity of the modified
electrodes [28-30]. The measurement was performed in 1 M HCl at a frequency range of 100 kHz to 0.1 Hz
and an AC voltage of 10 mV. The Nyquist plots of the EIS results are in Fig. 2. The plots displayed
significant differences in the diameter of the Nyquist semicircles upon the modification of the electrodes.
The charge transfer resistance (Rct) values calculated after fitting the EIS data to the Randle‟s equivalent
circuit diagram in Fig. 2 (inset) are 51.2, 27.68 and 20.32 kΩ for GCE, PANI|GCE, GR-PANI|GCE,
respectively. The values confirm that graphene decreased the resistance of PANI by 7 kΩ suggesting the
suitability of graphenated PANI as a good conducting platform for electrocatalysis.
3.4. Surface Morphology and Structure
The SEM images of the GR-PANI sensor components are displayed in Fig. 3. The exfoliated GO sheets
(Fig. 3 (a)) closely resemble the disordered and crumbled sheet of graphene (Fig. 3 (b)). The GR-PANI
(Fig. 3 (c)) exhibits fibrous PANI moieties that are intercalated between graphene sheets, in contrast to the
porous fibrillar structure of PANI film in Fig. 3 (d).
HRTEM images presented in Fig. 4 are those of (a) GO, (b) graphene, (c) PANI and (d) GR-PANI. The
GO image resembles layers of sheets that are folded in places. Flat transparent thin layer sheets with
wrinkles and folding on the surfaces can be observed for graphene and which is likely to be a single-layer
graphene according to literature [33]. In the inset of Fig. 4 (b), the Selected Area Electron Diffraction
(SAED) pattern confirmed the crystallinity of the material. The HRTEM of PANI in Fig. 4 (c) reveals a
uniform fibrous material while the GR-PANI nanocomposite depicts homogeneously distributed nanotubes.
The nanotubes seem to be PANI formations on templates created by the graphene sheets.
Fig. 5 is the FTIR spectra of GR-PANI as well as the reagents used in its preparation. Graphene oxide
spectrum (d) has absorption bands corresponding to the following functional groups: C=O (1735 cm-1
),
aromatic C=O (1602 cm-1
), carboxyl C-O (1416 cm-1
), epoxy C-O (1265 cm-1
), alkoxy C-O (1047 cm-1
)
and hydroxyl O-H (3390 cm-1
). This FTIR results for GO are in agreement with previous spectra reported
in other studies [31]. However, the intensity of the absorption band of GO at 1735 cm-1
(C=O) decreased
after the formation of graphene sheets by the reduction of GO. The characteristic absorption bands of
emeraldine PANI were observed in the FTIR of PANI (spectrum c), including the band at 1568 and 1476
cm-1
that can be assigned to the stretching vibration of quinone and benzene rings, respectively. The bands
at 1290 and 1233 cm-1
correspond to the C-N stretching vibration. The in-plane bending and out-of-plane
bending of C-H stretching of PANI are manifested by the bands at 1111 and 791 cm-1
, respectively [32].

Page 7 of 28
Accep
ted
Man
uscr
ipt
The FTIR spectrum of GR-PANI (b) revealed the interactions between graphene and PANI, which results
in the decrease or disappearance of the characteristic bands of PANI at 1250, 1400 and 1600 cm-1
.
Atomic force microscopy measurements were carried out according to literature precedence as described
by Stankovich et al. [22]. The topographical image of graphene (Fig. 6) indicates the presence of randomly
assembled graphene sheets on a silicon substrate. The graphene surface was slightly rough and this could
be due to the existence of some defects from the functional groups. Analysis of the cross-sectional view
along the plain area of the sheet gave an estimated film thickness of 1.0 to 1.5 nm, which is consistent with
typical values for one to three layers of graphene reported by Willemse et al. [33]. The XRD patterns of GR
(a), PANI (b) and GR-PANI composites (c) are presented in Fig. 7. GR has broad diffraction peaks at 24.2°
(002) and 43.6° (100) with some crystalline features of graphite-like structures. The broadening of the peak
can be attributed to the loosely stacked sheets in graphene [34]. PANI has a slightly broadened peak at ~
25.4° and another low intensity peak at 12.7° which are the peaks of the crystal planes of PANI in its
emeraldine salt form [17]. The GR-PANI nanocomposite has XRD patterns that are similar to the merging
of those of graphene and PANI [23]. This is consistent with the conclusions drawn from the SEM and TEM
studies.
3.5. Anthracene Sensor
The electrochemical responses of GR-PANI|GCE anthracene sensor were studied in acetonitrile/water
containing 0.1 M LiClO4 as the supporting electrolyte. An anodic peak at +1101 mV with no corresponding
reduction peak was ascribed to the oxidation of anthracene on the graphenated-polyaniline electrode.
Anthraquinone is suggested to be rapidly formed as a result of the irreversible oxidation process [35]. The
oxidation of PAHs by electrochemical degradation is usually initiated by direct electron transfer from
adsorbed PAH to the electrode, which generates cationic radicals that undergo subsequent reactions [36-
37]. The oxidation of anthracene in acetonitrile containing small amount of water is a one-electron reaction,
that appears to be the initial step [38], which is followed by the formation of radical cations and then 9,10-
anthraquinone as the final product [36-37]. However, it is important to note that a small amount of water in
acetonitrile plays a crucial role in the oxidation of anthracene by actually favoring the production of the
final product [38]. A possible mechanism for the oxidation of anthracene to anthraquinone is presented in
Fig. 8.
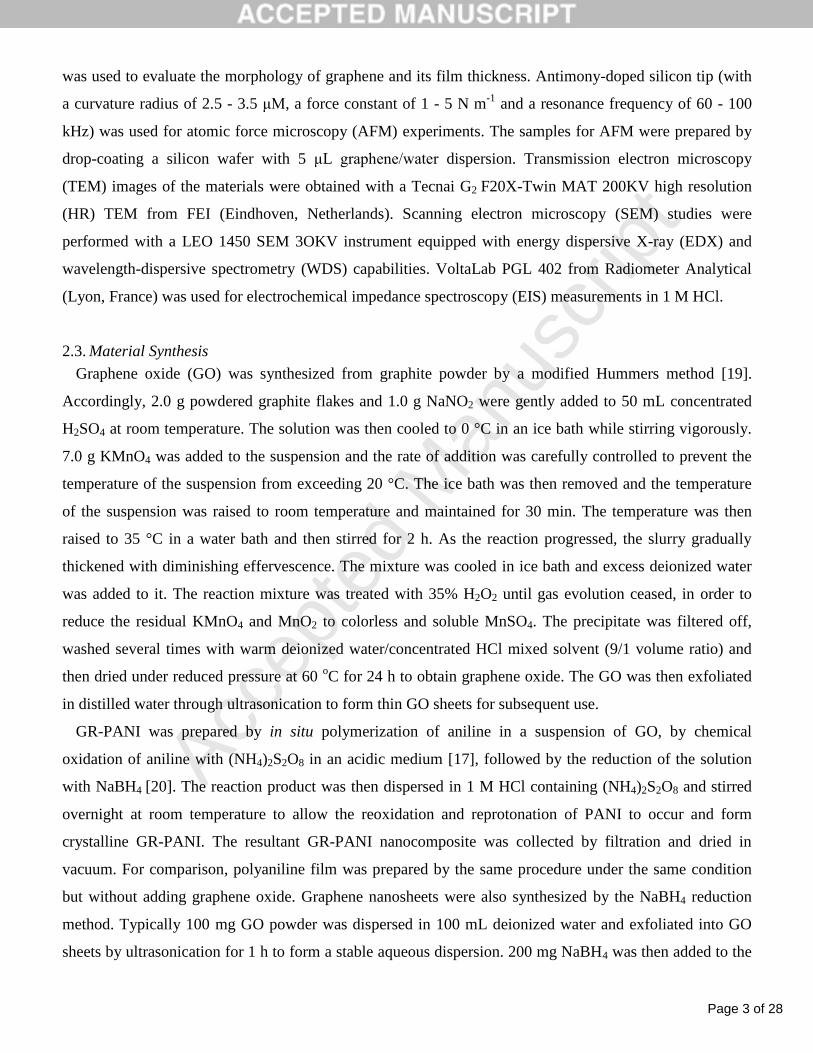
The electrochemical oxidation of 100 µM anthracene on PANI|GCE, GR-PANI|GCE and unmodified
GCE in acetonitrile/water (80:20 v/v) containing 0.1 M LiClO4 as the supporting electrolyte, was studied by
CV and the results are as plotted in Fig. 9. The GCE electrode systems (CV „a‟) did not produced an
oxidation current in the absence of anthracene. For the PANI|GCE electrode in a cell solution that did not

Page 8 of 28
Accep
ted
Man
uscr
ipt
contain anthracene, the redox chemistry of PANI was observed with a PANI pernigraniline peak forming at
about +1000 mV. However, in the presence of 100 µM anthracene in the cell solution, the CV‟s produced
by PANI|GCE (CV „c‟) and GR-PANI|GCE (CV „d‟) have anodic peak currents at +1101 without
corresponding cathodic peaks. This anodic shift in peak potential and increase in the peak currents (by a
factor of 3 for PANI|GCE and 5 for GR-PANI|GCE) occur because of the coupling of the electron transfer
reaction of the formation of PANI pernigraniline to the oxidation of anthracene in the electrocatalytic
process [35]. Comparatively, there is a 67% increase in the peak anodic current of the CV of GR-
PANI|GCE over that of PANI|GCE, in the presence of 100 mM anthracene. This observation confirms that
graphene enhanced the electro-oxidation reaction. No electrocatalysis of anthracene was observed on
unmodified GCE.
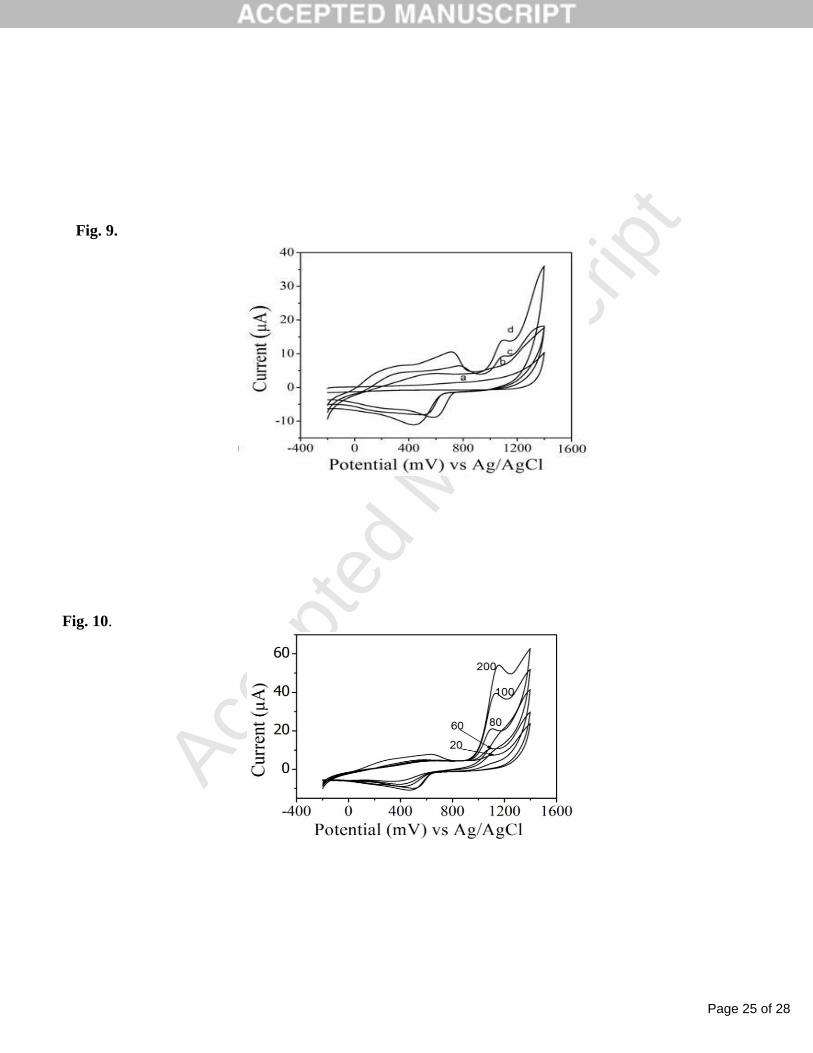
The scan rate dependence of the anthracene oxidation current are the CV‟s plotted in Fig. 10. A Randel-
Sevčik analysis of the CV data was performed in accordance to Equation 2:
οCνADn.I 1/21/23/25
p 10692 (Equation 2)
where n is number of electrons appearing in the half-reaction for the redox couple, is the potential scan
rate, F is the Faradays constant (96485 C mol-1
), A is the area of the electrode area (cm2), R is gas constant
(8.314 J mol-1
K-1
), T is the absolute temperature (298.15 K), D is the diffusion coefficient of anthracene
(cm2 s
-1) and C
0 is the concentration of anthracene.
The Randel Sevčik plot of the anodic peak currents for anthracene electro-catalytic oxidation (Fig. 11),
gave the linear regression equation, Ipa = -1.02703 × 10⁻⁶
+ 2.02703 × 10⁻⁶
v½, with a correlation
coefficient, r2 = 0.990. The linear relationship indicated that the process was limited by the rate of diffusion
of anthracene from the solution to the surface of the electrode [39-40]. It is noteworthy that the oxidation
peak potentials at +1101 mV shifted anodically as the scan rate increased, as is characteristic of irreversible
electrocatalytic processes [39].
The CV responses of GR-PANI|GCE sensor are plotted in Figs. 12 (a) and 12 (b) for 20 - 100 and 200 -
1000 µM concentrations of anthracene, respectively. Fig. 13 presents the SWV responses of the sensor for
20 - 1000 µM anthracene (data for lower concentrations are not shown due to the wide range of
concentration studied). The anthracene sensor (GR-PANI|GCE) was calibrated with CV and SWV peak
current values obtained from Figs. 12 and 13, which gave similar results. The calibration curve of the
anthracene sensor using 0.012 - 1000 µM anthracene is plotted in Fig 14. The linear regression equation of
the calibration data is: y = 8.6607 × 10⁻⁶
+ 5.71501 × 10⁻⁸
x, with a correlation coefficient, r2 = 0.9961.
Therefore, the dynamic linear range (DLR) for the application of the GR-PANI|GCE sensor system
included 0.012 - 1000 µM anthracene and the limit of detection (LOD defined as 3 S/N) was calculated to
be 0.0044 µM anthracene. Recently a DLR (and LOD) values of 3.0 – 356 M (0.017 M) were reported

Page 9 of 28
Accep
ted
Man
uscr
ipt
for another anthracene sensor [39] which used over-oxidised polyrrole and Ag-Au bimetallic nanoparticle
composite electrode. In another study using an immunosensors prepared on graphenated-chitosan modified
with poly(amidoamine) dendrimer (PAMAM) [41], an LOD of 0.003 µM and DLR of 0.005 – 6.0 6 μM were
reported for benzo[a]pyrene determination. Considering that immunosensors are highly sensitive, the similarity
between the lower DLR values of the graphenated-chitosan immunosensors (0.005 μM) and the graphenated
polyaniline electrode (0.0044 μM) confirms the importance of the graphene electrode. Kizek and co-workers
[42] reported the determination of methylanthracene and benzo[a]anthracene by HPLC using
electrochemical (HPLC-ED) and UV-Vis (HPLC-UV) detectors. For HPLC-UV the DLR (and LOD)
values were 6.833 – 438.04 µM (20 M) and 8.114 – 520.13 M (30 M), for methylanthracene and
benzo[a]anthracene, respectively. The DLR (and LOD) values reported for the HPLC-ED techniques were
0.68 -87.61 µM (0.01 M) for methylanthracene and 4.06 – 520.13 M (5 M) for benzo[a]anthracene.
These results show that the GR-PANI sensor system exhibited similar wide linear range and low detection
limit as those of overoxidised polypyrrole/Ag-AuNPs composite electrode system, and the HPLC-UV and
HPLC-ED methods reported by Kizek and co-worker. However, the graphenated-polyaniline electrode
exhibited higher sensitivity and extended DLR. In addition the DLR and LOD values of the GR-PANI
sensor cover the limits set by the United States Environmental Protection Authority‟s (USEPA) for PAH‟s
in water (0.0561 – 0.224 µM anthracene) [43].
3.6. Reproducibility, Stability and Interference Studies
Stability and reproducibility studies were performed by the analysis of 3 successive measurements (n =
3) of the CV responses of the GR-PANI|GCE sensor to 100 µM anthracene. A relative standard deviation
of 1.5% was obtained, which indicates excellent reproducibility of the CV measurements. The sensor
response was also measured for a period of 3 weeks during which measurements were made at 4-day
intervals in order to ascertain the storage stability of the sensor. The GR-PANI|GCE sensor system was
stored in the refrigerator at 4 C in between measurements. During the 3-week storage period, the sensor
retained 89% of the magnitude of its original signal. Mn2+,
Cl−, SO4
2− and NO
3−ions did not exhibit any
interference with the detection of 100 µM anthracene.
4. CONCLUSION
This study introduced a new class of electroactive platform (graphenated electroactive polymers) for the
development of electrochemical sensor systems. Extensive dynamic linear range and high sensitivity of
this sensor, which seems to be due to the unique catalytic property of graphene, offer the possibility of its
application in the analysis of environmental sample matrices that have a wide range of analyte

Page 10 of 28
Accep
ted
Man
uscr
ipt
concentration. There is also an observed linear dependence of anodic shift of the sensing potential on
anthracene concentration. This phenomenon predisposes the graphenated polyaniline electrode to
application as a voltammetric sensor.
ACKNOWLEDGEMENT
The authors acknowledge the National Research Foundation of South Africa (NRF) and the Water
Research Commission of South Africa (WRC) for grants.
REFERENCES
[1] V. Vestreng, H. Klein, Emission data reported to UNECE/EMEP: Quality assurance and trend analysis
and presentation of WebDab, MSC-W Status Report 2002. http://www.eea.europa.eu/data-and-
maps/figures/ecosystem-protection-against-acidification/@@rdf.
[2] S. Xu, W. Liu, S. Tao, Emission of polycyclic aromatic hydrocarbons in China, Environ. Sci. Technol.
40 (2006) 702-708. pubs.acs.org/doi/abs/10.1021/es0517062.
[3] A. Mastral, T. García, M. Callén, M. Navarro, J. Galbán, Removal of naphthalene, phenanthrene and
pyrene by sorbents from hot gas, Environ. Sci. Technol. 35 (2001) 2395-2400.
pubs.acs.org/doi/abs/10.1021/es000152u.
[4] J. C. Fetzer, Large (C= 24) Polycyclic Aromatic Hydrocarbons: Wiley-Interscience: New York, 2000.
DOI:10.1021/jf00118a049.
[5] P. Plaza-Bolaños, A. G. Frenich, J. L. M. Vidal, Polycyclic aromatic hydrocarbons in food and
beverages. Analytical methods and trends, J. Chromatogr. A, 1217 (2010) 6303-6326. DOI:
10.1016/j.chroma.2010.07.079.
[6] C.-E. Boström, P. Gerde, A. Hanberg, B. Jernström, C. Johansson, T. Kyrklund, A. Rannug, M.
Törnqvist, K. Victorin, R. Westerholm, Cancer risk assessment, indicators, and guidelines for
polycyclic aromatic hydrocarbons in the ambient air, Environ. Health Perspect. 110 (2002) 451-488.
www.ncbi.nlm.nih.gov/pubmed/12060843.
[7] R. E. Bain, S. W. Gundry, J. A. Wright, H. Yang, S. Pedley, J. K. Bartram, Accounting for water
quality in monitoring access to safe drinking-water as part of the millennium development goals:
lessons from five countries, Bull. WHO, 90 (2012) 228-235. DOI: 10.2471/BLT.11.094284.
[8] S. Bhadra, D. Khastgir, N. K. Singha, J. H. Lee, Progress in preparation, processing and applications of
polyaniline, Prog. Polym. Sci. 34 (2009) 783-810.
http://dx.doi.org/10.1016/j.progpolymsci.2009.04.003.

Page 11 of 28
Accep
ted
Man
uscr
ipt
[9] M. Pumera, R. Scipioni, H. Iwai, T. Ohno, Y. Miyahara, M. Boero, A mechanism of adsorption of
β‐nicotinamide adenine dinucleotide on graphene sheets: Experiment and theory, Chem. Eur. J. 15
(2009) 10851-10856. DOI: 10.1002/chem.200900399
[10] L. Tang, Y. Wang, Y. Li, H. Feng, J. Lu, J. Li, Preparation, structure, and electrochemical properties of
reduced graphene sheet films, Adv. Funct. Mater. 19 (2009) 2782-2789. DOI: 10.1002/adfm.200900377
[11] A. K. Geim, K. S. Novoselov, The rise of graphene, Nature Mater. 6 (2007) 183-191. DOI
:10.1038/nmat1849
[12] C. Shan, H. Yang, D. Han, Q. Zhang, A. Ivaska, L. Niu, Graphene/AuNPs/chitosan nanocomposites
film for glucose biosensing, Biosens. Bioelectron. 25 (2010) 1070-1074. DOI:
10.1016/j.bios.2009.09.024
[13] D. S. Patil, J. Shaikh, S. Pawar, R. Devan, Y. Ma, A. Moholkar, J. Kim, R. Kalubarme, C. Park, P.
Patil, Investigations on silver/polyaniline electrodes for electrochemical supercapacitors, Phys. Chem.
Chem. Phys. 14 (2012) 11886-11895. DOI: 10.1039/c2cp41757j
[14] S. Virji, J. Huang, R. B. Kaner, B. H. Weiller, Polyaniline nanofiber gas sensors: examination of
response mechanisms, Nano Lett. 4 (2004) 491-496. DOI: 10.1021/nl035122e
[15] D.-W. Wang, F. Li, J. Zhao, W. Ren, Z.-G. Chen, J. Tan, Z.-S. Wu, I. Gentle, G. Q. Lu, H.-M. Cheng,
Fabrication of graphene/polyaniline composite paper via in situ anodic electropolymerization for high-
performance flexible electrode, ACS Nano. 3 (2009) 1745-1752. DOI: 10.1021/nn900297m.
[16] K. Zhang, L. L. Zhang, X. Zhao, J. Wu, Graphene/polyaniline nanofiber composites as supercapacitor
electrodes, Chem. Mater. 22 (2010) 1392-1401. DOI.org/10.1021/cm902876u
[17] J. Yan, T. Wei, B. Shao, Z. Fan, W. Qian, M. Zhang, F. Wei, Preparation of a graphene
nanosheet/polyaniline composite with high specific capacitance, Carbon, 48 (2010) 487-493.
DOI:10.1016/j.carbon.2009.09.066.
[18] C. Vall s P. im ne E. Mu o , A. M. Benito, W. K. Maser, Simultaneous reduction of graphene
oxide and polyaniline: doping-assisted formation of a solid-state charge-transfer complex, J. Phys.
Chem. C, 115 (2011) 10468-10474. DOI: 10.1021/jp201791h.
[19] D. Li, M. B. Mueller, S. Gilje, R. B. Kaner, G. G. Wallace, Processable aqueous dispersions of
graphene nanosheets, Nat. Nanotechnol. 3 (2008) 101-105. DOI :10.1038/nnano.2007.451.
[20] H. J. Shin, K. K. Kim, A. Benayad, S. M. Yoon, H. K. Park, I. S. Jung, M. H. Jin, H. K. Jeong, J. M.
Kim, J. Y. Choi, Efficient reduction of graphite oxide by sodium borohydride and its effect on electrical
conductance, Adv. Funct. Mater. 19 (2009) 1987-1992. DOI: 10.1002/adfm.200900167.

Page 12 of 28
Accep
ted
Man
uscr
ipt
[21] Y. G. Wang, H. Q. Li, Y. Y. Xia, Ordered whisker-like polyaniline grown on the surface of
mesoporous carbon and its electrochemical capacitance performance, Adv. Mater. 18 (2006) 2619-
2623. DOI: 10.1002/adma.200600445.
[22] S. Stankovich, D. A. Dikin, R. D. Piner, K. A. Kohlhaas, A. Kleinhammes, Y. Jia, Y. Wu, S. T.
Nguyen, R. S. Ruoff, Synthesis of graphene-based nanosheets via chemical reduction of exfoliated
graphite oxide, Carbon, 45 (2007) 1558-1565. DOI: 10.1039/C1RA00934F.
[23] G. Wang, S. Zhuo, W. Xing, Graphene/polyaniline nanocomposite as counter electrode of dye-
sensitized solar cells, Adv. Mater. 69 (2012) 27-29. DOI:10.1016/j.matlet.2011.11.086.
[24] A. A. Shah, R. Holze, Spectroelectrochemistry of two-layered composites of polyaniline and poly(o-
aminophenol), Electrochim. Acta. 53 (2008) 4642-4653. DOI:10.1016/j.electacta.2008.01.076.
[25] E. I. Iwuoha, D. Saenz de Villaverde, N. P. Garcia, M. R. Smyth, J. M. Pingarron, Reactivities of
organic phase biosensors. 2. The amperometric behavior of horseradish peroxidase immobilised on a
platinum electrode modified with an electrosynthetic polyaniline film, Biosens. Bioelectron. 12 (1997)
749-761.
[26] A. J. Bard, L. R. Faulkner, Electrochemical methods: fundamentals and applications. Wiley, New
York, 1980. DOI:10.1016/0376-4583(83)90080-8.
[27] E. I. Iwuoha, S. E. Mavundla, V. S. Somerset, L. F. Petrik, M. J. Klink, M. Sekota, P. Bakers,
Electrochemical and spectroscopic properties of fly ash–polyaniline matrix nanorod composites,
Microchim. Acta. 155 (2006) 453-458. DOI: 10.1007/s00604-006-0584-z.
[28] R. Ehret, W. Baumann, M. Brischwein, A. Schwinde, K. Stegbauer, B. Wolf, Monitoring of cellular
behavior by impedance measurements on interdigitated electrode structures, Biosens. Bioelectron. 12
(1997) 29-41. DOI:10.1016/0956-5663(96)89087-7
[29] X. Kang, Z. Mai, X. Zou, P. Cai, J. Mo, A novel glucose biosensor based on immobilization of glucose
oxidase in chitosan on a glassy carbon electrode modified with gold–platinum alloy
nanoparticles/multiwall carbon nanotubes, Anal. Biochem. 369 (2007) 71-79. DOI:
10.1016/j.bioelechem.2008.08.007.
[30] L. Wang, E. Wang, Direct electron transfer between cytochrome c and a gold nanoparticles modified
electrode, Electrochem. Commun. 6 (2004) 49-54. DOI:10.1016/j.elecom.2003.10.004
[31] W. Chen, L. Yan, P. R. Bangal, Preparation of graphene by the rapid and mild thermal reduction of
graphene oxide induced by microwaves, Carbon, 48 (2010) 1146-1152.
DOI:10.1016/j.carbon.2009.11.037
[32] J. Yin, X. Zhao, X. Xia, L. Xiang, Y. Qiao, Electrorheological fluids based on nano-fibrous
polyaniline, Polym. J. 49 (2008) 4413-4419. DOI: 10.1016/j.polymer.2008.08.009.

Page 13 of 28
Accep
ted
Man
uscr
ipt
[33] C. M. Willemse, K. Tlhomelang, N. Jahed, P. G. Baker, E. I. Iwuoha, Metallo-graphene nanocomposite
electrocatalytic platform for the determination of toxic metal ions, Sensors, 11 (2011) 3970-3987. DOI:
10.3390/s110403970.
[34] K. Subrahmanyam, S. Vivekchand, A. Govindaraj, C. Rao, A study of graphenes prepared by different
methods: characterization, properties and solubilization, J. Mater. Chem. 18 (2008) 1517-1523. DOI:
10.1039/B716536F.
[35] P. Bouvrette, S. Hrapovic, K. B. Male, J. H. Luong, Analysis of the 16 environmental protection
agency priority polycyclic aromatic hydrocarbons by high performance liquid chromatography-oxidized
diamond film electrodes, J. Chromatogr. A, 1103 (2006) 248-256. DOI: 10.1016/j.chroma.2005.11.028.
[36] J. Costa, A. Sant'Ana, P. Corio, M. Temperini, Chemical analysis of polycyclic aromatic hydrocarbons
by surface-enhanced raman spectroscopy, Talanta, 70 (2006) 1011-1016.
HTTP://dx.doi.org/10.1016/j.talanta.2006.01.036.
[37] C. A. Paddon, C. E. Banks, I. G. Davies, R. G. Compton, Oxidation of anthracene on platinum macro-
and micro-electrodes: Sonoelectrochemical, cryoelectrochemical and sonocryoelectrochemical studies,
Ultrason. Sonochem. 13 (2006) 126-132. DOI: 10.1016/j.ultsonch.2005.01.002.
[38] D. S. Cordeiro, P. Corio, Electrochemical and photocatalytic reactions of polycyclic aromatic
hydrocarbons investigated by raman spectroscopy, J. Braz. Chem. Soc. 20 (2009) 80-87.
HTTP://dx.doi.org/10.1590/S0103-50532009000100014.
[39] S. N. Mailu, T. T. Waryo, P. M. Ndangili, F. R. Ngece, A. A. Baleg, P. G. Baker, E. I. Iwuoha,
Determination of anthracene on Ag-Au alloy nanoparticles/overoxidized-polypyrrole composite
modified glassy carbon electrodes, Sensors, 10 (2010) 9449-9465. DOI: 10.3390/s101009449.
[40] N. G. Mathebe, A. Morrin, E. I. Iwuoha, Electrochemistry and scanning electron microscopy of
polyaniline/peroxidase-based biosensor, Talanta, 64 (2004) 115-120. DOI:
10.1016/j.talanta.2003.11.050.
[41]O. Zitka, P. Babula, J. Sochor, M. Kummerova, O. Krystofova, V. Adam, L. Havel, M. Beklova, J.
Hubalek, R. Kizek, Determination of eight polycyclic aromatic hydrocarbons and in pea plants (Pisum
sativum L.) extracts by high performance liquid chromatography with electrochemical detection. Int. J.
Electrochem. Sci., 7 (2012) 908-927. http://www.electrochemsci.org/papers/vol7/7020908.pdf
[42] M. Lin, Y. Liu, Z. Yang, Y. Huang, Z. Sun, Y. He, C. Ni. Construction of sensitive amperometric
immunosensor based on poly(amidoamine) dendrimer and one-step ionic-liquid-assisted
graphene/chitosan platform for benzo[a]pyrene detection. Int. J. Electrochem. Sci., 7 (2012) 965-978.
http://www.electrochemsci.org/papers/vol7/7020965.pdf

Page 14 of 28
Accep
ted
Man
uscr
ipt
[43]K. Gehle, Agency for Toxic Substances and Disease Registry (ATSDR) Case Studies in Environmental
Medicine: Toxicity of Polycyclic Aromatic Hydrocarbons (PAHs). USA Department of Health and
Human Services Agency for Toxic Substances and Disease Registry Division of Toxicology and
Environmental Medicine, 2009. http://www.atsdr.cdc.gov/csem/pah/

Page 15 of 28
Accep
ted
Man
uscr
ipt
TITLE OF SCHEMES
Scheme 1. Schematic illustration of the synthesis of GR-PANI nanocomposite via in situ polymerisation.
FIGURE TITLES
Fig. 1. Cyclic voltammograms of (a) GCE (innermost CV) and GR|GCE at scan rates of (i)10, ( ii) 20, (iii)
30, (iv) 40 and (v) 50 mV s-1
; (b) GCE, PANI|GCE and GR-PANI|GCE at 50 mV s-1
in 1 M HCl; and (c)
GR-PANI|GCE in 1 M HCl at scan rates of (i) 10, (ii) 20, (iii) 30, (iv) 40, (v) 50 and (vi) 100 mV s-1
.
Fig. 2. Nyquist plots of the EIS data of (a) GCE, (b) PANI|GCE and (c) GR-PANI|GCE in 1 M HCl. The
inset is the Randle‟s equivalent circuit used for fitting the Nyquist plots.
Fig. 3. SEM images of (a) GO, (b) GR, (c) GR-PANI and (d) PANI.
Fig. 4. HRTEM pictures of (a) GO, (b) GR, (c) PANI and (d) GR-PANI.
Fig. 5. FTIR spectra of (a) GR, (b) GR-PANI, (c) PANI and (d) GO.
Fig. 6. AFM image of graphene sheets on silicon substrate and the plot of the cross-sectional height profile.
Fig. 7. XRD patterns of (a) GR, (b) PANI and (c) GR-PANI.
Fig. 8. Suggested mechanism for the electro-oxidation of anthracene.
Fig. 9. CVs of (a) GCE and (b) GR-PANI|GCE in 0 µM anthracene. CVs of (c) PANI|GCE and (d) GR-
PANI|GCE in 100 µM anthracene. Experimental conditions: 0.1 M LiClO4 in acetonitrile/water (80:20 v/v)
and scan rate of 50 mV s-1
.
Fig. 10. Scan rate dependence of the CV responses of GR-PANI|GCE sensor for 100 µM anthracene.
Experimental conditions: 0.1 M LiClO4 in acetonitrile/water (80:20 v/v). Numbers on the plots are scan
rates in mV s-1
.
Fig. 11. A Randel-Sevčik plot of the anodic peak currents of the CV‟s in Fig. 10.
Fig. 12. CV responses of GR-PANI|GCE sensor for (a) 20 - 100 µM and (b) 200 - 1000 µM anthracene.
Experimental conditions: 0.1 M LiClO4 in acetonitrile/water (80:20 v/v). (Scan rate of 50 mV s-1
).

Page 16 of 28
Accep
ted
Man
uscr
ipt
Fig. 13. SWV responses of GR-PANI|GCE sensor for 20 - 1000 µM anthracene. Experimental conditions:
0.1 M LiClO4 in acetonitrile/water (80:20 v/v). (SW frequency = 5 Hz and SW amplitude = 25 mV).
Fig. 14. A calibration plot of the GR-PANI|GCE sensor for 0.012 - 1000 µM anthracene.

Page 17 of 28
Accep
ted
Man
uscr
ipt
LIST OF SCHEMES
Scheme 1.
Aniline monomer Polyaniline (PANI)
graphene oxide-Polyaniline
(NH4)2S2O8,
Stir for 12 h
Sonicate , 30 min
O
O O O
O
O
O
OOO HO
O
HO
O H OH OH
OH
OH
OHHOHO
OH
HO
OH
HO
O H
O O
OHOH
Graphene oxide Graphene Graphene polyaniline (GR-PANI) Tem image

Page 18 of 28
Accep
ted
Man
uscr
ipt
LIST OF FIGURES
Fig 15.
(a)
(b) (c)

Page 19 of 28
Accep
ted
Man
uscr
ipt
Fig. 2.

Page 20 of 28
Accep
ted
Man
uscr
ipt
Fig. 3.

Page 21 of 28
Accep
ted
Man
uscr
ipt
Fig. 4.
Fig. 5.

Page 22 of 28
Accep
ted
Man
uscr
ipt
Fig. 6.

Page 23 of 28
Accep
ted
Man
uscr
ipt
Fig. 7.

Page 24 of 28
Accep
ted
Man
uscr
ipt
Fig. 8.
Page 25 of 28
Accep
ted
Man
uscr
ipt
Fig. 9.
Fig. 10.

Page 26 of 28
Accep
ted
Man
uscr
ipt
Fig. 11.
Fig. 12.
(b)
(a)

Page 27 of 28
Accep
ted
Man
uscr
ipt
Fig. 13.
Fig. 14.

Page 28 of 28
Accep
ted
Man
uscr
ipt
PAPER TITTLE: Electro-oxidation of Anthracene on Polyanilino-Graphene Composite
Electrode
Highlights
Graphenated (GR)-polyaniline (PANI) was electro-synthesised on glassy carbon electrode
(GCE).
The GR-PANI|GCE functioned as anthracene sensor by electro-oxidation mechanism.
A sensor dynamic linear range of 0.012 – 1000 µM anthracene was obtained.