electricity poverty reduction as an indicator of progress
TRANSCRIPT
Electricity poverty reduction as an indicator of progresstowards the Sustainable Development Goal 7: Vietnam,
2008-2018.
Ha-Duong Minh 1, 2 Nguyen Hoai Son 3
2021-03-19
AbstractWe estimate the reduction of electricity poverty in Vietnam from 2008 to 2018 using national household surveys. We find that in 2018, the fraction of households with access to electricity was over 98% (up from 96.5% in 2010). The median level of electricity usage was 139 kWh per month per household (up from 74 kWh in 2010), enough to access high power appliances like a washing machine or microwave. The electricity bill weighted less than 6% of income for 92.1% of households (down from 97.7% in 2010). In statistical terms, the electricity consumption distribution was closer to uniform than the income distribution: energy inequality is lower than income inequality. In 2014, the fraction of households declaring unsatisfied electricity needs was below three per cent. Few households cannot afford to turn on fans or air conditioner during a heatwave. The engineering, economic and socio-political perspectives converge to indicate that electricity poverty was not an acute social issue in 2018. Vietnam has mostly satisfied the universal electricity access facet of the Sustainable Development Goal 7: Affordable and clean energy for all (SDG7). The electricity subsidy mechanism contributes more to alleviating poverty (SDG1) than to SDG7.
Keywords :Electricity poverty, Vietnam, Sustainable Development Goals, Indicators
Primary JEL code :Q41, Q48, Q56
1 Corresponding author. < [email protected] >. CIRED/CNRS, Campus du Jardin Tropical, 45 avenue de la Belle Gabrielle, 94736 Nogent sur Marne CEDEX, France. Tel. (VN) +84 16 26 38 77 84 ; (FR) +33 668 52 59 15. Fax (FR) +33 1 43 84 73 70.
Familly name underlined.
2 Centre International de Recherche sur l’Environnement (CIRED/CNRS), Paris, France.
3 National Economic University, Hanoi, Vietnam.
1
3
6
9
12
15
18
21
3
6
1. IntroductionEnsure access to affordable, reliable, sustainable and modern energy – in short, Affordable and clean energy – is the seventh United Nations Sustainable D evelopment G oal , one of our overarching civilization goals set at the beginning of this millennium. This text examines one facet of Vietnam’s progress towards the Sustainable Development Goal 7 (SDG7): energy poverty reduction.
Vietnam is a Southeast Asia country comprising almost a hundred million people. Its GDP per capita was 2 715 USD in 2019 (World Bank database, accessed 2021-02-08). Economic and political reforms launched in 1986 have transformed Vietnam from one of the world’s poorest nations to a lower-middle-income country. Its development since then has been highly successful in economic terms. In constant local currency, GDP grew by 541% from 1986 to 2019. Table 1 provides more details on the country’s trajectory.
While it represents only 1.25% of the world’s total population, Vietnam’s story may inspire many countries and economists. How did this economic growth translate in terms of sustainable development regarding energy poverty reduction? What can we learn from this case for the general academic debates around energy poverty?
Vietnam’s rural electrification program is oft-cited as an outstanding success in providing energy access (Đoàn 2010; Asian Development Bank. 2011). However, in the considerable academic literature on energy poverty, we found few studies about Vietnamese households among the reports on China, India, Brazil and South Africa (Li, Pan, and Wei 2015; Sovacool et al. 2011).
Lê Việt Phú (2020) investigated the residential electricity demand in Vietnam using a different microdata source, the 2015 VHRS World Bank survey. He found that demand is elastic to average and marginal prices and confirmed that income elasticity is positive. We will look at the residential demand from a different perspective –energy poverty– using different data: the Vietnam Households Living Standard Surveys (VHLSS) from 2008 to 2018.
Son and Yoon (2020) examined the determinants of inequality in Vietnamese households electricity consumption, using VHLSS data from 1993 to 2004. Inequality can be defined, at the population level, by how much the statistical distribution of consumption deviates from the uniform distribution. They found that a) electricity consumption increased more than proportionally with income, and b) the inequality of electricity consumption was larger than income inequality. As the period studied is characterized by continuous grid expansion, increasing electricity access, Son and Yoon warned that increasing access could increase inequality as the wealthier households benefited more from the opportunity. Those who cannot afford to buy electric appliances benefit less from rural electrification. Our analysis of more recent data corroborates their first finding: electricity use increased
2
24
27
30
33
36
39
42
45
48
51
54
57
60

faster than income between 2008 and 2018. We do not confirm their second finding. In 2018, electricity consumption inequality seemed comparable to or less than income inequality (see Supplementary_Figure 5).
T. T. Nguyễn et al. (2019) analyzed Vietnamese households’ transition out of energy poverty, using VHLSS results from 2004 to 2016. They found that “Electricity poverty has decreased, but energy-cost poverty has increased.” Our analysis vindicates these findings. We clarify and confirm the discrepancy between electricity poverty and electricity-cost poverty using more recent data. In addition, we explore a third definition of electricity poverty, related to the subjective question “Are the electricity needs of a household met?”
Section 2 defends the theoretical and practical qualities of this third definition of electricity poverty. We embed the problem of measuring progress towards the SDG7 within the literature on energy poverty. We argue that subjective indicators can be as relevant as indicators based on engineering or economic variables. Section 3 presents the VHLSS data and methods.
Section 4 adopts an engineering perspective, looking at grid access and kWh consumed. We find that in 2018 the fraction of households with access to electricity was over 98%, and the median level of electricity usage was 139 kWh per month per household. Section 5 adopts an economic perspective, looking at income and expenditures. We find that in 2018, for 92% of households, the electricity bill weights less than 6% of income. Section 6 adopts a socio-political perspective, looking at satisfaction with electricity consumption. We find that in 2014 the fraction of households declaring that their electricity use did not meet their needs was below three per cent. Section 7 discusses the interactions between the three perspectives. We note that the socio-political perspective shows aspects of the SDG7 situation in a country that purely objective engineering or economic indicators can miss.
Section 8 discusses the results. We find that in Vietnam, the three points of view converge to indicate that electricity poverty is not an acute social issue at the moment and that the electricity subsidy in place works more to alleviate economic poverty than to satisfy energy needs. Regarding the debates on energy poverty, the case confirms that the ratio “electricity bill over income” is a problematic indicator. It further suggests that there are two kinds of indicators. To follow progress on SDG7 at the macro scale, the proportion of households declaring that “their electricity consumption met the needs” complements the existing indicator based on grid access. To target households’ energy subsidies, indicators based on income or/and electricity consumption are more operational.
Section 9 summarizes and concludes, looking at the challenges ahead. They include providing air conditioning access for destitute urban households during heatwaves, limiting the electricity bill’s rise in households’ budgets, and finding a just burden-sharing between electricity consumers to finance the system’s expansion.
3
63
66
69
72
75
78
81
84
87
90
93
96

4
Table 1: Vietnam’s economy and electricity conditions in 2008-2018.Economic and political reforms launched in 1986 have transformed Vietnam from one of the world’s poorest nations to a lower-middle-income country. Source GSO, accessed 2021-02-08.
Year 2008 2010 2012 2014 2016 2018
Population(Thous. pers.)
85 119 86 947 88 809 90 729 92 695 94 666
GDP at constant 2010 prices, trillion Dongs
1 889 2 158 2 413 2 696 3 054 3 493
Consumer price index,base 100 in 2007
123 144 186 206 213 228
Share of population in urban areas
29.0 % 30.5 % 31.8 % 33.1 % 33.9% 34.5%
Electricity production, annual
71.0 TWh 91.7 TWh 115.1 TWh 141.2 TWh 175.7 TWh 209.2 TWh
Electricity production, annual per person
834 kWh 1 055 kWh 1 297 kWh 1 557 kWh 1 896 kWh 2 221 kWh

2. What is access to clean and affordable energy for all?
Universal access to electricity is sought at the early stages of economic development because it is an enabler. Lighting and electric engines increase productivity. Radio communication connects people. An electric fan in advanced cookstoves reduces the indoor air pollution caused by inefficient combustion in traditional biomass. Full electric cooking eliminates it in urban areas. Refrigeration expands farmers’ commercial opportunities.
To focus the international community’s attention on the need to provide these benefits to all humans, the United Nations have adopted « Ensure access to affordable, reliable, sustainable, and modern energy for all » as Sustainable Development Goal 7 (SDG7). The Sustainable Development Solutions Network (SDSN 2015, 137–40) defined four performance indicators to assess progress towards this goal :
• Indicator 50: Share of the population with access to modern cooking solutions (%)
• Indicator 51: Share of the population with access to reliable electricity, by urban and rural (%)
• Indicator 52: Implicit incentives for low-carbon energy in the electricity sector (measured as US$/MWh or US$ per ton avoided CO2)
• Indicator 53: Rate of primary energy intensity improvement
While all four dimensions of SDG7 are important, this manuscript focuses specifically on the aspect measured by indicator 51: sufficiency of households’ electricity consumption. The Vietnam Households Living Standards Surveys (VHLSS) provide an estimate for this indicator 51. VHLSS includes a question about the primary source of lighting. We will take it as a proxy for access to reliable electricity, as electric lighting is better than kerosene lamps or any other source. We will return to indicator 51 in the next sections (see Figure 1 and Table 5).
“Access to reliable electricity Y/N?” is a black and white question. This lead to an indicator convenient for international comparison. In a national context, the SDG7 has more meanings to unpack. Access says nothing about The academic literature on energy poverty – the affordable part of the goal statement – offers ways to discuss SDG7 with more nuances.
Atkinson (1987) explains that poverty can be seen as a concern about basic needs, which are multidimensional: food, housing, and clothing. Under this viewpoint, energy poverty can be seen as deprivation of the energy needs for their survival. Energy-poor households cannot afford to fight cold in winter or heat in summer. How can we measure in a scientific way the magnitude of energy poverty in a given country? Four operational approaches are popular:
The first approach is to estimate “basic needs” directly by calculating the minimum amount of energy services required for a household. Bravo et al. (1983), cited in He and Reiner (2016),
5
99
102
105
108
111
114
117
120
123
126
129
132
enumerate energy needs as preparation and preservation of food and supply of water; space conditioning; personal cleanliness; and recreation and social communication. Pachauri et al. (2004) computed the power requirements for energy services of a five-member household such as “scooter 5km/day”, “Lighting, one electric bulb (5h/day, 40W)” “Lighting, 1–2 kerosene lamps”.
This basic needs direct estimate approach is appropriate on a case-by-case basis, at the scale of communities but not for international statistics. Different societies have different views on what kinds of energy services constitute basic needs. Needs vary with climate, region, household demography and even ethnocultural habits (Pachauri et al. 2004). Asking experts about the local conditions is open to subjectivity and lack legitimacy.
The second approach sets up absolute thresholds for the total amount of energy consumption regardless of the consumption components. Energy-poor households are those consuming less than X kWh per year, where X depends on the country’s economic conditions. Foster et al. (2000) define the threshold as the average energy consumption of households having expenditure per capita which falls within 10% of the official expenditure poverty line. This method is convenient. A poverty line is readily available in every country. However, the underlying assumption that income-poor households are also energy-poor households is not always valid (Khandker, Barnes, and Samad 2012).
The third approach sets up relative thresholds. Energy-poor households are those spending more than X % of their income on energy bills. DTI (2007) states that a household is in energy poverty if it spends more than 10% of its income on paying the energy bill, including electricity and fuel for heating and cooking, excluding transportation. This threshold has been set out officially in the UK Fuel Poverty Strategy 2001, according to the critical study by (Hills 2012). France also used this approach, according to ONPE (2016).
This approach is simple and easy to apply. Provided that one accepts the 10% reference point for what it is –a convenient rule of thumb– this approach allows to assess the magnitude of the energy affordability issue from national-scale statistics.
However, the approach neglects the role of factors such as energy efficiency or price changes. In addition, the ratio is quite arbitrary. It is easy to link the ratio of electricity bill over income (budget effort) with the risk of social unrest over high energy prices. There is no universal truth defining what should be considered a high share of electricity in a household budget.
The fatal flaw with that definition of energy poverty is its high rate of false positives. The idea that a poor household spends a higher fraction of income on energy than a richer household is only valid on average. Many consumers with a relatively high electricity bill are affluent households living large. This is why Hill (2012) led the UK to replace the 10 % of income criteria by a new definition under which households are considered fuel poor if a/
6
135
138
141
144
147
150
153
156
159
162
165
168
171
They have required fuel costs that are above the median level, and b/ Were they to spend that amount they would be left with a residual income below the official poverty line. France also used this Low-Income High-Cost definition (Chérel 2014).
The fourth approach is demand-based. It estimates demand functions to identify the fixed quantities of goods that households must consume and consider the quantities as subsistence levels. One way to estimate the subsistence level is to use the Stone-Geary model, which considers the subsistence level of a good is the level of consumption that is perfectly inelastic to price. The Stone-Geary model has been frequently used to estimate residential water demand (Martínez-Espiñeira* and Nauges 2004; Dharmaratna and Harris 2012; Hung and Chie 2013). However, the Stone-Geary model is only appropriate for inelastic demand (Gaudin, Griffin, and Sickles 2001). Thus, under the condition that electricity demand is inelastic, the Stone-Geary model can identify a basic needs level.
Another way is to use Barnes et al. (2011)’s way to identify the subsistence level without the restriction of inelastic demand. They define the concept of energy poverty as “the threshold point at which energy consumption begins to rise with increases in household income”. The core idea is to find a portion of electricity use inelastic to income rather inelastic to price as in the Stone-Geary model. Several researchers have applied the concept to implement in different databases, such as Khandker et al. (2012) for energy poverty in Bangladesh, He and Reiner (2016) for electricity poverty in China, Nguyen (2019) for electricity poverty in Vietnam.
The approach is sensitive to model selection but has some advantages in comparison to other methods. First, it is simple since it depends on micro survey data, which are available in every country. Second, it can avoid the problem of arbitrary choices as relative threshold methods. Besides, it is better than the direct approach since it does not impose any requirement of basic-needs baskets. Households choose their own “basic needs” baskets. What we do is observe household behaviours.
The four approaches to energy poverty reviewed above are based purely on energy quantities, monetary indicators or their combination. They all come from an engineering or econometric approach. This is also the case for Multidimensional Energy Poverty Indices proposed in (Nussbaumer, Bazilian, and Modi 2012; Foster, Tre, and Wodon 2000; Pachauri et al. 2004) or Multi-tier Matrix for Measuring Access to Household Electricity Supply attributes in (Bathia and Angelou 2015). More generally, engineering and econometric objectivist approaches dominate the literature on sustainability monitoring. Out of 232 Sustainable Development Goal Indicators, only two are subjective (10.3.1 and 16.7.2).
Yet, subjectivity matters. The quality of energy services is defined by the satisfaction of their users, not in terms of electricity or money quantities. Humanities and social sciences have long integrated the need to include the subjects’ voice into their research methods,
7
174
177
180
183
186
189
192
195
198
201
204
207

including socio-political opinion surveys. Surveys provide objectively repeatable measurements: two independent survey companies applying the same method will find very close results. (Vignon 2014) argues that in Europe, a subjective indicator of “being cold in winter” is relevant and has been used in France and Ireland.
We argue that concerning indicator 51, the definition Share of households replying positively to the question “In the last month, did your consumption of electricity meet the needs of your household?” is a better definition than the classical definition “Share of population with access to reliable electricity”. It is better because it is more specific: it prescribes an unambiguous way to measure the phenomenon. The concepts of “access” and “reliable” used in the classical definition leave room for interpretation. It is not clear if “access” is only the physical connection to the grid or also the economic means to pay for electricity. Furthermore, “reliable” is vague. Is there a threshold of outage minutes per year? If extreme weather in winter can cause a blackout, as in Texas, at which probability shall access be considered reliable? Do we even have probabilities?
Indicators based on grid presence, energy used, or income may seem more precise than indicators based on subjective self-assessment. There is lots of prejudice in the opposition between engineering and humanities. Engineering-based indicators also suffer from imprecision and declaration biases when collected by declarative survey. Regarding the basic needs approach, to determine the adequacy of someone’s habitat objectively, one has to examine its floorplan, building material, insulation, heating, ventilation systems, the local climate, and the age of the inhabitants. It is much simpler just to ask.
Leaving it up to respondents to assess the “needs of your household” resolves the central problem of defining a “basic needs” level. Households themselves know best if their electricity needs were met. Multidimensional Energy Poverty Indexes rely on normative aggregation methods that are hard to justify, whereas households have the legitimacy to integrate the different aspects of their energy consumption experience. Rebound effects in rural electrification projects show that needs are subjective and relative. Needs expand with economic development.
Contrary to objective and absolute definitions of basic needs, indicators defined by self-assessed satisfaction of needs can be used at different income levels, within and across countries. Ensuring access to modern energy – the SDG7 – does not mean bringing the grid close to all houses, as Indicator 51 measures. It means everyone receives a satisfying provision of energy services.
8
210
213
216
219
222
225
228
231
234
237
240

3. Data and method
In light of the previous discussion, we will examine progress towards the SDG7 in Vietnam using three approaches. From an engineering point of view, we will look at access and quantity of electricity consumption. From an economic point of view, we will look at the share of electricity in the household budget. From a socio-political point of view, we will look at the electricity customer satisfaction, in the form of the answer to the question “In the last month, did your consumption of electricity meet the needs of your household?”.
The data used to produce all results presented below come from periodic national population surveys: the Household Living Standards Surveys (General Statistics Office 2019). Conducted under the Ministry of Planning and Investment by the official national statistics office, the surveys aim to systematically collect basic information about population and housing as a basis for research and for assessing and formulating policy mechanisms, programs, targets and plans on national socio-economic development generally, and for the population and housing sectors in particular. It is independent of EVN, the national electricity company.
In 2008 the survey had two waves lasting two months each, starting in May and September. In 2014 there were four waves of one month, in March, June, September and December. This reduces the seasonality bias of energy consumption. Assignment of households into waves was random.
The question on needs met was asked in 2010, 2012, 2014 only.
We did not weight answers, de-bias or otherwise adjusted the data except by clipping outlying values and dropping missing responses. Clipping does not affect the counts and quantiles, but non-responses are known to affect survey results. We were not involved in the data collection.
The results we present below are subject to systematic and random errors unavoidable in all survey data (Kasprzyk 2005). We did not attempt to quantify these errors formally, but we hereby forewarn that in the numbers presented below, the third digit is not policy-relevant. It is meaningful mathematically only.
We drew the maps in Figure 1 and 4 without tone intensity correction for province size and province population: they reflect energy poverty levels within a province. Thus, a large grey area does not imply that a large number of people are impacted since provinces in remote mountains are less densely populated than provinces in the river deltas.
9
243
246
249
252
255
258
261
264
267
270
273
4. The engineering view: is electrification complete?Much has changed since (A. T. Nguyễn and Lefevre 1996) analysis of household energy demand based on a 1992 survey conducted in four provinces. At that time, 91% of the energy used by households was for cooking and pig feed. Cooking was mostly with coal and residues; electricity was used by less than 2% of rural households, 6% of urban households. Households commonly used both kerosene and electricity for lighting. This contrasts with the more recent survey by (V. T. Lê and Pitts 2019), which showcased air conditioning as the key driver of energy consumption for households living on Vietnam’s South-Central coast.
Đoàn Văn Bình (2010) wrote about electricity access in Vietnam as follows :
Vietnam has gone through a rapid increase in electrification since 1990, where electrification levels jumped from a pre-policy reform rate of less than 50% in the late 1980s–early 1990s to 77% by 2001 and 96% by 2009. The Electrification Programme driven by the Vietnamese government has resulted in increased access for 82 million people between 1976 and 2009. One million people, primarily in the northern mountainous regions of Vietnam, are currently without access to electricity.
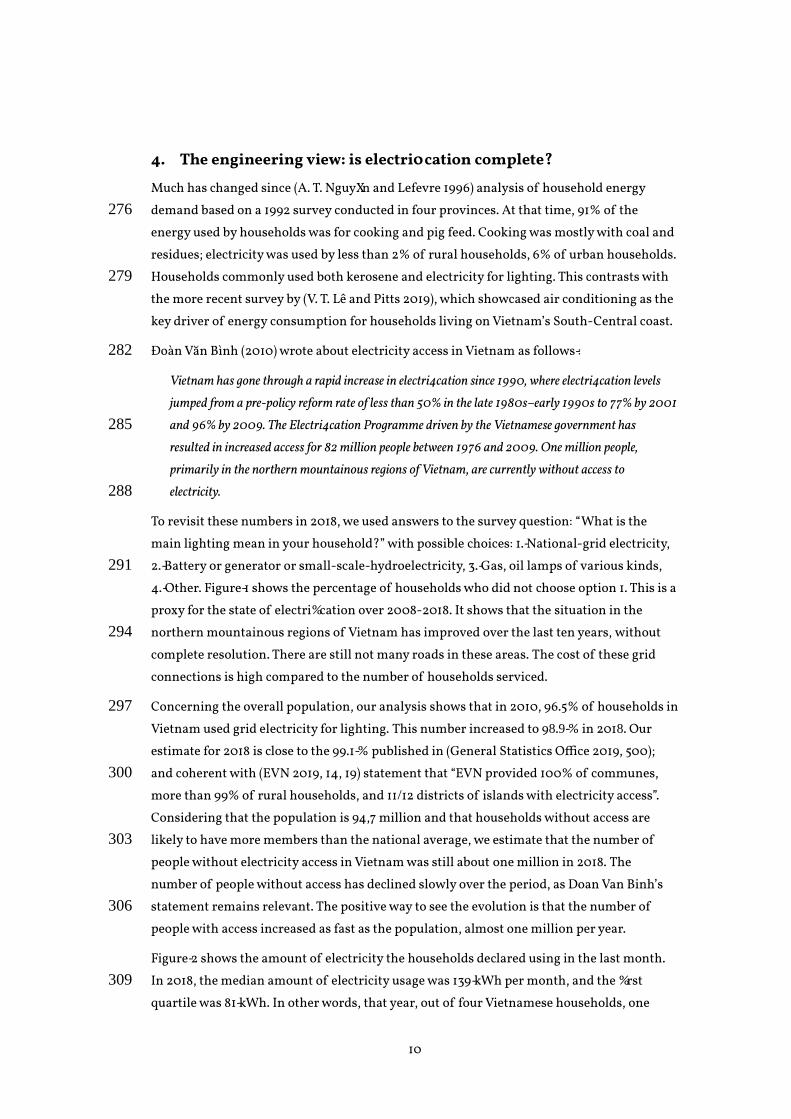
To revisit these numbers in 2018, we used answers to the survey question: “What is the main lighting mean in your household?” with possible choices: 1. National-grid electricity, 2. Battery or generator or small-scale-hydroelectricity, 3. Gas, oil lamps of various kinds, 4. Other. Figure 1 shows the percentage of households who did not choose option 1. This is a proxy for the state of electrification over 2008-2018. It shows that the situation in the northern mountainous regions of Vietnam has improved over the last ten years, without complete resolution. There are still not many roads in these areas. The cost of these grid connections is high compared to the number of households serviced.
Concerning the overall population, our analysis shows that in 2010, 96.5% of households in Vietnam used grid electricity for lighting. This number increased to 98.9 % in 2018. Our estimate for 2018 is close to the 99.1 % published in (General Statistics Office 2019, 500); and coherent with (EVN 2019, 14, 19) statement that “EVN provided 100% of communes, more than 99% of rural households, and 11/12 districts of islands with electricity access”. Considering that the population is 94,7 million and that households without access are likely to have more members than the national average, we estimate that the number of people without electricity access in Vietnam was still about one million in 2018. The number of people without access has declined slowly over the period, as Doan Van Binh’s statement remains relevant. The positive way to see the evolution is that the number of people with access increased as fast as the population, almost one million per year.
Figure 2 shows the amount of electricity the households declared using in the last month. In 2018, the median amount of electricity usage was 139 kWh per month, and the first quartile was 81 kWh. In other words, that year, out of four Vietnamese households, one
10
276
279
282
285
288
291
294
297
300
303
306
309
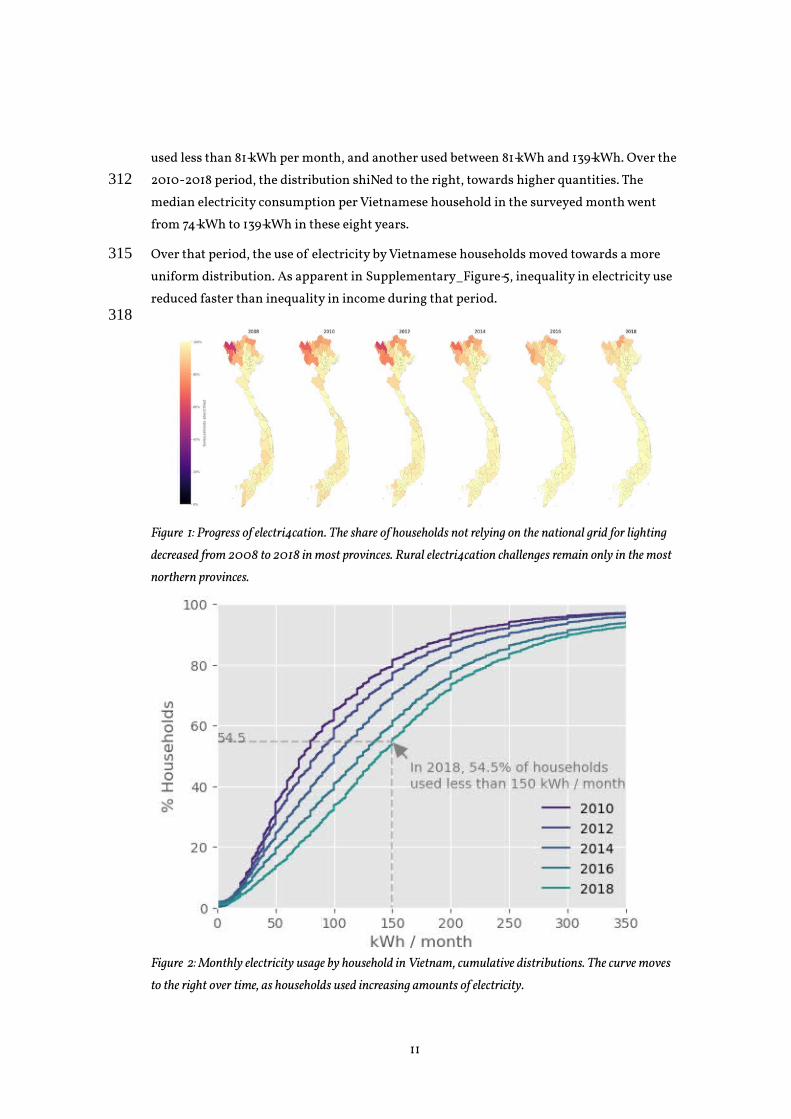
used less than 81 kWh per month, and another used between 81 kWh and 139 kWh. Over the 2010-2018 period, the distribution shifted to the right, towards higher quantities. The median electricity consumption per Vietnamese household in the surveyed month went from 74 kWh to 139 kWh in these eight years.
Over that period, the use of electricity by Vietnamese households moved towards a more uniform distribution. As apparent in Supplementary_Figure 5, inequality in electricity use reduced faster than inequality in income during that period.
Figure 1: Progress of electrification. The share of households not relying on the national grid for lighting decreased from 2008 to 2018 in most provinces. Rural electrification challenges remain only in the most northern provinces.
Figure 2: Monthly electricity usage by household in Vietnam, cumulative distributions. The curve moves to the right over time, as households used increasing amounts of electricity.
11
312
315
318

5. The economic view: is electricity affordable for all?
Figure 3 shows the electricity tariffs in Vietnam from 2004 to 2018. There are many curves because the tariff is an increasing staircase function: the more one consumes electricity, the higher the marginal tariff. In 2010, for example, consumers paid electricity 600 VND/kWh for the first 50 kWh, then 1004 VND/kWh from the 51st kWh to the 100th kWh, and so on (see Supplementary_Figure 1).
Increasing block tariffs for electricity, water, or gas are popular in many countries since they offer policymakers a tool to address equity and efficiency concerns. First, as far as power demand correlates with wealth, an increasing block tariff improves equity. It gives poor households access to electricity at a relatively low price. The first block can be provided at a tariff lower than production costs, enacting solidarity between users. Second, an increasing block tariff may improve energy efficiency. It presents higher marginal costs of electricity to households with higher electricity consumption. That tends to reduce wasteful uses and moderate the growth of their electricity demand.
The right panel in Figure 3 shows that the government kept electricity tariffs under control during the high-inflation years after the global economic crisis of 2008 (M. P. Nguyễn 2010). This contributed to protect the poorer consumers and mitigated inflation. Tariffs eventually caught up when the inflation cooled down, but in real terms, Vietnamese households faced cheaper electricity in 2020 than in 2010.
The average electricity tariff in Vietnam is low compared to other countries. In 2014, for example, it was 0.08 US$/kWh. Amongst 29 major countries in Asia and the Pacific, only Buthan, Mongolia, and Myanmar had a lower tariff (World Bank 2020, page 68).
Table 2 displays the budget effort indicator, defined as the weight of the electricity bill in the households’ budget (also Supplementary_Figure 2 and Supplementary_Figure 3 ). Electricity is affordable in Vietnam, meaning that the budget effort remains at a modest level. In 2018, the median household electricity budget effort was 2.4 % of income. This compares favourably with other countries. For example, according to (International Energy Consultants 2016), “In the Philippines […] the average size (170kWh/month) household spent an estimated 4.5% of monthly disposable income on electricity in January 2016 (down from >6% in 2012). The average spend of 44 markets surveyed was 3.9%, ranging from a low of 1.5% in Taiwan to a high of 8.2% in Portugal”. Supplementary_Figure 4 shows that 95 % of Vietnamese households devoted less than 7 % of their income to electricity.
However, Table 2 shows a trend suggesting that cheap electricity years may not last. The median budget effort was 1.5% in 2010 as a result of the 2008-2010 electricity price control. After that, the effort increased by fifty per cent between 2010 and 2018. As households become more affluent over time, it is normal that they consume more and that their bills
12
321
324
327
330
333
336
339
342
345
348
351
354

increase in nominal and in real terms. Here we saw not only that, but electricity expenses have increased faster than income.
When the fraction of budget spends purchasing something increases when households income increase, economists talk about a luxury or a superior good. However, this evidence does not imply that electricity is always a luxury/superior good for everybody. First, as exposed above, the relative price of electricity declined over 2010-2020, which can explain a part of the demand increase. Second, the econometric analysis presented in (H.-S. Nguyễn 2019, chap. 6) shows that for households in the lower-income quantiles, the electricity consumption is inelastic to income. Electricity is an essential good for poor households.
13
Figure 3: Electricity block tariff for households in Vietnam, in nominal terms (left) and adjusted for inflation (right). The real electricity price for households decreased from 2003 to 2018.
Year 2008 2010 2012 2014 2016 2018
Households not paying anything 3.5% 3.6 % 3.2 % 2.3 % 1.4 % 1.1 %
Households paying more than 6 % of their income for electricity bill
2.5% 2.3 % 3.0 % 5.1 % 6.2 % 7.9 %
Half of the households pay less than __% of income
1.6% 1.5 % 1.8 % 2.1 % 2.3 % 2.4 %
95 % of the households pay less than __% of income
4.7% 4.6 % 5.2 % 6.0 % 6.4 % 7.0 %
Table 2: Electricity bill as a fraction of income. Source: Authors, from VHLSS data.
357
360
363

6. The socio-political view: are electricity needs met?Table 3 summarizes the answers to VHLSS 2010/2012/2014 surveys Q12. Has your electricity usage [.…] been sufficient to meet needs over the last 30 days? It shows that in 2010, one out of four households in Vietnam declared that their electricity use was not sufficient to meet their needs. That ratio dropped under 5 % two years after that and under 3% in 2014.
Figure 4 maps this rapid progress in satisfaction between 2010 and 2012. The subjective indicator shows that during the 2010-2012 time period, there was significant progress towards meeting the UN Sustainable Development Goal 7. How can we explain it?
A systematic survey error may be present. However, according to the survey documentation, the question’s wording was the same in 2010, 2012, 2014.
Expanded energy access is not the only explanation. There is a correlation between access and satisfaction; see Figure 1 and 4. Satisfaction increased much faster compared to the relatively slow progress of the grid.
Energy-using expectations and behaviours are known to adjust. Would it be that households were more able to meet their needs with what was provided? We believe this effect may rather play in the opposite direction, given that the equipment levels increased. Regarding the demand for electricity by households, (General Statistics Office of Vietnam 2015, 26) stated that:
The percentage of households with fixed and/or mobile telephones reached 85%, the rate of households using a computer was 25.1%, the rate of households using a washing machine reached 30.9%, and the rate of households using refrigerators was 59.0%. All of these were at least twice times higher than the indicators in the 2009 Census. In addition, the rate of households using air conditioning stood at 13.3%, nearly three times higher than the rate in the 2009 Census.
We cannot rule out a fluke due to needs variations. Energy demand is known to be sensitive to weather, which is random. Weather in 2010 was warmer than in 2012 and in 2014. The heatwave could have led to exceptionally high cooling needs and shortages due to low flows to hydropower stations. A small fraction of households had air conditioning at that time, but fans also require electricity. However, we offer a simpler explanation.
We conjecture that satisfaction increased between 2010 and 2012 because the electricity supply reliability improved. In 2010 there were many shortages due to delays in adding new coal power plants. After that year, reserve generation capacity increased and that improved reliability. According to IEA (accessed 2021-02-08), the Vietnamese residential sector consumed 31.5 TWh in 2010, 38.4 TWh in 2012 and 45.7 TWh in 2014. The 50% growth in four years shows there was unsatisfied demand in 2010. Numbers for 2010 are not available, but according to EVN 2016 annual report, the System Average Interruption Duration Index went from 8077 minutes per customer in 2012 to 3134 minutes in 2014.
14
366
369
372
375
378
381
384
387
390
393
396
399
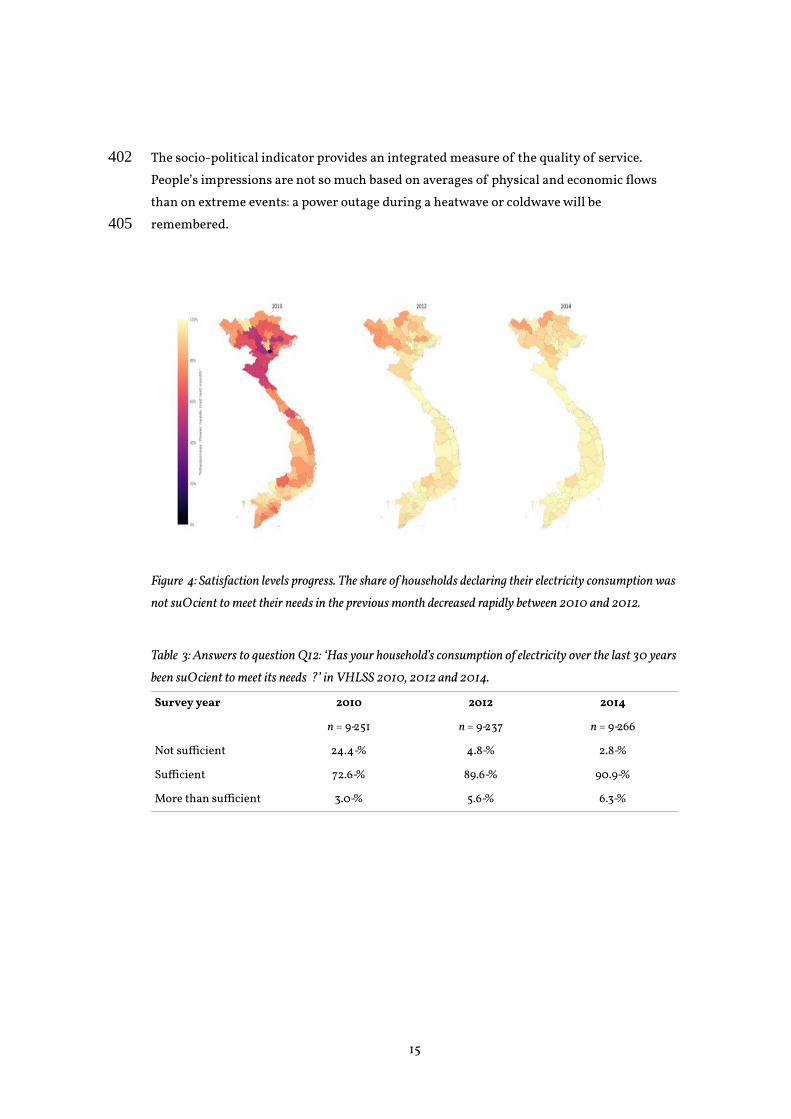
The socio-political indicator provides an integrated measure of the quality of service. People’s impressions are not so much based on averages of physical and economic flows than on extreme events: a power outage during a heatwave or coldwave will be remembered.
Figure 4: Satisfaction levels progress. The share of households declaring their electricity consumption was not sufficient to meet their needs in the previous month decreased rapidly between 2010 and 2012.
Table 3: Answers to question Q12: ‘Has your household’s consumption of electricity over the last 30 years been sufficient to meet its needs ?’ in VHLSS 2010, 2012 and 2014.
Survey year 2010 2012 2014
n = 9 251 n = 9 237 n = 9 266
Not sufficient 24.4 % 4.8 % 2.8 %
Sufficient 72.6 % 89.6 % 90.9 %
More than sufficient 3.0 % 5.6 % 6.3 %
15
402
405
7. Interactions between the three viewpoints
Section 4, the engineering viewpoint, looked at access to electricity and quantities consumed. Section 5, the economic viewpoint, looked at tariffs and the weight of the electricity bill in households’ budget. Section 6, the socio-political viewpoint, looked at the satisfaction of electricity needs. Only that viewpoint allowed us to see the qualitative jump between 2010 and 2012.
This section examines the interactions between the three viewpoints quantitatively. Figure 5 shows the number of respondents of the VHLSS 2014 meeting three different criteria of energy poverty: using less than 30 kWh per month, spending more than 6% of income on electricity, and declaring their electricity usage did not meet their needs. The first two are objective; the third is subjective. The precise limits for the objective criteria are somewhat arbitrary, but the qualitative result does not depend on it: there is little overlap between the three energy poverty indicators.
Consider first the interaction between the ‘energy poverty bar’ idea based on the quantity of electricity used and the subjective indicator of needs not met. Table 4 shows that in 2014, the electricity consumption of households with unsatisfied needs tends to be lower than in the rest of the population. In 2014, half of the households in Vietnam who declared insufficient electricity used less than 25 kWh per month.
What does 25 kWh per month mean in terms of basic needs? It amounts to about 830 Wh per day. This is more than enough to charge many telephones since a phone battery contains about 5 Wh. It is also enough for lightning, as a modern light bulb is about 10 W, a few hours per day. A TV and fans can also fit within this energy budget. However, it does not go far into modern comfort appliances. This amount of energy is not enough to run an air conditioning unit, refrigerator, electric cooking or heating.
While households who declared that their electricity usage did not meet their needs tend to use little electricity (in 2014), the converse is not true. Using small quantities of electricity can satisfy needs. In our sample, among the households who used less than 30 kWh of electricity, most did not declare their needs unsatisfied (see Figure 5). This shows that the absolute amount of energy used is not a sufficient indicator to determine satisfaction. It is the perceived comparison of the energy used with the needs of the household, determined by the appliances it owns, that determines sufficiency.
Second, consider the interaction between the ‘high electricity cost’ ideas based on the share of income devoted to electricity and the subjective indicator. In 2014, about 6% of Vietnamese households had ‘high costs’ of electricity, defined as over 6% of their income. Survey results show a very small overlap between that population and the households declaring than their needs were not met (see Figure 5). Furthermore, respondents declaring their electricity use did not meet their need tended to spend less on electricity than the
16
408
411
414
417
420
423
426
429
432
435
438
441
444
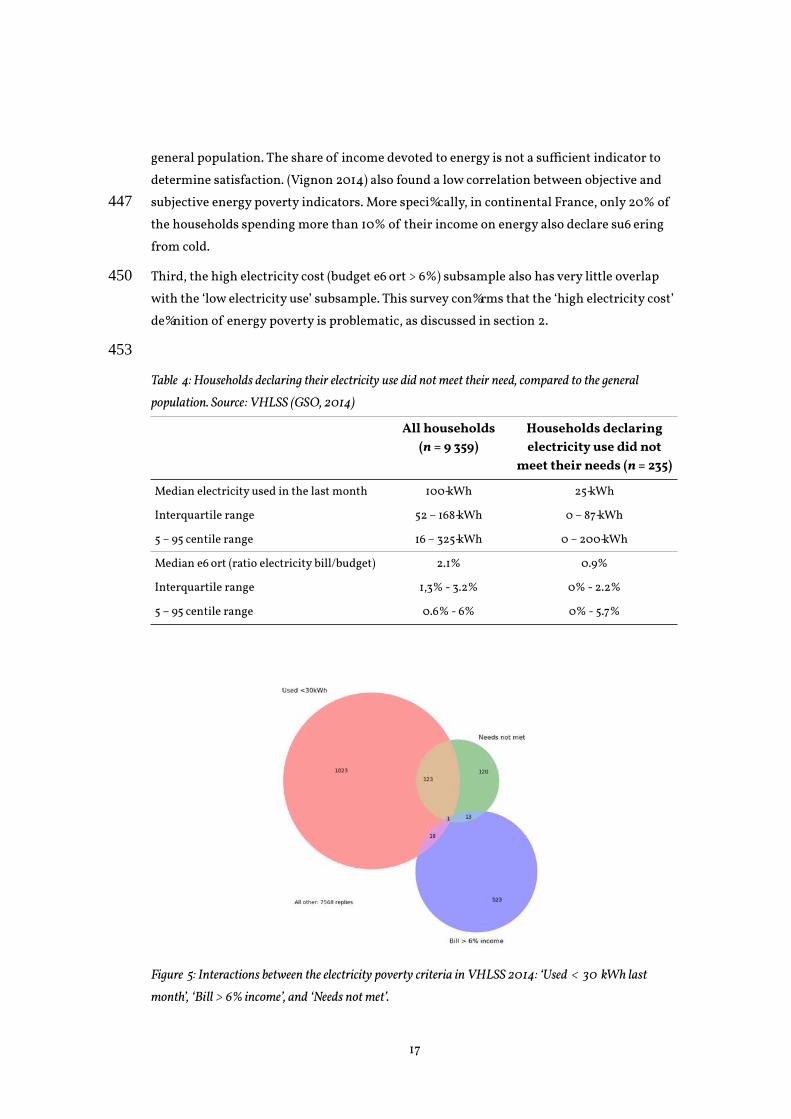
general population. The share of income devoted to energy is not a sufficient indicator to determine satisfaction. (Vignon 2014) also found a low correlation between objective and subjective energy poverty indicators. More specifically, in continental France, only 20% of the households spending more than 10% of their income on energy also declare suffering from cold.
Third, the high electricity cost (budget effort > 6%) subsample also has very little overlap with the ‘low electricity use’ subsample. This survey confirms that the ‘high electricity cost’ definition of energy poverty is problematic, as discussed in section 2.
Table 4: Households declaring their electricity use did not meet their need, compared to the general population. Source: VHLSS (GSO, 2014)
All households(n = 9 359)
Households declaringelectricity use did not
meet their needs (n = 235)
Median electricity used in the last month 100 kWh 25 kWh
Interquartile range 52 – 168 kWh 0 – 87 kWh
5 – 95 centile range 16 – 325 kWh 0 – 200 kWh
Median effort (ratio electricity bill/budget) 2.1% 0.9%
Interquartile range 1,3% - 3.2% 0% - 2.2%
5 – 95 centile range 0.6% - 6% 0% - 5.7%
Figure 5: Interactions between the electricity poverty criteria in VHLSS 2014: ‘Used < 30 kWh last month’, ‘Bill > 6% income’, and ‘Needs not met’.
17
447
450
453
8. Discussion
This section discusses Vietnam’s progress towards the SDG7 and the policy implications on energy poverty.
Based on VHLSS survey data, Table 5 summarizes four indicators related to SDG 7 access to clean, reliable and affordable energy for all. The first row is a proxy for SDSN Indicator 51 discussed Section 2, access to reliable electricity. The next three rows correspond to the three viewpoints discussed in sections 4, 5 and 6.
The first row shows that Vietnam has mostly achieved SDG7 access to clean energy for all. Vietnam has a lower-middle-income economy. According to World Development Indicators (World Bank, accessed 2021-02-18, statistics for 2018), 86,3% of the population had access to electricity in that country group. Vietnam scores above its peers. Its access indicator compares with upper-middle-income countries, where 99.4% of the population had access (World Bank, op. cit.). Historically within ASEAN, Vietnam reached electrification after Brunei Darussalam, Malaysia, Singapore and Thailand, but before the Philipines, Indonesia and the Lao PDR (Gu, Yan, and Nuki 2020). Cambodia and Myanmar have yet to reach a 95% electrification rate as of 2019.
The Philippines and Indonesia have a higher income than Vietnam, but lots of isolated islands, which makes electrification more difficult. Lao PDR is a continental country well endowed in hydro-electric ressources, and a level of income per capita comparable to Vietnam’s. Yet is electricity use per capita is much lower, maybe because it has a larger fraction of rural households living in mountain areas. Cambodia and Myanmar are behind Vietnam in electricity access because they have lower income per capita. The same logic applies when comparing Vietnam with Brunei Darussalam, Malaysia, Singapore and Thailand.
That second row shows the share of households using less than 30 kWh per month. The percentage of households below an electricity poverty line is an energy poverty indicator. We choose 30 kWh here because it is the amount subsidized in official Vietnamese policies. However, the group covers a diversity of situations, the first three levels in Bathia and Angelou’s (2015) multi-tier matrix for measuring household electricity consumption. The ‘less than 30 kWh’group goes from households without any electricity access to households using about 1 000 Wh per day, which is enough for lighting, charging phones, running fans and television. By 2018 this under-30 kWh/month group comprised less than 7% of households, declining by about one percentage point per year during the period.
Considering the electricity consumption per capita, (Gu, Yan, and Nuki 2020) classify ASEAN member states into four groups. The first is Singapore, Thailand and Brunei Darussalam. Vietnam is in the second group, with Malaysia and Indonesia. The third is Lao PDR and the Philippines. The fourth is Cambodia and Myanmar.
18
456
459
462
465
468
471
474
477
480
483
486
489

Row three shows the share of households spending less than 6 % of income on electricity. The conclusion that the burden is increasing fast does not depend on the precise 6% value, as Supplementary_Figure 2 shows. Do rows two and three confirm that “Electricity poverty decreased but electricity-cost poverty increased” (T. T. Nguyễn et al. 2019)? Spending more on electricity is not necessarily a welfare loss. Electricity can substitute other forms of energy, reducing their cost, particularly for rural and less wealthy households, which were still a majority of the population at the start of the period. Biomass use did decrease at the same time as electricity use increased. According to the International Energy Agency (Data and statistics, accessed 2021-02-10), in 2018, the total final energy consumption by the Vietnamese residential sector (households) was 10 059 ktoe, of which 5 352 ktoe (52 %) was as electricity and 2 213 ktoe (22 %) was as biofuel and waste. In 2008 the total was 15 110 ktoe, of which electricity was 2 241 ktoe (15 %) and biomass 11 086 ktoe (73 %). Most of the costs of using biomass energy are non-market. It would be difficult to quantify the welfare gains of using the electric rice cooker over the traditional wood stove, but given a choice, many households choose the first option.
Electricity is affordable for most households, but energy poverty remains for many. According to the General Statistics Office (2019, 435), air conditioner ownership per 100 households increased from 5.5 to 35.1 between 2008 and 2018. For urban areas, it went from 17.3 to 70.1. The statistic only increased from 0.1 to 3.3 air conditioner per 100 households for the lowest income quintile. Not being able to protect against extreme heat fits with the first definition of energy poverty presented in Section 2.
The barrier to air conditioning is not only capital but also operating costs. During the 2020 summer heatwave, many households did not dare to turn on their air conditioners or even their fans due to the high electricity bills (B. Lê 2020; Thương and Hà 2020). The monthly income per capita in 2018 for the first quintile was 923 000 VND, about 41 USD (GSO 2019, p.22). For the underprivileged households, each kWh counts. Using 1 kW for 100 hours in a month costs about 200 000 VND at the third tariff block. To compound the problem, many landlords charge high rates for electricity. If the government gave appliances for free, there would still be energy poverty in the sense of the fourth criteria discussed in section 2.
The fourth, bottom row is about satisfaction, the share of households stating that their electricity use did not meet needs last month. We regret that the 2016 and 2018 households surveys did not measure this indicator. As a regulated monopoly provides electricity, it remains useful that national statistical offices provide the government with independent performance indicators. National electricity policies have many objectives. Goals for the energy sector as a whole include independence and sustainability. Objectives facing households include universal access to electricity, affordable tariffs, and a satisfying quality of service. We believe that these three objectives require different indicators. Energy poverty must be measured and discussed with engineering, economic and socio-political
19
492
495
498
501
504
507
510
513
516
519
522
525
528

data. The socio-political energy indicator –designed from surveys asking people they had enough electricity to meet their households needs– provides essential customer satisfaction feedback that cannot be obtained by looking only at kWh and money flows.
For policymaking, the discussions on SDG7 and energy poverty indicators lead to operational criteria defining which households should be eligible for support. Section 7 found that the three different approaches point to different households. We argue that the subjective indicator is the more theoretically satisfying measure of progress towards SDG7. However, when it comes to identifying which households should receive money, subjective declarative criteria are challenging to trust. Furthermore, the ‘high electricity cost’ budget effort indicator has problems. Three approaches remain operational to define households eligible for electricity subsidies: a) low income, b) low electricity use or c) both. The Vietnamese support scheme uses option c). A household with an income poverty certificate could get a subsidy of 30.000 VND/household/month if it consumed less than 50 kWh.
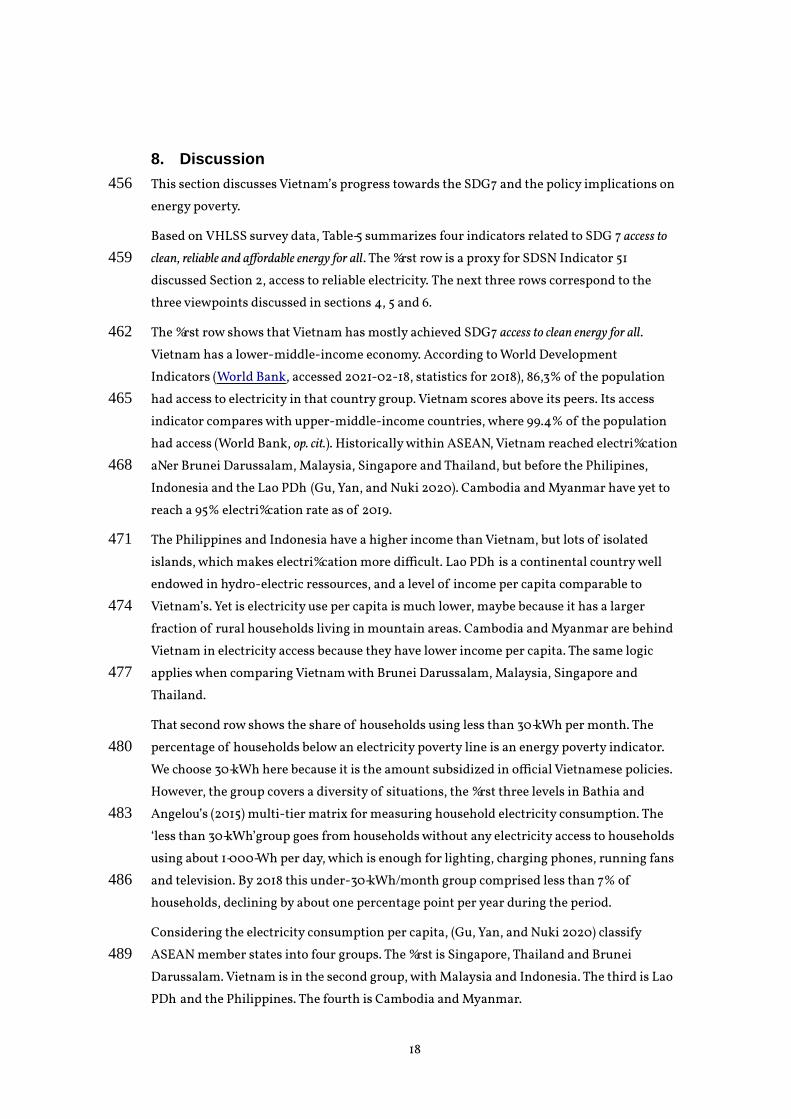
The VHLSS 2014 survey explicitly asked questions about electricity subsidies and poverty certificate. Figure 6 shows how the subsidy mechanism performed. Three-quarters of poor respondents declared they received the electricity subsidy. The Figure shows that only 37% of households using less than 30 kWh did receive the subsidy. The reason is that most of those households do not have a poverty certificate. Finally, only 23% of households who declared their electricity needs not met received a subsidy. The subsidy mechanism worked more to alleviate poverty (SDG 1) than to satisfy electricity needs (SDG 7).
20
531
534
537
540
543
546
549
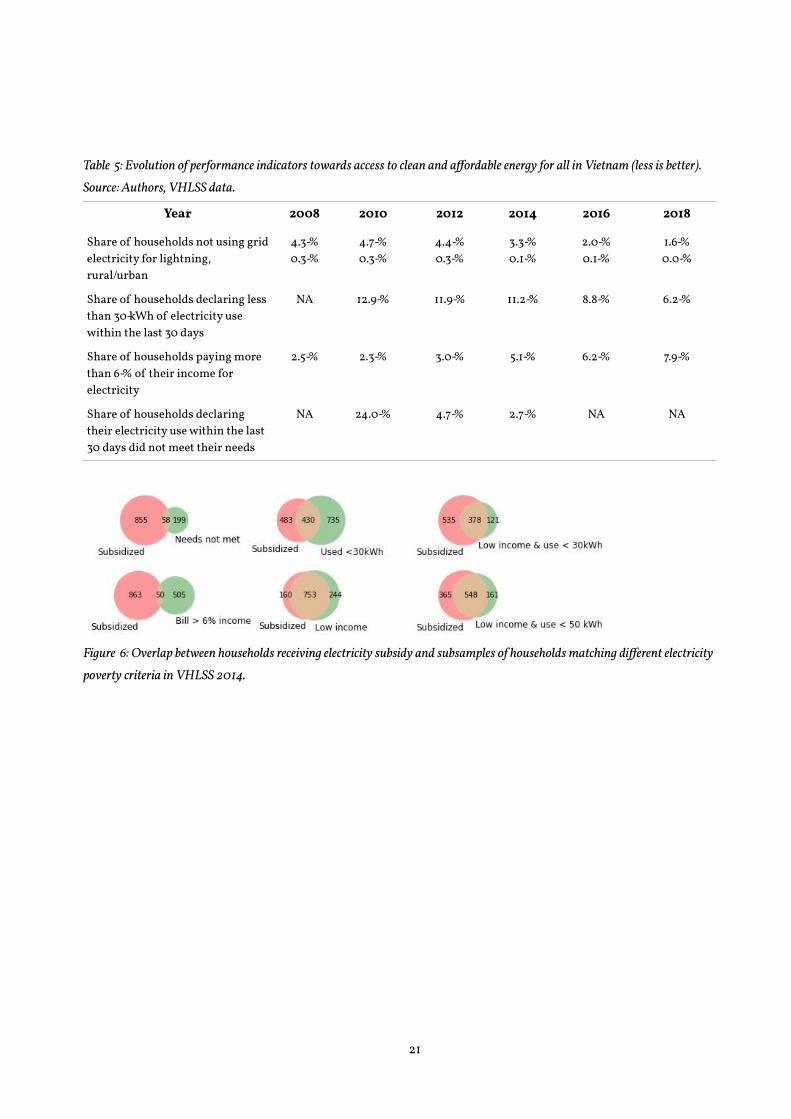
Table 5: Evolution of performance indicators towards access to clean and affordable energy for all in Vietnam (less is better). Source: Authors, VHLSS data.
Year 2008 2010 2012 2014 2016 2018
Share of households not using grid electricity for lightning, rural/urban
4.3 %0.3 %
4.7 %0.3 %
4.4 %0.3 %
3.3 %0.1 %
2.0 %0.1 %
1.6 %0.0 %
Share of households declaring less than 30 kWh of electricity use within the last 30 days
NA 12.9 % 11.9 % 11.2 % 8.8 % 6.2 %
Share of households paying more than 6 % of their income for electricity
2.5 % 2.3 % 3.0 % 5.1 % 6.2 % 7.9 %
Share of households declaring their electricity use within the last 30 days did not meet their needs
NA 24.0 % 4.7 % 2.7 % NA NA
Figure 6: Overlap between households receiving electricity subsidy and subsamples of households matching different electricity poverty criteria in VHLSS 2014.
21

9. Summary and concluding remarks
The three points of view explored in this paper converge to indicate that Vietnam progressed very close to the SDG7 – Affordable and clean energy for all – over the 2008-2018 period, and that electricity poverty is not an acute social issue in 2018:
• Vietnam achieved close to universal access to electricity. The expansion of the grid matched the demographic expansion. About one million people remain to be electrified, mostly in remote areas in the Northern mountains.
• Electricity is affordable in Vietnam. The electricity tariffs are lower compared to other ASEAN countries, and households spend a smaller share of their budget on electricity. Tariffs declined in real terms during the last ten years.
• The quality of service, defined as the satisfaction of customers, has improved to a high level. Between 2010 and 2014, the share of households declaring that their electricity use did not meet their need dropped from 24% to 2.7%.
We found that the inequalities in electricity use among Vietnamese households decreased during the 2008-2018 period. Inequalities in electricity use are not greater than inequalities in income, contrary to the findings of Son and Yoon (2020) for the 1993-2004 period.
Regarding the general academic debates around energy poverty, the case of Vietnam during 2008-2018 confirms that the ratio of electricity bill over income is not an indicator precise enough for public policies. We rather suggest that there are two different meanings of energy poverty, measured by different indicators. To follow progress on SDG7 at the macro scale, the proportion of households declaring that “their electricity consumption did meet their needs” complements the existing indicator based on grid access. To target households eligible for energy subsidies, indicators based on income or/and electricity consumption are more operational.
The Vietnam electricity sector cannot rest on its laurels. Economic growth and technological change create systemic challenges ahead.
• Providing access to the last million citizens requires a disproportionate effort, as only the most challenging parts of the grid expansion remain to build. In the sentence “Almost all households in Vietnam had access to affordable and reliable electricity in 2018” the word “almost” means that one to two per cent of households remains without access. The pace of expansion must be well above demographic growth to bring electricity to all (World Bank Group and International Energy Agency 2013).
• Energy poverty is not only solved by providing access to the grid. For a large fraction of households, air conditioning is not affordable. Overheating is especially a problem in urban areas during heatwaves, which are becoming more frequent.
22
552
555
558
561
564
567
570
573
576
579
582
585

• The cost of electricity weights more and more in the budget of Vietnamese households. Energy efficiency and conservation measures are needed to check the electricity bills increase.
The overarching challenge, in the end, is upscaling. As apparent in Table 1, the population growth rate is about one per cent per year, and the economic growth rate six per cent, the urbanization gains 0.7 percentage point per year. The average household size is also decreasing, as the traditional family model with three generations under one roof is losing ground. These factors imply continued growth in the demand for electricity services. Even if energy efficiency increases, this growth has to be met by increasing energy generation, transmission and distribution capacity. Lagging system capacities increase behind demand threaten the quality of service. There have indeed been concerns about cutoffs in 2020-2021 because the building of new thermal power plants was behind schedule (Hoàng 2019). While generation capacities from renewable sources come online fast, the required new transmission and regulation capacity takes more time to build.
It is also financially challenging to install the new infrastructure fast enough. The level of public debt is getting near Parliament’s limits, and the electricity generating companies are also deeply in debt. The domestic production of coal has peaked and is not enough to feed all power plants since 2016. Raising further the price of electricity may be necessary at some point to pay for imported fuels, to finance investments in capital-intensive solar and wind power plants, to reinforce the grid and to make it smarter.
In the past, the government piloted the development of the electric sector, financing mostly through public debt. The current policy is to mobilize private capital. In this market-oriented logic, the total cost of electricity – investment and production – will be passed on to electricity consumers rather than taxpayers. As long as the government regulates the retail tariffs, it retains the possibility to share the costs between the different categories of electricity consumers. It could, for example, charge less the households and more the industrial, commercial and institutional consumers. The increasing block tariff is not the only tool to protect households from electricity poverty.
10. AcknowledgementsNHS provided the initial idea and the data, HDM directed the research. The two authors contributed to statistical analysis and writing. This work was started while the first author was visiting professor at the Clean Energy and Sustainable Development Lab (CleanED/USTH). We gratefully acknowledge comments from our colleagues Audrey Berry, Franck Nadaud, Nguyễn Trinh Hoang Anh. The authors declare no conflict of interest.
23
588
591
594
597
600
603
606
609
612
615
618
11. ReferencesAsian Development Bank. 2011. “Energy for All: Viet Nam’s Success in Increasing Access to Energy
through Rural Electrification.” ADB. https://think-asia.org/bitstream/handle/11540/963/rural-electrification-vie.pdf?sequence=1.
Atkinson, A. B. 1987. “Poverty.” In The New Palgrave Dictionary of Economics, edited by Palgrave Macmillan, 1–9. London: Palgrave Macmillan UK. https://doi.org/10.1057/978-1-349-95121-5_1597-1.
Barnes, Douglas F., Shahidur R. Khandker, and Hussain A. Samad. 2011. “Energy Poverty in Rural Bangladesh.” Energy Policy, Special Section on Offshore wind power planning, economics and environment, 39 (2): 894–904. https://doi.org/10.1016/j.enpol.2010.11.014.
Bathia, Mikul, and Niki Angelou. 2015. “Beyond Connections : Energy Access Redefined.” ESMAP Technical Report 008/15. Washington, D.C.: World Bank. https://openknowledge.worldbank.org/handle/10986/24368.
Bravo, Víctor, Guillermo Gallo Mendoza, Juan Legisa, Carlos E Suárez, and Isaac Zyngierman. 1983. “A First Approach to Defining Basic Energy Needs.” United Nations University, Japan, UNUP-454.
Chérel, Didier. 2014. “Premier rapport de l’ONPE. Définitions, indicateurs, premiers résultats et recommandations.” Rapport de synthèse. Observatoire National de la Précarité Energétique. http://onpe.org/sites/default/files/pdf/documents/rapports_onpe/onpe1errapportsynthese.pdf.
Dharmaratna, Dinusha, and Edwyna Harris. 2012. “Estimating Residential Water Demand Using the Stone-Geary Functional Form: The Case of Sri Lanka.” Water Resources Management 26 (8): 2283–99.
Đoàn, Văn Bình. 2010. “Vietnam Rural Electrification Programme.” 2010. http://energy-access.gnesd.org/cases/34-vietnam-rural-electrification-programme.html.
DTI, Department of Trade and Industry. 2007. “Fuel Poverty.” The National Archives. March 6, 2007. http://webarchive.nationalarchives.gov.uk/20070603164901/http://www.dti.gov.uk/energy/fuel-poverty/index.html.
EVN. 2019. “Vietnam Electricity Annual Report 2018.” Annual Report. Vietnam: Vietnam Electricity (EVN). https://www.evn.com.vn/userfile/User/tcdl/files/2019/8/EVNAnnualReport2018(1).pdf.
Foster, Vivien, Jean-Philippe Tre, and Quentin Wodon. 2000. “Energy Prices, Energy Efficiency, and Fuel Poverty.” Unpublished Paper. Latin America and Caribbean Regional Studies Program, Washington, DC: The World Bank. http://www.mediaterre.org/docactu,bWF4aW0vZG9jcy9wZTE=,1.pdf.
Gaudin, Sylvestre, Ronald C Griffin, and Robin C Sickles. 2001. “Demand Specification for Municipal Water Management: Evaluation of the Stone-Geary Form.” Land Economics 77 (3): 399–422.
General Statistics Office. 2019. Result of the Viet Nam Household Living Standards Survey 2018. Ha Noi, Viet Nam: Statistical Publishing House.
General Statistics Office of Vietnam. 2015. “The 1/4/2014 Viet Nam Intercensal Population and Housing Survey: Major Findings.” Vietnam: Ministry of Planning and Investment.
Gu, Hongbin, Bingzhong Yan, and Agya Utama Nuki. 2020. “Practical Experience and Prospects for Energy Accessibility in ASEAN.” ASEAN Centre for Energy and China Renewable Energy Engineering Institute.
He, Xiaoping, and David Reiner. 2016. “Electricity Demand and Basic Needs: Empirical Evidence from China’s Households.” Energy Policy 90 (March): 212–21. https://doi.org/10.1016/j.enpol.2015.12.033.
Hills, John. 2012. “Getting the Measure of Fuel Poverty: Final Report of the Fuel Poverty Review.” CASE report 72. Center for Analysis of Social Exclusion. http://eprints.lse.ac.uk/43153.
24
621

Hoàng, Quốc Vượng. 2019. “Report 58/2019/BC-BCT on the Progress of Implementing Some Key Power Source Projects in PDP VII Revised - Tình Hình Thực Hiện Các Dự Án Điện Trong Quy Hoạch Điện VII Điều Chỉnh.” 58/BC-BCT. MOIT, EREA. http://moit.gov.vn/web/guest/tin-chi-tiet/-/chi-tiet/tinh-hinh-thuc-hien-cac-du-an-%C4%91ien-trong-quy-hoach-%C4%91ien-vii-%C4%91ieu-chinh-15534-22.html.
Hung, Ming-Feng, and Bin-Tzong Chie. 2013. “Residential Water Use: Efficiency, Affordability, and Price Elasticity.” Water Resources Management 27 (1): 275–91.
International Energy Consultants. 2016. “Regional/Global Comparison of Retail Electricity Tariffs - Executive Summary.” May. http://corporate-downloadables-tips.s3.amazonaws.com/1478573661.68b4d11ba9cb3ccb30e91c6edd66b6c9.pdf.
Kasprzyk, Daniel. 2005. “Measurement Error in Household Surveys: Sources and Measurement.” In Household Sample Surveys in Developing and Transition Countries. New York: United Nations Publications.
Khandker, Shahidur R., Douglas F. Barnes, and Hussain A. Samad. 2012. “Are the Energy Poor Also Income Poor? Evidence from India.” Energy Policy 47 (August): 1–12. https://doi.org/10.1016/j.enpol.2012.02.028.
Lê, Bảo. 2020. “Nghịch Cảnh Mùa Nắng Nóng, Có Điều Hòa Vẫn Không Dám Dùng.” Giadinh.Net.Vn. July 7, 2020. https://giadinh.net.vn/news-20200706171746705.htm.
Lê, Việt Phú. 2020. “Electricity Price and Residential Electricity Demand in Vietnam.” Environmental Economics and Policy Studies, February. https://doi.org/10.1007/s10018-020-00267-6.
Lê, Vinh Tien, and Adrian Pitts. 2019. “A Survey on Electrical Appliance Use and Energy Consumption in Vietnamese Households: Case Study of Tuy Hoa City.” Energy and Buildings 197 (August): 229–41. https://doi.org/10.1016/j.enbuild.2019.05.051.
Li, Kang, Su-Yan Pan, and Yi-Ming Wei. 2015. “A Bibliometric Analysis of Energy Poverty Research: Results from SCI-E/SSCI Databases.” International Journal of Global Energy Issues 38 (4–6): 357–72. https://doi.org/10.1504/IJGEI.2015.070263.
Martínez-Espiñeira*, Roberto, and Céline Nauges. 2004. “Is All Domestic Water Consumption Sensitive to Price Control?” Applied Economics 36 (15): 1697–1703.
Nguyễn, Anh Tuấn, and Thierry Lefevre. 1996. “Analysis of Household Energy Demand in Vietnam.” Energy Policy 24 (12): 1089–99. https://doi.org/10.1016/S0301-4215(97)80003-6.
Nguyễn, Hoai-Son. 2019. “Exploring the Determinants of Household Electricity Demand in Vietnam in the Period 2012-16.” PhD Thesis, Paris: Université de Paris-Saclay. Tel-02294630. Thèses en Ligne. https://tel.archives-ouvertes.fr/tel-02294630/.
Nguyễn, Minh Phong. 2010. “Preventing Power Tariffs From Stoking Inflation.” The Saigon Times, February 25, 2010. http://english.thesaigontimes.vn/8896/Preventing-Power-Tariffs-From-Stoking-Inflation.html.
Nguyễn, Trung Thành, Thanh-Tung Nguyễn, Viet-Ngu Hoang, Clevo Wilson, and Shunsuke Managi. 2019. “Energy Transition, Poverty and Inequality in Vietnam.” Energy Policy 132 (September): 536–48. https://doi.org/10.1016/j.enpol.2019.06.001.
Nussbaumer, Patrick, Morgan Bazilian, and Vijay Modi. 2012. “Measuring Energy Poverty: Focusing on What Matters.” Renewable and Sustainable Energy Reviews 16 (1): 231–43. https://doi.org/10.1016/j.rser.2011.07.150.
25

Observatoire National de la Précarité Energétique. 2016. “Caractériser le phénomène et le mesurer.” http://www.onpe.org/definition_indicateurs/definition_des_indicateurs.
Pachauri, S., A. Mueller, A. Kemmler, and D. Spreng. 2004. “On Measuring Energy Poverty in Indian Households.” World Development 32 (12): 2083–2104. https://doi.org/10.1016/j.worlddev.2004.08.005.
SDSN. 2015. “Indicators and a Monitoring Framework for the Sustainable Development Goals.” Draft 7. Leadership Council of the Sustainable Development Solutions Network. http://unsdsn.org/wp-content/uploads/2014/05/140522-SDSN-Indicator-Report.pdf.
Son, Hyelim, and Semee Yoon. 2020. “Reducing Energy Poverty: Characteristics of Household Electricity Use in Vietnam.” Energy for Sustainable Development 59: 62–70.
Sovacool, Benjamin K., Ishani Mukherjee, Ira Martina Drupady, and Anthony L. D’Agostino. 2011. “Evaluating Energy Security Performance from 1990 to 2010 for Eighteen Countries.” Energy 36 (10): 5846–53. https://doi.org/10.1016/j.energy.2011.08.040.
Thương Mai, and Hà Trung. 2020. “Nắng nóng đỉnh điểm vẫn không dám bật quạt ở xóm ngụ cư nghèo <Poor neighborhood did not dare to turn on fans at the peak of heatwave>.” TUOI TRE ONLINE. June 10, 2020. https://tuoitre.vn/news-20200610134010987.htm.
Vignon, Jérome. 2014. “Premier Rapport de l’ONPE: Définitions et Indicateurs.” Les Notes de l’ONPE - Observatoire National de La Précarité Energétique, December 10, 2014.
World Bank. 2020. Infrastructure in Asia and the Pacific. World Bank, Washington, DC. https://doi.org/10.1596/34228.
World Bank Group, and International Energy Agency. 2013. “SE4ALL Global Tracking Framework.” Text/HTML. World Bank. 2013. https://www.worldbank.org/en/topic/energy/publication/Global-Tracking-Framework-Report.
26
Supplementary material to
Electricity poverty reduction as an indicator of progress towards
the Sustainable Development Goal 7: Vietnam, 2008-2018.
Ha-Duong Minh Nguyen Hoai Son
2021-03-03
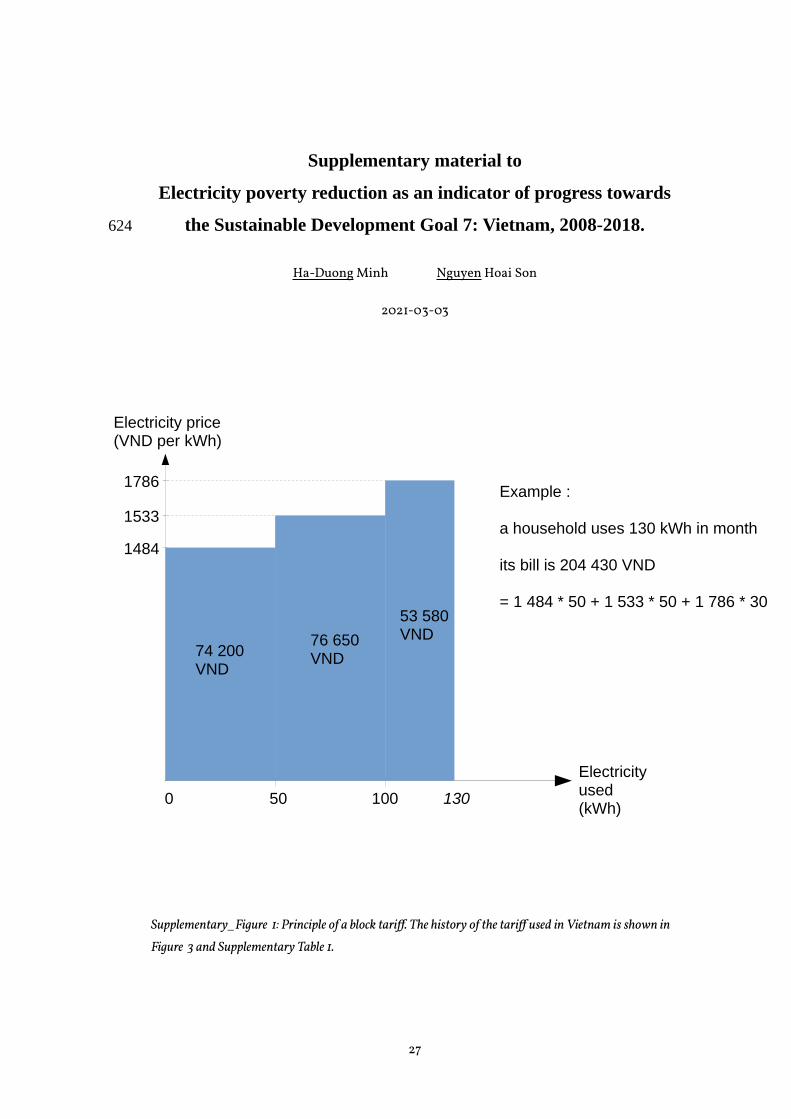
Supplementary_Figure 1: Principle of a block tariff. The history of the tariff used in Vietnam is shown in Figure 3 and Supplementary Table 1.
27
Electricity used(kWh)
50 100
Electricity price(VND per kWh)
1484
1533
1786
130
Example :
a household uses 130 kWh in month
its bill is 204 430 VND
= 1 484 * 50 + 1 533 * 50 + 1 786 * 30
74 200 VND
76 650 VND
53 580 VND
0
624
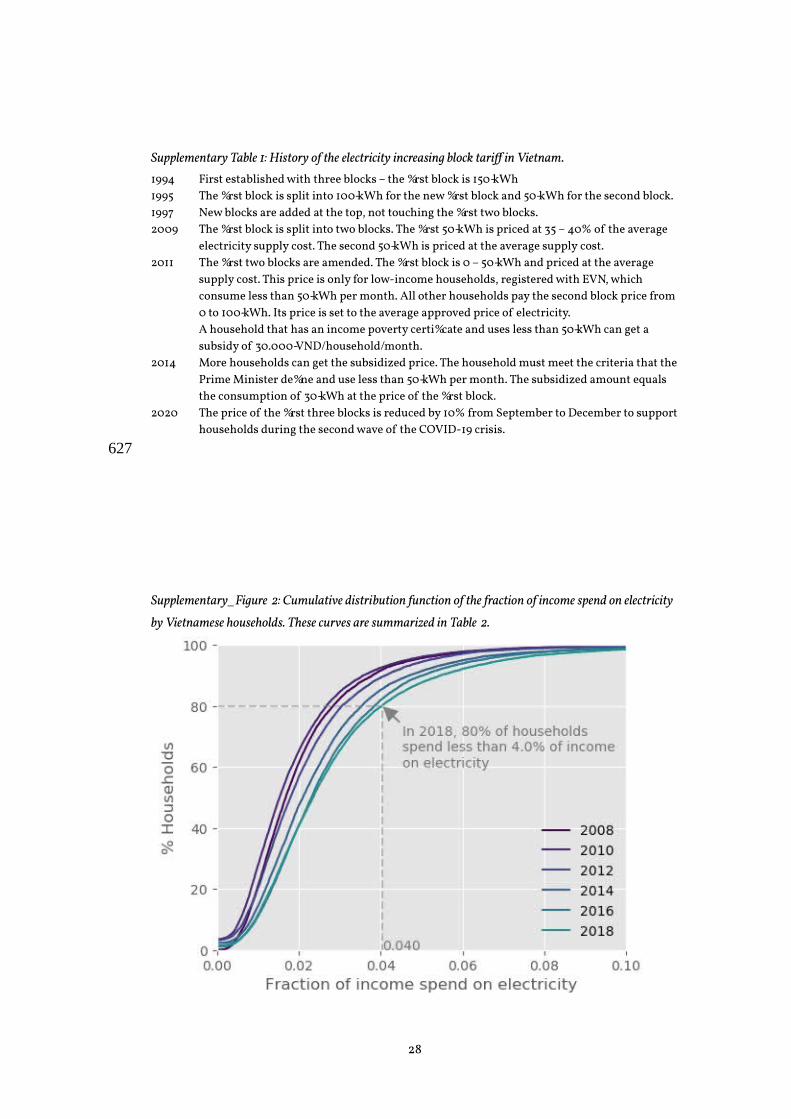
Supplementary Table 1: History of the electricity increasing block tariff in Vietnam.1994 First established with three blocks – the first block is 150 kWh1995 The first block is split into 100 kWh for the new first block and 50 kWh for the second block.1997 New blocks are added at the top, not touching the first two blocks.2009 The first block is split into two blocks. The first 50 kWh is priced at 35 – 40% of the average
electricity supply cost. The second 50 kWh is priced at the average supply cost.2011 The first two blocks are amended. The first block is 0 – 50 kWh and priced at the average
supply cost. This price is only for low-income households, registered with EVN, which consume less than 50 kWh per month. All other households pay the second block price from 0 to 100 kWh. Its price is set to the average approved price of electricity.A household that has an income poverty certificate and uses less than 50 kWh can get a subsidy of 30.000 VND/household/month.
2014 More households can get the subsidized price. The household must meet the criteria that the Prime Minister define and use less than 50 kWh per month. The subsidized amount equals the consumption of 30 kWh at the price of the first block.
2020 The price of the first three blocks is reduced by 10% from September to December to support households during the second wave of the COVID-19 crisis.
28
Supplementary_Figure 2: Cumulative distribution function of the fraction of income spend on electricity by Vietnamese households. These curves are summarized in Table 2.
627

Supplementary_Figure 3: Distribution of electricity expense by Vietnamese households.Expenses almost doubled in real terms between 2008 and 2014. Curves jump at multiples of 50.000 VND because this is declarative survey data, not observed electricity bills.
29

Supplementary_Figure 4: Electricity budget as a function of the total income.Most Vietnamese households spend less than 6% of their income on electricity – they are below the red line. The fraction of households above the red line is increasing.
30
630
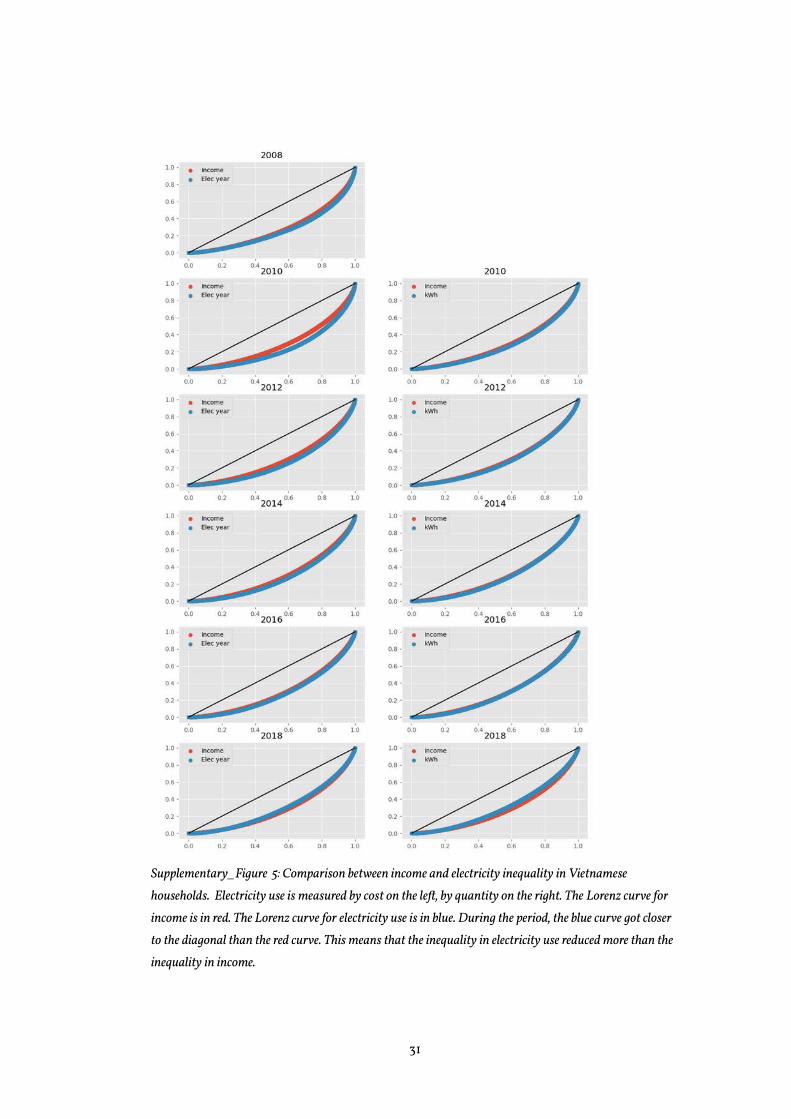
Supplementary_Figure 5: Comparison between income and electricity inequality in Vietnamese households. Electricity use is measured by cost on the left, by quantity on the right. The Lorenz curve for income is in red. The Lorenz curve for electricity use is in blue. During the period, the blue curve got closer to the diagonal than the red curve. This means that the inequality in electricity use reduced more than the inequality in income.
31