electricity futures in the greater mekong subregion ...eria_rpr_2017_08.pdfmyanmar, a key ountry in...
TRANSCRIPT

ii
© Economic Research Institute for ASEAN and East Asia, 2018
ERIA Research Project FY2017 No. 08
Published in 2018
All rights reserved. No part of this publication may be reproduced, stored in a retrieval system,
or transmitted in any form by any means electronic or mechanical without prior written notice
to and permission from ERIA.
The findings, interpretations, conclusions, and views expressed in their respective chapters are
entirely those of the author/s and do not reflect the views and policies of the Economic Research
Institute for ASEAN and East Asia, its Governing Board, Academic Advisory Council, or the
institutions and governments they represent. Any error in content or citation in the respective
chapters is the sole responsibility of the author/s.
Material in this publication may be freely quoted or reprinted with proper acknowledgement.
Unless otherwise specified, the sources of figures and tables in this report are from the results
of the study.

iii
Preface
International energy markets are experiencing a wave of innovations and the rise of new ideas
and values. Remarkable examples of innovation include drastic cost reductions in the field of
renewables and the digitalisation of energy systems. The International Energy Agency, in fact,
notes that the ‘solar photovoltaic is on track to be the cheapest source of new electricity in many
countries.’ This statement will have a significant impact on the future energy mix as well as
energy policies of many countries. In addition, the Sustainable Development Goals of the United
Nations, together with the spirit of the Paris Accord in 2015, are seeing some results and present
an opportunity for both public and private sectors to work as partners towards common goals.
Thus, we may be facing structural changes on energy’s demand and supply sides.
Our research has focused on Myanmar and the Greater Mekong Subregion, emphasising rural
electrification via renewable power generation through mini-grids as well as central-grid capacity
expansion through sustainable power options. One of the purposes of this research is to analyse
the current energy situation, including constraints in the region during this transitional stage,
and to propose tangible policy recommendations that work towards energy security,
environmental protection, and global warming mitigation.
Myanmar is the least developed country in the Greater Mekong Subregion and has the lowest
electrification rate in the area; thus, it has room for further improvement. This is why most of
the works are concentrated in the country. In fact, the problem is apparent in Myanmar with its
sheer number of proposed large-scale hydropower plants; its strategic environmental planning,
however, can disregard environmental damage.
Myanmar’s abundant solar power can be further harnessed. The existing difficulties and
inconveniences of the people in rural areas are real and urgent, and need to be solved as soon
as possible. The people need energy in their daily lives now and in the future. In this sense, we
have tried to consider their realities in the course of this research.
We have also realised that the issue on energy relates to many other broader concerns such as
regional development, conflict and peace-building, national unity and security, poverty and
wellbeing, democracy, water management, and equality and gender – most of which are
included in the Sustainable Development Goals. Therefore, we came to understand that a wider
and more conceptual view and approach are also required, particularly in Myanmar, where the
democracy is fresh, and the government is confronted with ethnic and religious conflicts,
especially in the rural areas.
iv
Our team has tried to implement the research with a bottom-up approach as much as possible
so as to consider the realities on the ground. For example, the team has continued to pay careful
attention to the future of renewable mini-grid businesses and their indispensable role in the
region’s energy development. At the same time, as noted earlier, the team is just beginning to
understand the issues from a higher point of view, taking other socially important values into
consideration.
It should be noted that the energy policy in Myanmar could play a more important role in the
future if it were designed and implemented in the way where its multifaceted nature was well
considered, since many of the challenges included in the Sustainable Development Goals are real
in Myanmar, and the role of energy and its access would be more appreciated here than in any
other country.
Lastly but not least, I would like to express my sincere appreciation to the Economic Research
Institute for ASEAN and East Asia for the continued support for our research.
Prof. Hisashi Yoshikawa
Working Group Co-leader (2018)

v
List of Abbreviations
ADB Asian Development Bank
ASEAN Association of Southeast Asian Nations
CPI China Power Investment Corporation
DRD Department of Rural Development
GEI Global Environmental Institute
JICA Japan International Cooperation Agency
LCOE Levelised cost of electricity
LNG Liquefied natural gas
LPG Liquefied petroleum gas
LIB Lithium ion batteries
MOEE Ministry of Electricity and Energy
MW Megawatt
MWh Megawatt hour
MoU Memoranda of understanding
NEP National Electrification Plan
NEMP National Electricity Master Plan
NLD National League for Democracy
PV Photovoltaic
PARI Policy Alternatives Research Institute
SWOT Strengths, weaknesses, opportunities, and threats
SHS Solar home system
US EIA United States Energy Information Administration

vi
Acknowledgments
We would like to express our gratitude to the Economic Research Institute for ASEAN and East
Asia (ERIA). We acknowledge the support of Dr. Venkatachalam Anbumozhi and Mr. Shigeki
Kamiyama of ERIA for this initiative.
Throughout the project, we benefited from discussions with policymakers, stakeholders, and
researchers in Myanmar and beyond. In particular, we would like to thank U Wunna Swe of the
Mandalay Technological University.

vii
List of Project Members
Leader:
Prof. ICHIRO SAKATA, Ph.D.
Professor, Graduate School of Engineering/Policy Alternatives Research Institute; Special Advisor
to the President, the University of Tokyo
Co-leaders:
Prof. HISASHI YOSHIKAWA
Project Professor, Policy Alternatives Research Institute/Graduate School of Public Policy, the
University of Tokyo
Prof. HIDEAKI SHIROYAMA
Vice-Director, Policy Alternatives Research Institute; Professor, Graduate School of Public
Policy/Graduate Schools of Law and Politics, the University of Tokyo
Members:
MASAHIRO SUGIYAMA, Ph.D.
Associate Professor, Policy Alternatives Research Institute, the University of Tokyo
KENSUKE YAMAGUCHI, Ph.D.
Project Assistant Professor, Policy Alternatives Research Institute, the University of Tokyo
DANIEL DEL BARRIO ALVAREZ, Ph.D.
Project Researcher, Policy Alternatives Research Institute, the University of Tokyo
YOSHIMASA ISHII
Project Researcher, Policy Alternatives Research Institute, the University of Tokyo
MASAKO NUMATA
Project Academic Support Specialist, Policy Alternatives Research Institute,
the University of Tokyo
Collaborators:
Prof. DANIEL KAMMEN, Ph.D.
Professor of Energy, Energy and Resources Group; Professor in the Goldman School of Public

viii
Policy; Co-Director, Berkeley Institute of the Environment; Founding Director, Renewable and
Appropriate Energy Laboratory, University of California, Berkeley
REBEKAH SHIRLEY, Ph.D.
Post-doctoral Researcher, Renewable and Appropriate Energy Laboratory, University of California,
Berkeley
NOAH KITTNER, Ph.D.
Researcher, Renewable and Appropriate Energy Laboratory, University of California, Berkeley
SAMIRA SIDDIQUE
Doctoral Student Researcher, Renewable and Appropriate Energy Laboratory, University of
California, Berkeley
NKIRUKA AVILA, Ph.D.
Senior Research Scientist, Renewable and Appropriate Energy Laboratory, University of California,
Berkeley

ix
Contributing Authors
In addition to ERIA project members, the following energy experts have contributed to this
report:
Liu Dawei, Ph.D.
Associate Research Fellow, School of Government, Sun Yat-sen University
G. Mathias Kondolf, Ph.D.
Professor of Environmental Planning, College of Environmental Design, the University of
California, Berkeley
Rafael Schmitt, Ph.D.
Visiting Postdoctoral Scholar, College of Environmental Design, the University of California,
Berkeley

x
Contents
Executive Summary xiii
Chapter 1 Introduction 1
Chapter 2 Overview of Myanmar Energy Situation 4
Chapter 3 Myanmar Power Development Pathways for Low Costs 19
and Low River Impacts
Chapter 4 SWOT Analysis of Utility-Scale Solar Energy in Myanmar 34
Chapter 5 Potential of Mini-Grids and Barriers to Development 55
Chapter 6 Environmental and Social Guidelines on China’s Foreign 83
Investments and the Myitsone Dam Controversy
Chapter 7 Policy Recommendations 95
References 98
Appendices 114

xi
List of Figures
Figure 2-1 Total Primary Energy Supply (ktoe) ................................................................... 9
Figure 2-2 Total Final Consumption (in ktoe) ..................................................................... 9
Figure 2-3 Total final consumption by sector (ktoe) ........................................................ 10
Figure 2-4. Electricity Production (GWh) ......................................................................... 10
Figure 2-5. Electricity Consumption Per Capita (kWh/capita) ......................................... 10
Figure 2-6. Electricity Consumption In Selected ASEAN Countries (kWh/capita, 2015) .. 11
Figure 2-7. Installed Capacity By Scenario and Source in the NEMP by 2030 (MW) ....... 13
Figure 2-8 Electrification Rates From Multiple Sources ................................................... 17
Figure 3-1. Current Installed Power Generation Mix in Myanmar by Generation Type .. 22
Figure 3-2. Planned Business as Usual Capacity Expansion Based on JICA Scenarios ..... 27
Figure 3-3. Low-cost Solar Capacity Expansion Case ....................................................... 28
Figure 3-4. ASEAN Power Grid Participation Capacity Expansion Pathway ..................... 29
Figure 4-1. Photovoltaic Power Potential in Myanmar .................................................... 43
Figure 4-2. Elevation Map of Myanmar ........................................................................... 44
Figure 4-3. Yearly Approved Amount of Foreign Investment in Myanmar (US$ million) . 52
Figure 4-4. Corruption Perception Index for Selected Countries (2012–17) ................... 52
Figure 5-1. Load A: Night Only ......................................................................................... 59
Figure 5-2. Load B: Day and Night .................................................................................... 60
Figure 5-3. Calculation Results of LCOE: Load A (Night Only) .......................................... 69
Figure 5-4. Calculation Results of LCOE: Load B (Night and Day) ..................................... 69
Figure 5-5. Comparison of Tariffs and LCOE Values ......................................................... 71
Figure 6-1. Public Interest in the Issue Attention Cycle ................................................... 87
Figure 6-2. Number of Chinese Hydropower Development ............................................ 87
Figure 6-3. Chinese Hydropower Development in Cambodia, Lao PDR, and Myanmar .. 88
Figure 6-4. Location of the Myitsone Hydropower Development Project ....................... 89

xii
List of Tables
Table 1-1. Structure of the Report ......................................................................................... 1
Table 2-1. Population in Administrative Divisions in Myanmar ............................................. 6
Table 2-2. Economic and Trade Indicators ............................................................................. 7
Table 2-3. New Natural Gas and LNG Power Generation Projects Approved in 2018 ......... 15
Table 3-1. System Parameters and Scenario Summary Compared to the JICA Model and
Assumptions Using Capacity Expansion Model (an Excel based tool). ........................ 24
Table 3-2. Technology and Capital Cost Assumptions Compared with Business-As-Usual
Scenario ....................................................................................................................... 25
Table 3-3. Variation of Capacity Factors, Both Real and Observed for Myanmar Based on
Existing Literature ........................................................................................................ 25
Table 4 1. SWOT Framework…………………………………………………………. .................................. 37
Table 4-2. Installed Capacity Under Official and Alternative Scenarios by 2030 (MW) ....... 38
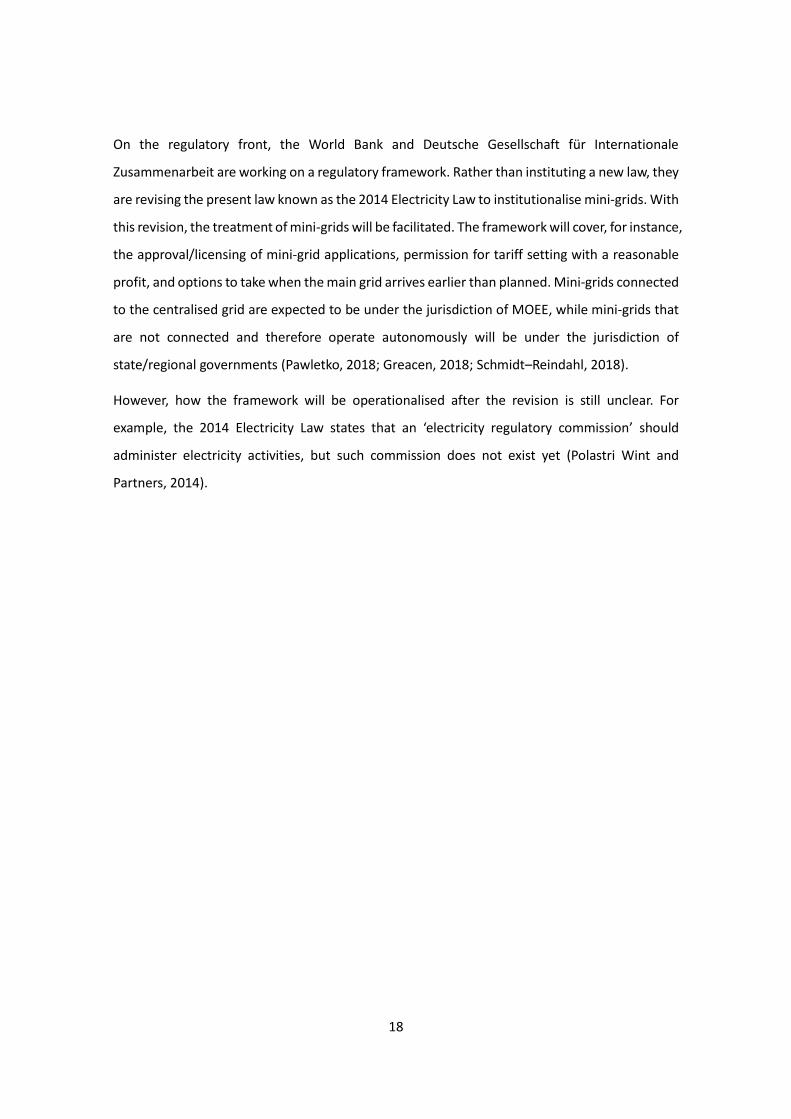
Table 4-3. Utility-scale Solar Projects Under Development in Myanmar ............................ 40
Table 4-4. SWOT Analysis of Utility-Scale Solar Energy in Myanmar ................................... 41
Table 4-5. Electricity Tariff for On-Grid Residential Consumers ......................................... 477
Table 4-6. Electricity Tariff for On-Grid Industrial and Commercial Consumers .................. 47
Table 5-1. Scenarios and Their Capacities ........................................................................... 62
Table 5-2. General Assumptions for Calculations ................................................................ 62
Table 5-3. Assumptions for Diesel-powered Mini-grids ....................................................... 63
Table 5-4. Assumptions for Solar PVs and Batteries ............................................................ 65
Table 5-5. Barrier Typology .................................................................................................. 70
Table 5-6. Barriers and Their Current Status........................................................................ 81

xiii
Executive Summary
Two years have passed since Daw Aung San Suu Kyi took office in 2016 as state counsellor of
Myanmar, a key country in the Greater Mekong Subregion. Although the new administration has
implemented various policies, the electric power sector has remained one of the bottlenecks to
economic development. Urban areas continue to suffer from frequent blackouts, discouraging
foreign investments in factories. Many rural residents have yet to enjoy modern electricity
services. The lack of economic progress is one of the reasons ethnic conflicts continue in remote
areas. This report’s policy analysis of the Myanmar power sector aims to assist policymakers and
stakeholders as it looks at electricity futures that foster sustainable and inclusive development,
which then could help address the conflict issues.
Main-grid power development and connectivity
In 2014, the government of Myanmar released its power development plan for review. The plan
contains a vast number of large-scale hydropower plants as well as coal-fired power plants,
which could create a myriad of sustainability issues. In this study, a power capacity expansion
model is thus used to analyse the impacts of the power sector policy. The analysis demonstrates
that scenarios featuring variable and small-scale renewables and Association of Southeast Asian
Nations (ASEAN) interconnections are not only environmentally friendly but also economically
efficient (Table 1). A combined energy-hydrology model analysis was also conducted, which
showed that removing the most damaging hydropower dams from the energy mix can still retain
a significant amount of electricity generation capacities as well as will conserve the Salween
(Thanlwin) and Irrawaddy (Ayeyarwady) river ecosystems by reducing sediment trapping.
Table 1. Summary of the Analysis Using a Power Capacity Expansion Model
Scenario Notes Estimated Capital
Cost Expenditure
2014 National
Electricity Master
Plan
Follows guidelines and assumptions in
the 2014 power development plan. In
the original study, renewables are
treated exogenously; renewables are
added into the assumption mix and
optimise endogenously.
US$11.7 billion
Low-cost distributed
energy resources
Follows current technology innovation
and learning for renewable energy
resources including solar photovoltaics,
small-scale hydropower, wind, and
energy storage facilities
US$8.1 billion

xiv
ASEAN Power Grid
(APG) Participation
Follows current technology innovation
and learning while participating in an
expanded power trade market for
electricity imports and exports; APG
includes 15 priority interconnection
projects identified at the ASEAN level
US$8.4 billion
Source: Authors.
The analysis shows the importance of utility-scale solar photovoltaics, along with other
renewables. A strengths, weaknesses, opportunities, and threats (SWOT) analysis of utility-scale
solar energy in Myanmar was done as a preparatory step towards developing a solar policy
framework. The Central Dry Zone is endowed with great solar resources and close to the main
grid. In light of the global trend of ever-falling costs of solar photovoltaics, it would be possible
to generate solar power at an affordable price. Solar plants can be built with a short lead-time
so as to rapidly expand the generation capacity, which will help reduce the blackouts in urban
areas. The question of how to streamline regulations for investment is an area that needs policy
attention.
With regard to large-scale hydropower projects, the study conducted a case study on the
Myitsone mega-dam project and analysed the decision-making process on the Chinese side.
Findings show that the campaigns launched and the subsequent public sentiments against the
Myitsone hydropower project led to the adoption of environmental and social guidelines on
power plants in China. This guideline from China defines the responsibility of their investors over
the environmental and social impacts of their investment activities on host countries.
Rural electrification with renewable-based mini-grids
The Myanmar government has set the goal of universal electrification by 2030. To accelerate
rural electrification, the nation should look at all possible solutions: main-grid extension, solar
home systems (SHSs), and mini-grids. In particular, mini-grids can be used not only for lighting
and mobile charging but also for entertainment purposes as well as productive uses. One of the
barriers to the wide diffusion of mini-grids is stakeholders’ lack of an understanding of both the
financial and non-financial aspects of renewable-based mini-grids.
The financial viability of mini-grids was assessed by calculating the levelised costs of electricity
for various types of mini-grids (Figures 1 and 2). Compared to the currently dominant diesel
option, mini-grids for renewables are found to be economically viable, especially in remote rural
areas faced with high diesel prices.

xv
Figure 1. Levelised Costs of Electricity of Different Mini-Grid Configurations:
For Cases With a Night-Only Load Profile
PV = photovoltaic; OM = operation and maintenance; LIB = lithium ion battery; FP = fuel price
Source: Authors.
Figure 2. Levelised Costs of Electricity of Different Types of Mini-grids: For Cases with a Load
Profile for Both Day and Night
PV = photovoltaic; OM = operation and maintenance; LIB = lithium ion battery; FP = fuel price.
Source: Authors.
Despite good economic prospects, the distribution of mini-grids has been slow. This shows that
there is a need to understand the barriers to the development of mini-grids in Myanmar. Table
2 shows the barriers to mini-grid development, based on the literature review and discussions
with stakeholders and experts. The study found that although Myanmar shares a common
problem with low electrification with other developing countries, certain issues such as
indigenous mini-grid technologies are unique to Myanmar and deserve careful consideration.
0.00 0.20 0.40 0.60 0.80
(6) Load night only, PV + battery + diesel, FP x…
(5) Load night only, PV + battery + diesel, FP x 1,…
(4) Load night only, (2020) PV + battery, LIB
(3) Load night only, PV + battery, VRLA(current)
(2) Load night only, Diesel, FP x 2.7
(1) Load night only, Diesel, FP x 1
[USD/kWh]Initial PV OM PVInitial Battery Replace BatteryOM Battery Initial DieselOM Diesel Fuel costs
0.27
0.70
0.68
0.260.54
0.75
0.0 0.2 0.4 0.6 0.8
Load night & day, PV + battery + diesel, VRLA,…
(11) Load night & day, PV + battery + diesel,…
(10) Load night & day, (2020) PV + battery, LIB
(9) Load night & day, PV + battery, VRLA
(8) Load night & day, Diesel, FP x 2.7
(7) Load night & day, Diesel, FP x 1
[USD/kWh]Initial PV OM PVInitial Battery Replace BatteryOM Battery Initial DieselOM Diesel Fuel costs
0.25
0.410.63
0.62
0.69
0.26
(1a) Load Night only Diesel FP x 1
(2a) Load Night only Diesel FP x 2.7
(3a) Load Night only PV Lead-acid
(4a) Load Night only (Future) PV LIB
(5a) Load Night only PV Lead-acid Diesel FP x 1
(6a) Load Night only PV Lead-acid Diesel FP x 2.7
(1b) Load Night & Day Diesel FP x 1
(2b) Load Night & Day Diesel FP x 2.7
(3b) Load Night & Day PV Lead-acid
(4b) Load Night & Day (Future) PV LIB
(5b) Load Night & Day PV Lead-acid Diesel FP x 1
(6b) Load Night & Day PV Lead-acid Diesel FP x 2.7

xvi
Table 2. Barriers to the Development of Mini-grids
Category Sub-categories
Financial Access to financing, high capital cost, insufficient capital (developer),
Insufficient capital (consumer), currency risk, long payback period.
Economic High transaction costs, small market size, low demand, tariff structure:
(cost-revenue gap), customers’ ability to pay, revenue collection
uncertainty
Social/cultural Negative externalities caused by international organisations, education,
community acceptance, geographical difficulty, perception of inferior
quality, theft and non-technical loss, shared resource
Technical Indigenous technology, lack of local expertise, durability and quality,
operation and maintenance, intermittency, lack of interoperability with
main grid
Regulatory Lack of regulatory framework, institutional capacity, lack of technical
standards and codes, threat of grid extension, lack of enforcement
Source: Authors.
Policy Recommendations
Based on its results, the study provided the following policy recommendations:
Main-grid capacity expansion
• Alternative power development plans that exclude those large-scale hydropower
plants contributing the most damage to the environment can help towards
ecological and social stability while achieving economic efficiency. In addition,
Myanmar can take advantage of the falling cost of solar electricity by making a
strategic priority in the power development plan.
Rural electrification through renewables-based mini-grids
• To accelerate the diffusion of mini-grids, businesses’ use of electricity during
daytime hours in rural areas should be encouraged to make mini-grid businesses
sustainable. It is also crucial to create a supportive financing scheme for mini-grid
developers/operators. Finally, the establishment of technical standards and codes
for renewable energy equipment is urgently needed.
• To better achieve effective and strategic electrification, a single governmental body
should be responsible for both on-grid and off-grid measures.

xvii
Investment environments and connectivity
• Participation in a regional power grid markets (e.g., Greater Mekong Subregion,
ASEAN Power Grid, and the South Asia Subregional Economic Cooperation) will
provide Myanmar an opportunity to expand its access to electricity, meet rising
urban power demand, and minimise environmental and societal risks.
• International society should help secure communication lines between foreign
investors and Myanmar’s local communities as early as the pre-project phase of
large-scale hydropower developments.
• The government of Myanmar should prioritise the development of a policy
framework that will streamline investments (e.g., for utility-scale solar).

1
Chapter 1
Introduction
Myanmar’s sustainable development heavily depends on the appropriate improvement of its
power sector. Its transition from military rule to democracy has brought in international
assistance and private investment interests, paving the way for new resources and alternatives
for the government to develop its energy-related policy programmes. The government’s policy
programmes have benefited from the support of international donors and cover the Energy
Master Plan (Asian Development Bank), the National Electrification Plan (World Bank), and the
National Electricity Master Plan (Japan International Cooperation Agency). In a rapidly changing
environment, there is a need to review these programmes as they are being implemented, or
they may even have to be updated before implementation.
This report analyses most of the salient points in Myanmar’s policies for the power sector. The
guiding research questions are: How can Myanmar’s future electricity sector be sustainable and
conducive to inclusive development, and contribute to conflict resolution? What kind of policies
will be able to assist such progress? These questions are examined from both the main-grid and
off-grid perspectives.
As the related issues are wide-ranging, multiple methods are used to explore the future of
Myanmar’s electricity sector. Table 1-1 shows the structure of the report. The outputs and
recommendations are the result of desk research and numerous engagements with local and
international stakeholders through workshops, seminars, interviews, as well as one-on-one
discussions.
Table 1-1. Structure of the Report
Category Chapter Issue and Method
Overview Chapter 2 Recent policy development; literature review
On-grid issues
(including
connectivity)
Chapter 3
Power development plans;
Energy/environmental modeling
Chapter 4 Solar photovoltaics deployment; SWOT analysis

2
Off-grid issues Chapter 5 Rural electrification with mini-grids;
techno-economic modeling and barrier analysis
Foreign
investment
Chapter 6 The Myitsone Dam;
analysis of policy process
SWOT = strengths, weaknesses, opportunities, and threats
Source: Authors.
Chapter 2 provides an overview of Myanmar’s power-sector policy, focusing on recent
developments. The country’s electricity supply is still very low, both in terms of its quantity and
quality.
Chapter 3 analyses opportunities for the sustainable development of the large hydropower
potential of the country. In particular, it explores an optimal dam portfolio from a sediment
trapping point of view. The current government’s capacity expansion plan is found to have a
severe impact on the ‘health’ of the basins. An alternative hydropower development plan that
excludes the most damaging ones can reduce the impact while maintaining the electricity
generation and economic development activities. This would also allow for the development of
power generation from solar, natural gas, biomass, and small hydro plants, which can substitute
for power generation from large-scale hydropower.
Chapter 4 looks at the possible role of utility-scale solar energy. Myanmar, a key state in the
Greater Mekong Subregion, is far behind neighbouring countries and global trends in terms of
turning to solar generation. Previous studies revealed that there is a high technical and economic
potential in the nation, especially in the Central Dry Zone. Using a strengths, weaknesses,
opportunities, and threats (SWOT) framework, the chapter sheds light on the drivers and
bottlenecks of a solar energy strategy in Myanmar.
Chapter 5 discusses the potentials of mini-grids for rural electrification and analyses the barriers
to the deployment of such option in Myanmar. In particular, the use of clean energy sources
should be preferred over fossil fuels. This study first calculates the levelised cost of electricity
(LCOE) of diesel, solar + battery, and solar + battery + diesel mini-grids, using data collected from
private developers in Myanmar. Then, the barriers for renewable energy-based mini-grids in
Myanmar are explained based on data from existing literature as well as interviews conducted
with different stakeholders, such as officers from international development organisations,

3
private companies, nongovernmental organisations, and local researchers.
Chapter 6 explores the suspension of the Myitsone mega-hydropower project, and traces the
process behind the publication of the social and environmental guideline for China’s projects in
foreign countries. A framework called the Issue Attention Cycle model, which was originally
found in democratic institutions, was discovered to be applicable to the Chinese socialistic
decision-making process. This has a policy implication on how Myanmar should deal with foreign
investments for its future power projects.
Chapter 7 concludes with policy recommendations for Myanmar’s power sector and related
policy areas.

4
Chapter 2
Overview of Myanmar Energy Situation
Myanmar is experiencing a major political, economic, and social transition from what was once
under a military regime to today’s open democracy. In this process, electrification of the country
is expected to play a fundamental role in its development.
The energy policy landscape of Myanmar remains in flux. A new minister of Energy and Electricity
was appointed in 2017, bringing new perspectives to the ministry. Liquefied natural gas (LNG)
was chosen as a strategic option in the face of rising energy demands. Four projects were
approved and expected to start operation by 2021. Meanwhile, liquefied petroleum gas (LPG)
has been recently targeted as a means to reduce the electricity consumption in urban areas.
Coal remains a highly disputed resource. The union government has explicitly refused to
continue its development, while the Kayin state government is working to support a 1,280 MW
coal-fired project. In all these, one needs to also remember that rapid urbanisation will continue
to drive the electricity demand in major cities.
In rural areas, on the other hand, the government has made some headways in its support for
mini-grids. Recent policy directions have been focusing on the formulation of regulations for off-
grid projects.
2.1 Background: Myanmar Transition from Military to Democracy
Myanmar, formerly known as Burma, is the largest country in continental Southeast Asia. It is
even slightly larger than Thailand. It is a multi-ethnic country, with 135 different groups
recognised. Majority is composed of ethnic Burmese, while other large groups include Chin,
Kachin, Karenni, Karen, Mon, Rakhine, Rohingya, and Shan (Oxford Burma Alliance, n.d.).
The country was under various phases of British colonial control between 1824 and 1948, after
the defeat of the Burmese monarchy in three wars. A British-like administration was attempted
to be introduced during this period (Thant Myint-U., 2008). After it obtained its independence

5
in 1948, Myanmar entered its democratic era. It then experienced a period of military
dictatorship after General Ne Win staged a coup d’etat in 1962.
Myanmar initiated a gradual opening and transition towards democracy in 2008. A new
constitution was approved and elections were held. U Thein Sein, who became president in 2007
and led the transition towards democratic elections, was in charge of this process. After the
elections in 2012, the National League for Democracy (NLD) won most of the seats. The NLD was
the main party opposing the military rule and founded by Aung San Suu Kyi, the main figure of
the opposition, daughter of the country’s hero Aung San, and Peace Nobel laureate (Rieffel,
2016).
The NLD achieved a landslide victory during the 8 November 2015 election (Hulst, 2015;
Whiteman, 2016). However, Aung San Suu Kyi did not become president because the
constitution does not allow locals from assuming the presidency if they have foreign family
members (Cochrane, 2017). Instead, her close ally U Htlin Kyaw became president, while the new
position of state counsellor was created for her (Mclaughlin, 2016).
2.2 Energy Sector in Myanmar: Country-wide Implications
Energy is expected to play a central role in the democratisation and modernisation of Myanmar
(Loftus, 2016). However, the nation’s electrification rate as well as the consumption of electricity
remain very low.
In urban areas, the reliability of the supply remains an issue. A successful country-wide
electrification process also affects the legitimation of the reform agenda in Myanmar (Ross,
2015). Myanmar needs to also increase its generation capacity to meet the needs of the
population and the rapid rise in urban population and industry. Moreover, to be consistent with
the United Nations Sustainable Development Goals and the Paris Agreement, Myanmar must
meet such goals in a sustainable and inclusive manner by harnessing the potential of renewable
energy.
Myanmar is eminently rural (Table 2-1), with the exception of Yangon, the former capital city and
still the country’s major economic hub.

6
Table 2-1. Population in Administrative Divisions in Myanmar
State /
Region Male Female Total
% of
Total Area (sq km)
Urban
Area (%)
Rural
Area (%)
Kachin 878,384 811,057 1,689,441 3 89,041.80 36 64
Kaya 143,213 143,414 286,627 1 11,731.51 25 75
Kayin 775,268 798,811 1,574,079 3 30,382.77 22 78
Chin 229,604 249,197 478,801 1 36,018.90 21 79
Sagaing 2,516,949 2,808,398 5,325,347 10 93,702.48 17 83
Tanintharyi 700,619 707,782 1,408,401 3 43,344.91 24 76
Bago 2,322,338 2,545,035 4,867,373 9 39,404.43 22 78
Magway 1,813,974 2,103,081 3,917,055 8 44,820.58 15 85
Mandalay 2,928,367 3,237,356 6,165,723 12 30,888.09 35 65
Mon 987,392 1,067,001 2,054,393 4 12,296.64 28 72
Rakhine 1,526,402 1,662,405 3,188,807 6 36,778.05 17 83
Yangon 3,516,403 3,844,300 7,360,703 14 10,276.71 70 30
Shan 2,910,710 2,913,722 5,824,432 11 155,801.38 24 76
Ayeyawady 3,009,808 3,175,021 6,184,829 12 35,031.88 14 86
Nay Pyi Taw 565,155 595,087 1,160,242 2 7,075.10 32 68
Union 24,824,586 26,661,667 51,486,253 100 676,577.23 30 70
Source: Ministry of Immigration and Population (2015).
Myanmar has become one of the fastest growing countries in the region: up until 2014, its
economic growth had been constantly above 7% (Lwin, 2015) (Table 2-2). Its low labour cost has
made Myanmar an attractive location for manufacturing industries (Matsui, 2017b).
Nevertheless, natural gas has traditionally been, and still is, the largest export product of the
country and the main source of foreign currencies during its period of isolationism. Myanmar

7
exports about 90% of its natural gas production from four active gas fields, signing export
contracts with countries such as Thailand and China. Agriculture constitutes the main part of the
national economy – about 38% of the GDP – and employs 60% of the population (World Bank,
2016a). It also comprises 25% to 30% of the export earnings (FAO, 2018). It is commonly said
that anything can be planted in Myanmar because the soil is considered to be the most fertile in
Asia (Zorya, 2016). Nevertheless, isolation and stagnation have led the country to be the least
profitable in the region. In 2015, the government decreed a rice export ban for six weeks (Wai
and Aung, 2015). Tourism has been growing and the government has tried to stimulate it;
however, it still is largely limited by political factors.
Table 2-2. Economic and Trade Indicators
Indicator 2000 2005 2010 2011 2012 2013 2014 2015
Population
(million)*
47.67 49.98
51.73 52.13 52.54 52.98 53.44 53.90
GDP (current
US$ billion)*
8.90 11.97 49.54 59.98 59.73 60.13 65.57 62.60
GDP growth (%)* 13.75 13.57 13.08 11.99 10.26 10.55 9.63 5.59
GDP per capita
(current US$)* 187 239 958 1,151 1,137 1,135 1,227 1,161
Human
Development
Index (HDI)**
0.427 0.474 0.526 0.533 0.540 0.547 0.552 0.556
Inflation (average
consumer
prices)***
15.63 48.499 97.379 96.314 100.855 107.164 113.72 123.33
FDI approved
(US$ million)****
- 6,065 19,999 4,644 1,419 4,107 8,010 9,481
FDI, net inflows
(current million
US$)*
255 235 901 2,520 1,333 2,254 2,175 4,083

8
FDI (%GDP)* 2.86 1.96 1.82 4.20 2.23 3.75 3.32 6.52
Import value
index (2000 =
100)*
100 80.48 200.75 380.40 388.10 507.93 684.39 738.34
Export value
index (2000 =
100)*
100 233.09 534.58 570.19 547.90 693.31 680.84 685.49
Exports
(US$ million)*
- - 8,829 10,228 10,379 11,957 14,653 16,459
Imports
(US$ million)*
- - –
8,184
–
10,453
–
12,499
–
13,987
–
16,341
–
18,403
Sources: *World Bank (WB), **United Nations Development Programme (UNDP),
***International Monetary Fund (IMF), ****Directorate of Investment and Company
Administration (DICA).
2.2.1 Energy Demand and Usage in Myanmar
Myanmar’s energy supply is highly dependent on traditional biomass. Figures 2-1 and 2-2 show
the total primary energy supply and final consumption in the 2000s. From about 70% at the
beginning of the century, the portion of biofuels and waste in the total energy supply has only
slightly dropped to 60%. Today, oil products have been experiencing an abrupt increase since
2011. Meanwhile, natural gas production and consumption have remained relatively stable. The
contribution from coal has not been significant.
The residential sector is the largest energy consumer, as seen in Figure 2-3, although
consumption by the transport sector has been growing in the last decade. Meanwhile, industry
has remained stable at about 10%–12% of the total consumption. Other sectors’ consumption
continues at much lower levels.

9
Figure 2-1 Total Primary Energy Supply (ktoe)
Source: International Energy Agency data.
Figure 2-2 Total Final Consumption (in ktoe)
Source: International Energy Agency data.
0
5000
10000
15000
20000
25000
2000 2001 2002 2003 2004 2005 2006 2007 2008 2009 2010 2011 2012 2013 2014 2015
Coal Crude oil Oil products Natural gas
Nuclear Hydro Geothermal, solar, etc. Biofuels and waste
Electricity Heat
0
2000
4000
6000
8000
10000
12000
14000
16000
18000
20000
2000 2001 2002 2003 2004 2005 2006 2007 2008 2009 2010 2011 2012 2013 2014 2015
Coal Crude oil Oil products Natural gas
Nuclear Hydro Geothermal, solar, etc. Biofuels and waste
Electricity Heat

10
Figure 2-3 Total final consumption by sector (ktoe)
Source: International Energy Agency data.
Figure 2-4. Electricity Production (GWh)
Source: International Energy Agency data.
2.2.2 Rising Electricity Demand
Myanmar’s electricity production was near 16,000 GWh in 2015 – a two-fold increase since 2010.
The generation mix is dominated by hydropower and gas. Hydropower constitutes between 60%
0
2000
4000
6000
8000
10000
12000
14000
16000
18000
20000
2000 2001 2002 2003 2004 2005 2006 2007 2008 2009 2010 2011 2012 2013 2014 2015
Industry Transport Residential
Commercial and public services Agriculture / forestry Fishing
Non-especified Non-energy use
0
2000
4000
6000
8000
10000
12000
14000
16000
18000
2000 2001 2002 2003 2004 2005 2006 2007 2008 2009 2010 2011 2012 2013 2014 2015
Hydro
Gas
Oil
Coal
11
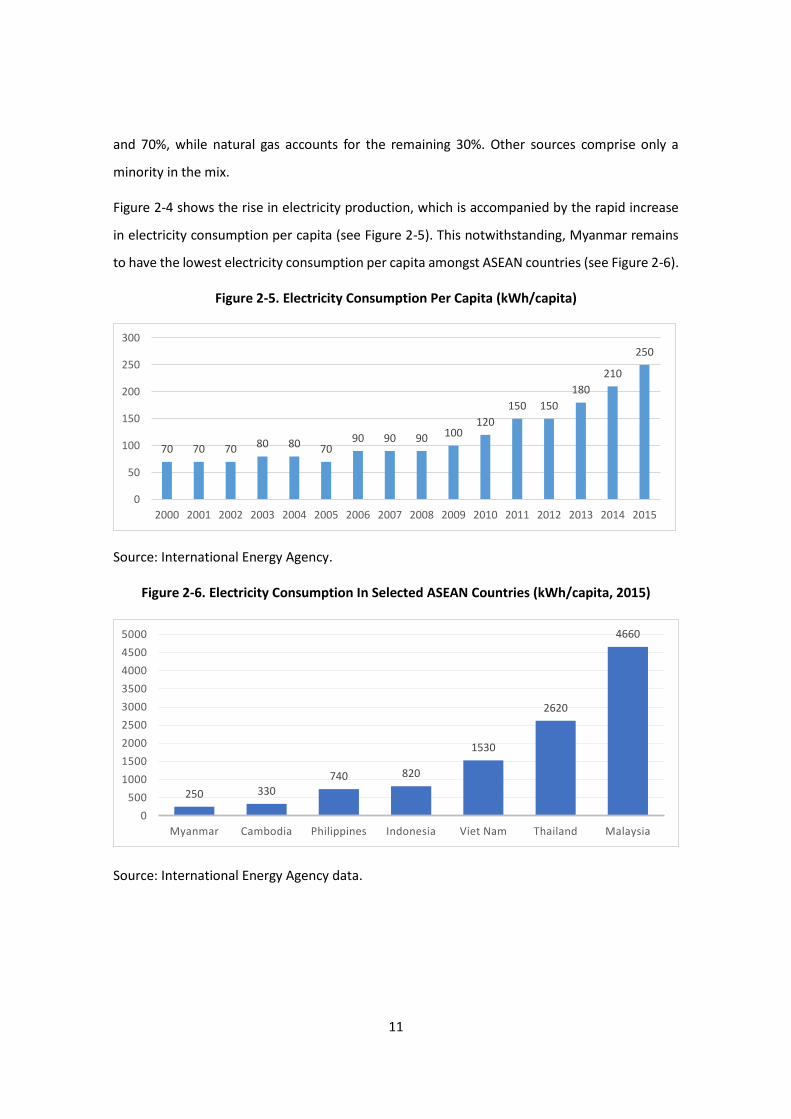
and 70%, while natural gas accounts for the remaining 30%. Other sources comprise only a
minority in the mix.
Figure 2-4 shows the rise in electricity production, which is accompanied by the rapid increase
in electricity consumption per capita (see Figure 2-5). This notwithstanding, Myanmar remains
to have the lowest electricity consumption per capita amongst ASEAN countries (see Figure 2-6).
Figure 2-5. Electricity Consumption Per Capita (kWh/capita)
Source: International Energy Agency.
Figure 2-6. Electricity Consumption In Selected ASEAN Countries (kWh/capita, 2015)
Source: International Energy Agency data.
70 70 70 80 80 7090 90 90 100
120
150 150
180
210
250
0
50
100
150
200
250
300
2000 2001 2002 2003 2004 2005 2006 2007 2008 2009 2010 2011 2012 2013 2014 2015
250 330740 820
1530
2620
4660
0
500
1000
1500
2000
2500
3000
3500
4000
4500
5000
Myanmar Cambodia Philippines Indonesia Viet Nam Thailand Malaysia

12
2.3 Two-pronged Power Sector Challenge in Myanmar’s Rural Electrification, Generation
Expansion, and Tariff Reform
Myanmar is facing a two-pronged problem in the power sector. On one hand, a large portion of
the population has none or little access to electricity; on the other hand, the population
connected to the national grid experiences frequent blackouts.
2.3.1 Rural Electrification
Although there are varied figures available on Myanmar’s access to electricity, all sources agree
that at least half of the population lacks access to modern electricity. Furthermore, most
electrified rural communities rely either on diesel generators, which are economically and
environmentally costly; or on solar home systems, which do not provide sufficient power for
productive uses.
The government of Myanmar aims to achieve universal electricity access by 2030. The National
Electrification Plan, prepared with support from the World Bank, foresees that this will be
achieved mainly by expanding the national grid. However, a shift towards decentralised
alternatives such as mini-grids is gaining wider support. The Department of Rural Development
(DRD) is Myanmar’s leading governmental agency for rural electrification. The Electricity Law of
2014 favours decentralising the decision-making process for small off-grid projects. The Ministry
of Electricity and Energy’s (MOEE) approval is therefore not needed for projects of less than 30
MW and not connected to the national grid. The DRD has a wide network of representatives
across the country that facilitates its work with local communities. Nevertheless, an inefficient
coordination between the MOEE, which is in charge of the national grid, and DRD, which is under
the Ministry of Agriculture, Livestock, and Irrigation, can become a drawback in the realisation
of grid-ready projects.
2.3.2 Expansion of Generation Capacity
Increasing Myanmar’s generation capacity is a priority of the government. The National
Electricity Master Plan (NEMP), which the nation prepared with support from the Japan
International Cooperation Agency (JICA), analysed three possible scenarios for capacity
expansion:

13
1) Domestic Energy Consumption Scenario: maximisation of domestic power generation.
Hydropower and gas-fired plants are fully developed.
2) Least Cost Scenario: minimisation of overall generation cost. Coal-fired plants’
contribution increases, while that of gas-fired generation decreases.
3) Power Resource Balance Scenario: feasibility of projects is also considered. Only
hydropower plants with shorter lead-time and nearest to demand centres are developed.
Gas-fired generation is developed but constrained by secured fuel supply. Coal-fired
generation compensates the reduction in gas and hydro-power sources.
The Power Resource Balance Scenario was finally selected for the plan. Nevertheless, the large-
scale development of coal-fired generation plants has become very controversial. Currently, the
central government does not support the commissioning of new coal-fired generation plants.
The contribution from renewables as an exogenous assumption was set at 10% of the energy
capacity in the NEMP. The role of variable renewables eventually lessened. In Chapters 3 and 4,
such potential as well as barriers to the penetration of solar energy in the generation mix are
explored.
Figure 2-7. Installed Capacity by Scenario and Source in the NEMP by 2030 (MW)
NEMP = National Electricity Master Plan.
Source: Japan International Cooperation Agency (2015).
0
2000
4000
6000
8000
10000
12000
14000
Domestic Energy ConsumptionScenario
Least Cost Scenario Power Resources BalanceScenario
Gas Coal Hydro (large) Hydro (small and medium) Renewable

14
2.4 Update on the Myanmar Power Sector
2.4.1 Power Demand Will Continue Rising with New Mega-development Plans in Urban
Areas
Myanmar’s economy is expected to continue to grow in the coming years (Rab et al., 2016).
Urban areas are experiencing a refurbishing of the inner areas as well as expanding to adjacent
townships. Yangon, for example, has new development projects. With assistance from JICA, the
local government is drafting the Yangon 2040 Master Plan (Aye, 2017; JICA and YCDC, 2014),
which includes plans on a new airport, a second special economic zone, and access to a deep-
sea port (Mon and Aye, 2016). The Yangon New City project will extend Yangon to the other side
of the Yangon River. Its specially created authority, the New Yangon Development Company
Limited, has proposed a public–private partnership-based development of the 30,000 acre
(about 121 sq km) area, of which 20,000 acres will be developed during the first phase (Ko, 2018;
Shine and Ko, 2018). The Union government has also presented four large-scale development
projects in Yangon and Mandalay recently (Tha, 2018). All these initiatives represent an
opportunity to integrate rooftop solar systems in the urban development process.
2.4.2 Political Re-shuffle
The year 2017 saw a reshuffle of leadership at the MOEE and the country’s national government.
In July 2017, U Win Khaing was appointed as the new minister of Energy and Electricity, replacing
U Pe Zin Tun while remaining as head of the Ministry of Construction (Lynn, 2017a). After
Myanmar’s President U Htin Kyaw resigned, U Win Myint was appointed to the position in March
2018. Both are seen as loyal allies of Aung San Suu Kyi (Nang and Paddock, 2018).
The new energy minister identified his minister’s new priorities. In his first interview with
international media outfit Reuters (Lewis and Naing, 2017), the minister pointed out that: (i)
hydropower remains a priority, but in the future, no large dams are expected to be constructed
before 2025; and (ii) imports of LNG and small-scale hydropower projects will be prioritised, with
LNG to be used as part of the base load.
2.4.3 New Minister Advocates for Securing Supply in the Short Term: The Rise of LNG in
the Power Generation Mix and a Boost for LPG
The new minister strongly emphasised the need to increase the generation capacity in the fastest

15
possible manner. Such priority facilitated the speedy approval of the construction of four new
generation facilities, of which three are using imported LNG (Table 2-3). These are expected to
be operational, at least partly, by 2020. Some memoranda of understanding (MoUs) have been
signed with the MOEE while the signing of the power purchase agreements is still pending. The
final agreement on the price to be paid by the government will be critical in the sustainability of
the sector (Kean, 2018b).
Table 2-3. New Natural Gas and LNG Power Generation Projects Approved in 2018
Power plant Capacity
(MW)
Fuel Consortia Estimated Cost
(US$ million)
Ahlone 356 LNG to power, FSRU Toyo–Thai 321
Kanbauk 1,230 LNG to power, FSRU Total and
Siemens
Kyaukphyu 135 Combined-cycle gas
turbine (natural gas
from Shwe)
Sinohydro
and Supreme
180
Mee Laung
Gyaing
1,390 LNG to power, FSRU Zhefu and
Supreme
2,507
FSRU = Floating Storage Regasification Unit; LNG = liquefied natural gas.
Source: Kean (2018).
Liquefied Petroleum Gas has been identified recently by the government of Myanmar as a way
to reduce the consumption of electricity in urban areas. The current number of households that
utilise LPG for cooking is very low; a shift in consumption to LPG is seen as an opportunity to
‘free up’ the nation’s power generation capacity (K. Kyaw, 2018). The target is to increase the
consumer base of LPG users from the current 100,000–150,000 households to 1 million–1.5
million households by 2020 (Htoon, 2018; K. Kyaw, 2018).
There are a number of challenges the government must overcome to be able to scale up the use
of LPG. Adequacy of safety standards is the most worrisome (Chern et al., 2018). Myanmar has
also little capacity to generate LPG and to meet most of the current consumption demand. The
country demands 6,500 tons of LPG per month, of which 5,000 tons are currently being imported

16
(Eleven, 2018). Constraints in the supply chain and inadequate investments in the sector are also
identified as drawbacks (Chern et al., 2018).
2.4.4 Coal
The merits and downsides of coal-fired generation of electricity remain a highly deliberated issue.
The Union government does not favour any further development of the coal-fired electricity and
coal mining plants (Phyo, 2017). Nevertheless, a 1,280 MW coal-fired project in the Kayin state
has triggered a debate between the central and regional governments.
In the state government’s proposal, the project would be built near Hpa-an, the capital of Kayin,
by Toyo–Thai for US$2.8 billion (Mon, 2018). The state government reasoned that the project is
necessary to increase electrification and attract more foreign investments (Myint, 2017a). Part
of the public, however, opposed the project, claiming that there was lack of transparency in the
process (Han, 2018; Naing, Lee, and Yimou Lee, 2017; S. P. Win, 2018).
The Union government has, thus, stopped the project by virtue of the Electricity Law, which limits
state governments’ authority to approve power generation projects to those that are up to 30
MW only and not connected to the national grid (Htwe, 2017b; S. M. Mon, 2018b).
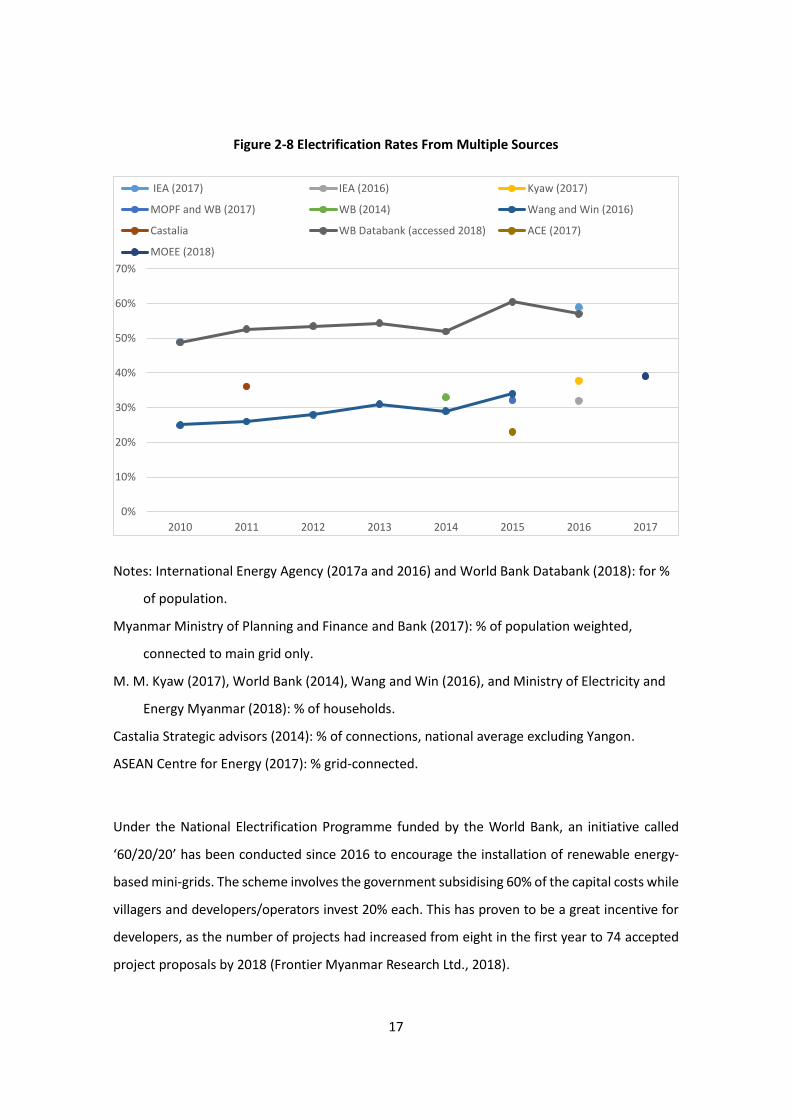
2.4.5 Rural Electrification Policy
The Myanmar government has set the goal of universal electrification by 2030, consistent with
Goal No. 7 of the 2015 United Nations Sustainable Development Goals. To explore how to
transition from the current situation to the desired state, it is crucial to understand the current
level of electrification. Numbers vary from report to report, however Figure 2-8 shows the
varying electrification rates based on different definitions, which makes it difficult to determine
the actual rate. According to a report that looked at electrification in detail (Myanmar Ministry
of Planning and Finance and Bank, 2017), the breakdown shows electrification through the main
grid of 32.5%; by communal or private grids, 10.6%; by SHS, 17.4%; by rechargeable battery
systems, 17.2%; and by others (e.g., power generator, solar lantern), 6%.
Most figures on electrification through the main grid are in the 23% to 32% range (ACE, 2017;
MOPF and World Bank, 2017). It seems that the main grid’s electrification rate is in the low 30%
range, growing to 40% when mini-grid connections are included, and jumping to around 60% if
SHSs are included.
17
Figure 2-8 Electrification Rates From Multiple Sources
Notes: International Energy Agency (2017a and 2016) and World Bank Databank (2018): for %
of population.
Myanmar Ministry of Planning and Finance and Bank (2017): % of population weighted,
connected to main grid only.
M. M. Kyaw (2017), World Bank (2014), Wang and Win (2016), and Ministry of Electricity and
Energy Myanmar (2018): % of households.
Castalia Strategic advisors (2014): % of connections, national average excluding Yangon.
ASEAN Centre for Energy (2017): % grid-connected.
Under the National Electrification Programme funded by the World Bank, an initiative called
‘60/20/20’ has been conducted since 2016 to encourage the installation of renewable energy-
based mini-grids. The scheme involves the government subsidising 60% of the capital costs while
villagers and developers/operators invest 20% each. This has proven to be a great incentive for
developers, as the number of projects had increased from eight in the first year to 74 accepted
project proposals by 2018 (Frontier Myanmar Research Ltd., 2018).
0%
10%
20%
30%
40%
50%
60%
70%
2010 2011 2012 2013 2014 2015 2016 2017
IEA (2017) IEA (2016) Kyaw (2017)
MOPF and WB (2017) WB (2014) Wang and Win (2016)
Castalia WB Databank (accessed 2018) ACE (2017)
MOEE (2018)
18
On the regulatory front, the World Bank and Deutsche Gesellschaft für Internationale
Zusammenarbeit are working on a regulatory framework. Rather than instituting a new law, they
are revising the present law known as the 2014 Electricity Law to institutionalise mini-grids. With
this revision, the treatment of mini-grids will be facilitated. The framework will cover, for instance,
the approval/licensing of mini-grid applications, permission for tariff setting with a reasonable
profit, and options to take when the main grid arrives earlier than planned. Mini-grids connected
to the centralised grid are expected to be under the jurisdiction of MOEE, while mini-grids that
are not connected and therefore operate autonomously will be under the jurisdiction of
state/regional governments (Pawletko, 2018; Greacen, 2018; Schmidt–Reindahl, 2018).
However, how the framework will be operationalised after the revision is still unclear. For
example, the 2014 Electricity Law states that an ‘electricity regulatory commission’ should
administer electricity activities, but such commission does not exist yet (Polastri Wint and
Partners, 2014).

19
Chapter 3
Myanmar Power Development Pathways
for Low Costs and Low River Impacts
This chapter describes Myanmar’s national energy expansion strategy. Next, in its analysis, this
chapter combines an energy planning model with the strategic planning of hydropower dam
portfolios that aim to simultaneously reduce the overall power cost as well as the sediment
impact loss from the most damaging hydropower development projects. Sediment loss is an
indicator of the level of environmental health and loss of land for agricultural production.
The modelling results demonstrate that renewables (excluding large-scale hydropower) and
participation in the ASEAN power grid have a great potential to sustain the future of Myanmar’s
electricity supply.
3.1 Introduction
Myanmar’s currently massive energy deficit hinders its economic development. Hence,
expanding its energy production capacity is a national priority. Channelling investment funds
towards low-cost and low-impact projects remains a key policy issue, given the ongoing tension
over hydropower development and other electricity options.
Myanmar’s power system is set to expand rapidly following an influx of foreign direct investment
and multilateral development bank efforts to increase the country’s access to electricity from
around 33% to 100%. These imminent investments in renewable and non-renewable sources of
electricity will determine the environmental and economic performance of Myanmar’s
electricity supply for the coming decades. Myanmar’s territory includes the Salween and
Irrawaddy Rivers, both harbouring considerable hydroelectric potential that could lay the
foundation for the country’s future in renewable energy use. Fully developing Myanmar’s
hydropower potential would, however, also lead to major long-term environmental impacts,
such as on the basins’ sediment budgets.

20
Myanmar’s current power development plan features substantial expansion of hydropower and
coal-fired power plants and downplays the possible expansion of other renewable resources
such as solar energy. Previous analyses have not properly considered the great potential of solar
power, nor did they pay attention to the environmental impact of large-scale hydropower.
Additionally, research works linking the capacity expansion of the energy sector with its
ecological impacts cannot be discounted. In Malaysian Borneo, for instance, the proposed
Sarawak Corridor of Renewable Energy (SCORE) framework for hydropower development both
entailed more upfront cost in the provision of electricity and harmed biodiversity for critical
species native to the river basin in Sabah and Sarawak (Shirley et al., 2015). Moreover, over the
past few decades, electricity resources in Myanmar and ASEAN have become less diverse and
more reliant on hydropower, which is susceptible to security risks, as well as human and
ecological damage to critical fisheries (Tongsopit et al., 2015). Plans developed by international
development partners have not fully explored the opportunity of developing solar, wind, and
biomass electricity projects that have gained technological learning and experienced significant
cost reductions during the past four years.
Planning a national energy system from the ground up offers the opportunity to make strategic
decisions regarding the development of an energy generation portfolio. Strategic decision-
making should aim to balance economic objectives (energy cost and availability) with
environmental objectives on multiple levels, from local to global. This could improve rural
livelihoods, enhance the reliability of the overall power system, and enable broader access to
clean electricity.
Compared to the common site-by-site, ad-hoc planning and development process, the strategic
planning and trade-off analyses of dams’ impacts and benefits can bring about dam portfolios
with significantly lesser conflict between hydroelectricity use and dam sediment trapping (and
other potential impacts) (Opperman et al., 2015; Schmitt et al., 2018). When expanding
hydropower, a strategic trade-off analysis can clarify the sequence in which dams should be built
to result in no-regret dam portfolios. It can also identify dam sites with the worst impact, and
thus have to be removed from consideration, and a limit for ‘sustainable’ dam development in a
basin (Schmitt et al., 2018). This type of analysis can be incorporated with power system
optimisation planning to evaluate the cost of an alternative future in energy.

21
Energy system planning frameworks can point out cost-effective and low-carbon pathways in the
expansion of a country’s electricity production using different sources of electricity (Kittner et
al., 2016). Such frameworks can inform decision makers about site selection and timing of future
hydropower development from an economic and carbon emission perspective, but not from the
perspective of the impact on river systems.
The Asian Development Bank (ADB) and other multilateral development banks have found a
significant potential for renewable energy development in Myanmar, yet have many of their
efforts centred on securing adequate hydropower capacity (ADB, 2015).
As an alternative, a few studies have aimed to understand the hydropower development plans
from a regional perspective, incorporating surplus electricity trade into a least cost model. Such
studies sought to understand what the true alternative energy costs are that will meet the
projected power demand growth and provide electricity access nationwide. In Lao PDR and other
countries along the Mekong, for instance, recent studies have found that exporting utility-scale
renewable energy such as solar and wind power could provide more reliable and secure export
revenues than would hydropower, which is susceptible to changing flows and river conditions
due to climate change (Avila et al., forthcoming).
This research builds on a framework designed to optimise dam portfolios for minimal sediment
trapping. Sediment trapping is the major cause of fish, land, and livelihood losses as a result of
hydropower development. For example, the Mekong River has experienced the effect of
sediment trapping due to decades of hydropower development.
Our research framework consists of estimates of sediment yield from various parts of the basin,
a simplified sediment routing model with a component for reservoir sediment trapping, and a
multi-objective evolutionary algorithm.1 Dam portfolios consist of dam sites that are identified
as candidates for development in the basin area (Open Development Mekong, 2014). That
framework is then coupled with another framework for evaluating strategies that aim to meet
Myanmar’s electricity demand through different mixes of energy sources (Kittner, Dimco, et al.,
2016).
1 See Garzanti et al. (2016), Kondolf et al. (2014), Schmitt et al. (2018), Hadka and Reed (2012).

22
The framework could be used to find optimal trade-offs amongst different objectives:
1) Total energy production coming from hydropower
2) Levelised cost of total electricity production from future portfolios [$/kWh]
3) Reduction in sediment load in the Irrawaddy [t/yr]
4) Reduction in sediment load in the Salween [t/yr]
Reducing the sediment load from the Irrawaddy and Salween river basins is challenging because
the total amount of sediments in each of these rivers depends not only on Myanmar’s dam
development decisions, but also on the amount of dam construction in the upstream parts of
these rivers in China.
3.2 Energy Modelling Scenarios
Figure 3-1 shows Myanmar’s installed electricity generation mix by generation type. Hydropower
currently provides the largest source of electricity generation, with natural gas and coal-fired
power stations comprising the remainder. There are still ample opportunities to diversify the
electricity sector.
Figure 3-1. Current Installed Power Generation Mix in Myanmar by Generation Type
Source: ADB (2016).
3%
38%
59%
coal
gas
hydro

23
A holistic approach to analysing the least cost development in the power sector helps target
those countries that could also pursue alternative investment plans in the energy sector to
promote financial and environmental sustainability.
The energy modelling tool employed here not only allows energy system experts to evaluate the
costs, benefits, and impacts of different projects; it also facilitates a dialogue with policymakers
in other areas as well as with the public over the need for, and costs and impacts of, different
energy pathways and strategies. No model is perfect, and all are limited by available data, but
the use of a clear, open-access model is vital in making all interested parties understand the
impact of individual projects and larger development objectives.
The Excel-based model determines the optimal generation portfolio based on the inputs on the
energy resource potential of the region, existing installed capacity, average capacity factors, and
peak contributions. It identifies discrete annual investment decisions by finding the least-cost
generation capacity additions needed to meet annual load and peak demand. The least-cost
generation mix is determined using a linear optimisation:
min𝐶
𝑁𝑃𝑉(𝐶𝑖)
Where the Total Generation Cost C𝑖 = Capital Cost ∗ Capacity + Variable Cost ∗ Generation
while Capital Cost is expressed in $/MW, Capacity in MW, Variable Cost in $/MWh, and
Generation is expressed in MWh. Capacity (MW) is the decision variable of the linear programme.
Table 3-2 summarises the system parameters and scenarios developed in comparison with the
JICA model (JICA, 2014).

24
Table 3-1. System Parameters and Scenario Summary Compared to the JICA Model
Scenario Notes Estimated
Capital Cost
Expenditure
Reference
Figure
JICA Masterplan Follows guidelines and assumptions
developed in the 2014 JICA Power
Development Plan. In the original study,
renewables are treated exogenously;
we add renewables into the assumption
mix and optimise endogenously.
US$11.7 billion Figure 3-2
Low-cost
distributed energy
resources
Follows current technology innovation
and learning for renewable energy
resources including solar PV, small-
scale hydropower, wind, and energy
storage facilities
US$8.1 billion Figure 3-3
ASEAN Power
Grid (APG)
Participation
Follows current technology innovation
and learning while participating in an
expanded power trade market for
electricity imports and exports; APG
includes 15 priority interconnection
projects identified at the ASEAN level
US$8.4 billion Figure 3-4
JICA = Japan International Cooperation Agency; PV = photovoltaic.
Source: Authors.

25
Table 3-2. Technology and Capital Cost Assumptions Compared with Business-As-Usual Scenario
Technology Lifetime
(Years)
Initial
Capital Cost
($2012/kW)
Capital
Cost
AGR (%)
Initial Fixed
O&M Cost
($2012/kW/yr)
Fixed
O&M
AGR (%)
Initial Variable
O&M Cost
($2012/MWh)
Variable
O&M
AGR (%)
Photovoltaic 20 1,100 -1.93% 25 -0.52% 0 0.00%
Wind 25 1,500 -0.35% 39 -0.37% 0 0.00%
Biomass 30 2,200 -0.27% 74 -0.27% 0 0.00%
Small-hydro 40 2,400 0.09% 59 0.09% 0 0.00%
Large-hydro 50 1,940 0.47% 47 0.44% 0 0.00%
Coal 40 1,200 0.00% 40 0.00% 4.47 0.00%
Natural Gas 30 900 0.00% 20 0.00% 3.6 0.00%
Diesel 20 371 0.00% 3 0.00% 13.88 0.00%
O&M = Operation and Maintenance; AGR = Annual Growth Rate.
Source: Authors.
Table 3-3. Variation of Capacity Factors, Both Real and Observed for Myanmar Based on
Existing Literature
Resource Capacity Factor Reference
Gas 70% (Nam, Cham, and Halili, 2015)
Coal 45% (Nam et al., 2015) (World Wildlife
Fund, 2016)
Hydro 40% (Fairhurst, 2016)
photovoltaic 15.4% (Siala and Stich, 2016)
Source: Authors.

26
The study’s scenarios based on the parameters and inputs in Table 3-2 and Table 3-3 are then
compared with the proposed JICA power development plan to consider alternatives that can
meet the power demand and export projections. Findings show that the low-cost solar and
ASEAN power grid participation scenarios can generate reliable electricity at lower cost than
some of the proposed large-scale hydropower projects that are under discussion (see Table 3-
2). The model description can be found in Appendix 2 with full details on the inputs, outputs,
and assumptions.
The hydropower dam portfolios are then compared within the different least-cost generation
mixes presented in Figures 3-2 to 3-4 in a spatially and temporally explicit model. The model
determines the optimal construction sequence of proposed hydropower portfolios to minimise
environmental risk and reduce sediment trapping in rivers.
The model accounts for the non-dispatchability of some renewable energy sources using a peak
load contribution factor, where wind and solar have less than a 10% contribution to peak
demand. The model does not have high spatial and temporal resolution – a trade-off for the
robust analysis without large data requirements that would be prohibitive in some regions. It
also allows for quick sensitivity analysis by duplicating the model for varying scenarios, such as
cost overruns and carbon prices. The model here underestimates the full dispatchability of solar
and wind resources. But this could change due to the rapidly falling cost of storage resources
that would facilitate integrated solar and wind systems to respond to grid operator controls
within seconds to minutes (Kittner et al., 2017). It also follows on previous least-cost geospatial
analyses of Myanmar’s grid electrification effort (Modi et al., 2014), with a focus on larger-scale
infrastructure investments.

27
Figure 3-2. Planned Business as Usual Capacity Expansion Based on JICA Scenarios
Source: Authors.
0
5000
10000
15000
20000
MW
Capacity Additions
PV Wind Biomass Small-hydro
0
5000
10000
15000
20000
25000
30000
MW
Installed Capacity
PV Wind Biomass Small-hydro

28
Figure 3-3. Low-cost Solar Capacity Expansion Case
Source: Authors.
0
500
1000
1500
2000
2500
3000
3500
4000
4500
5000
MW
Capacity Additions
PV Wind Biomass Small-hydro
Large-hydro Coal Natural Gas Diesel
0
2000
4000
6000
8000
10000
12000
14000
16000
18000
MW
Installed Capacity
PV Wind Biomass Small-hydro Large-hydro
Coal Natural Gas Diesel Geothermal Imports

29
Figure 3-4. ASEAN Power Grid Participation Capacity Expansion Pathway
MW = megawatt.
Source: Authors.
0
1000
2000
3000
4000
5000
MW
Capacity Additions
PV Wind Biomass
Small-hydro Large-hydro Coal
Natural Gas Diesel Geothermal
Imports
0
2000
4000
6000
8000
10000
12000
14000
16000
18000
20000
MW
Installed Capacity
PV Wind Biomass Small-hydro
Large-hydro Coal Natural Gas Diesel
Geothermal Imports

30
The optimisation process considers all candidate dam sites in Myanmar to find optimal dam
portfolios. Dams that are already commissioned are included in all portfolios. Those in China are
outside the spatial scope of this analysis, but could be easily included in a next step.
‘Sustainable’ hydropower in the country is then defined here as hydropower that does not trap
more than 50% of the total incoming sediment in both rivers, and not more than 50% of the
sediment in either river.2 Both the Salween and Irrawaddy rivers have a hydroelectric potential
of around 70 GW. Fully developing that potential would result in trapping around 60% and 70%
of the total incoming sediment, respectively. Such would impact the sediment budget of the
Salween river much more (< 90%) than that of the Irrawaddy river (<60%).
For portfolios that do not trap more than 50% of sediments in either river, there is a clear break
point; that is, a limit for sustainable hydropower. Developing portfolios with more than 150,000
GWh/yr of hydropower production would lead to disproportional sediment trapping. Hence, it
is proposed in this study that such production value be the limit for sustainable hydropower
production.
It should be noted that this break point is not evident when considering all pareto-optimal
portfolios, which follow a nearly linear trade-off between hydropower production and sediment
production. However, pareto-optimal portfolios with high production would require trapping
most of the sediment in the Salween river and are therefore not considered sustainable.
3.3 Discussion and Policy Recommendations
The proposed JICA pathway would incur higher direct costs to investors even before one starts
considering the ecological impact of river ecosystems in the Irrawaddy and Salween basins.
Furthermore, by identifying opportunities where solar, wind, and biomass generation are less
expensive than large-scale hydro-power, the analysis highlights the fact that there are lower-cost
options that can meet the same amount of electricity demand for in-country use and export
without trapping large quantities of sediments. Therefore, this study (i) proposes an alternative
sequencing to hydropower development that sustains the country’s electricity supply and
2 It can be debated if this is a good strategy or if one should allow for ‘sacrificing’ one river. However, that will also depend on the results of the energy model.

31
economic development; and (ii) identifies the most problematic hydropower dam sites that
could instead benefit from solar, natural gas, biomass, and small-hydro substitution as electricity
generation technologies.
Contrary to the JICA report, this study finds that when including realistic assumptions for
alternative energy resources, results will show that future capacity expansion can utilise more
solar photovoltaic than hydropower on a least-cost development basis. The use of solar
photovoltaics becomes possible due to (i) its falling costs; and (ii) the potential for distributed
energy resources to leapfrog centralised utility-scale fossil plants.
The authors of this study now plans to identify those dams that are not cost-optimal as well as
contribute to the greatest amount of sediment trapping. Moreover, they are already identifying
the most damaging hydropower plants that are in the pipeline and finding alternative sources
that can meet the future electricity demand of the country.
Based on the modelling results, the next step for this study team is to consult with relevant
government agencies so as to understand the viability of different scenarios, including the design
of alternatives, and draw up the resulting recommendations. Beyond simply evaluating the
investment characteristics, each scenario should include future stakeholder consultations on the
feasibility of a smooth transition. Future positions on hydropower plans and large-scale energy
investment are critical in understanding the energy transition in Myanmar.
Further study is necessary to implement the cost sensitivities into the optimisation framework.
Additionally, there is a need to decide how to incorporate some of the distributed energy
resources, including solar-based mini-grids and existing mini-hydropower plants that are in
operation, but lack grid connections.
Small-scale hydropower complements solar power well, and local businesses in rural areas could
do well to scale by attracting capital investment in areas where local small-scale hydropower
installations have been operating for decades.
Finally, the research team acknowledges that the investment community needs to be considered,
whether that be to pay closer attention to increased investment from Singapore relative to China
or to understand the controversy and ongoing discussions on the Myitsone power plant within
the National League for Democracy (Kittner and Yamaguchi, 2017).

32
The modelling results highlight that under a least-cost framework, distributed energy resources
contribute as electricity generation options and are built before investing in large-scale
hydropower and thermal projects. This has significant implications on power sector planning and
implies that the high penalty cost of transmission for large-scale projects may face future cost
overruns. Investors that are interested in promoting sustainable energy options in Myanmar
have significant options available and solar resources to use at low cost.
Furthermore, if concomitant investment in regional transmission interconnections are made
(thus expanding the viability for affordable imports and power trade), Myanmar can take
advantage of electricity surplus from Thailand, Lao PDR, and China, and trade electricity in an
integrated ASEAN market. This could lower the levelised cost of electricity compared to the
business-as-usual case by 31%. Such significant cost savings justify the promotion of regional
coordination and cross-border independent power producer agreements. Even if transmission
interconnection projects falter and face higher costs, the second scenario in this study – which
investigates the role of distributed solar power – shows cost savings of 20% relative to the base
case scenario. The second scenario also eliminates future investment in thermal generation,
given that there is now an oversupply of existing generation and low-cost availability of small-,
medium-, and large-scale PV resources.
To summarise, there are three key takeaways from the energy pathways modelled here:
• The amount of hydropower needed is a function of different expansion strategies for
renewables in the basin and can be significantly reduced when alternative options are
considered.
• The base case would require nearly four times more hydropower capacity than a solar-
based alternative that meets similar energy demands. This allows for minimal river and
human impacts on resettlement.
• Either utilising low-cost solar power or participating in the ASEAN power grid would yield
better economic and environmental performance compared to the business-as-usual
pathway based on initial capital cost, levelised cost of electricity, and combined sediment
trapping/river fragmentation between the Salween and Irrawaddy river basins.
As foreign direct investment targets Myanmar in its next wave of Green Climate Funding and
other development-based finance, investors should take note that projected returns on

33
hydropower and thermal investments may lead to future stranded assets. The emergent role of
decentralised energy options would allow investors to improve the climate and public health by
replacing expensive diesel generators, and simultaneously offering a viable alternative (Alstone
et al., 2015). The abundant, low-cost availability of solar and wind power, and options to balance
loads with transmission interconnections in a regional power grid undercut the cost of planned
large-scale plants, making a significant economic argument for distributed energy.
Previous national electrification plans that treat solar and mini-hydropower as purely off-grid
options should be revisited and updated. This time, the plans should reconsider their ability to
provide flexible grid-scale resources both as rural electrification options and as alternatives to
the large-scale hydropower dams that have been ecologically damaging.

34
Chapter 4
SWOT Analysis of Utility-Scale Solar Energy in Myanmar
Endowed with one of the best solar resources in the region, Myanmar can profit from more
intensive use of solar energy. Although solar energy is increasingly being advocated, little
progress has been achieved. To provide insights into the strategic planning on energy currently
being undertaken, the authors conducted a SWOT analysis of utility-scale solar energy in
Myanmar. Its development data were collected from a variety of sources including academic and
grey literature as well as informal conversations with relevant stakeholders.
Although the main objective here is to diagnose the development of utility-scale solar power
generation in Myanmar, this SWOT analysis also provides some important insights that can be
used as takeoff points for further discussion amongst experts. First, utility-scale solar energy is
proven to bring several strengths to the country’s power sector. The photovoltaic technical
potential is located in the Central Dry Zone, which is relatively flat and close to the national grid,
facilitating the installation of the solar panels and the interconnection to the grid.
Second, the combination of utility-scale solar energy and increasing regional energy trade is an
opportunity for Myanmar to export clean energy to neighbouring countries, given that the
nation is part of several regional initiatives such as the Greater Mekong Subregion, ASEAN Power
Grid, and South Asia Subregional Economic Cooperation. Lao PDR has for long positioned itself
as ‘the battery of Southeast Asia’; Myanmar can likewise position itself as a champion of solar
energy in the region.
Third, there is a need for a transparent policy framework to streamline investments. Although a
limited number of utility-scale projects have been signed, there is a lag in the implementation
phase. Specifically, none of the projects has been finalised yet.
Finally, it is noted that the solar energy initiatives in Myanmar have been directed only to rural
areas. Expanding this focus to the national grid should be the next viable step.

35
4.1 Introduction: Policy Framework to Support Renewable Energy Generation in Myanmar
Myanmar has one of the lowest levels of energy access to energy in the world – lower even than
its neighbouring countries. As mentioned in Chapter 2, Myanmar is currently working to attain a
universally sustainable electricity access by 2030. This puts Myanmar in a bind with regard
choosing its generation technologies. It is hoped that the country will avoid a carbon lock-in
pathway by developing and implementing policies that support the deployment of low-carbon
technologies.
A previous study (Del Barrio and Sugiyama, 2018) found that Myanmar’s plans currently
underestimate the potential of solar energy. In particular, while there has been an apparent shift
towards solar-based solutions for off-grid electrification, utility-scale solar development has yet
to be mainstreamed. Current guiding policy documents prepared by the government have
downplayed the potential role of renewables such as solar energy.
This situation in Myanmar is counter to the global trend where there are decreasing prices and
faster deployment of solar PV systems. Furthermore, the above-mentioned weaknesses in
Myanmar’s plans do not help existing conditions that already favour more intensive use of solar
energy to thrive. The country’s Central Dry Zone has the solar potential that would allow it to be
connected to the national grid, thus avoiding the cost – in time and money – of having to develop
large transmission lines.
4.2 A SWOT Analysis of Utility-Scale Solar Energy in Myanmar
Using the Del Barrio and Sugiyama (2018) findings as its reference, the study team aimed to
identify the drivers of and barriers to the development of utility-scale solar generation
infrastructure in Myanmar.
To take advantage of its existing potential, Myanmar needs to develop a strategic plan for utility-
scale solar facilities. A participatory process will be required to catalyse the discussion amongst
stakeholders. Terrados et al. (2007) list a five-phased process for the development of a strategic
plan: (i) preliminary phase; (ii) diagnosis and initial reports elaboration phase; (iii) collective
participation phase; (iv) synthesis phase; and (v) plan approval phase.
Since a diagnosis of the state of utility-scale solar facilities in Myanmar is still lacking, this study
undertook a SWOT analysis.

36
Through the SWOT analysis, this chapter looks at utility-scale solar energy as a strategic
alternative for Myanmar’s present and future energy needs. In that sense, this chapter
contributes to the ongoing discussion on the power generation capacity’s expansion plans.
The SWOT analysis originated in the business field as a tool for strategic analysis and planning
(Pickton and Wright, 1998). It has the ability to ‘yield useful information about the future viability
of the considered system’ (Paliwal, 2006). Its application has extended to numerous other fields
(Terrados, Almonacid, and Hontoria, 2007).
Notably, SWOT analysis is widely applied in the energy sector. Chen et al. (2014) applied SWOT
to examine renewable energy policies in three East Asian economies: Republic of Korea, Japan,
and Taiwan. Lupu et al. (2016) conducted a SWOT analysis of solar energy resource in Romania
and identified key factors for its development. The European Commission (2005) ran a project
that used a SWOT analysis to compare Europe, the United States, and Japan and identified the
most important gaps in research in different energy technologies. The World Bank, too, briefly
introduced a SWOT analysis for solar resources in Myanmar (Suri et al., 2017). Shi (2016)
employed a SWOT analysis to highlight the possibility for ASEAN to move from a fossil fuel–
dominated energy mix towards a green energy strategy, as advocated by the ASEAN’s regional
vision and action plan. Greacen (2015) applied SWOT to evaluate the options and consequences
of further deployment of mini-grids in Myanmar.
The Asian Development Bank has used a SWOT analysis for Myanmar’s food crops, water
resources, and environmental subsectors (ADB, 2013).
SWOT analysis is usually presented in the form of a 2 x 2 chart, is divided into four categories
(Start and Hovland, 2004), as shown in Table 4-1. Strengths and weaknesses are internal factors;
opportunities and threats result from the external environment or external forces (Paliwal, 2006).

37
Table 4-1. SWOT Framework
Strengths
Internal + Helpful
Weaknesses
Internal + Harmful
Opportunities
External + Helpful
Threats
External + Harmful
SWOT = Strengths, weaknesses, opportunities, and threats.
Source: Created by the authors.
Different approaches in undertaking a SWOT analysis can be found in literatures. Some studies
have obtained information from experts through such collective exercises as seminars
(Markovska, Taseska, and Pop–Jordanov, 2009; Terrados et al., 2007) or through surveys
(European Commission, 2005). However, most investigations have based their analyses on a
review of the existing literature (Chen et al., 2014; Soimu, 2014).
As an initial approximation, this chapter draws from existing literature (academic, journalistic,
and official reports) and from information collected through discussions with local and
international experts during visits, workshops, and seminars held and attended by the research
group.
This chapter first provides an overview of the lack of inclusion of solar energy in current guiding
policy documents and discusses the related drivers and impediments. Then, the SWOT analysis
is presented, further analysing each factor. Finally, this chapter discusses the results and policy
recommendations.
4.3 Solar Energy in Myanmar’s Power Sector Plans
Starting 2011, reforms towards the democratisation of Myanmar opened the door for the
nation’s rapid re-engagement with the international community. President Obama ended the
United States’ economic sanctions in 2016 (Exec. Order No 13742 v.81 no.197 p.70593, 2016).
The European Union has also lifted its sanctions, although an arms embargo remains in place
(Council of the European Union, 2013). Following the United States and European Union’s lifting
of sanctions, Myanmar re-engaged in cooperation programmes with development partners such
as Japan International Cooperation Agency (JICA), ADB, World Bank, the German Corporation for

38
International Cooperation (GIZ), and the Norwegian Agency for Development. Local and
international nongovernmental organisations are also involved in Myanmar’s energy sector.
The current National Electrification Plan and the National Electricity Master Plan (NEMP), which
were developed with support from the World Bank and JICA, respectively, do not assign an
ambitious role for renewables. The National Electrification Plan (NEP) recognises diesel mini-
grids only, leaving solar energy as a solution at the individual household level (Castalia Strategic
advisors, 2014). The NEMP, meanwhile, caps the penetration of renewables at 10% by 2030 (JICA,
2015). There are alternative studies, however, that have examined the possibility as well as seen
the merits of raising the targets for the penetration of renewables in Myanmar (Denruyter, 2016;
Kean, 2017). Table 4-2 compares the power generation mixes estimated by the official plan (i.e.,
JICA’s) and one alternative plan proposed by the World Wildlife Fund. The large discrepancy in
the figures of the two plans suggests that it is necessary to update capacity expansion plans
without externally constraining renewables (Del Barrio–Alvarez and Sugiyama, 2018).
Table 4-2. Installed Capacity Under Official and Alternative Scenarios by 2030 (MW)
Resource Japan International
Cooperation Agency *
World Wildlife Fund **
Coal 7,940 0
Natural gas 4,758 1,774
Hydro (all sizes) 12,350 7,413
Other renewables 2,000 8,959 solar
5,149 onshore wind
1,250 biomass
* The proposed power resources balance scenario is presented in this table.
** The most conservative of the scenarios proposed (the Sustainable Energy Scenario) is
presented in this table.
Source: (Denruyter, 2016; Japan International Cooperation Agency, 2015)

39
The 10% cap on renewables is currently being reconsidered. An ongoing study funded by the
United States (US) Trade and Development Agency is examining the grid impact of three different
scenarios of integration of variable renewables (Depierreux, Shumway, and Sparavier, 2017). The
first scenario is based on thermal plants; the second and third scenarios estimate a 10% and 19%
renewables penetrations, as a percentage of peak demand. The study’s target year is 2020,
including the transmission system considered by Myanmar’s Ministry of Energy and Electricity
(MOEE). Results show that even the most ambitious scenario is possible without any negative
impact on the reliability of the system.
4.4 Drivers of and Barriers to Implementing Solar Energy in Myanmar
While there seems to be a low interest in solar energy amongst government officials, the large
potential of solar energy and the growing electricity needs of Myanmar have captured the
attention of private sector investors.
The MOEE has presented its plans for 1.5 GW utility-scale pipeline solar power plants, which are
in different stages of development (Beetz, 2018; Oo, 2017). Table 4-3 summarises the planned
projects, based on the scant information available.
However, the progress of these projects was slow. In 2014, the Thai firm Green Earth Power
signed an agreement with the government to develop a 220-MW solar plant in Minbu (Magway
region), which was reported as the most advanced utility-scale solar investment in Myanmar.
The project was initially expected to complete its first phase in 2016 (Phyo, 2014). Information
about its progress is scarce, and only 40 MW of the Minbu project is expected to be achieved by
the first quarter of 2019 (Shumkov, 2018).
Appropriate policies are needed to address the discrepancy between the potential of utility-scale
solar energy and investment interest, and actual progress. Vakulchuk et al. (2017) evaluates the
attractiveness of the energy sector in Myanmar to investors based on a project jointly developed
by the Myanmar Institute for Strategic and International Studies and the Norwegian Institute of
International Affairs, and supported by the Ministry of Foreign Affairs of Norway.
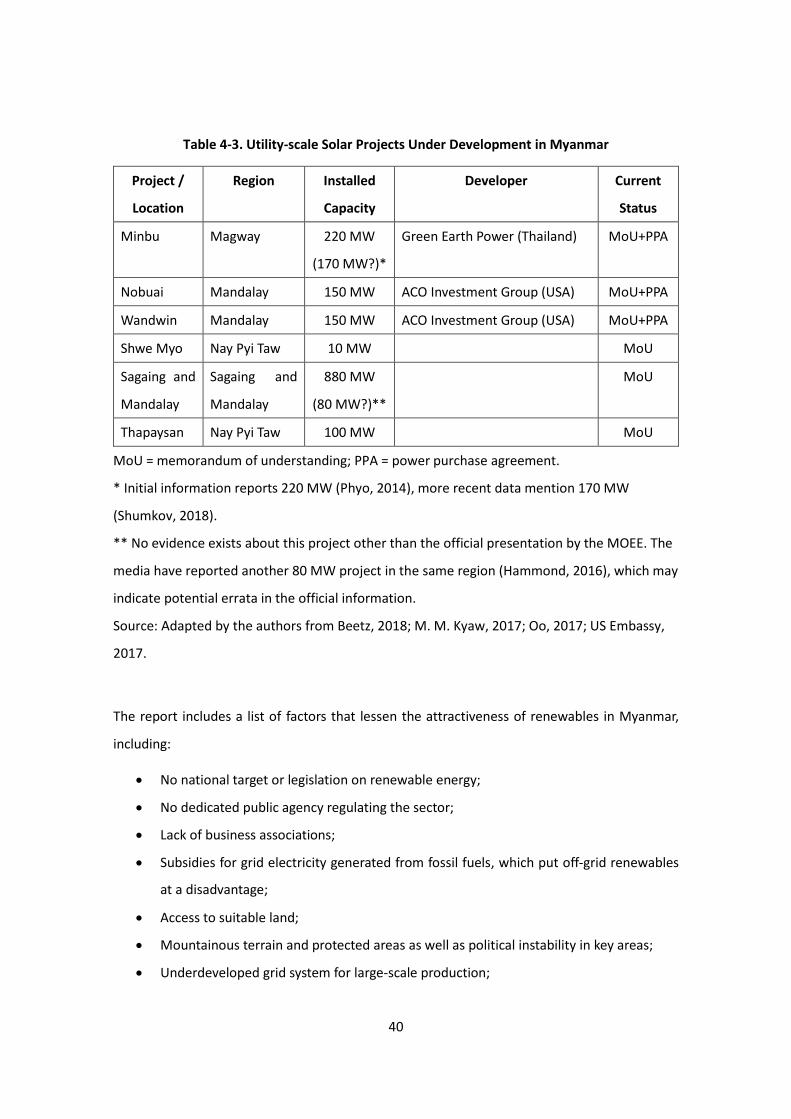
40
Table 4-3. Utility-scale Solar Projects Under Development in Myanmar
Project /
Location
Region Installed
Capacity
Developer Current
Status
Minbu Magway 220 MW
(170 MW?)*
Green Earth Power (Thailand) MoU+PPA
Nobuai Mandalay 150 MW ACO Investment Group (USA) MoU+PPA
Wandwin Mandalay 150 MW ACO Investment Group (USA) MoU+PPA
Shwe Myo Nay Pyi Taw 10 MW MoU
Sagaing and
Mandalay
Sagaing and
Mandalay
880 MW
(80 MW?)**
MoU
Thapaysan Nay Pyi Taw 100 MW MoU
MoU = memorandum of understanding; PPA = power purchase agreement.
* Initial information reports 220 MW (Phyo, 2014), more recent data mention 170 MW
(Shumkov, 2018).
** No evidence exists about this project other than the official presentation by the MOEE. The
media have reported another 80 MW project in the same region (Hammond, 2016), which may
indicate potential errata in the official information.
Source: Adapted by the authors from Beetz, 2018; M. M. Kyaw, 2017; Oo, 2017; US Embassy,
2017.
The report includes a list of factors that lessen the attractiveness of renewables in Myanmar,
including:
• No national target or legislation on renewable energy;
• No dedicated public agency regulating the sector;
• Lack of business associations;
• Subsidies for grid electricity generated from fossil fuels, which put off-grid renewables
at a disadvantage;
• Access to suitable land;
• Mountainous terrain and protected areas as well as political instability in key areas;
• Underdeveloped grid system for large-scale production;

41
• Lack of data on the renewable energy resource potential;
• Limited infrastructure for technical support and maintenance;
• High installation cost of solar panels and wind turbines;
• Disintegrated biofuel production and supply markets;
• Lack of local specialists;
• No taxation system for renewables;
• Security risks in conflict-prone Kachin, Rakhine, and Shan states
4.5 SWOT Analysis of Utility-Scale Solar Energy in Myanmar
Table 4-4 summarises the result of the SWOT analysis of the utility-scale solar energy in Myanmar.
Each quadrant in the table is discussed in detail in the following subsections.
Table 4-4. SWOT Analysis of Utility-Scale Solar Energy in Myanmar
Strengths
• Available potential to be developed
• Best resource areas located in flat
areas near national grid
• Public support for solar energy and
opposition to coal and large-scale
hydro
• Shorter lead times of solar power
plants in contrast with other
technologies
• Increasing experience on solar PV
technologies through off-grid
projects
Weaknesses
• Uncertainty regarding the
establishment of an independent
regulatory commission
• Low electricity tariff requiring very
low generation prices
• No supporting policy for the
deployment of renewables
Opportunities
• Regional power trade
• Seasonal complementarity with
hydro
• Decreasing global prices
Threats
• Potential land disputes
• High levels of perceived corruption
• Delays in the implementation of
current projects

42
• International investment interest in
Myanmar
• Growing investment in solar energy
• Support from international donors
• Security and reputation concerns
• Absence from national plans
Source: Prepared by the authors based on secondary data.
4.5.1 Strengths
Available potential to be developed
Myanmar has amongst the highest potential for solar photovoltaic power potential in Southeast
Asia. The country’s technical potential has been estimated at between 40 TWh/year (ADB, 2015)
and 118.2 TWh/year (Siala and Stich, 2016). More than half of the country (about 60%) is suitable
for solar electricity generation (Oxford Business Group, 2016). Figure 4-1 shows the photovoltaic
power potential in Myanmar.
This potential remains mostly unexplored for grid-connected projects. With the exception of a
couple of rooftop solar PV installations in the Junction commercial complex in Yangon and in a
garment factory (Balch, 2016; Djordjevic, 2017), no utility-scale or commercial solar plants have
yet been finalised. The fate of most planned projects remains unclear.
Against this background, the alternative scenario proposed by the World Wildlife Fund considers
almost 9,000 MW by 2020; and 27,459 MW of solar PV systems and 4,800 MW of concentrated
solar energy by 2050. That would make solar energy the dominant energy source in Myanmar’s
generation mix by the mid-century (Denruyter, 2016).
Best resource area is located in a flat area and near the national grid
The main area of interest for utility-scale solar generation in Myanmar is the Central Dry Zone, a
flat plain (Kyi, 2016) whose potential remains undeveloped. Figures 4-1 and 4-2 show the PV
power potential in the country and how the areas of highest potential are located in flat areas.

43
Figure 4-1. Photovoltaic Power Potential in Myanmar
Source: © 2017 The World Bank; solar resource data: Solargis.
The Central Dry Zone is composed of infertile soils (ADB, 2013), reducing concerns about
conflicting uses of the land. Furthermore, the Central Dry Zone is mostly near the national grid,
facilitating the connection of new power plants. To conduct the power generated by dams in the
north, the national transmission system in Myanmar runs from north to south. With only one
500 kV line being built with bilateral support, the grid currently comprises a network of 230 kV,
132kV, and 66kV transmission lines (ADB, 2016).

44
Figure 4-2. Elevation Map of Myanmar
Source: Google Maps.
Public support
Solar energy enjoys public support as a viable alternative to coal-fired plants. Coal-fired
generation is the subject of severe criticisms. Currently, there is only one coal-fired power plant
in Myanmar, and the NEMP anticipates the opening of more coal-fired plants. However,
environmental organisations and other local and regional nongovernmental organisations had
mobilised their campaign against such plan (Nyein, 2017b).
The Union government has reconsidered its position following its democratisation since 2011.
Currently, ‘all coal-fired projects are cancelled’ (M. M. Kyaw, 2017). However, a dispute has
emerged at the federal level. The Kayin regional government has supported the development of
a 1,280-MW Hpa-An coal power plant. The Union government has criticised the move and taken
measures against it. The dispute remains unresolved (Han, 2017, 2018; Nyein, 2017a; Yimou Lee,
2017).

45
Shorter lead-time
Electricity demand is growing rapidly in Myanmar, and it is expected to continue — at least in
the near term. Therefore, securing greater power generation is an urgent need. In this context,
the ability to deliver electricity rapidly after the approval of a project becomes an important
consideration. In addressing short-term needs, the shorter lead time and lower construction
risks of solar energy compared with other technologies are important factors (Sovacool, Gilbert,
and Nugent, 2014).
Developing the other types of generation plants faces challenges that are specific to Myanmar.
For instance, coal power has traditionally faced strong public opposition. Moreover, the current
Union government has taken a position against coal power use. Because of these barriers, these
projects would take longer to complete.
Hydropower is the traditionally preferred choice of the government. The available potential is
great, but in the short term, hydropower involves complications that are difficult to address.
From an environmental and river management perspective, the Ayeyarwady (Irrawaddy, which
crosses the country from north to south and a large proportion of the population depends on it),
and the Thanlwin (Salween) rivers do not have dams in their main streams. How the construction
of their dams would affect these rivers has yet to be studied (IFC, 2018).
Chapter 3 of this report describes a study on the influence on sediments during different
scenarios of dam building. From a national reconciliation viewpoint, tension has increased over
proposals for large-scale hydropower dams in some areas; those proposals are opposed by the
central government. Alternative strategies could avoid those problems (Kittner and Yamaguchi,
2017).
Government has shown a recent interest in liquified natural gas (LNG). The signing of power
purchase agreements for LNG power plants has been a highlight in the recent power policy
development. The plants are expected to start operations by 2020, although there are some
concerns over future costs (Kean, 2018a, 2018b).

46
Increasing experience with solar PV technologies through off-grid projects
Myanmar is rapidly gaining experience with renewable energies through rural electrification
programmes. Pilot projects have been and are being implemented by different organisations
with support from development partners. More recently, extensive programmes have been
examining the use of renewables for rural electrification. In particular, a large number of solar
home systems have been implemented (Greacen, 2015). As mentioned in Chapter 2, the DRD’s
National Electrification Plan, which had the help of the World Bank, has supported the
development of solar-based mini-grids through what is widely known as the 60/20/20
programme. Under this programme, the government provides a grant for 60% of the cost of the
mini-grid, while the developer and the local community cover 20% each. Village Electrification
Committees are established in each village. The programme is still in its initial years of operation,
and its scalability is uncertain. No similar programmes have been proposed for the national grid.
4.5.2 Weaknesses
Uncertainty in the establishment of an independent regulatory commission
To attract the appropriate investments, there should be mechanisms in place to resolve potential
conflicts and secure transparency in the regulatory process. Myanmar’s power sector is under
the control of the state-owned, vertically integrated utility Electric Power Generation Enterprise
(EPGE), and has a partly private energy generation component consisting of independent power
producers (ADB, 2016; OECD, 2014). The Electricity Law of 2014 replaced the previous legislation
dating back 1954 and introduced some major changes. Decision-making became partly
decentralised when state governments were allowed to approve off-grid projects smaller than
30 MW (Oxford Business Group, 2016; Ross, 2015). More importantly, the creation of a
regulatory commission has been envisioned in the 2014 law. However, such commission has not
yet been created as of this writing, and the prospect of having a working commission remains
unclear.
Low electricity tariff
Electricity tariff is highly subsidised in Myanmar. It is the responsibility of the MOEE to develop
its own power generation products or sign power purchase agreements with private developers.
47
In 2017–2018, the subsidy was about K378 billion (approximately US$280 million) (Chern, 2017;
Htwe, 2017a), and is expected to increase to K450 billion (US$330 million) in 2018 (FMR Research
and Advisory, 2018). Ever since the tariff increased in 2014, households pay around US$0.03–
US$0.04/kWh; industrial consumers pay US$0.05–US$0.10 cents/kWh (ADB, 2016). Tables 4-5
and 4-6 summarise the electricity tariffs for residential, industrial and commercial consumers.
The MOEE has indicated that it wishes to raise the tariffs (Khin, 2017; Lynn, 2017b), but is faced
with public opposition.
Table 4-5. Electricity Tariff for On-Grid Residential Consumers
Consumer range Kyats / kWh US$ cents / kWh
Up to 100 kW/h 35 2.6
From 101 kWh to 200 kWh 40 2.9
From 201 kWh and above 50 3.6
kWh= kilowatt-hour.
Source: Anbumozhi and Tuan (2015).
1 US$ = K1,370.71 (xe.com, 2017)
Table 4-6. Electricity Tariff for On-Grid Industrial and Commercial Consumers
Consumer Range Kyats / kWh US$ cents / kWh
Up to 500 kWh 75 5.5
From 501 kWh to 10,000 kWh 100 7.3
From 10,001 kWh to 50,000
kWh
125 9.1
From 50,001 kWh to 200,000
kWh
150 10.9
From 201,000 kWh to
300,000 kWh
125 9.1
300,001 kWh and above 100 7.3
kWh= kilowatt-hour.
Source: Anbumozhi and Tuan (2015).
1 US$ = K1,370.71 (xe.com, 2017).

48
No supporting policy
Myanmar has not adopted any specific policy to attract investments into renewable energy. The
Regulatory Indicators for Sustainable Energy, developed by the Energy Sector Management
Assistance Program of the World Bank, provide a global comparison of the energy situation in
different countries. In sustainable energy, Myanmar offers only fiscal incentives in the form of
reduced import taxes as well as reduced sales taxes and other taxes (World Bank, 2016b).
Neighbouring countries have implemented more sophisticated instruments such as feed-in
tariffs and renewable energy auctions (Tongsopit et al., 2017).
4.5.3 Opportunities
Regional power trade
Myanmar is located between India, China, and the rest of Southeast Asia (through Thailand and
with a small border with Lao PDR). Interconnections could be developed in the near future so as
Myanmar can import electricity from neighbouring Lao PDR (Billen, 2016) and Yunnan (China).
India has also proposed some schemes for exporting electricity. Currently, the interconnection
with Yunnan appears to be the most advanced.
In the long term, Myanmar could utilise these interconnections to export electricity as well. The
World Wildlife Fund’s alternative scenarios show a rapid, large increase in power generation for
export to neighbouring countries in the Greater Mekong Subregion. In particular, it has been
forecasted that Myanmar will be able to export 40,000 GWh to Thailand by 2040 (Denruyter,
2016).
Seasonal complementarity with hydropower
Hydropower accounts for around 60% of Myanmar’s power supply, although the contribution
from natural gas is increasing. Power generation capacity is sufficient during the rainy season but
becomes restricted during the dry season.
The Energy Master Plan, which was developed with support from the ADB, identified good
seasonal complementarity between hydropower and solar energy (Emmerton et al., 2015).
Maximum solar irradiance occurs between January and May, which is the time of minimum

49
output for hydropower; the situation is reversed from July to November. During the dry season,
when the power supply is restricted, solar energy can be tapped to mitigate the chances of
frequent blackouts (Ross, 2015).
Decreasing global prices
The world has seen a 70% decrease in the price of new solar PV systems since 2010 (IEA, 2017c).
Reasonable PV system prices are already at the level of US$0.06–US$0.08/kWh (Dobrotkova et
al., 2018). However, the final prices of solar energy vary from country to country.
As Myanmar has had little experience in using solar energy, the initial actual prices could be
higher in comparison with those in neighbouring countries. The outcome of policy innovations,
such as the recent widespread application of energy auctions, is strongly dependent on several
factors related to their design (Azuela et al., 2014; Del Río and Linares, 2014; Kruger and
Eberhard, 2018; Mora et al., 2017).
International investment interest in Myanmar
In Myanmar, its democratic transition and opening up to the world have attracted the interest
of many international investors and donor organisations. The lifting of economic sanctions by
the United States and European Union has allowed investments to flow into Myanmar (Pun,
2016; Xu and Albert, 2016). Figure 4-3 shows the increase in investments compare to the
previous decade.
In 2014, the Myanmar government announced the development of special economic zones.
Since then, four special economic zones (SEZs) have been proposed: Thilawa, Fawei, Kyauk Phyu,
and Sittwe (Khandelwal and Teachout, 2016). The Thilawa Special Economic Zone, supported by
Japan, is the only one in operation; it had attracted about US$700 million from over 70
companies by 2016 (Hunter et al., 2018). Considering the rising electricity demand linked to
Myanmar’s economic growth, the power sector itself can become another business opportunity
for investors if a clear, transparent framework is developed (Matsui, 2017a).

50
Figure 4-3. Yearly Approved Amount of Foreign Investment in Myanmar (US$ million)
Source: Myanmar Directorate of Investment and Company Administration (DICA).
Growing investment in solar energy
The cost reductions in technology, together with stronger efforts from governments, have also
attracted large private investments in renewables, particularly solar PV systems. In 2017, solar
energy became the fastest-growing source of power worldwide, with the global installed
capacity increasing by 50% (IEA, 2017b). This development represents an important opportunity
for Myanmar as a new market.
Support from international donors
Myanmar has been a recipient of loans and grants from multiple countries and multilateral
institutions, particularly after its transition out of military rule. In addition to projects and
programmes supported by JICA, the World Bank, and ADB, Myanmar receives help from the
German Development Agency, Norwegian Agency for Development, and China. The Asian
Infrastructure Investment Bank, the World Bank, and ADB are involved in the Myingyan gas-fired
power plant project. Myanmar is part of the One-Belt, One-Road initiative, which includes
building of gas and oil pipelines, and linking Kyauk Pyu Port in southwestern Myanmar with
Yunnan Province in China. (Liu, Yamaguchi, and Yoshikawa, 2017).
0
5000
10000
15000
20000
25000
51
4.5.4 Threats
Potential land disputes
Utility-scale solar plants require vast areas of land, which may not be easy to obtain. The main
challenges may come from securing the rights for such land. After decades of forced
expropriations, many farmers in Myanmar are calling for the return of land ownership to them.
Although the current government has expressed its intent to deal with this problem, little
progress has been made (Barany, 2018; Myint, 2017b). The actions taken by the transitional
government of Thein Sein may have had some negative consequences regarding the land-
grabbing occurred during the years of military rule, such as the formalisation of the land-
grabbing patterns and encouragement of land speculation (McCarthy, 2018). Today, the National
Land Use Policy in Myanmar was adopted by the central government after an extensive
consultation process (Oberndorf et al., 2017): This could represent an initial step in the long
process of resolving the disputes.
High levels of perceived corruption
In Transparency International’s Corruption Perception Index, the lower a country’s ranking, the
higher is its perceived corruption (Figure 4-4). In 2012–2017, Myanmar was ranked 130th out of
180 countries. Likewise, corruption is recognised as an obstacle for businesses (Ferrie, 2014).
An Anti-Corruption Law and Commission were established in 2013 and 2014, respectively, but
had little impact (Soe, 2018). The NLD-led government has made the fight against rampant
corruption a key objective, and improvement has been seen in recent years (Control Risks, 2017;
Naing, 2017).

52
Figure 4-4. Corruption Perception Index for Selected Countries (2012–2017)
Source: Adapted from the Corruption Perception Index, Transparency International.
0
10
20
30
40
50
60
70
80
90
100
2012 2013 2014 2015 2016 2017
Corruption Perception Index for selected countries (2012-2017)
New Zealand
Singapore
Bhutan
Taiwan
Brunei Darussalam
Rep. of Korea
Malaysia
China
India
Sri Lanka
Timor-Leste
Indonesia
Thailand
Mongolia
Vietnam
Philippines
Maldives
Nepal
Myanmar
Laos
Papua New Guinea
Bangladesh
Cambodia
Korea, North

53
Delays in implementing currently approved projects
The lack of visible progress in already-agreed projects can dampen Myanmar’s attractiveness to
potential investors. As noted above, several utility-scale solar power plants are being
development. In particular, Green Earth Power (Minbu) and ACO Investment Group (Nobuai and
Wandwin) have already signed MoUs and power purchase agreements with the government for
three projects. Nevertheless, none of those projects has yet been finalised. Even the Minbu
project, which was way ahead of the rest, has been hit by a long delay. Signed in 2014, the first
phase of the Minbu project was expected to be operational in 2016 (Petrova, 2014), but such
target has long changed. Currently, the project’s rollout is expected to be by the end of 2018.
Security and reputation concerns
Myanmar’s long-standing internal conflict continues. The new government has made signing a
peace agreement with ethnic armed military groups a top priority. The Thein Sein government
proposed a Nationwide Ceasefire Agreement with ethnic armed groups, although only some
agreed to sign (Mark, 2018). The NLD government launched the 21st Century Panglong Union
Peace Conference to promote broader peace talks. The first session was held in late August to
early September 2016, with succeeding sessions to be held every six months. The third session
has been delayed several times (Nyein, 2018; Pwint, 2018; Thar, 2018; Z. M. Win and Thiri, 2018).
Negotiations have yet to be concluded.
The management of clashes in Rakhine state between the Tatmadaw (national armed forces of
Myanmar) and minority Rohingya have severely affected international support for the NLD
government, especially from major Western countries (Barany, 2018). Being involved in
Myanmar while it is undergoing its weak democratic transition can damage an investor’s
reputation (Simpson, Park, Simpson, and Park, 2013).
Increasing international scepticism in the government’s ability to deal with the conflict has added
to such reputational risk. It is unlikely that the United States, European Union, or United Nations
will re-impose international sanctions; however, reputational issues may affect companies
investing in the country (Lee and Zaharia, 2017; Peel, 2017). This can be particularly troublesome
for companies from predominantly Muslim countries (Rajan, 2017).

54
Absence from national plans
The National Electricity Master Plan (NEMP) draws on the current government’s capacity
expansion plan. It was drafted before the commencement of the NLD government but is now
undergoing revision.
The NEMP remains the most important guiding policy in the energy sector and in fact, represents
a major milestone in Myanmar’s energy policy development. However, the scenario analysis
underlying NEMP imposed an exogenous cap of 10% on renewables. As a result, the role of
renewables in general, and solar energy in particular, is underplayed (Del Barrio–Alvarez and
Sugiyama, 2018).
4.6 Discussion and Conclusions
It is widely acknowledged that renewables can play a major role in the power mix for Myanmar.
This role will be fundamental for rural electrification, but need not be limited to that. Renewables,
particularly solar energy, can contribute to increasing the supply and reliability of Myanmar’s
national grid.
Recent studies have contributed to understanding the power situation in Myanmar. However,
beyond technical considerations, the government should develop an appropriate policy
framework to attract international financing and expertise and to secure its needs. Since the
start of the democratic transition, Myanmar’s energy sector has captured the interest of
development partners and international investors. However, this investment has yet to
materialise in the solar energy sector in a robust, transparent manner.

55
Chapter 5
Potential of Mini-Grids and Barriers to Development
Sustainable Development Goal 7 recognises energy access as an urgent problem that needs a
solution. Thus, Myanmar’s government plans to reach 100% electrification by 2030. To achieve
this ambitious target, both centralised (main-grid extensions) and decentralised approaches
should be considered.
This chapter focuses on distributed mini-grids as an electrification option in rural areas and
analyses barriers to the deployment of mini-grids in Myanmar. It presents a techno-economic
analysis of renewable-based mini-grids by calculating the levelised cost of electricity (LCOE) and
considering future cost reductions. Results show that solar PV and batteries are cost-competitive
in off-grid areas compared to diesel, since diesel fuel prices in those areas are much higher than
in urban areas.
Recent literature on the barriers to renewable energy in developing countries is also reviewed.
These barriers are then looked into in the context of the renewable energy-based mini-grids in
Myanmar.
Findings here have been discussed with stakeholders in Myanmar, such as those from
international organisations, private companies, nongovernmental organisations, and research
organisations.
5.1 Introduction
Energy access is recognised as an urgent issue that needs a solution, both globally and in
Myanmar. Goal 7 of the 2015 United Nations Sustainable Development Goals calls on nations to
‘ensure access to affordable, reliable, sustainable, and modern energy for all.’ Although the
global population without access to modern energy has decreased from 1.7 billion in 2000, 1.1
billion people still have no access (IEA, 2017a).

56
In Myanmar too, the main grid electrification rate is in the low 30% range. In line with Goal 7,
Myanmar is thus pursuing universal electricity access by 2030.
To accelerate rural electrification, Myanmar should look at all possible solutions: main-grid
extension, solar home systems (SHSs), and mini-grids. Mini-grids have received attention as a
way to fill the gap between a main grid and personal/household use equipment such as solar
lanterns and SHSs (IEA, 2017a; Schnitzer et al., 2014; BNEF, 2017a). Mini-grids can be used not
only for lighting and mobile charging but also for entertainment purposes, such as television sets
and DVD players, as well as productive uses (Schnitzer et al., 2014). Moreover, they can provide
electricity to social welfare facilities, such as hospitals and schools.
Currently, mini-grids are dominated by diesel while renewables play a minor role. Mini-grids are
powered by diesel in 13,000 villages, by micro-hydropower in 2,400 villages, by biomass gasifiers
in 1,200 villages, and by solar PVs in 150 villages (Greacen, 2017a). While the government has
been promoting renewable-based mini-grids in the World Bank-funded ‘60/20/20’ under the
National Electrification Programme since 2016, the scale has been limited: eight projects in the
first year and 74 proposals in the second year.
One of the barriers to the wide diffusion of mini-grids is the lack of a detailed understanding on
both the financial and non-financial aspects of renewable-based mini-grids. For instance, there
are not many studies about renewable energy in Myanmar. In one of the studies, ACE (2016)
reported the LCOE values for renewable energy types (including solar PVs, biomass, and
hydropower) for Indonesia, Lao PDR, Malaysia, Thailand, Viet Nam, and Myanmar. Out of 64
renewable energy projects assessed, only two (which are hydropower based) were in Myanmar.
No solar PV project in Myanmar was included.
Another study is the Sustainable Engineering Lab (2014), which estimated the total investment
for electrification using both grid extensions and off-grid programmes. The authors, however,
assumed only diesel-powered mini-grids and SHSs for off-grid electrification and did not analyse
renewable-based mini-grids.
Some studies reported that mini-grids powered by renewable energy, especially solar PVs, are
expensive. Using Hybrid Optimization of Multiple Energy Resources (HOMER) software, the
software for optimising design of microgrid, Sasaki et al. (2015) estimated the cost for rural
electrification via mini-grids based on assumed load projections. They assumed three types of

57
mini-grids powered by (i) a combination of solar PVs and biomass; (ii) micro-hydropower; and
(iii) diesel generators. Win et al. (2017) compared diesel generators and a hybrid system that was
composed of solar PVs, batteries, and a diesel generator. Kim and Jung (2018) compared different
energy sources: diesel generators, solar PVs, lead-acid batteries, lithium ion batteries, and
various combinations of these.
These studies are valuable but there remain important knowledge gaps. For example, how do
rapidly improving technologies affect economic assessments?
The studies reviewed above considered the technology progress of solar PV (e.g., BNEF, 2017b)
but not energy storage. Lithium ion batteries (LIB) are experiencing fast cost reductions similar
to PVs (Kittner, Lill, and Kammen, 2017; Kittner, Gheewala, and Kammen, 2016; Schmidt et al.,
2017; IRENA, 2016). Since LIBs have better characteristics (e.g., a long life cycle in deeper
discharge usage with higher round-trip efficiency) than lead-acid batteries (IRENA, 2017), using
LIBs instead of lead-acid batteries could change the economics of solar-based mini-grids. In fact,
developers in Myanmar are considering LIBs for their mini-grids in the near future.
In implementing mini-grid policies, non-techno-economic considerations are crucial, too.
Greacen (2017b) conducted a SWOT analysis on mini-grids in Myanmar and identified various
issues related to mini-grid development. On the other hand, there is a literature that
systematically explored the barriers to mini-grid development in other countries (Comello,
Reichelstein, Sahoo, and Schmidt, 2017). A more in-depth analysis on what hampers mini-grid
development specifically in Myanmar would be helpful to both policymakers and stakeholders.
5.2 Assessment of Economic Viability of Mini-grids in Myanmar3
This section analyses the economic viability of mini-grids in Myanmar. Mini-grid LCOE values are
calculated not only for diesel generators and/or solar PVs with lead-acid batteries, but also for
configurations with LIBs based on their projected costs.
3 This section is mainly based on a paper published in the ERIA discussion paper series.

58
5.2.1 Methodology and Data
The methodology broadly follows Blum et al. (2013), who examined the LCOE of mini-grids in
Indonesia. Cost estimates and the load assumption are based on three field surveys in February,
March, and October 2017 and on existing literature. Interviews of developers were carried out
at Yangon Technological University. Questionnaires and follow-up were done in collaboration
with the Mitasu Consultants Group in Yangon. To protect anonymity of the survey respondents,
only the averaged cost data were used.
5.2.2 LCOE Calculation
Levelised costs of electricity for different mini-grid power sources were calculated using a
formula presented in many publications (e.g., IEA and NEA, 2015):
where
is the energy produced in year t,
are the costs in year t,
are the capital costs, and is 0.
The calculation of the LCOE for solar PVs combined with batteries followed that described by
Pawel (2014). The denominator of the LCOE formula represents, if multiplied by the LCOE itself,
the net present value of electricity in the project period. The amount of sold electricity [kWh] is
used for the denominator, assuming that it equals the load and that generation of electricity
always covers the load. The amount of produced electricity is not used because there would
obviously be a loss of electricity not consumed or charged to batteries during daytime.
5.2.3 Load Assumption

59
Two load scenarios are assumed. Because not enough power consumption data for off-grid areas
are available, the study’s assumption was based on cumulative power consumption of appliances
as provided by households in a survey done by one of the solar PV mini-grid developers. The
number of households per village was assumed to be 100, which is similar to the typical number
of households for interviewees’ mini-grids.
Scenario A is a lower load case for basic usage, such as light-emitting diode (LED) lights and TVs.
The assumptions were that each household has three LED lights – two indoors and one outdoors
– and three out of four households have a TV. The assumed night-time load was 20.5 kWh/day,
as shown in Figure 5-1.
Scenario B is a higher load case representing both household use at night and productive use
during the daytime. ‘Household use’ was assumed to refer to appliances that households wish
to have in the future, based on a feasibility study done by one of the developers. ‘Productive use’
was assumed to refer to the total number of small businesses that the developers stated were
in their mini-grids. Each load from productive use was taken from the literature (Blum et al.,
2013; Aye, 2015). The assumed load was 192 kWh/day, which comprised 61 kWh from 06:00 to
18:00 and 131 kWh from 18:00 to 06:00; this profile is shown in Figure 5-2. The detailed load
assumptions are outlined in Appendix 3.
Figure 5-1. Load A: Night Only
Source: Authors.
0
2
4
6
8
10
12
14
16
18
20
Load
[kW
]
Time

60
Figure 5-2. Load B: Day and Night
Source: Authors.
5.2.4 Cases for Calculation
The following system configurations are assumed.
For power sources, diesel and solar PVs are compared. Solar PVs need some kind of backup
because the systems are isolated from the main grid. Two types of backups were assumed:
batteries only; and a combination of batteries and diesel generators.
• Power source
➢ Diesel: conventional diesel generator
➢ PV + Battery: solar PVs backed up by batteries
➢ PV + Battery + Diesel: hybrid systems of solar PVs backed up by batteries and a
diesel generator
As explained above, fuel prices differ greatly in each area. One of the interviewees explained
that the price around their site was about MMK2,000/L (about US$1.46/L) when it was
MMK750/L (about US$0.55/L) in Yangon. Two fuel prices are assumed: one to cover a relatively
low cost area and the other, the highest priced area.
0
2
4
6
8
10
12
14
16
18
20
Load
[kW
]
Time

61
• Fuel price (FP)
➢ International price for diesel fuel costs
➢ International price multiplied by 2.7 (= 2,000/750), representing the ratio
between urban and off-grid rural areas
For batteries, the current dominant technology is valve-regulated lead-acid batteries; however,
lithium ion batteries are expected to be replaced in the near future. Once LIBs come into use
because of their reduced cost, the cost of solar PVs is also expected to drop below their current
price. Therefore, the current cost scenario assumes that lead-acid batteries are used while the
future cost scenario assumes LIB technology.
• Equipment costs
➢ Current cost (lead-acid batteries): average price for PVs and lead-acid batteries
based on this study’s surveys
➢ Future cost (LIBs): PV costs decreased to ‘Sunshot 2020’4 target prices at the
residential scale (Woodhouse et al., 2016) and costs of LIBs decreased to
US$124.24/kWh in 2020, as forecasted by Kittner et al. (2017)
Based on the assumptions above, 12 cases for calculation are established. Table 5-1 summarises
each case and its capacity. Each capacity was set to cover loads and will be explained in detail in
sections 5.2.5, 5.2.6, and 5.2.7.
4 Sunshot is an initiative of the US Department of Energy. It sets goals and cost targets. For more information, please refer to, e.g. ‘The SunShot Initiative – Department of Energy’, https://www.energy.gov/eere/solar/sunshot-initiative

62
Table 5-1. Scenarios and Their Capacities
Capacity for load A:
Night Only
Capacity for load B:
Day and Night
Diesel FP × 1 (1a) Diesel 5 kVA (1b) Diesel 20 kVA
FP × 2.7 (2a) Diesel 5 kVA (2b) Diesel 20 kVA
PV +
Battery
Current
Lead-acid
batteries
(3a) PV 7.9 kW
Battery 39.5 kWh
(3b) PV 81.1 kW
Battery 252.5 kWh
Future
LIBs
(4a) PV 7.4 kW
Battery 22.5 kWh
(4b) PV 76.9 kW
Battery 143.5 kWh
PV +
Battery +
Diesel
FP × 1 (5a) PV 3.9 kW
Battery 23.0 kWh
Diesel 3.9 kVA
(5b) PV 33.5 kW
Battery 91.6 kWh
Diesel 33.5 kVA
FP × 2.7 (6a) PV 3.9 kW
Battery 23.0 kWh
Diesel 3.9 kVA
(6b) PV 33.5 kW
Battery 91.6 kWh
Diesel 33.5 kVA
PV = photovoltaic; FP = fuel price.
Source: Authors.
Table 5-2 lists the common assumptions for the calculations.
Table 5-2. General Assumptions for Calculations
Value Source
Discount rate 10% ACE, 2016
Project term 20 years Our assumption
Number of households in
a village
100 Simplified number based on survey
Loss of distribution 4% Blum et al., 2013
Source: Authors.

63
5.2.5 Mini-grids Powered by Diesel Generators
As explained above, two diesel fuel price cases are assumed: (i) the international fuel price (FP ×
1), which represents urban areas; and (ii) the international fuel price multiplied by 2.75 (FP ×
2.7) for rural areas. The international fuel price is based on forecasts by the US EIA (2015).¥
Table 5-3 lists the assumptions for a mini-grid powered by a diesel generator. We assumed the
diesel generator could follow the load and adjust its output.
Table 5-3. Assumptions for Diesel-powered Mini-grids
Value Source
Efficiency 26% Blum et al., 2013
Operating hours (Load: night only) 6 hours/day
(Load: day & night) 24 hours/day
Survey by the authors
Capital expenditure (CAPEX)
cost of equipment US$259/kW Survey by the authors
cost of engineering US$241/kW Lazard, 2014
Operation &
Maintenance cost
US$0.026 /kWh Dobermann, 2016
Replacement None Lifetime: 20 years
(IRENA and ACE, 2016)
kWh = kilowatt-hour.
Source: Authors.
5.2.6 Mini-grids Powered by Solar PVs with Batteries
In this study, crystalline polysilicon is chosen as the PV solar technology because it is the
dominant technology in small-scale residential applications. Isolated solar PV mini-grids need
storage to accommodate the load at night. The current dominant storage technology is lead-acid
batteries but is slowly being replaced by LIBs.
Because the cost of solar PVs and LIBs is assumed to continue to move downwards, two cost
cases are set in this study. The current cost case assumes the use of lead-acid batteries, and
5 = 2000/750.

64
prices are averages based on the study’s surveys. For specifications, the highest class of lead-
acid batteries is assumed to be installed in Myanmar. Also, current installation costs for solar PV
systems is assumed to be US$2,178/kW, which is based on the average results from the
interviews. This is similar to the price in ASEAN countries, which is US$2,576/kW, as reported by
the ACE (2016). The assumptions are summarised in Mini-grid Powered by the Combination of a
Solar PV System with Batteries and a Diesel Generator
A hybrid system consisting of solar PVs, batteries, and a diesel generator has been
installed in many sites in Myanmar. The capacities of solar and diesel systems differ from site to
site; thus, it is assumed here that the capacity of each is the same, following the configuration
of Blum et al. (2013). The load during the daytime is covered by solar PVs, and excess generation
is used to charge the batteries. At night, diesel powers the first three hours while the batteries
are discharged for the rest of night. The capacities are shown in Table 5-1. The batteries are
assumed to be made of lead acid; other assumptions are aligned with those of the current costs
in Table 5-4.
Table 5-4We assumed the initial cost of batteries to be US$286/kWh, referring to the actual
price, which was close to the interview results.
Meanwhile, the future cost case assumes that LIBs will be used and that their price will decrease
to US$124.24/kWh in 2020, as estimated by Kittner et al. (2017); and PV costs will decrease to
the ‘Sunshot 2020’ target prices at the residential scale (Woodhouse et al., 2016).
5.2.7 Mini-grid Powered by the Combination of a Solar PV System with Batteries and a
Diesel Generator
A hybrid system consisting of solar PVs, batteries, and a diesel generator has been
installed in many sites in Myanmar. The capacities of solar and diesel systems differ from site to
site; thus, it is assumed here that the capacity of each is the same, following the configuration
of Blum et al. (2013). The load during the daytime is covered by solar PVs, and excess generation
is used to charge the batteries. At night, diesel powers the first three hours while the batteries
are discharged for the rest of night. The capacities are shown in Table 5-1. The batteries are

65
assumed to be made of lead acid; other assumptions are aligned with those of the current costs
in Table 5-4.
Table 5-4. Assumptions for Solar PVs and Batteries
Specifications Current Cost Future Cost
PVs crystalline polysilicon
Capacity factor 18%* (World Bank & ESMAP, 2017)
Degradation rate 1% (Authors’ assumption) 0.2% (Woodhouse et al., 2016)
CAPEX (Capital
expenditure)
US$2,707/kW (average number
from survey by the authors)
US$1,600 /kW
(Woodhouse et al., 2016)
Operation &
Maintenance cost
1% of CAPEX (ACE, 2016)
With inverter replacement
US$10/kW without inverter
replacement; inverter lifetime is
assumed to be 30 years
Batteries Lead-acid batteries
(current price)
LIBs (forecasted price)
Round-trip
efficiency
90%
(HOPPECKE Batterien GmbH & Co.
KG, 2016)
95% (IRENA, 2017)
Depth of
discharge**
60%
(HOPPECKE Batterien GmbH & Co.
KG, 2016)
100% (IRENA, 2017)
Capital
Expenditures
(CAPEX)
US$286***/kWh
(Off-Grid Europe Gmbh, 2017)
US$124.24/kWh
(Kittner et al., 2017)
Operation &
Maintenance cost
US$0 /kW (Lazard, 2017) US$0.04/kWh (Lazard, 2017)
Replacement Every 7 years Only in the 11th year
ESMAP = Energy Sector Management Assistance Program; PV = photovoltaic; LIBs = lithium ion
batteries
Limitations: For simplicity, the self-discharge of the lead-acid battery and the relationship
between the available capacity and discharge time were not considered.
Notes: *Calculated from 4.32kWh/kW daily in Nay Pyi Taw.
**Depth of discharge was set to minimise total costs including Capex and
replacement cost within the operation range.
**Exchange rate US$/EUR 1.15880 (XE.com, 2017a)

66
In 2015 US$.
Calculated from life cycle.
5.2.8 Calculation Results
Figure 5-3 shows the LCOE calculation results for each case when the load is scenario A (night-
time only) while Figure 5-4 shows the LCOE of scenario B (when the load occurs both in the day
and night-time). A diesel generator may not be an affordable option in rural areas because fuel
costs in such areas would be significantly higher than in urban areas. Case 2 represents the fuel
cost in rural areas while case 1 is that in urban areas.
Most of the diesel LCOE is due to fuel costs; hence, the LCOE is estimated as proportional to the
fuel price. Two cases of diesel prices are assumed. Meanwhile, the LCOE in other areas was
roughly presumed, even though fuel prices differ by area, distance from the distribution centre,
and means of transportation. In addition to these domestic conditions, the international fuel
price is itself very volatile.
The LCOE of the combination of solar PVs and lead-acid batteries (represented in case 3a) is
US$0.68/kWh, which is relatively expensive. When loads occur only at night, the electricity
generated by solar PVs during the day needs to be stored. The system needs enough battery
capacity to meet demand, whereas the capacity of solar PVs is set relatively low. Currently,
battery prices are still high even for lead-acid batteries; hence, batteries need to be used more
efficiently.
The LCOE of solar PV + LIB (as represented by case 4a) indicates it is the least expensive amongst
the cases. The longer cycle life of LIBs means fewer replacements are required – i.e., only once
in the project period in contrast to twice for the lead-acid batteries). The capital expenditure of
LIB batteries occupies a smaller portion of the LCOE than in case 3a (with lead-acid batteries).
It is not necessarily appropriate to suggest that the LCOE becomes less expensive after combining
solar PVs, batteries, and a diesel generator. Each component’s capacity was set following the
configuration of Blum et al. (2013), but the optimal combination should be further investigated.
The system capacities of cases 5a and 6a, and cases 5b and 6b were the same in each load
scenario, as shown in Table 5-1. Thus, the levelised costs from solar PVs and batteries were the
same in cases 5a and 6a, and 5b and 6b. The differences in LCOE were the result of fuel costs.
When the load became greater and increased continuously both in the daytime and at night, the

67
LCOE generally became less expensive (compare Figure 5-3 with Figure 5-4). However, the
differences per load scenario of the diesel power source, represented by cases 1a and 1b, and
cases 2a and 2b were very small. This is because it was assumed in the study that diesel
generators could adjust their output according to the load demand.
The LCOE of solar PV + lead-acid battery became less costly when there were loads during the
daytime and at night, as in cases 3a and 3b. As explained above, an absence of load in the
daytime requires batteries with higher capacity and lower capacity of solar PVs. Daytime loads
reduce the inefficiency of the system configuration. The LCOE of solar PV + LIB in cases 4a and
4b only differed slightly because battery prices were low enough that the capacity balance
between PVs and batteries did not affect LCOE as much.
Figure 5-3. Calculation Results of LCOE: Load A (Night Only)
FP = fuel price; PV = photovoltaic; OM = operation and maintenance.
Source: Authors.
Figure 5-4. Calculation Results of LCOE: Load B (Night and Day)
0.00 0.20 0.40 0.60 0.80
(6) Load night only, PV + battery + diesel, FP x…
(5) Load night only, PV + battery + diesel, FP x 1,…
(4) Load night only, (2020) PV + battery, LIB
(3) Load night only, PV + battery, VRLA(current)
(2) Load night only, Diesel, FP x 2.7
(1) Load night only, Diesel, FP x 1
[US$/kWh]Initial PV OM PVInitial Battery Replace BatteryOM Battery Initial DieselOM Diesel Fuel costs
0.27
0.70
0.68
0.260.54
0.75
0.0 0.2 0.4 0.6 0.8
Load night & day, PV + battery + diesel, VRLA,…
(11) Load night & day, PV + battery + diesel,…
(10) Load night & day, (2020) PV + battery, LIB
(9) Load night & day, PV + battery, VRLA
(8) Load night & day, Diesel, FP x 2.7
(7) Load night & day, Diesel, FP x 1
[US$/kWh]Initial PV OM PVInitial Battery Replace BatteryOM Battery Initial DieselOM Diesel Fuel costs
0.25
0.410.63
0.62
0.69
0.26(1b) Load Night & Day Diesel FP x 1
(2b) Load Night & Day Diesel FP x 2.7
(3b) Load Night & Day PV Lead-acid
(4b) Load Night & Day (Future) PV LIB
(5b) Load Night & Day PV Lead-acid Diesel FP x 1
(6b) Load Night & Day PV Lead-acid Diesel FP x 2.7
(1a) Load Night only Diesel FP x 1
(2a) Load Night only Diesel FP x 2.7
(3a) Load Night only PV Lead-acid
(4a) Load Night only (Future) PV LIB
(5a) Load Night only PV Lead-acid Diesel FP x 1
(6a) Load Night only PV Lead-acid Diesel FP x 2.7

68
FP = fuel price; PV = photovoltaic; OM = operation and maintenance.
Source: Authors.
The LCOE values of hybrid systems (i.e., systems with solar PVs, batteries, and a diesel generator)
were observed to be lower when there were loads during the daytime for cases 5a and 5b and
for cases 6a and 6b. Because loads in the daytime were covered by solar PVs, systems were used
more effectively in cases 5b and 6b than in cases 5a and 6a. Capacities of each type of equipment
(solar PVs, batteries, and diesel generators) became larger in cases 5b and 6b but the
contribution of batteries to LCOE declined from 34% in case 5a to 19% in case 5b; and from 25%
in case 6a to 12% in case 6b. In contrast, the proportion of fuel costs increased from 46% in case
6a to 55% in case 6b; and from 24% in case 5a to 31% in case 5b because the fuel price in case 6
was higher than that in case 5. Results were generally consistent with the findings of previous
studies (Skat, 2017; Kim and Jung, 2018).
The LCOE calculation results for diesel were a little out of range, but they depended heavily on
fuel prices during the project period; therefore, the differences may be due to the source of fuel
prices forecasting.
The solar-based system is competitive when compared with the diesel-based ones, but how does
it compare to the main grid? Figure 5-5 shows a comparison of residential tariffs on the main-
grid, one of the tariffs on the hybrid system’s mini-grid, and the LCOE calculation results for cases
1 to 6. The mini-grid tariff was subsidised by the government under the 60/20/20 project and
became profitable for developers; it seems difficult to keep tariffs at an affordable level without
subsidies. The main-grid tariff for residential customers was US$0.026 to US$0.0366/kWh (ADB,
2016) and was heavily subsidised. It is nearly 10 times higher than the mini-grid’s tariff.
5.3 Barriers to Development of Mini-grids
The previous section revealed the economic viability of mini-grids with renewables, especially in
remote rural areas with high diesel prices. However, it also showed that heavy subsidies for
electricity tariffs highly distort competitiveness. There are many more possible barriers,
including the threat of main grids extending further to villages where mini-grids are already
operating. In the first step, a comprehensive typology of barriers would be helpful to analyse
6 1 US$ = 1,370.71 (XE.com, 2017b)

69
further possible options to remove the barriers.
Figure 5-5. Comparison of Tariffs and LCOE Values
Source: ADB (2016). Modified by Authors.
5.3.1 Barrier Typology
This study drew on the barrier typologies developed by Painuly (2001) and Comello et al. (2017),
and updated these based on a wide survey of literature on barriers to renewable energies in
developing countries. These were further reviewed within the context of Myanmar through
discussions with stakeholders in Myanmar. The meeting with stakeholders were held between
24–30 March 2018 in person and through Skype on 7–12 April 2018. Stakeholders included
officers/consultants from international donor organisations, private companies,
nongovernmental organisations, and local researchers. Visits to some mini-grids (one in March
2018) gave the authors insights and allowed then to discuss with locals and mini-grid operators.
Table 5-5 shows this study’s updated barrier typology, including some variables unique to
Myanmar (such as indigenous technologies developed during the time of the country’s isolation).
0
0.1
0.2
0.3
0.4
0.5
0.6
0.7
0.8
Myanmar main-grid tariff(Residential)
Myanmar mini-grid tariff Myanmar mini-grid LCOE
[US$
/kW
h]
0.2
6
0.25-0.75
0.026-0.036

70
Table 5-5. Barrier Typology
Category Sub-categories Description Source
Financial Access to
financing
Because of the lack of familiarity with project
financing through a financial institution, it is difficult
to access loans. Also, immature stock and debt
markets limit options for financing arrangements.
Gershenson et al. (2015); Greacen (2017b); Ahlborg
and Hammar (2014); T. S. Schmidt, Blum, and
Wakeling (2013); Luthra, Kumar, Garg, and Haleem
(2015); UNCDF/UNDP (2012)
High capital cost Even if funds are arranged, financing costs are high.
In the case of loans, interest rates are higher and
loan fees are costly.
Painuly (2001); Greacen (2017b); Gershenson et al.
(2015); Comello et al. (2017); Luthra et al. (2015) ;
UNCDF/UNDP (2012)
Insufficient
capital
(developer)
Because of the immature financial market,
developers need to increase capital, but it is rare for
them to be able to raise an ample amount.
Painuly (2001); Gershenson et al. (2015); Comello et
al. (2017)
Insufficient
capital
(consumer)
Customers’ financing methods are also limited.
Microfinance is relatively new, and unofficial money
lenders are expensive.
Painuly (2001); Gershenson et al. (2015); Comello et
al. (2017)
Currency risk If financing is not based on local currency,
companies are exposed to exchange rate risks
because their revenue and expenses are in different
currencies.
Gershenson et al. (2015)

71
Long payback
period
The low rate of return means it takes longer to pay
back the investment.
Painuly (2001); Comello et al. (2017) ; UNCDF/UNDP
(2012)
Economic High transaction
costs
Not only the small size of projects, but also project
locations make transaction costs higher.
Painuly (2001); Palit and Chaurey (2011); Gershenson
et al. (2015); Ahlborg and Hammar (2014)
Small market
size
The Myanmar market has just started and is
developing, although the international market has
expanded rapidly.
Painuly (2001); Palit and Chaurey (2011);
Bhattacharyya (2013); Luthra et al. (2015)
Low demand Creating demand in addition to basic use such as for
lighting is still a challenge for operators.
Painuly (2001); Palit and Chaurey (2011);
Bhattacharyya (2013); Ahlborg and Hammar (2014)
Tariff structure:
cost-revenue
gap
The design of the tariff structure affects the business
model
Bhattacharyya (2013); T. S. Schmidt et al. (2013);
Comello et al. (2017); Ahlborg and Hammar (2014);
Hasan (2018); Tenenbaum, Greacen, Siyambalapitiya,
and Knuckles (2014)
Customers’
ability to pay
Rural villages are mainly agricultural, where incomes
could be seasonal.
Bhattacharyya (2013); Palit and Chaurey (2011);
Ahlborg and Hammar (2014)
Revenue
collection
uncertainty
Operators need to make sure customers pay for
electricity, sometimes using new technology such as
Pay As You Go.
The Climate Group (2015); Franz et al. (2014);
Bhattacharyya (2013); Ulsrud et al. (2011); Blum,
Wakeling, and Schmidt (2013); Hasan (2018)
Social/
Cultural
Negative
externalities
Existing local mini-grid businesses were nearly non-
commercial but the introduction of business models
Stakeholders’ interviews

72
caused by
international
organisations
has changed the mindsets of operators and/or
customers.
Education The educational gap makes it difficult for local
companies to obtain financing from international
organisations that provide lower capital costs.
The language barrier (non-English speakers) is part
of the reason.
Stakeholders’ interviews
Community
acceptance
Unlike personal-use equipment such as SHSs, mini-
grid projects need a certain level of community
acceptance for execution.
Painuly (2001); Comello et al. (2017)
Geographical
difficulty
Residential areas of minor ethnic groups overlap
with the off-grid areas. Language and cultural
differences make project implementation more
difficult.
Stakeholders’ interviews
Perception of
inferior quality
Especially in the early stages, it is difficult to offer a
24-hour, seven-days-a-week service.
Bhattacharyya (2014); Franz et al. (2014); Comello et
al. (2017)
Theft and non-
technical loss,
shared resource
Non-technical loss including theft, incorrect
metering, and imperfect tariff collection can damage
the business. Also, it is difficult to prevent
Greacen (2017b); Gershenson et al. (2015); Comello et
al. (2017); Ahlborg & Hammar (2014)

73
households from using more than their share
without appropriate payment scheme.
Technical Indigenous
technology
The indigenous technology may be different from
the international standard in many respects but
should not be flatly disallowed.
Stakeholders’ interviews
Lack of local
expertise
Operators need to start training local workers for
operation and maintenance.
Painuly (2001); T. S. Schmidt et al. (2013); Greacen
(2017b); Comello et al. (2017); Ahlborg and Hammar
(2014); Luthra et al. (2015) ; UNCDF/UNDP (2012)
Durability and
quality
Quality at installation should be supplemented by
appropriate maintenance
Painuly (2001); Gershenson et al. (2015); Comello et
al. (2017); Ahlborg and Hammar (2014)
Operation and
maintenance
Appropriate operation and maintenance often fail to
be sustained
Gershenson et al. (2015); Comello et al. (2017);
Ahlborg and Hammar (2014)
Intermittency The supply fluctuates over the day or season (typical
for intermittent renewable energy sources).
T. S. Schmidt et al. (2013); Comello et al. (2017);
Luthra et al. (2015)
Lack of
interoperability
with main grid
Mini-grids can be designed without considering
connections to the main-grid because of the absence
of technical rules.
Comello et al. (2017)
Regulatory Lack of
regulatory
framework
There are no regulations for mini-grids. Greacen (2017b); Painuly (2001); Luthra et al. (2015)

74
Institutional
capacity
Institutions are tied up with their current work and it
is difficult to coordinate priorities between
ministries and/or other institutions.
Ahlborg and Hammar (2014); Bhattacharyya (2013);
Comello et al. (2017); del Barrio Alvarez (2018); Luthra
et al. (2015)
Lack of technical
standards and
codes
Without technical standards or codes, it is difficult to
maintain a certain level of quality for mini-grids.
Also, rules for industrial waste, tar, and lead-acid
should be established for sustainable development.
Painuly (2001); T. S. Schmidt et al. (2013); Comello et
al. (2017) ; UNCDF/UNDP (2012)
Threat of grid
extension
Mini-grid operators do not know what will happen
after the main grid reaches their customers’ villages.
Bhattacharyya (2013); Kobayakawa and Kandpal
(2014); The Climate Group (2015); Comello et al.
(2017); Hasan (2018); Tenenbaum, Greacen,
Siyambalapitiya, & Knuckles (2014)
Lack of
enforcement
Policy plans with some enforceability are needed to
promote renewable energy, such as feed-in tariffs or
renewable portfolio standards.
Painuly (2001); Comello et al. (2017) ; UNCDF/UNDP
(2012)
LCOE = levelized cost of electricity
Source: Created by Authors.

75
The subsections below discuss each form of barriers to mini-grids.
5.3.2 Financial Barriers
Lack of access to financing/high capital cost/Insufficient capital (developer)/Insufficient capital
(consumer)
Just like the energy sector, financial sectors in Myanmar need to be developed. Because financial
institutions do not have enough experience in financing, loan financing is limited. Therefore, they
are also less experienced with project financing and lack the knowledge to evaluate projects.
These situations make it difficult for developers to access financing. Even if they can arrange for
loans, the terms are unattractive with short terms (e.g., one year) and high interest rates
(Greacen, 2017b). As of 2017, the legal ceiling on bank loan rates is 13% per year (Gilmore and
Robinson, 2017).Mini-grid projects are relatively small, so funding costs increase (Painuly, 2001;
Palit and Chaurey, 2011).
Microfinance is one of the funding options. In Myanmar, loan amounts through microfinance
accounted for 3% of the total loans in the country in 2016 (Ono, 2017).However, the legal ceiling
on microfinance interest rates is 3.5% per month, the average interest rate is 2.5% per month,
and the maximum loan amount is US$4,000 (Dave Grace and Associates, 2016). Microfinance is
intended for small businesses and unsuited for the scale of mini-grid businesses. It is designed
more for customers of mini-grids than for developers/operators. It should be noted that the
microfinance interest rate is far below the 10% per-month rate offered by informal money
lenders. In Myanmar, the interest rate is generally calculated on a simple interest basis (Takahashi,
2000).
Because of the immature financial market, developers need to increase their capital, which is
rarely achieved.
Currency risk
If financing is not based on the local currency, companies will be exposed to exchange rate risks
because their revenues and expenses are in different currencies. In the five years from 27 April
2013 to 26 April 2018, the currency exchange rate record low was K885/US$ (on 27 April 2013)
while the record high was MMK1,381/US$ (on 22 December 2016) (XE.com, 2018). Foreign
financial institution contracts are normally based on the US dollar, leaving the currency risk on
the Myanmar side of the transaction.
Long payback period
Mini-grid customers are primarily in the middle- or low-income level. Because of the nature of
the business, mini-grid operators do not make large profits, and the growth in demand takes
time to gain some leverage. The lower rate of return means it takes longer to pay back the
investment.

76
5.3.3 Economic Barriers
High transaction costs
Both a project’s size (i.e., small) as well as the distance of its location increase transaction costs.
Project sites are generally far from financial institutions (e.g., banks), which means it takes longer
and costs more for the lender to conduct due diligence on projects.
Small market size
The use of renewable energies, especially solar PV and wind, are increasing rapidly worldwide.
Mini-grids are also becoming more widespread. However, the Myanmar market has just been
established and is still developing. Multinational companies in the mini-grid business are also
expanding but rarely enter the Myanmar market.
Low demand
Creating demand for more-than-basic uses beyond lighting is still a challenge for operators. It is
difficult to find long-term data on electrification in off-grid villages.
In villages with main grids, in contrast, it did not take long before television sets, videos players,
refrigerators, rice cookers, and cooking stoves came into use soon after electrification. When the
village began to have access to electricity in 1994, 18 out of 156 households installed meters,
which connected them to the main grid. Five households owned televisions, one owned a video
player, and two owned refrigerators. The resident who owned the video player earned by
showing videos to villagers. One villager who owned a refrigerator made ice candies and sold
them to children on their way home from school. Thus, during the main grid’s early phase,
electrical appliances could be considered as capital goods rather than durable consumer goods
(Takahashi, 2018).
Unlike the main grid, mini-grid businesses need enough consumer demand that can pay for the
energy generation of the area. Telecom towers are a good example of anchor customers of mini-
grids; however, telecom towers are not often near an off-grid village. Because the main industry
in rural areas is agriculture, agricultural machinery (e.g., power tillers, cultivating roller boats,
threshers, combine harvesters, and transplants [Swe Mon Aung, 2018]) can be an important
source of demand once the village is electrified.
Tariff structure: cost-revenue gap/Customers’ ability to pay
There is no one-size-fits-all tariff structure (Tenenbaum et al., 2014). There are many factors to
consider when designing tariffs: e.g., the energy [kWh] base or power [kW] base, type of plan
(prepaid or post-paid), and number of lights or other appliances. In addition to these, customers
are normally classified as industrial or residential, with payment exemptions for poor households.
Tariff designs affect the revenue collection. Prepaid cards are the dominant payment system for
current Myanmar mini-grids but there have not been any regulations for mini-grid tariffs. This
situation is related to regulatory barriers, which will be discussed later in this chapter. In the

77
absence of a legal basis, operators are exposed to the risk of pressure to reduce tariffs because
mini-grid tariffs are set by mini-grid operators.
Also, tariffs are set to the level where customers are able to pay, but there often is a gap between
cost and revenue; grants are needed to cover some costs such as capital expenditure.
Since the main industry in rural villages is agriculture, customers’ incomes could be seasonal.
There is not enough variety in their sources of livelihood to spread their income through the off-
season. Operators need to consider the industrial structure of villages and the residents’ income
seasonality.
Revenue collection uncertainty
Uncertain in revenue collection is related to the previous barrier: Companies need to be able to
maintain their revenue collection rate. The technology known as Pay as You Go is one of the
prepaid methods. As soon as customers pay the tariffs, operators unlock their access so that the
former can then use the electricity. Pay as You Go enables operators to reduce the costs of bill
collection and prevent free riders.
5.3.4 Social/Cultural Barriers
Negative externalities caused by international organisations
During Myanmar’s isolation from the international community under a military government and
socialist system, mini-grids in Myanmar had developed independently of the international
business ecosystem (Vaghela, 2017b; Vaghela, 2017a). Existing local renewable energy-based
mini-grids were powered by micro hydropower or biomass gasifiers using rice husks. These
occurred in the informal sector and were not covered by government statistics.
One of the stakeholders explained the business model and situation to this study’s authors. A
community – mostly a village – invested in a mini-grid, which was operated by one family that
employed their own household members. After saving enough money for the equipment, they
expanded their generation capacity and/or grid. Their business was initially social and nearly
non-commercial, until a business model was introduced to the operators and/or customers.
Under the initial business model, target returns were very low or sometimes zero, and operators
handled their customers without the help of any sophisticated accounting reports.
Knowing that solar PV mini-grids were funded by the government and international
organisations, customers began to acknowledge the mini-grid as a commercial business and
turned skeptical regarding the profit operators were making off them. In spite of the presence
or absence of commerciality, the relationship changed, and trust was lost.
Schmidt et al. (2013) pointed out that aid from international organisations distorted the market,
and while the higher salaries paid by international organisations attracted capable human
resources, this led to a lack of human resource within local governments. These points were not
raised during the discussion with stakeholders in Myanmar; however, one of the stakeholders

78
did quietly lament the financial aid scheme, noting that because subsidies often distort markets,
these should be designed more carefully and that soft loans are preferable.
Educational gap
Relatively new solar PV companies in Myanmar have either highly educated leaders or
employees who are capable of drafting quality proposals that withstand screening at the
international level. In contrast, the long-established mini-grids of micro-hydropower or biomass
gasifiers were, as previously noted, mostly household industries and, according to one
stakeholder’s stories, are ran by individuals who have yet to learn how to work with something
as simple as Microsoft Excel. Such educational gap makes it difficult for small, local companies
to obtain financing from international organisations, which they hope could finance their capital
costs.
The language barrier is part of the problem. There are 135 ethnic groups in Myanmar7, with
some locals unable to speak Burmese.
Government officers can certainly speak Burmese and can communicate, but speaking in English
to officers from international organisations could have made it easier to pitch proposals for
acceptance.
Community acceptance
Unlike personal use equipment such as SHSs, a mini-grid project needs a certain level of
community acceptance for execution. A village electrification committee is often organised for
this purpose.
Geographical difficulty
Residential territories of minor ethnic groups overlap the off-grid areas. Language and cultural
differences make projects more difficult in those area, as pointed out by Del Barrio Alvarez (2018).
Perception of inferior quality
Particularly during the early stages of a mini-grid’s operation, it is difficult to supply energy 24
hours a day, seven days a week. Neither can the main grid offer such capability. However, it is
important to get community acceptance of inferior quality in advance as it will reduce customer
dissatisfaction for the supply shortage. It will be easier for people to accept inferior quality if
they know the main grid quality is bad as well or even worse than the minigrid in advance.
Theft, non-technical loss, and ‘shared resources’
It is difficult to prevent theft completely, in rural area as well as in urban area. Non-technical
7 As the definition of ethnic groups in Myanmar and non-Burmese speaking groups are outside the scope of the study, these are not discuss in this paper.

79
losses, which are not only a result of theft but also incorrect metering, and imperfect tariff
collection can occur too. Also, the consumers of renewable-based minigrids share the limited
resources. It is difficult to stop one family from using more than their allocated share. However,
the risk of shared resource can be reduced with adopting appropriate payment schemes.
5.3.5 Technical Barriers
Indigenous technology
As mentioned earlier, there were indigenous types of mini-grids as well as equipment technology
(e.g., hydro turbine) developed organically in Myanmar. Their designs might differ from
international versions, but this should not mean indigenous technology should be disallowed.
Lack of local expertise/Durability and quality/Operation and maintenance
Because off-grid villages have not been electrified, these areas do not have any available
electrical engineers. Thus, operators need to start training local workers for local employment.
Capacitating local resources helps improve and sustain the durability and quality of
infrastructure during installation as well as maintenance.
Intermittency
Generation of renewable energy sources in mini-grids is intermittent. For example, solar
resources vary daily and seasonally; water volume for hydropower fluctuates seasonally; and
biomass using rice husks is affected by the harvest season.
Lack of interoperability with main grid
In Myanmar, there are no rules or codes covering mini-grids. Mini-grids can be designed without
considering how they relate to the main grid. If there is sudden decision to extend the main grid’s
coverage area, investment in standalone mini-grids already existing in the overlapping coverage
area is wasted or becomes redundant.
5.3.6 Regulatory Barriers
Lack of regulatory framework
No regulations cover mini-grids at this moment. However, donor organisations and government
are currently working on a draft regulation.
Institutional capacity
After ministries underwent structural changes in 2016, the energy sector is now under the
jurisdiction of the MOEE. However, the authority over various energy sources is complicated.
Off-grid electrification is under DRD; petroleum, geothermal, and electricity are under the

80
MOEE; coal is under the Ministry of Mineral Resource and Environmental Conservation; civilian
nuclear energy is under the Ministry of Education; energy efficiency and conservation is under
the Ministry of Industry. Also, renewable energy is led by the Ministry of Education; Ministry of
Agriculture, Livestock and Irrigation; MOEE; and Ministry of Mineral Resource and Environmental
Conservation (M. M. Kyaw, 2017). This complicated structure needs to be streamlined if
ministries and/or other institutions are to coordinate and align their priorities.
Lack of technical standards and codes
Without technical standards or codes, it is difficult to maintain a certain level of quality for mini-
grids. Also, rules on how to deal with industrial waste, tar, and lead-acid should be established
for sustainable development.
Threat of grid extension
Mini-grid operators are uncertain what will happen after the main grid reaches their customers’
village. In theory, mini-grids are planned in areas that main grid are not expected to reach within
10 years. However, plans on the main grid’s extension can change.
Lack of enforcement
Policy plans with some enforceability such as feed-in tariffs or renewable portfolio standards are
needed to promote renewable energy. Discussions on draft regulations for the energy sector are
now covering feed-in tariffs.
5.3.7 Barrier Framework, Policy Status, and Knowledge Gaps
Having developed a framework on the analysis of the barriers, one is now in a position to see
which policy areas have received adequate attention and which ones remain unaddressed. Table
5-6 presents the current status of the different barriers based on the literature review.
As in other countries, the threat of central grid extension seems to be one of the most important
barriers. The plan to introduce a mini-grid regulation framework will likely remove this barrier,
but the draft is ongoing and not yet finalised.
Likewise, there is a programme to develop the financial sector, particularly to improve small and
medium enterprises’ access to finance (GIZ, 2017). This programme between Myanmar and a
development partner is also not yet finished.
One interesting finding in this study is that Myanmar’s long history of economic isolation has
spawned domestic, indigenous technologies and business models though there seems to be
some friction with respect to opening up the Myanmar market because of huge differences or
gaps with international standards. This remains unaddressed, however.

81
Table 5-6. Barriers and Their Current Status
Barrier Current status
Financial The capacity development programme for the financial sector is in
progress. It should provide mini-grid developers soft loans from
international donor organisation through commercial banks (Greacen,
2017b).
Economic Renewable energy-based mini-grids, especially solar PV, are capital
intensive. It is reasonable to subsidise the initial costs of solar PV at the
early stage, similar to the objective of the 60/20/20 programme. The
ultimate aim is for the market to reach the stage where businesses can
survive without subsidies. Demand is sure to grow but its speed is
unclear.
Social/Cultural Because of Myanmar’s long isolation from the world, social/cultural
differences are wider than in other countries. There are literatures that
explain mini-grids in Myanmar from a social or cultural point of view.
Indigenous business ecosystems of mini-grids in Myanmar should be
evaluated, not dismissed.
Technical Capacity building should fill in the knowledge gap. It should not be
limited to developing new projects but should bring the knowhow of
existing mini-grid operators of indigenous technologies up to par with
international standards.
Regulatory A regulatory framework that emphasises adherence to the law can
decrease many regulatory risks (Pawletko, 2018; Greacen, 2018;
Schmidt–Reindahl, 2018). However, there could be differences
between legal expectations and reality, as gleaned from past
experiences. It is not yet clear how to apply these regulations in actual
practice.
PV = photovoltaic
Source: Authors.
5.4 Conclusions and Discussion
This chapter conducted an analysis of rural electrification and mini-grid support policies in
Myanmar. A techno-economic assessment of renewable-based mini-grids was performed, which
confirmed that there is economic sense to apply this technology in rural areas that are burdened
with high diesel prices.
To analyse what hindered mini-grids’ development other than economic factors, a
comprehensive framework was develop, drawing on the broad literature and interviews
conducted for the study. The resulting typology is similar to those already developed in existing
literature but contains some novel elements such as the integration of domestic, indigenous
technologies developed during Myanmar’s economic isolation period.

82
The barrier analysis in this study is still in its early stage and has many limitations. Although
backed by a review of literature and feedback from stakeholders, the resulting typology still
needs further refinement. More importantly, it stopped short of providing a detailed analysis on
how to remove each barrier through policy intervention and did not attempt to rank various
barriers in the order of importance. No analysis on interactions (i.e., synergies or trade-offs)
amongst barrier categories/subcategories was done. Such analyses could help further develop
the rapidly changing mini-grid market in Myanmar and subsequently improve the conditions of
residents in rural areas.

83
Chapter 6
Environmental and Social Guidelines on China’s Foreign
Investments and the Myitsone Dam Controversy
In 2011, a mega project in Myanmar called the Myitsone hydropower development was
suspended. This chapter attempts to explain the link between the suspension and China’s
‘Guidelines for Environmental Protection in Foreign Investment and Cooperation’, through the
lens of the first two stages of Anthony Downs’ Issue Attention Cycle – in particular, the ‘alarmed
discovery and euphoric enthusiasm’ phase.
This chapter underscores the need for international communities to help create communication
lines between foreign investors and local communities as early as the pre-project phase of any
large-scale hydropower development project.
6.1 Introduction
On 28 February 2013, China’s Ministry of Commerce and Ministry of Environmental Protection
released its ‘Guidelines for Environmental Protection in Foreign Investment and Cooperation’, a
document that defines how Chinese investors should safeguard the host countries’ local
environmental and social interests. Many nations have long been calling for such a move,
recognising the serious adverse impact of China’s foreign direct investment and fearing that any
existing damage will likely worsen in the near future.
The guideline is composed of 22 articles that refer to compliance with local laws and regulations
of the host country; the need to safeguard local culture and society; the importance of creating
environmental and disaster management plans as well as mitigating adverse impacts; caring for
the local community; disposal of industrial wastewater; international environmental standards,
etc.8 According to International Rivers, the United States-based international nongovernmental
organisation, the guideline contains two important aspects: ‘dialogue with the local community’
and ‘mitigation of environmental impacts’ (International Rivers 2013b).9
Dialogues with the local community are covered in five articles:
1) The enterprise must respect the local religion, culture, and custom to facilitate
harmonious development with the local economy, environment, and society (Article 3);
2) In line with local laws and regulations, the enterprise must establish and maintain a
8 For the full guideline in English, see the Appendix. For the original Chinese version, see http://www.mofcom.gov.cn/article/b/bf/201302/20130200039930.shtml.

84
communication channel with local communities as part of the project’s environmental
and social responsibility, and must also consider the opinions and suggestions
(pertaining to projects) of the community’s residents through public hearings and
consultations (Article 20);
3) The enterprise must prepare and publish a project plan that complies the local laws and
regulations, and disclose information regarding the environment affected by the project
(Article 18);
4) The enterprise must develop and utilise a secured communication channel with
stakeholders to deal with urgent incidents and accidents (Article 14);
5) The enterprise must implement a sustainable development strategy to balance
corporate benefits and environmental conservation (Article 4).
These next four articles relate to the mitigation of environmental impact caused by the project:
1) The enterprise must identify the manner of storage, transfer, reduction, recycling, and
disposal of hazardous waste in the project management plan, and ensure that the level
of pollution generated by the project complies with the local environmental standards
through a pollution prevention plan (Articles 10, 13, and 16);
2) In line with local laws and industrial practices, the enterprise must prepare and
implement mitigation and restoration plans in case the project’s activities/systems
create adverse impacts on local ecosystems (Article 15).
3) The enterprise must monitor and evaluate the project’s impact before implementation,
collect and record relevant local information, and monitor and record disposal of waste
(Article 11).
4) The enterprise must prepare and implement a mitigation plan with regard to project-
related impacts on historical and cultural monuments and tourist attractions (Article 9).
The guideline, however, could be criticise because (i) it does not mention the rights of local
communities and individuals; (ii) it does not prohibit locating a project within a
protected/conserved area (such as those containing world heritage structures, or
environmentally valuable areas such as national parks); and (iii) it cannot possibly lead to project
cancellation even if impact mitigation is impossible, although it emphasises this point as a
requirement. While these criticisms are reasonable, the publication of this guideline could be
seen as a positive first step towards ensuring that China enterprises with foreign direct
investments are taking measures to safeguard project-affected local communities and their
environment.
The section below provides the analytical framework used in the discussion of the guideline vis-
à-vis the Issue Attention Cycle. The third section presents a case study, – the suspension of the
Myitsone Dam project in Myanmar – and analyses it in relation to this framework. The fourth
section expands on this analysis by tackling the endogenous and exogenous factors that affected
this case. The fifth and last section provides recommendations.

85
6.2 Analytical Methodology
6.2.1 Issue Attention Cycle Framework
The relationship between issue-attention and decision-making can be defined via a popular
concept known as Downs’ Issue Attention Cycle. In this concept, Downs argued that public
concerns on environmental problems is often cyclical, which forces critical decision-making at a
certain point. He noted that a problem ‘leaps into prominence, remains there for a short time,
and then, though still largely unresolved, gradually fades from the centre of public attention’
(Downs, 1972). In its original form, the environmental problems in the 1960s were analysed. Also,
It has since been found to be applicable in understanding the relationship between policy
decisions and public interests in certain issues (Cohen, 1963; Iyengar and Kinder, 1987; Walker,
1977).
According to Downs, each stage is summarised as follows (Figure 6-1):
Figure 6-1. Public Interest in the Issue Attention Cycle
Source: Staggenborg, 2015.
Stage 1. The pre-problem: In this stage, undesirable social conditions have
not yet caught the public’s attention. Meanwhile, experts and interest groups
have already cautioned about the undue impact.
Stage 2. Alarmed discovery and euphoric enthusiasm: A series of events (or
other reasons) catches the public’s awareness. The public is now alarmed
about the negative side of an issue. This alarmed discovery is invariably
followed by euphoric enthusiasm over society’s ability to solve the problem
effectively in a short time.

86
Stage 3. Realising the cost of significant progress: In the third stage, the
public gradually realises the high cost of ‘solving the problem’. Eventually, not
only a considerable amount of money but also significant sacrifices from a
certain interest group are required to solve the problem.
Stage 4. Gradual decline of intense public interest: The realisation of the cost
in the previous stage leads to a gradual decline in the public’s interest. As
more people realise how difficult and costly it would be to resolve the issue
themselves, public desire to keep attention focused on the issue
consequently wanes.
Stage 5. Post-problem stage: In the final stage, the issue that was at the
centre of public concern is now replaced by some other concern. The initial
issue then moves into a prolonged limbo; it receives lesser attention than it
did in the beginning (Stage 1) or experiences short-lived recurrences of
interest.
6.2.2 Application of the Framework
While the framework mentions the cyclical character of public attention on a certain issue, it
also assumes that important decisions are reached when there is an increasing public interest in
the issue, particularly in Stage 2. Following this assumption, the publication of the guideline in
2013 may be perceived as related to Stage 2 in the cycle.
At first blush, many might assume that the release of the guideline has been driven by relevant
public interests in China itself. Yet, this study does not take this view for the following reasons:
First, the Chinese government is less accountable towards its own people compared to a
democratic government. Second, it is unlikely that the Chinese public’s interest in the
environmental and social safeguards in foreign direct investment has risen significantly. Instead,
this chapter sheds light on the public interest around projects outside China, and addresses its
connection to the publication of the guideline in China.
This look at the connection is via a comparative study of Chinese-led dam projects in Myanmar,
Lao PDR, and Cambodia (Kirchherr et al., 2017). While this study mentions the Myitsone dam
controversy as a game changer, it does not delve into the details of the case. Rather, the study
analyses public interest in the controversy through in-depth personal interviews and analysis of
primary data. First, the study focuses on the role of the Global Environmental Institute (GEI), the
party that drafted the guideline.
Then, it narrows down the focus of the interviews on the recent halt of the Myitsone hydropower
project in Myanmar. The next section thus describes how this process moves from Stage 1 to
Stage 2 of the Downs’ framework.
6.3 Cancellation of the Myitsone Dam project: from Stage 1 to Stage 2

87
6.3.1 Pre-problem Stage
China has invested heavily in hydropower dams all over the world (Figure 6-2)). In terms of the
number of projects, Southeast Asia is China’s biggest market, followed by Africa and South Asia.
In Southeast Asia, some of China’s biggest markets are Myanmar, Lao PDR, and Cambodia,
together with Viet Nam and Malaysia.
Myanmar, Lao PDR, and Cambodia recently attracted considerable foreign direct investment
from China (Figure 6-3). While Cambodia recorded an increase in Chinese-invested dams since
2010, the number in Lao PDR has surged since 2011. On the other hand, Myanmar, which was
gradually democratised under the former President U Thein Sein, has been seeing serious public
outcry over hydropower projects since 2011.
The International community has long criticised China’s investments in dams outside of its
country for its lack of environmental and social safeguards. 10 While this problem was not
recognised by the Chinese public, nongovernmental organisations have been slowly highlighting
its observations since the mid-2000s. In 2008, GEI eventually drafted the guideline in
collaboration with the Ministry of Environmental Protection.11
The Ministry of Commerce’s hesitance delayed the government’s approval on the publication of
the guideline. Although environmental issues had already been raised during that period, the
Ministry of Commerce did not relent. As the draft was not opened to the public, it never stirred
any public discussion.
Figure 6-2. Number of Chinese Hydropower Development
Source: International Rivers (2012).
10 For example, see ‘China: New Dam Builder for the World’, Wall Street Journal (28 December 2007) and ‘Bui Dam Workers Up Against Chinese Employers’, Modern Ghana (26 May 2008). https://www.modernghana.com/news/167059/1/bui-dam-workers-up-against-chinese-employers.html 11 Ji Lin, Global Environmental Institute, Interviewed by the author, 3 February 2018.

88
Figure 6-3. Chinese Hydropower Development in Cambodia, Lao PDR, and Myanmar
Source: Association of Southeast Asian Nations (2013).
6.3.2 Myitsone Development: Deepening Ties Between China and Myanmar
The temporary suspension of the Myitsone Dam took place in 2011, two years before the
guideline’s release in 2013.
The Myitsone Dam is located in Kachin State in northern Myanmar, and is home to one of the
country’s minorities, the Kachin people (Figure 6-4). The project consortium consisted of the
China Power Investment Corporation (CPI), Ministry of Power No. 1 of Myanmar, and Myanmar’s
Asia World Company. Its total investment was US$3.6 billion. Had the project been completed in
2017 as planned – with its total capacity of 6000 MW – the Myitsone hydropower project would
have been one of the largest in Myanmar and even Southeast Asia. Yet, former President U Thein
Sein suddenly announced a halt to the dam’s development during his tenure in 2011. The
decision was made because although Myanmar had improved its ties with China, it was
confronted with severe sanctions from Western countries in the 2000s.12
Some key events that occurred prior to President U Thein Sein’s decision are chronicled below.
In June 2000, General Maung Aye, vice-chairman of the State Peace and Development Council,
announced China and Myanmar’s joint statement on a cooperative framework. In July 2000,
Vice-President Hu Jintao visited Myanmar and discussed a cooperative agreement on science
and technology between the two countries. One year later, China and Myanmar signed a
cooperative agreement on geology and mining. In December 2001, President Jiang Zemin visited
Myanmar and signed the agreement on the promotion of trade and investment. In March 2004,
12 Regarding this deepening relationship, see Shee (2005) and Shao and Fan (2005), for example.

89
Wu Yi, vice-premier of the State Council, visited Myanmar and signed the MoU on the promotion
of investment and trade according to the Economic and Commercial Counsellor’s Office of the
Embassy of the People’s Republic of China in the Republic of the Union of Myanmar.
After Prime Minister Khin Nyunt was replaced by Soe Win in October 2004 (an event brought
about by pressure from the Bush/US administration), the cooperation between China and
Myanmar even grew stronger. In April 2005, Chinese President Hu Jintao met with Myanmar’s
President Than Shwe in Jakarta to agree to new bilateral relationships (People’s Daily Online,
2005). In February 2006, Chinese Premier Wen Jiabao met with the group led by Myanmar Prime
Minister Soe Win and agreed on the early initiation of some prioritised projects. Under this
agreement, Myanmar expressed its expectation for heightened cooperation and higher
investment from Chinese corporations in the energy sector (Sohu News, 2006). In December of
the same year, high-ranking officers from the Ministry of Power No. 1 of Myanmar visited
Kunming to request additional energy investments from Chinese corporations.
Figure 6-4. Location of the Myitsone Hydropower Development Project
Source: Burma Rivers Network.
Myitsone Dam• Height: 152m
• Installed Capacity:
6,000 MW
• Annual Production:
30,860 GWh
Salw
een R
iver
Irraw
addy R
iver

90
Accordingly, in December 2006, the CPI eventually agreed on an MoU with the Ministry of Power
No. 1 of Myanmar for new development projects in the Irrawaddy Basin. These projects included
the 6,000 MW dam at Myitsone and the 3,400 MW dam at Chibwe.
In 2007, the Changjiang Design Institute of China sent designers to dam sites to conduct
geological drilling, reservoir inspection, and hydrological measurements. In 2009, Myanmar
Ambassador Thein Lwin and CPI President Lu Qizhou signed a build-operate-transfer MoU for
hydropower projects such as the one in Myitsone (Burma Rivers Network, 2009). In December
2009, CPI started planning of the hydropower project in the upper Irrawaddy (Ayeyarwady) Basin.
In June 2010, the Ministry of Power No. 1 of Myanmar and CPI signed the construction
agreement in the presence of both Chinese Premier Wen Jiabao and Myanmar President U Thein
Sein (Xinhua Net, 2010).
6.3.3 Cancellation of Myitsone Project: Alarming Discovery and Euphoric Enthusiasm
(Stage 2)
After early 2011, the relationship between Myanmar and China reversed completely. Two
political events were responsible for this shift. First, the Obama Administration reversed the Bush
Administration’s diplomatic policy on Myanmar for three reasons (Liu, 2010): (i) The US
diplomacy changed its focus from hard power to soft power after the economic crisis in 2009;
(ii) The United States began to view ASEAN countries as a platform for its Asian diplomacy; and
(iii) China has always exerted a strong influence in the ASEAN region. As a consequence, the
Obama administration took a friendlier stance towards ASEAN countries, including Myanmar (Xie
and Liang, 2011).
Second, from the viewpoint of the Thein Sein administration, the changing diplomatic attitude
of the United States was favourable as it could give Myanmar the opportunity to request that
the sanctions imposed on the country be lifted. This was necessary to achieve tangible economic
development after democratisation under Thein Sein’s leadership. In this regard, Thein Sein
eventually released one of the world’s most important political figures, Aung San Suu Kyi in
March 2011. Swiftly, in August of that year, Suu Kyi started ‘Save the Irrawaddy’ campaign with
an open letter to the public, mentioning four points (Burma Partnership, 2011). (i) Irrawaddy
(Ayeyarwady) is the most important river in the country; (ii) Dam development is problematic
since it threatens the river; (iii) Problems resulting from the Myitsone dam development include
security, livelihood, nationality, and diplomatic aspects; and (iv) People are called upon to
participate in ‘Save the Irrawaddy’ campaign. In this way, the NLD – the party led by Aung San
Suu Kyi – strategically positioned the controversial Myitsone project as an issue for the 2012
elections. The Thein Sein administration could not ignore this growing campaign, which was also
backed by the international community, and eventually announced a halt to the project in
September 2011.
While the campaign never specifically blamed China for the project, it created considerable anti-
Chinese sentiment in Myanmar. For example, local groups listed the following as reasons to stop

91
the Myitsone hydropower project:13 (i) Construction of the dam caused social issues because
of the forced relocations of more than 60 villages and 10,000 residents; (ii) The electricity
produced would be primarily exported to China, with the remaining being distributed between
Myanmar’s military and corporations. Therefore, the project will not benefit local communities;
(iii) Energy export from Myitsone would provide an annual benefit of US$500 million to the
military government but a higher US$3.6 billion to China; (iv) No relevant social and
environmental impact assessments have been prepared; (v) Stakeholder meetings with
concerned local communities have not been held; (vi) The project has no monitoring system in-
charge; (vii) The dam site holds enormous cultural significance to the Kachin people; (viii) The
dam will change the river’s flow, damaging fisheries downstream; (ix) As the location is a conflict-
prone zone, the dam is likely to suffer damage from potential conflicts; (x) Dam construction will
lead to forced labour and human rights violations by the Burmese military; (xi) The dam is located
in an earthquake-prone area; (xii) Drainage containing methyl alcohol could pollute the waters
used by communities living downstream; and (xiii) the Chinese company absolves itself of full
responsibility in sustaining the livelihood of the affected local community. Thus, China was an
implicitly accused party in the Myitsone project.14
This growing anti-Chinese sentiment posed a serious barrier to China’s expansion policy in the
ASEAN region. Thus, it had to prove its willingness to be flexible with the locals’ demands. One
of China’s responses in 2013 was to publish the guideline, the document that had previously
been stalled by its Ministry of Commerce.15
6.4 Other Endogenous and Exogenous Factors
Aside from the factors listed above, there could be other considerations that led to the tipping
point. One set of considerations is the endogenous factors in the Chinese policy. The year 2013
was not just the year the guideline was published. It also marked the year of transition from the
China’s 11th Five-Year Plan (2006–2010) to the 12th Five-Year Plan (2011–2015). This policy
change could have affected the attitude of the Ministry of Commerce to favour the guideline’s
release.
Critics also noted that external pressures other than those pertaining to the Myitsone
hydropower project could have brought about this change. There were other projects considered
controversial at the time, which could also have influenced the Chinese government’s stance.
13 See Burma Rivers Network website < http://www.burmariversnetwork.org >. 14 Arguably, the United States might have played a role in this process. See ‘US Embassy Cables: How Rangoon Office Helped Opponents of Myitsone Dam’, The Guardian (30 September 2011) < http://www.theguardian.com/world/2011/sep/30/us-embassy-cables-myitsone-dam-document > and ‘WikiLeaks cables: Americans funded groups that stalled Burma dam project’, The Guardian (30 September 2011) < http://www.theguardian.com/world/2011/sep/30/us-embassy-cables-burma-myitsone-dam >. 15 Ji Lin, Global Environmental Institute, interviewed by the author, 3 February 2018.

92
6.4.1 Environmental Concerns in the 12th Five-Year Plan
The 12th Five-Year Plan (2011–2015) consists of 16 comprehensive chapters. It imposes more
stringent environmental targets compared to the previous plan. First, the energy consumption
rate was targeted to reach 16%, which is more ambitious than the previous target of 20%. Second,
the target for non-fossil fuel use was set at 11.4%, (compared with 7.5% in 2011). Third, CO2
emission intensities were to be reduced by 17% compared to the 2010 level. Fourth, the annual
reduction rates of SO2 and NOx were targeted at 8% and 10%, respectively, compared to 2010
levels. Moreover, China has arguably been trying to move beyond coal (Horii, 2011).
However, this environmentally friendly stance only applies to the country’s domestic investment
policy and not to its external investment plan. For domestic investments, energy-efficient and
environmentally friendly technologies enjoy the Chinese government’s support in the form of
assistance with Research and Development and an advanced industry. In contrast,
environmental and social safeguards were never considered for external investments. Instead,
to highlight internal and external investments together as one of the four pillars in its Five-Year
Plan, the Chinese government has made a strong push for external investment without paying
heed to environmental and social safeguards.
6.4.2 Environmental Controversies in 2008–2013
The period 2008–2013 was marked by environmental controversies in countries other than
Myanmar. For instance, consider the Kamchay Dam in Cambodia, which has a design capacity of
200 MW. A build-operate-transfer contract was agreed upon between Sinohydro and the
Ministry of Mines and Resources of Cambodia in 2008. Although nongovernmental organisations
highlighted environmental and social concerns associated with the dam and complained about
insufficient information disclosure, the developer proceeded with the construction so that the
dam could commence operation in December 2011.
Another case is that of the Lower Sesan 2 Dam in Cambodia, which has a total capacity of 400
MW. In 2012, Hydrolancang International signed the contract to construct the dam. The dam was
started in February 2014 but became controversial because it did not satisfy the international
environmental impact assessment standards. However, the company was able to complete the
structure in September 2017.
While both cases were marred by environmental and social problems and stirred local
controversies, they never attracted enough public attention to compel developers to suspend
the projects.
In 2014, International Rivers reported that Myanmar has the distinction of being the country
with the highest number of suspended dam projects (International Rivers, 2013a). Besides the
Myitsone Dam, Myanmar had suspended five other dam projects; namely, Chibwe (2,800 MW),
Khaunlanphu (2,700 MW), and Lakin (1,400 MW) Dams in the N’Mai River Basin; and the Dagwin
(800 MW) and Weigyi (4,540 MW) Dams in the Salween Watershed. These projects were funded
and originally set to be constructed by Chinese companies. Yet, as seen in the previous section,

93
the ‘Save the Irrawaddy’ campaign was led by the NLD party before the 2012 election, but only
the Myitsone controversy led to the rise of anti-Chinese sentiments. Eventually, the Chinese
government could not ignore this turn of events.
6.5 Conclusion: Summary and Implications
This chapter attempted to explain the link between the release of the ‘Guidelines for
Environmental Protection in Foreign Investment and Cooperation’ and the first two stages of
Downs’ Issue Attention Cycle surrounding the stalled Myitsone hydropower project in Myanmar.
As Downs noted, the guideline was published in 2013, immediately after the attention on the
Myitsone hydropower as well as anti-Chinese sentiment in Myanmar peaked. Thus, the Issue
Attention Cycle model – which was originally applicable to democratic institutions – might also
be applicable to the decision-making process in China, a country characterised by a socialist
market economy.16
The environmental nongovernmental organisation GEI has played an indirect role in connecting
the issue and the public interest in Myanmar and the eventual decision of the Chinese
government.
It can be argued that regardless of GEI’s actions, the Chinese government would have had
responded to the growing anti-Chinese sentiment in Myanmar due to the Myitsone controversy.
Nevertheless, one needs to acknowledge that without GEI’s preparation of the draft in 2008, the
guideline might not have been published in its current form in 2013. Global Environmental
Institute, therefore, helped expedite the Chinese government’s response to the Myitsone issue.
Thus, the following are policy implications regarding China’s environmental safeguard policies on
its external investments: First, as early as the ‘pre-problem’ stage, specific policy design and
recommendations must include ways to tackle latent problems at the outset. At this stage, such
policy advocacy may not have an effective outcome, considering the low accountability of
Chinese policy-making. Yet, as shown by the experience pertaining to GEI’s draft, such advocacy
will see results in the long run. To address environmental and social issues, collaboration with
the Ministry of Environmental Protection can be a strategy worth taking.
Second, in the ‘alarmed discovery and euphoric enthusiasm’ stage, the Chinese government
must ensure that the policy-based strategy developed during the ‘pre-problem’ stage effectively
responds to the public’s concerns. So far, the Chinese government and companies have not
effectively dealt with the anti-Chinese sentiment. It is often said that they lack competence in
public diplomacy, which unfortunately lowers their image (Kittner and Yamaguchi, 2017;
Yamaguchi et al., 2018). In this context, the Chinese government also needs an effective policy
to deal with anti-Chinese sentiments in the countries it invests in.
16 Kingdon’s ‘Agenda Setting Model’ could be similarly applied to the Chinese policy-making process. For example, see Liu and Yamaguchi (2017).

94
Finally, to take this study one step further, it is crucial to monitor the effective implementation
of a policy during the later stages – that is, when the public’s attention starts to fade. As shown
in other cases, the policy implementation process can be problematic if it does not have the
public’s attention.17 It is quite difficult, however, to ensure the effective implementation of the
Chinese policy on external investments, as China does not have any accountability over policies
implemented outside its borders. Thus, future research should look at how effective policies are
being implemented with regard the ‘Guidelines for Environmental Protection in Foreign
Investment and Cooperation.’
17 For example, see Hall (2002).

95
Chapter 7
Policy Recommendations
This whole report approached the power sector policy of Myanmar from a range of perspectives,
covering integrated energy/environmental assessment of large-scale hydropower, techno-
economic assessment of mini-grids, qualitative policy analysis of utility-scale solar and mini-grids,
and China’s approach towards hydropower projects. Lessons have been distilled from each
chapter and integrated in the following policy recommendations.
7.1 The Main Grid and Expansion of Its Power Capacity
Alternative power development plans that do acknowledge the possible negative
consequence of large-scale hydropower plants can contribute to ecological and social stability
while achieving economic efficiency. Concentrating one’s option on large-scale hydropower
could potentially threaten the ecosystem and social stability. Fortunately, the rapidly falling cost
of emerging renewable energy technologies – including solar, biomass, and battery storage – is
one reason alternatives’ capacity expansion pathways must be reconsidered. At the same time,
there must be a more concerted effort to accurately estimate (i) the technical resource potential
of solar and other non-hydropower-based renewables in a community; and (ii) the developers’
ability to fund new projects if one were to improve the electricity system’s reliability and reach
in an area.
Coal-fired power plants and large-scale hydropower can create a new set of stranded assets
under future power development scenarios. Including solar energy into the mix can diversify
the power source portfolio, distribute the risk across a large number of projects and make the
transition towards clean energy faster and more cost effective. Stranded assets are one of the
significant financial risks in large-scale energy infrastructure projects, which include hydropower.
The lack of constant or predictable future revenues from new energy system investments could
put a project at risk of bankruptcy. Solar and distributed energy resource options offer operators
a diversified portfolio approach that can reduce the financial risk of having stranded assets.
Myanmar can take advantage of the falling cost of solar electricity by making a strategic
priority in its power development plan. Participation in financial instruments such as renewable
energy auctions allows low-cost utility-solar projects to directly compete with large-scale
hydropower projects.
There is an important PV potential that is currently not being utilised in Myanmar. That is, by
developing the utility-scale solar generation in the Central Dry Zone, Myanmar can improve its
power generation mix in a relatively short period. Connection to the national grid can be done
without having to invest in long-distance new transmission lines (although re-enforcements of
the infrastructure would most likely be required).

96
7.2 Rural Electrification with Renewable-based Mini-grids
To accelerate the diffusion of mini-grids and make mini-grid businesses sustainable, the
business sector’s use of electricity during daytime in rural areas should be encouraged.
Productive use of electricity during daytime in rural areas should be encouraged to make the
mini-grid business sustainable.
Another way to make business sustainable is to improve the entrepreneurship knowhow of mini-
grid developers/operators, most of whom have engineering backgrounds and are not
entrepreneurs. A support programme for villagers on how to start new businesses will be useful.
Mini-grid developers/operators are in need of a supportive financing scheme. Appropriate
financial support should be provided to mini-grid developers/operators, who often face
difficulties with regard project financing. Myanmar’s financial sector needs to be further
developed to keep pace with foreign investments in the country. International investment,
including the development of mini-grids, should also be matched with local needs.
To sustain quality, there is an urgent need to define the technical standards for renewable
energy equipment. Regulatory frameworks for off-grid systems and technical standards or codes
for solar PV modules do not yet exist as of this writing, which means some energy sector players
suffer from using poor quality equipment. This tarnishes the image of renewable energy systems.
To make electrification efficient, a single governmental body should be responsible for dealing
with both on-grid and off-grid measures. While the MOEE is currently working to extend the
main grids, the DRD of the Ministry of Agriculture Livestock and Irrigation pursues both solar
home systems and mini-grids as off-grid measures. At the moment, coordinating mechanisms
are lacking between the two ministries. Institutional reforms are needed in this case.
7.3 Investment Environments and Connectivity
Developing a policy framework that will streamline investments should be a priority of the
government of Myanmar. Currently, energy projects in Myanmar are negotiated bilaterally,
which has limitations in attracting investments for a large number of projects. Promoting a
healthy competition amongst investors would enable the most suitable projects to be selected
in both financial and nonfinancial terms. A transparent and secure investment climate is needed.
Participation in a regional power grid market (e.g., Greater Mekong Subregion, ASEAN Power
Grid, and the South Asia Subregional Economic Cooperation) will give Myanmar opportunities
to expand its access to electricity, meet rising urban power demand and minimise
environmental and societal risks. Further regional integration could smoothen tensions with
investors from neighbouring countries as well as create reliable electricity export revenues
without causing ecological or social issues. Importing electricity from neighbouring countries
with excess supply can also quickly alleviate frequent blackouts, a lack of a reliable grid, and

97
balance loads during peak periods. At the same time, it can allow for incremental investments
and quicker access to electricity for underserved populations in rural areas.
When adopting policies from other countries, both the government of Myanmar and
development partners should consider the country’s context. The international community
already has a relatively broad experience with different policy instruments in promoting the
deployment of renewables. Feed-in tariffs and renewable purchase obligations have been
applied for some time. In recent years, energy auctions have been proven effective in identifying
and reducing the prices of renewables in many countries. Myanmar could use that experience
for its own needs. The assistance of development partners would be very valuable in this process.
However, Myanmar’s circumstances with regard its socioeconomic and political situation should
be taken into account. For example, how to secure land in an appropriate manner should be
seriously considered when implementing policies in Myanmar.
International society should help secure communication lines between foreign investors and
local communities during the pre-project phase of large-scale hydropower developments.
There has recently been a move to institutionalise the environmental impact assessment and
strategic environmental assessment processes for hydropower projects. However, what are
often lacking during the pre-project phase are open communication lines between foreign
investors and local communities. Setting up this communication line at the onset may not only
prevent potential environmental and social issues but also avert any economic loss brought by a
public outcry or opposition.
Capacity building programmes are required to achieve all the above measures effectively. The
programme should target administrative officers as well as other stakeholders such as
parliament members. Often, problems in implementation are not due to technocrats’ capacity
but to the system employed by the relevant offices involved. In the energy sector in particular, it
is critical to develop the competences and define the functions of the energy regulatory
commission per the stipulations in the country’s Electricity Law.

98
References
ACE (2016), Levelised Cost of Electricity of Selected Renewable Technologies in the ASEAN
Member States. Jakarta: ASEAN Centre for Energy. Retrieved from
http://cloud.aseanenergy.org/s/1AK7OzwGCHn5iAM (accessed 26 May 2017).
ACE (2017), The 5th ASEAN Energy Outlook 2015–2040. Jakarta: ASEAN Centre for Energy.
ADB (2013), Agriculture, Natural Resources, and Environment Initial Sector Assessment,
Strategy, and Road Map. Mandaluyong City, Philippines: Asian Development Bank.
—— (2015), Renewable Energy Developments and potential in the Greater Mekong Subregion.
Manila, Philippines. Retrieved from http://www.adb.org/Documents/Brochures/GMS-
Biofuel/GMS-Biofuel-Brochure.pdf (accessed 21 July 2017).
—— (2016), Myanmar: Energy Sector Assessment, Strategy, and Road Map. Manila,
Philippines. Retrieved from https://www.adb.org/sites/default/files/institutional-
document/218286/mya-energy-sector-assessment.pdf (accessed 21 July 2017).
Ahlborg, H., and L. Hammar (2014), ‘Drivers and Barriers to Rural Electrification in Tanzania and
Mozambique – Grid-extension, Off-grid, and Renewable Energy Technologies’, Renewable
Energy, 61, pp. 117–124. https://doi.org/10.1016/j.renene.2012.09.057.
Anbumozhi, V., and N.A. Tuan, (2015), Integrative Strategy and Policies for Promoting
Appropriate Renewable Energy Technologies in Lower Mekong Basin Region with Special Focus
on Viet Nam. ERIA Research Project Report No. 21. ERIA: Jakarta.
Avila, N., Kittner, N. Shirley, R, and Kammen, D. M. (2018) 'Beyond the Battery: Power
Expansion Alternatives for Economic Resilience and Diversity in Laos". unpublished report.
Aye, M.N. (2017), ‘JICA Updates 2040 Plan for Yangon Development’, The Myanmar Times.
January 2017.
Aye, M.P. (2015), ‘Deliverable Report for MECON Project Task 1.2 Baseline Energy Consumption
of MECON Household in Myanmar’. Retrieved from http://www.meconproject.com/wp-
content/uploads/report/[Task 1.2-Energy baseline] Myanmar country report.pdf (accessed
3 August 2017).
Azuela, G.E., L. Barroso, A. Khana, Z. Wang, Y. Wu, and G. Cunha (2014), ‘Performance of
Renewable Energy Auctions’. Policy Research Working Paper No. 7062.
Balch, O. (2016), ‘Off-grid Solar to Help Myanmar Bring Electricity to All by 2030, The Guardian.
December 2016.
Barany, Z. (2018), ‘Where Myanmar Went Wrong’, Foreign Affairs, 97(May/June), pp. 141–154.
Retrieved from https://www.foreignaffairs.com/articles/burma-myanmar/2018-04-
16/where-myanmar-went-wrong.

99
Beetz, B. (2018), ‘The Weekend Read: Myanmar’s Solar Lifeline’, Pv Magazine International.
January 2018.
Bhattacharyya, S.C. (2013), ‘To Regulate or Not to Regulate Off-grid Electricity Access in
Developing Countries’, Energy Policy, 63, pp. 494–503.
https://doi.org/10.1016/j.enpol.2013.08.028.
Billen, D. (2016), ‘Electrifying Myanmar’s Power Grids’, The Myanmar Times. August 2016.
Blum, N.U., R.S. Wakeling, and T.S. Schmidt (2013), ‘Rural Electrification Through Village Grids –
Assessing the Cost Competitiveness of Isolated Renewable Energy Technologies in
Indonesia’, Renewable and Sustainable Energy Reviews, 22, pp. 482–496.
https://doi.org/10.1016/j.rser.2013.01.049 .
BNEF (2017a), 2Q 2017 Frontier Power Market Outlook Micro-grids on the Horizon. New York,
NY: Bloomberg New Energy Finance.
BNEF (2017b), New Energy Outlook 2017. New York, NY: Bloomberg New Energy Finance.
Burma Partnership (2011),‘Save Irrawaddy, No Dam on Burma’s Vital River: Protest At the
Chinese Consulate’, 14 September. Retrieved from
http://www.burmapartnership.org/tag/save-the-irrawaddy/
Burma Rivers Network. http://www.burmariversnetwork.org
Burma Rivers Network. (2009), ‘Memorandum of Agreement on N'Mai/Mali/Irrawaddy Dams
Signed’, 21 June. Retrieved from http://burmariversnetwork.org/news/memorandum-of-
agreement-on-nmaimaliirrawaddy-dams-signed.html
Castalia Strategic Advisors (2014), ‘Myanmar National Electrification Program (NEP) Roadmap
and Investment Prospectus’. Draft Final.
Chen, W. M., H. Kim, and H. Yamaguchi (2014), ‘Renewable Energy in Eastern Asia: Renewable
Energy Policy Review and Comparative SWOT Analysis for Promoting Renewable Energy in
Japan, South Korea, and Taiwan’, Energy Policy, 74(C), pp. 319–329.
https://doi.org/10.1016/j.enpol.2014.08.019.
Chern, K.W. (2017), ‘Tariffs and Policies: The Crux of Myanmar’s Power Problem’, The Myanmar
Times. August 2017.
Chern, K. W., H. Shine, and Ko, T. K. (2018), ‘Infrastructure, Safety Standards Needed for LPG
Industry to Take Off’, The Myanmar Times. May 2018.
Cochrane, L. (2017), ‘How the Military Still Controls Myanmar, not Aung San Suu Kyi’, ABC
News. September 2017.
Comello, S.D., S.J. Reichelstein, A. Sahoo, and T.S. Schmidt (2017), ‘Enabling Mini-Grid
Development in Rural India. World Development, 93, pp. 94–107’. In
https://doi.org/10.1016/j.worlddev.2016.12.029.
Control Risks (2017), ‘Myanmar: Facing Up to Bureaucratic Bribery’, Forbes. August 2017.

100
Council of the European Union (2013), ‘Council Decision 2013/184/CFSP on 22 April 2013
Concerning Restrictive Measures Against Myanmar/Burma and Repealing Decision
2010/232/CFSP’, Official Journal of the European Union, (111), pp. 75–76.
Dave Grace and Associates (2016), ‘Myanmar Microfinance Regulatory Benchmarking Survey’.
Retrieved from http://mekongbiz.org/wp-content/uploads/2017/02/ADB-MBI-MF-
Benchmarking-Survey-10-Oct16-final-proof-DG-AB.pdf (accessed 15 Apr. 2018)
Del Barrio–Alvarez, D., and M. Sugiyama (2018), ‘Toward a Sustainable Electricity Policy in
Myanmar: Recommendations for Policy Makers and Development Partners’. PARI Policy
brief in March 2018. Tokyo, Japan.
Del Río, P., and P. Linares (2014), ‘Back to the Future? Rethinking Auctions for Renewable
Electricity Support’, Renewable and Sustainable Energy Reviews, 35, pp. 42–56. In
https://doi.org/10.1016/j.rser.2014.03.039.
Denruyter, J.P. (2016), ‘Myanmar’s Electricity Vision Updating National Master Electrification
Plan’. Retrieved from https://spectrumsdkn.org/en/home/other-sectors/energy/385-
myanmar-s-electricity-vision/file (accessed 30 June 2018)
Denruyter, J.P. (2016), ‘Alternative Vision for Myanmar’s Power Sector Towards full Renewable
Electricity by 2050’. World Wildlife Fund (WWF). Retrieved from
https://d2ouvy59p0dg6k.cloudfront.net/downloads/alternative_vision_for_myanmar_s_p
ower_sector_draft.pdf (accessed 30 June 2018).
Depierreux, F., E. Shumway, and F. Sparavier (2017), Impacts of Introducing Wind and Solar PV
on the Myanmar Grid. Retrieved from
https://events.pennwell.com/PGA2017/Public/SessionDetails.aspx?FromPage=Sessions.as
px&SessionID=19403
Djordjevic, M. (2017), ‘Myanmar: Sunlabob Renewable Energy Commissions 92.6 kWp Rooftop
Solar’, Pv Magazine International. July 2017.
Dobermann, T. (2016), Energy in Myanmar. International Growth Centre (IGC). Retrieved from
https://www.theigc.org/wp-content/uploads/2016/04/Dobermann-2016-1.pdf (accessed
20 November 2017).
Dobrotkova, Z., K. Surana, and P. Audinet (2018), ‘The Price of Solar Energy: Comparing
Competitive Auctions for Utility-Scale Solar PV in Developing Countries’, Energy Policy,
118, pp. 133–148. June 2017. https://doi.org/10.1016/j.enpol.2018.03.036.
Eleven. (2018), ‘Myanmar Uses About 6,500 Tons of LPG Monthly’, Eleven Myanmar. February
2018.
Emmerton, M., S. Thorncraft, S. Oksanen, M. Soe, K.K. Hlaing, Y.Y. Thein, and M. Khin (2015),
Myanmar Energy Master Plan. December 2015.
European Commission (2005), Strengths, Weaknesses, Opportunities and Threats in Energy
Research. Belgium: European Communities. Retrieved from
https://ec.europa.eu/research/energy/pdf/swot_en.pdf (accessed 30 Jun. 2018)

101
Executive Order No. 13742 v.81 no.197 p.70593 (2016), ‘Termination of Emergency with
Respect to the Actions and Policies of the Government of Burma’.
Fairhurst, S. (2016), ‘New Trends in the South East Asia Power Industry and Key Implications for
Myanmar in the Short and Long-term’, The Lantau Group. Retrieved from
http://www.lantaugroup.com/files/ppt_sea16_sf.pdf (accessed 15 Feb. 2018).
Food and Agriculture Organization (FAO) (2018), Myanmar at a Glance. Retrieved from
http://www.fao.org/myanmar/fao-in-myanmar/myanmar/en/ (accessed 14 Apr. 2018).
Ferrie, J. (2014), ‘Corruption the Biggest Concern for Myanmar Businesses: Survey’, Reuters.
May 2014.
FMR Research and Advisory (2018), ‘No Immediate Plans for Tariff Increase: Ministry (No. 11–
17 May 2018). Myanmar Energy Monitor.
Frontier Myanmar Research Ltd. (2018), Second Batch of NEP Mini-Grid Proposals Finalised.
Retrieved, from http://energy.frontiermyanmar.com/news/power-and-electricity/second-
batch-nep-mini-grid-proposals-finalised (accessed 27 April 2018).
Garzanti, E., J.G. Wang, G. Vezzoli, and M. Limonta (2016), ‘Tracing Provenance and Sediment
Fluxes in the Irrawaddy River Basin (Myanmar)’, Chemical Geology, 440, pp. 73–90.
Retrieved from https://doi.org/10.1016/j.chemgeo.2016.06.010.
GEI. http://www.geichina.org/en/
Gershenson, D., M. Tilleard, J. Cusack, D. Cooper, A. Monk, and D. Kammen (2015), Increasing
Private Capital Investment into Energy Access: The Case for Mini-grid Pooling Facilities.
Retrieved from https://gpc.stanford.edu/sites/default/files/unep.pdf (accessed 10 Nov.
2017).
Gilmore, S., and G. Robinson (2017), ‘Myanmar Moves to Stave Off Credit Crunch’, Nikkei Asian
Review. Retrieved from https://asia.nikkei.com/Economy/Myanmar-moves-to-stave-off-
credit-crunch2 (accessed 24 September 2017).
GIZ. (2017), ‘Banking and Financial Sector Development’. Retrieved from
https://www.giz.de/en/worldwide/17772.html (accessed 29 May 2018).
Greacen, C. (2015), ‘DRD Solar Home Systems (SHS )’ in Myanmar : Status and
Recommendations. Retrieved from
https://palangthai.files.wordpress.com/2013/04/assessment-of-drd-shs-myanmar-
greacen-final.docx (accessed 10 Aug. 2016)
Greacen, C. (2017a), ‘Myanmar Mini-Grid Overview’. Retrieved from
https://www.esmap.org/sites/default/files/Greacen ESMAP Myanmar minigrid
situation_Optimized.pdf
Greacen, C. (2017b), Role of Mini-grids for Electrification in Myanmar – SWOT Analysis and
Roadmap for Scale up. Washington, DC: World Bank. Retrieved from
https://energypedia.info/images/e/ed/20160530_Minigrids_in_Myanmar_-

102
_SWOT_and_roadmap_for_scaleup.pdf (accessed 15 Feb. 2017).
Greacen, C. (2018), ‘Discussion of Grid-Connected Small Scale Electrical Power Enterprise
Regulations’, Nay Pyi Taw. Retrieved from
https://palangthai.files.wordpress.com/2018/03/180308-dp-priv-union-regulatory-
framework-mini-grids.pptx (accessed 15 Feb. 2017).
Hadka, D., and P. Reed (2012), ‘Borg: An Auto-Adaptive Many-Objective Evolutionary
Computing Framework’, Evolutionary Computation, 21(2), pp. 231–259.
https://doi.org/10.1162/EVCO_a_00075 (accessed 30 June 2018).
Hammond, C. (2016), ‘Andaman Explores Solar in Sagaing’, The Myanmar Times. March 2016.
Han, N.B. (2017), ‘Fate of Thai-Kayin Coal Plant Project Hinges on Assessment’, The Myanmar
Times. December 2017.
Han, N.B. (2018), ‘Kayin Residents Fear Coal Plant May Go Ahead’, The Myanmar Times. April
2018.
Hasan, F. (2018), ‘Off-grid Investments : Financing & Funding In Focus’, ARE Newsletter. April
2018. Retrieved from https://www.ruralelec.org/newsletter/are-newsletter-april-2018-
grid-investments-financing-funding#guest-editorial-1638 (accessed 26 April 2018).
HOPPECKE Batterien GmbH & Co. KG. (2016), ‘Battery Specification’. In
http://sun.hoppecke.com/fileadmin/_sun/download/WR_Charge_settings_EN.pdf
(accessed 7 November 2017).
Htoon, K.L. (2018), ‘LPG: Bright Prospects but Growth Constraints’, Frontier Myanmar. May
2018.
Htwe, C.M. (2017a), ‘Government Currently Subsidising Electricity Bill’, The Myanmar Times.
March 2017.
Htwe, C.M. (2017), ‘Thai-Kayin Coal Plant Project Against the Law: Former Hluttaw MP’, The
Myanmar Times. October 2017.
Hulst, H. (2015), ‘The Pitfalls of a Landslide NLD Victory’, Frontier Myanmar. November 2015.
Hunter, L., Y. Ojima, Y. Wu, and, R. Badian-Magnusson (2018), Myanmar Selected Issues,
Country Report No. 18/91.
International Energy Agency (IEA) (2016), WEO 2016 Electricity access database. Retrieved
from
http://www.worldenergyoutlook.org/resources/energydevelopment/energyaccessdatabase/
(accessed 15 Sep. 2017).
IEA (2017a), Energy Access Outlook 2017: From Poverty to Prosperity. Paris. Retrieved from
https://www.iea.org/publications/freepublications/publication/WEO2017SpecialReport
_EnergyAccessOutlook.pdf (accessed 29 Oct. 2017).
IEA (2017b), Renewables 2017: Analysis and Forecasts to 2022.

103
https://doi.org/10.1787/re_mar-2017-en (accessed 14 Oct. 2017).
IEA. (2017c), World Energy Outlook 2017 Executive Summary. Paris. In
https://www.iea.org/publications/freepublications/publication/WEO_2017_Executive_Summa
ry_English_version.pdf (accessed 1 Dec. 2017).
___International Energy Agency and Nuclear Energy Agency (IEA and NEA) (2015), Projected
Costs of Generating Electricity 2015 Edition. Paris.
https://doi.org/10.1787/cost_electricity-2015-en (accessed 25 May 2016).
___International Finance Corporation (IFC) (2018), ‘Strategic Environmental Assessment of the
Hydropower Sector in Myanmar’ (draft final report for stakeholder review). Washington.
DC: IFC.
___International Renewable Energy Agency (IRENA) (2016), Innovation Outlook: Renewable
Mini-Grids. Abu Dhabi. Retrieved from http://www.irena.org/-
/media/Files/IRENA/Agency/Publication/2016/IRENA_Innovation_Outlook_Minigrids_201
6.pdf (accessed 30 Apr. 2017).
IRENA (2017), Electricity Storage and Renewables: Costs and Markets to 2030. Abu Dhabi.
Retrieved from http://www.irena.org/-
/media/Files/IRENA/Agency/Publication/2017/Oct/IRENA_Electricity_Storage_Costs_2017
_Summary.pdf?la=en&hash=2FDC44939920F8D2BA29CB762C607BC9E882D4E9 (accessed
1 Nov. 2017)
IRENA and ACE (2016), Renewable Energy Outlook for ASEAN. Abu Dhabi, Jakarta. Retrieved
from http://www.irena.org/-
/media/Files/IRENA/Agency/Publication/2016/IRENA_REmap_ASEAN_2016_report.pdf
International Rivers (2013a), China Overseas Dams List. Retrieved from
https://www.internationalrivers.org/sites/default/files/attached-
files/public_chineseoverseasdams_december2013.xls
International Rivers (2013b), ‘Beijing Sends a Signal to Chinese Overseas Dam Builders’, (23
April 2013) Retrieved from https://www.internationalrivers.org/blogs/262/beijing-sends-
a-signal-to-chinese-overseas-dam-builders
Japan International Cooperation Agency (JICA) (2015), Data Collection Survey on Capacity
Development of Power Sector Development Planning in the Republic of the Union of
Myanmar.
Japan International Cooperation Agency and Yangon City Development Committee (ICA and
YCDC) (2014), A Strategic Urban Development Plan of Greater Yangon – Final Report II.
Retrieved from http://open_jicareport.jica.go.jp/pdf/12145967.pdf (accessed 17 Apr
2017)
Kean, T. (2017), ‘The Ministry Needs to Move Fast to Keep the Lights On’, Frontier Myanmar. In
http://www.frontiermyanmar.net/en/the-ministry-needs-to-move-fast-to-keep-the-lights-
on (accessed12 July 2017).

104
Kean, T. (2018a), ‘Myanmar Bets on Huge LNG Projects to Meet Power Needs’, Frontier
Myanmar. January 2018.
Kean, T. (2018b), ‘Does Myanmar’s LNG Power Plan Stack Up?’ Frontier Myanmar. February
2018.
Khandelwal, A.K., and M. Teachout (2016), Special Economic Zones for Myanmar. Retrieved
from https://www.theigc.org/wp-content/uploads/2016/03/SEZs-in-Myanmar.pdf
(accessed 30 June 2018).
Khin, P.T.H. (2017), ‘Ministry Announces Electricity Price Hike’, The Irrawaddy. May 2017.
Kim, H., and T.Y. Jung (2018), ‘Independent Solar Photovoltaic with Energy Storage Systems
(ESS) for Rural Electrification in Myanmar’. In https://doi.org/10.1016/j.rser.2017.09.037.
Kittner, N., H. Dimco, V. Azemi, E. Tairyan, and D.M. Kammen (2016), ‘An Analytic Framework to
Assess Future Electricity Options in Kosovo’, Environmental Research Letters, 11(10),
104013. In https://doi.org/10.1088/1748-9326/11/10/104013.
Kittner, N., S.H. Gheewala, and D.M. Kammen (2016), ‘Energy Return on Investment (EROI) of
Mini-hydro and Solar PV Systems Designed for a Mini-grid’, Renewable Energy, 99, pp.
410–419. https://doi.org/10.1016/j.renene.2016.07.023.
Kittner, N., F. Lill, and D.M. Kammen (2017), ‘Energy Storage Deployment and Innovation for
the Clean Energy Transition’, Nature Energy, 2(July), 17125.
https://doi.org/10.1038/nenergy.2017.125.
Kittner, N., and K. Yamaguchi (2017), ‘Hydropower Threatens Peace in Myanmar – but it
doesn’t have to’, Nikkei Asian Review. Nikkei Asian Review. March 2017.
Ko, T.K. (2018), ‘Yangon’s “New City” Authority to Publicise Project Documents in Bid to
Improve Transparency’, The Myanmar Times. May 2018.
Kobayakawa, T., and T.C. Kandpal (2014), ‘Photovoltaic Micro-grid in a Remote Village in India:
Survey Based Identification of Socio-economic and Other Characteristics Affecting
Connectivity with Micro-grid’, Energy for Sustainable Development, 18(1), pp. 28–35.
https://doi.org/10.1016/j.esd.2013.11.002
Kondolf, G. M., Rubin, Z. K., and J.T. Minear (2014), ‘Dams on the Mekong: Cumulative
Sediment Starvation’, Water Resources Research, 50(6), pp. 5158–5169. In
https://doi.org/10.1002/2013WR014651
Kruger, W., and A. Eberhard (2018), ‘Renewable Energy Auctions in Sub-Saharan Africa:
Comparing the South African, Ugandan, and Zambian Programs’, Wiley Interdisciplinary
Reviews: Energy and Environment, (May 2017), pp. 1–13. In
https://doi.org/10.1002/wene.295.
Kyaw, K. (2018), ‘Myanmar Cooks Up LPG Expansion Plan’, The Nation, March 2018.
Kyaw, M.M. (2017), ‘Power Development Opportunities in Myanmar. Myanmar Investment
Forum 2017’. Nay Pyi Taw.

105
http://www.myanmarinvestmentforum2017.com/themes/demo/assets/download/Power
Development Oppourtunites in Myanmar.pdf (accessed 30 June 2018).
Kyi, T. (2016), Overview of Agriculture Policy in Myanmar. Retrieved from
http://ap.fftc.agnet.org/ap_db.php?id=622 (accessed 30 June 2018).
Lazard (2014), Lazard’s Levelized Cost of Energy Analysis – version 8.0. Retrieved from
https://www.lazard.com/media/1777/levelized_cost_of_energy_-_version_80.pdf
(accessed 15 July 2017).
Lazard (2017), Lazard’s Levelized Cost of Storage Analysis – Version 3.0. Retrieved from
https://www.lazard.com/media/450338/lazard-levelized-cost-of-storage-version-30.pdf
(accessed 15 Dec. 2017).
Lee, Y., and M. Zaharia (2017), ‘Rohingya Crisis Dents Myanmar Hopes of Western Investment
Boom’, Reuters. September 2017.
Lewis, S., and S. Naing (2017), ‘Big Dams Can Wait, Myanmar Overhauls Energy Strategy’,
Reuters. November 2017.
Liu, D., K. Yamaguchi, and H. Yoshikawa (2017), ‘Understanding the Motivations Behind the
Myanmar-China Energy Pipeline: Multiple Streams and Energy Politics in China’, Energy
Policy, 107(April), pp. 403–412. In https://doi.org/10.1016/j.enpol.2017.05.005.
Loftus, P. (2016), ‘The Key to Jumpstarting Myanmar’s Economy: Electricity’, The Diplomat.
August 2016.
Lupu, A.G., A. Dumencu, M.V. Atanasiu, C.E. Panaite, G. Dumitracu, and A. Popescu (2016),
‘SWOT Analysis of the Renewable Energy Sources in Romania - Case Study: Solar Energy,’
IOP Conference Series. Materials Science and Engineering, 147(1). In
https://doi.org/10.1088/1757-899X/147/1/012138
Luthra, S., S. Kumar, D. Garg, and A. Haleem (2015), ‘Barriers to Renewable/Sustainable Energy
Technologies Adoption: Indian Perspective’, Renewable and Sustainable Energy Reviews,
41, pp. 762–776. In https://doi.org/10.1016/j.rser.2014.08.077.
Lwin, S. (2015), ‘Singapore Leads as Foreign Investment in Myanmar Doubles’, The Myanmar
Times. April 2015.
Lynn, N.H. (2017a), ‘Minister for Construction Takes Charge of Energy, Electricity Portfolios’,
Frontier Myanmar. July 2017.
Lynn, N. H. (2017b), ‘Electricity Price Rises Coming Soon, Says Ministry’, Frontier Myanmar.
October 2017.
Mark, E. (2018), ‘Myanmar’s Challenging Path to Peace’, The Diplomat. February 2018.
Markovska, N., V. Taseska, and J. Pop-Jordanov (2009), ‘SWOT Analyses of the National Energy
Sector for Sustainable Energy Development’, Energy, 34(6), pp. 752–756.
https://doi.org/10.1016/j.energy.2009.02.006.

106
Matsui, M. (2017a), ‘Myanmar’s Great Infrastructure Race Kicks Off’, Nikkei Asian Review.
January 2017.
Matsui, M. (2017b), ‘Myanmar Manufacturing Set for Takeoff’, Nikkei Asian Review. January
2017.
McCarthy, S. (2018), ‘Rule of Law Expedited: Land Title Reform and Justice in Burma
(Myanmar)’, Asian Studies Review, 7823, pp. 1–18.
https://doi.org/10.1080/10357823.2018.1444731
Mclaughlin, T. (2016), ‘Suu Kyi’s State Counselor Bill Passes Vote Despite Military Protest’,
Reuters. April 2016.
Ministry of Electricity and Energy Myanmar (2018), ‘NEP Plan’.
http://www.moee.gov.mm/en/ignite/page/80 (accessed 20 April 2018).
Ministry of Immigration and Population (2015), The 2014 Myanmar Population and Housing
Census – The Union Report (Vol. 3).
Mon, S.M. (2018a), ‘Divisions Harden Over Coal Power Plant in Kayin State’, Frontier Myanmar.
January 2018.
Mon, S.M. (2018b), ‘Power Games Over Kayin Coal-Fired Plant’, Frontier Myanmar. April 2018.
Mon, Y., and Aye, M.N. (2016), ‘Yangon Region to Get Second Special Economic Zone’, The
Myanmar Times. December 2016.
Mora, D., M. Islam, E.R. Soysal, L. Kitzing, A.L.A. Blanco, S. Forster, and F. Wigand (2017),
‘Experiences with Auctions for Renewable Energy Support’. International Conference on
the European Energy Market. In https://doi.org/10.1109/EEM.2017.7981922 (accessed 1
June 2018).
Myanmar Ministry of Planning and Finance, and World Bank (2017), An Analysis of Poverty in
Myanmar 02 Poverty Profile. _Nay Pyi Taw, Washington, DC: The World Bank.
http://documents.worldbank.org/curated/en/829581512375610375/pdf/121822-WP-
PovertyPartENGFinalHighRes-PUBLIC.pdf (accessed 28 Feb. 2018).
Myint, S.A. (2016), ‘The Government’s Next Big Challenge: Combatting Corruption’, Frontier
Myanmar. August 2016.
Myint, S.A. (2017a), ‘Kayin Chief Minister Offers Powerful Reasons for a Coal-fired Electricity
Plant’, Frontier Myanmar. July 2017.
Myint, S.A. (2017b), ‘Will Land Seized by the Military Ever Be Returned?’ Frontier Myanmar.
September 2017.
Naing, S. (2017), ‘Myanmar Makes Small Gains in Annual Corruption Index Under NLD Govt’,
The Myanmar Times. January 2017.
Naing, S., Y. Lee, and S.N. Yimou Lee (2017), ‘Coal Plan Sparks Ire as Myanmar Struggles to Keep
Lights On’, Reuters. July 2017.

107
Nam, K., M.R. Cham, and P.R. Halili (2015), ‘Power Sector Development in Myanmar’. ADB
economics working paper series No. 460. http://www.adb.org/publications/power-sector-
development-myanmar (accessed 15 Jul. 2017).
Nang, S., and R.C. Paddock (2018), ‘Myanmar Picks a New President, but He’ll Still Be No. 2’,
The New York Times. March 2018.
Nemet, G.F. (2006), ‘Beyond the Learning Curve: Factors Influencing Cost Reductions in
Photovoltaics’, Energy Policy, 34(17), pp. 3218–3232.
https://doi.org/10.1016/j.enpol.2005.06.020.
Nyein, N. (2017a), ‘Karen State Chief Minister: ‘Our State Needs Electricity: Coal Could Be The
Answer’, The Irrawaddy. March 2017.
Nyein, N. (2017b), ‘As the World Moves to Renewable Energy, Myanmar Will Follow’, The
Irrawaddy. July 2017.
Nyein, N. (2018), ‘Third Session of Panglong Peace Conference Pushed Back to May’, The
Irrawaddy. March 2018.
Oberndorf, R., S. Thein, and T.Z. Oo (2017), ‘Developing the National Land Use Policy in
Myanmar: The Importance of Inclusive Public Consultations and Close Donor
Coordination’. In 2017 World Bank Conference on Land and Poverty. Washington, DC.
Organisation for Economic Co-operation and Development (OECD) (2014), Myanmar OECD
Investment Policy Reviews.
Off-Grid Europe Gmbh (2017), ‘Hoppecke Opzv Gel Solar. Power 48v 47kw Battery Bank’.
http://www.off-grid-europe.com/batteries/gel-lead-acid/hoppecke/hoppecke-opzv-gel-
solar-power-48v-47kw-battery-bank-816 (accessed 7 November 2017).
Ono, Y. (2017), ‘How Microfinance Can Help Myanmar Meet Its Major Funding Needs’, Nikkei
Asian Review. https://asia.nikkei.com/Business/Banking-Finance/How-microfinance-can-
help-Myanmar-meet-its-major-funding-needs (accessed 30 April 2017).
Oo, T.L. (2017), ‘Role of Renewable Energy in Power Development Plan in Myanmar. Nay Pyi
Taw.
Open Development Mekong (2014), ‘Greater Mekong Subregion Hydropower Dams’. Retrieved
from https://opendevelopmentmekong.net/topics/hydropower/ (accessed 1 Jun. 2018)
Opperman, J.J., G. Grill, and J. Hartmann (2015), ‘The Power of Rivers: Finding Balance
Between Energy and Conservation in Hydropower Development’. The Nature Conservancy.
Washington, DC: The Nature Conservancy.
Oxford Burma Alliance (n.d.), ‘Ethnic Nationalities of Burma’. Retrieved from
http://www.oxfordburmaalliance.org/ethnic-groups.html (accessed 1 Jun. 2018)
Oxford Business Group (2016), ‘Myanmar Working to Meet the Demand for Power’, In The
Report: Myanmar 2016. Retrieved from
https://oxfordbusinessgroup.com/overview/balanced-rollout-meeting-demand-power-

108
must-go-hand-hand-adapting-new-political-environment (accessed 1 June 2018)
Painuly, J.P. (2001), ‘Barriers to Renewable Energy Penetration: A Framework for Analysis’,
Renewable Energy, 24(1), pp. 73–89. https://doi.org/10.1016/S0960-1481(00)00186-5.
Palit, D., and A. Chaurey (2011), ‘Off-Grid Rural Electrification Experiences from South Asia’,
Green Energy and Technology, 15, pp. 266–276. https://doi.org/10.1007/978-1-4471-
4673-5_4.
Paliwal, R. (2006), ‘EIA Practice in India and Its Evaluation Using SWOT Analysis’, Environmental
Impact Assessment Review, 26(5), pp. 492–510.
https://doi.org/10.1016/j.eiar.2006.01.004.
Pawel, I. (2014), ‘The Cost of Storage - How to Calculate the Levelized Cost of Stored Energy
(LCOE) and Applications to Renewable Energy Generation’, Energy Procedia,
46(December), pp. 68–77. https://doi.org/10.1016/j.egypro.2014.01.159.
Pawletko, P. (2018), ‘Introduction to Draft Regulatory Framework for Isolated and Grid-
connected Small Scale Electric Power Enterprises’. Nay Pyi Taw.
Peel, M. (2017), ‘Myanmar: The Military-Commercial Complex’, Financial Times. February 2017.
People’s Daily Online (2005), ‘Hu Jintao huijian miandian heping yu fazhan weiyuanhui zhuxi
Danrui’ [Hu Jintao met with Than Shwe, Chairman of the State Peace and Development
Council, Myanmar (in Chinese) People’s Daily Online. April 2005.
Eleven (2018), ‘Myanmar Uses About 6,500 Tons of LPG Monthly’, Eleven Myanmar. February
2018.
Petrova, V. (2014), ‘Thai GEP Finalises Govt Deal for 220-MW Solar Park in Myanmar’,
Renewables Now. October 2014.
Phyo, P.T. (2014), ‘Regulatory Sun Shining on Large Solar Project’, The Myanmar Times. October
2014.
Phyo, P.T. (2017), ‘No More Coal Mining Licences Due to Harmful Health Effects, Says Union
Minister’, The Myanmar Times. February 2017.
Pickton, D.W., and S. Wright (1998), ‘What’s SWOT in Strategic Analysis?’ Strategic Change,
7(2), pp. 101–109. https://doi.org/10.1002/(SICI)1099-1697(199803/04)7:2<101::AID-
JSC332>3.0.CO;2-6 .
Pyidaungsu Hluttaw (2014), Electricity Law, Republic of the Union of Myanmar.
Pun, S. (2016), ‘For Investors, Opportunity Knocks in Myanmar’, Frontier Myanmar. February
2016.
Pwint, N.L.H. (2018), ‘Third Session of Panglong Peace Conference Delayed Until February’, The
Irrawaddy. January 2018.
Rab, H.N., S. Zorya, A. Jain, R.C. Badiani–Magnusson, S. Rahardja, M.T. Zin, and M.D.A. Kessler
(2016), Myanmar Economic Monitor : Anchoring Economic Expectations (English).
109
Washington, D.C.
http://documents.worldbank.org/curated/en/271301485510327677/pdf/112317-
REVISED-PUBLIC-021618-WP-MEM-Jan27-17-final-PUBLIC.pdf (accessed 1 June 2018).
Rajan, K. (2017), Myanmar and the Rohingya: Reputational Risks’, IHS Markit, 14 September.
Rieffel, L. (2016), ‘Aung San Suu Kyi’s New Government: What to Look for in Myanmar’,
Brookings. March.
Ross, R.P. (2015), Myanmar’s Path to Electrification the Role of Distributed Energy Systems (Vol.
2). http://www.sun-connect-
news.org/fileadmin/DATEIEN/Dateien/New/Ross_MyanmarPathElectrification.pdf
(accessed 30 March 2018).
Sasaki, H., M. Seino, N. Hashimoto, and I. Sakata (2015), Off-Grid Electrification Scenarios for
Rural Electrification in Myanmar. Dubrovnic, Croatia: Sustainable Development of Energy,
Water and Environment Systems (SDEWES2015).
Schmidt–Reindahl, J. (2018), ‘Discussion of Isolated Small Scale Electrical Power Enterprise
Regulations’, Nay Pyi Taw. https://palangthai.files.wordpress.com/2018/03/180308_state-
regulations.pptx (accessed 2 April 2018).
Schmidt, O., A. Hawkes, A. Gambhir, and I. Staffell (2017), ‘The Future Cost of Electrical Energy
Storage Based on Experience Rates’, Nature Energy, 6(July), 17110.
https://doi.org/10.1038/nenergy.2017.110.
Schmidt, T.S., N.U. Blum, and R.S. Wakeling (2013), ‘Attracting Private Investments into Rural
Electrification – A Case Study on Renewable Energy Based Village Grids in Indonesia’,
Energy for Sustainable Development, 17(6), pp. 581–595.
https://doi.org/10.1016/j.esd.2013.10.001.
Schmitt, R.J.P., S. Bizzi, A. Castelletti, and G.M. Kondolf (2018), ‘Improved Trade-offs of
Hydropower and Sand Connectivity by Strategic Dam Planning in the Mekong’, Nature
Sustainability, 1, pp. 96–104. https://doi.org/10.1038/s41893-018-0022-3.
Schmitt, R.J.P.P., S. Bizzi, A.F. Castelletti, and G.M. Kondolf (2018), ‘Stochastic Modeling of
Sediment Connectivity for Reconstructing Sand Fluxes and Origins in the Unmonitored Se
Kong, Se San, and Sre Pok Tributaries of the Mekong River’, Journal of Geophysical
Research: Earth Surface, 123(1), pp. 2–25. https://doi.org/10.1002/2016JF004105.
Schnitzer, D., D.S. Lounsbury, J.P. Carvallo, R. Deshmukh, J. Apt, and D.M. Kammen (2014),
Microgrids for Rural Electrification. United Nations Foundation.
Shao, Y., and H. Fan (2005), Zhongmian jianjiao qianhou liangguo jingmao guanxi shulun [On
Sino-Burmese Economic and Trade Relationship around the Establishment of Their
Diplomatic Relations]. Southeast Asian Affairs, 4, pp. 77–84.
Shee, P. K. (2005), ‘Sino-Burmese Political and Economic Relations: Strategic and Economic
Dimensions’, Southeast Asian Affairs, 1, pp. 33–45.
110
Shi, X. (2016), ‘The Future of ASEAN Energy Mix: A SWOT Analysis’, Renewable and Sustainable
Energy Reviews, 53, pp. 672–680. https://doi.org/10.1016/j.rser.2015.09.010.
Shine, H., and T.K. Ko (2018), ‘Yangon Works with China to Lay Down Development Plan for
New City Project’, The Myanmar Times. May 2018.
Shumkov, I. (2018), ‘Scan Inter to Buy into 170-MW Solar Project in Myanmar’, Renewables
Now. May 2018.
Siala, K., and J. Stich (2016), ‘Estimation of the PV Potential in ASEAN with a High Spatial and
Temporal Resolution’, Renewable Energy, 88, pp. 445–456.
https://doi.org/10.1016/j.renene.2015.11.061.
Simpson, A., S. Park, A. Simpson, and S. Park (2013), ‘The Asian Development Bank as a Global
Risk Regulator in Myanmar’, Third World Quarterly, 34(10), pp. 1858–1871.
https://doi.org/Doi 10.1080/01436597.2013.851911 .
Skat (2017), ‘Mini-Grid Technologies’. https://energypedia.info/images/a/ad/Mini-
grid_Technology_Comparison.pdf (accessed 11 May 2017).
Soe, H.K. (2018), ‘Legal Reforms to Support Myanmar’s Anti-Corruption Battle’, Frontier
Myanmar. January 2018.
Sohu News (2006), ‘Wen Jiabao huijian miandian zongli xiwang nengyuan deng hezuo jinzao
qude chengguo’ [Wen Jiabao Meets with Myanmar Prime Minister and Hopes that Energy
and Other Cooperation will achieve results as soon as possible (in Chinese)]. (February
2006). Retrieved 13 September 2018, from:
http://news.sohu.com/20060215/n241831012.shtml
Soimu, O. (2014), ‘A SWOT Analysis of Bio-energy Production in Republic of Moldova’, Procedia
- Social and Behavioral Sciences, 149, pp. 896–900.
https://doi.org/10.1016/j.sbspro.2014.08.277 .
Sovacool, B.K., A. Gilbert, and D. Nugent (2014), ‘An International Comparative Assessment of
Construction Cost Overruns for Electricity Infrastructure’, Energy Research and Social
Science, 3(C), pp. 152–160. https://doi.org/10.1016/j.erss.2014.07.016.
Start, D., and I. Hovland (2004), Tools for Policy Impact: Research and Policy in Development
(rapid). Retrieved from
http://web.worldbank.org/archive/website01031/WEB/IMAGES/TOOLS_HA.PDF
(accessed 1 June 2018).
Suri, M., T. Cebecauer, N. Suriova, B. Schnierer, J. Betak, V. Madlenakova, and M. Caltik (2017),
Solar Resource and Photovoltaic Power Potential of Myanmar (English). (Energy Sector
Management Assistance Program, Ed.). Washington, DC: World Bank Group.
Sustainable Engineering Lab (2014), Myanmar National Electrification Plan (NEP): Least-Cost
Geospatial Electrification Planning Results. New York: Earth Institute, Columbia University.
Swe Mon Aung (2018), Burma – Union of Grain and Feed Annual 2018 Annual Report.

111
Washington DC. In http://gain.fas.usda.gov/Recent GAIN Publications/Grain and Feed
Annual_Rangoon_Burma - Union of_4-28-2015.pdf (accessed 30 March 2018).
Takahashi, A. (2000), ‘Gendai Myanmar no Noson-Keizai: Iko-Keizai-ka no Nomin to Hi-Nomin
(in Japanese) [Myanmar’s Village Economy in Transition: Peasants’ Lives under the Market-
Oriented Economy]. Tokyo: University of Tokyo Press.
Takahashi, A. (2018), Sosei no Myanmar (in Japanese). Tokyo: Akashi Shoten.
Tenenbaum, B., C. Greacen, T. Siyambalapitiya, and J. Knuckles (2014), From the Bottom Up.
World Bank. In https://doi.org/10.1596/978-1-4648-0093-1 (accessed 30 Sep. 2016).
Terrados, J., G. Almonacid, and L. Hontoria (2007), ‘Regional Energy Planning Through SWOT
Analysis and Strategic Planning Tools’ Impact on Renewables Development’, Renewable
and Sustainable Energy Reviews, 11(6), pp. 1275–1287.
https://doi.org/10.1016/j.rser.2005.08.003.
Tha, K.P. (2018), ‘Govt Reveals 4 Mega Development Projects’, The Irrawaddy. May 2018.
Thant Myint-U. (2008), The River Of Lost Footsteps : A Personal History of Burma. Farrar, Straus
and Giroux.
Thar, C. (2018), ‘China Urges Northern Alliance to Attend Panglong conference’, The Myanmar
Times. May 2018.
Tongsopit, S., W. Amatayakul, P.G. Saculsan, V.H. Nghia, C. Tirpornvitoon, R. Favre, A. Afanador
(2017), Designing Renewable Energy Incentives and Auctions : Lessons for Asean. USAID
Clean Power Asia.
_ U. S. Energy Information Administration (U.S. EIA) (2015), Annual Energy Outlook 2016.
https://doi.org/EIA-0383(2016) (accessed 15 July 2017).
_ United Nations Capital Development Fund and United Nations Development Programme
(UNCDF/UNDP) (2012), CleanStart – Microfinance Opportunities for a Clean Energy
Future. Retrieved from https://uncdf-cdn.azureedge.net/media-manager/54038?sv=2016-
05-
31&sr=b&sig=brLkMbYZF0dheKJOBSdGjLkPK%2BWwhC56%2ByHeiYkbnTI%3D&se=2018-
09-21T05%3A13%3A59Z&sp=r (accessed 16 March 2018).
US Embassy (2017), export.gov: Burma – Energy. July 2017. Retrieved from
https://www.export.gov/article?id=Burma-Energy (accessed 1 June 2018).
Vaghela, D. (2017a), ‘Cornerstone of Myanmar’s Self-Financed Mini-grids Success: Productive
End Use of Electricity’, HPNET Webinar.
Vaghela, D. (2017b), Myanmar ’s Renewable Energy Mini-grids : Technology Differentiation. Nay
Pyi Taw: Asian Development Bank.
Vakulchuk, R., Hlaing, K.K., Naing, E.Z., Overland, I., Suryadi, B. and Velautham. S. (2017),
Myanmar’s Attractiveness for Investment in the Energy Sector A Comparative
International Perspective Retrieved from

112
http://cloud.aseanenergy.org/s/bP4DA3tm8ZbDJad#pdfviewer
Wai, K.S. and H.L. Aung (2015), ‘Muse Traders Flout Rice Exports Ban’, The Myanmar Times.
September 2015.
Wang, X., and M. Win (2016), Myanmar: Towards Universal Access to Electricity by 2030.
Washington DC. Retrieved from
https://energypedia.info/images/f/fb/MM_NEP_CSO_meeting_1-30-
2015_Overview_01.pdf (accessed 15 Feb. 2017).
Whiteman, H. (2016), ‘Historic Day in Myanmar as Aung San Suu Kyi Takes Power’, CNN.
February 2016.
Win, P.P., Y.G. Jin, and Y.T. Yoon (2017), ‘Evaluation of Solar-diesel-battery Hybrid System for Off-
Grid Rural Electrification in Myanmar’, Journal of Electrical Engineering and Technology,
12(6), pp. 2138–2145. In https://doi.org/10.5370/JEET.2017.12.6.2138.
Win, S.P. (2018), ‘Coal-fired Power Plant Project in Hpa-An Faces Wall Of Protests’, The
Myanmar Times. January 2018.
Win, Z.M., and T. Thiri (2018, May), ‘Myanmar to Postpone Third Round of Peace Talks with
Ethnic Militias’, Radio Free Asia.
Woodhouse, M., R. Jones–Albertus, D. Feldman, R. Fu, K. Horowitz, D. Chung, and S. Kurtz
(2016), On the Path to SunShot: The Role of Advancements in Solar Photovoltaic Efficiency,
Reliability, and Costs. h https://www.nrel.gov/docs/fy16osti/65872.pdf (accessed 10 July
2017).
World Bank (2014), Myanmar: Towards Universal Access to Electricity by 2030.
http://www.esmap.org/sites/esmap.org/files/DocumentLibrary/Myanmar NEP BBL
presentation 10-01-2014.pdf (accessed 13 July 2016).
World Bank (2016a), Myanmar: Analysis of Farm Production Economics, Economic and Sector
Work Report No. 100066-MM, World Bank.
World Bank (2016b), Regulatory Indicators for Sustainable Energy (RISE): 2016 Country Data–
Myanmar. http://rise.worldbank.org/export/pdf/138?country=138 (accessed 1 June
2018).
World Bank (2018), Access to Electricity (% of population).
https://data.worldbank.org/indicator/EG.ELC.ACCS.ZS?locations=MM&name_desc=false
(accessed 23 April 2018).
World Bank, and ESMAP (2017), Solar Resource and Photovoltaic Potential of Myanmar.
Washington, DC: World Bank. Retrieved from
http://documents.worldbank.org/curated/en/509371496240201777/pdf/115346-ESM-
P161130-PUBLIC-MyanmarSolarResourcePotentialWBESMAPMay.pdf (accessed 15 June
2017).

113
World Wildlife Fund [WWF] (2016), ‘Alternative Vision for Myanmar ’ s Power Sector Towards
Full Renewable Electricity by 2050’.
http://d2ouvy59p0dg6k.cloudfront.net/downloads/alternative_vision_for_myanmar_s_p
ower_sector_draft.pdf (accessed 3 June 2018).
XE.com (2017a), ‘XE Currency Converter: EUR to USD’.
http://www.xe.com/currencyconverter/convert/?Amount=1&From=EUR&To=USD
(accessed 7 November 2017).
XE.com (2017b), ‘XE Currency Converter: USD to MMK’.
https://xe.com/currencyconverter/convert/?Amount=1&From=USD&To=MMK (accessed 7
November 2017).
XE.com (2018), ‘XE Currency Charts: USD to MMK’. In
https://xe.com/currencycharts/?from=USD&to=MMK&view=5Y (accessed 26 April 2018).
Xinhua Net. (2010), ‘Wen Jiabao yu miandian zongli Dengsheng juxing huitan’ [Wen Jiabao
Holds Talks with Myanmar Prime Minister Deng Sheng (in Chinese)]. June 2010, Retrieved
13 September 2018, from Xinhua Net.
Xu, B., and E. Albert (2016), Understanding Myanmar. In
https://www.cfr.org/backgrounder/understanding-myanmar (accessed 1 June 2018).
Yimou Lee, S. N. (2017), ‘Coal Plan Sparks Ire as Myanmar Struggles to Keep Lights On’, Reuters.
July.
Zorya, S. (2016), Unleashing Myanmar’s Agricultural Potential. World Bank. May 2016.
http://blogs.worldbank.org/eastasiapacific/unleashing-myanmar-agricultural-potential
(accessed 1 June 2018).

114
Appendix 1: Workshop Report
The Energy Policy Workshop
Date
Wednesday, March 28, 2018
Venue
Hilton Hotel, Nay Pyi Taw
Hosted by
Central Economic Committee (CEC) National League for Democracy (NLD) Policy Alternatives Research Institute (PARI), the University of Tokyo
Supported by
The Association for Overseas Technical Cooperation and Sustainable Partnerships (AOTS) Economic Research Institute for ASEAN and East Asia (ERIA)
Language English
Date Morning Afternoon
28 MAR.
(WED)
Ceremony (11:00–13:00)
Inauguration Ceremony
Lun
ch (1
3:3
0-1
4:3
0)
Co
ffee Brea
k(15:30
-15:4
0)
Lecture 1 (15:00–17:00)
Overview of Energy Policy
1) Global Trend and Opportunities in
Myanmar
2) Some Key Issues:
- Black-out
- Rural Electrification
- Electricity Tariff
- etc
3) Planning and Operation
Prof. Hisashi Yoshikawa
Project Professor
Policy Alternatives Research
Institute
The University of Tokyo
Welco
me D
inn
er (18:00
-)

115
29 MAR
(THU)
Lecture 2 (10:00–12:30)
Brainstorming
(Group Discussion)
1) Energy for Peace
2) Demarcation amongst
Stakeholders
- Parliament
- Public Administration
Lun
ch (1
3:00
-14
:00
)
Lecture 3 (14:30–16:30)
Session Wrap-up
(Group Presentation)
1) Group Presentation
2) Response from Lectures
3) Way Forward
- Action Plan
Appendix 2: Model Parameters for Energy Planning Model
Resource Potential: Refers to the total energy potential of each resource in the region
Available Portfolio: Refers to the total energy potential remaining after installed capacity
Capacity Constraints under Scenario: This section allows the model to account for future
planned capacity reported in regional planning policy documents. The model can choose
to constrain itself to this future planned capacity
Capacity Factor: This refers to the annual capacity factor of each generation resource
Peak Contribution: The at-peak contribution (firm capacity) for each technology. For example,
for an evening peak demand profile, solar should have a 0% contribution. This constraint
can be relaxed by making all resource peak contributions 100%
Load: Refers to the local electricity demand for the region, excluding exports
Load + Exports: Refers to the local electricity demand for the region, including exports
Peak Demand: Refers to the local peak electricity demand in the region
Reserve Margin: This allows the generation portfolio to meet a surplus of demand, as is the
standard for operating reliable grids
Cap Cost: Refers to the overnight capital cost of each technology
Annual Cap Cost: Refers to the annualised overnight capital cost of each technology, using a
discount rate and estimated lifespan
Variable Cost: Refers to the operating and maintenance cost, plus fuel cost of each technology
Investment Decision: This is the decision variable of the OpenSolver. It refers to new generation
capacity installed each year. This s``hould never be changed manually
Installed Capacity/Dispatch: This is the total installed generation capacity, assuming
investment decisions are carried out

116
Average Dispatch: This refers to the dispatch multiplied by the capacity factors
Electricity Mix: This refers to the annual generation of the installed capacity
EneCost: Refers to the energy cost of the electricity mix, using total variable costs
CapCost: Refers to the capital cost of the electricity mix, using total capital costs
TotCost: This is the sum of the energy and capital costs of the electricity mix. This is the stream of
cost that is discounted to NPV and used as the minimiser of the optimisation model
AvgCost: The average cost per electricity produced
LCOE: The levelised cost of electricity
Capacity at Peak: Refers to the contribution each resource's generation can make at peak. This
value should be greater than or equal to the peak demand
Renewable Energy: Refers to the portion of annual generation that comes from renewable
sources
RPS Energy: Excludes large hydropower generation
% RPS from Load: The percentage of RPS energy to the total local load of the region
Fossil Energy: Refers to the portion of annual generation that comes from fossil sources
DiffLoad: The difference between annual load and annual generation, ensuring constant power
supply
DiffPeakDem: The difference between the capacity at peak and the peak demand, ensuring
constant power supply
Spill: Refers to the excess annual generation in the mix
Discount Rate: The rate at which cash flows are discounted, typically 7%
Total Cost: The NPV of the stream of total cost values per year, discounted

117
Appendix 3 : Details of Field Survey on Mini-grids
Survey Details
Because the survey data included confidential information from companies, they were
anonymised. The interview survey was conducted based on the questionnaire entitled,
‘Questionnaire for Supplier/developer of Solar Home Systems (SHSs)/Solar Microgrids’. The
numbers acquired were averaged and used in the levelised cost of electricity (LCOE) calculation.
Table A1 shows the survey details.
Table A1. Survey details
Survey 1
Date February 2–3, 2017
Venue Yangon Technological University
Method Semi-structured interview
Interviewer The authors
Number of interviewees (companies) 7
Survey 2
Date April to July 2017
Method Questionnaire
Surveyor Mitasu Consultants Group
Number of interviewees (companies) 2
Survey 3
Date 19–24 October 2017
Method Open interview
Interviewer The authors
Number of interviewees (companies) 4

118
Questionnaire for Survey 1
Questionnaire for Supplier/Developer of
Solar Home Systems (SHSs)/solar Mini-grids
General questions (if you do not have a name card, please fill in)
1. Name of company:
2. Address:
3. E-mail:
4. Phone/mobile:
(If this information is not on the website of your company, please fill in.)
5. Owner(s) of the company:
6. Number of staff:
7. Year company was established:
Your business field
8. What kind of products do you sell?
□ Solar lanterns
□ Solar-powered pumps
□ Solar home systems
□ Solar mini-grid/microgrid systems (capacity kW ~kW)
□ Solar modules
□ Inverters
□ Mounting systems
□ Batteries
□ Others (____________)
9. What kind of services do you provide?
□ Engineering (design, preparation of permit documents, project management)
□ Procurement
□ Construction
□ Operation of mini-grids
□ Maintenance
□ Manufacturing of (____________)
10. When did you start businesses related to solar lantern/solar home systems (SHSs)/mini-
grids?
( )
11. Did you have any experience in the energy business before entering the (SHS)/mini-grid
business?

119
( )
12. Does your company provide any other business products/services?
( )
13. How many mini-grids have you built? Or how many SHSs have you sold?
( )
14. How many mini-grid projects are you working on (pipeline)?
( )
15. Do you sell second-hand components? Yes/No
If yes, from where do you procure them?
( )
16. In which country are the products made?
i. Solar modules
( )
ii. Inverters
( )
iii. Mounting systems
( )
iv. Batteries
( )
v. Others in question 8
( )
17. From whom do you buy the components?
i. Solar modules
□ Maker
□ Distributor
□ Other (____________)
ii. Inverters
□ Maker
□ Distributor
□ Other (____________)
iii. Mounting systems
□ Maker
□ Distributor
□ Other (____________)

120
iv. Batteries
□ Maker
□ Distributor
□ Other (____________)
v. Others in question 8
□ Maker
□ Distributor
□ Other (____________)
18. For about how much do you sell products to your customers?
i. Solar modules
About ( ) kyat <100/1,000 units (circle the number nearest to the units your
consumers typically purchase)
About ( ) kyat >100/1,000 units
ii. Inverters
( ) kW: About ( ) kyat
If there are other inverters, which you sell?
( ) kW: About ( ) kyat
iii. Mounting systems
About ( ) kyat/kW
iv. Batteries
( ) W: About ( ) kyat/unit
or About ( ) kyat/W
v. Systems as a whole
About ( ) kyat/kW (Including construction costs Yes/No)
vi. Others in question 8
( )
19. To whom do you sell the components?
□ End users
□ Distributors
□ Developers
□ Independent power producers
□ Others (____________)
20. How much do you pay for electricity at the office?
i. Do you connect to the national grid? If yes, how much is the tariff?
( ) kyat/month

121
If you know, ( ) kyat/kWh
ii. Do you have a backup generator? If yes, what is its power source?
Diesel/Solar/Other ( )
21. What do you think is the barrier to your business?
(Please answer freely—e.g., revenue collection risks, the potential for theft, and central grid
extension.)
*For mini-grid suppliers/developers, please continue to the next page.
For Mini-Grid Suppliers/Developers
Your track record information
1. Where is this mini-grid? (GPS coordinates or address)
( )
2. What is the installed capacity?
( ) kW
3. What is the power source?
1. Solar 2. Hydro 3. Diesel 4. Combination of ( )
5. Other (____________)
4. Who owns this mini-grid?
□ Community
□ Distributor
□ Developer
□ Independent power producer
□ Other (____________)
5. How long did it take to construct?
( )
6. About how much was the investment cost?
i. Equipment ( ) kyat
ii. Construction ( ) kyat
iii. Other ( ) ( ) kyat
7. Please write the contact info for the mini-grid operator, if possible.
( )
8. What is the tariff for the mini-grid’s electricity?
( ) kyat/kWh or month (Please circle the appropriate option.)

122
9. If any, what kind of complaints do you receive from customers?

123
Questionnaire for Survey 2
Project Summary
PV capacity kW
Battery capacity kWh or Ah
Diesel capacity kW
Number of households Cost Breakdown
Item Quantity Unit Price
(US$) Cost (US$)
Primary Components
PV modules
Inverters
PV array rack
Batteries (if any)
Diesel generator (if any)
Transportation to site
Distribution to Households
Lamps
Prepayment meters
Accessories
Internal wiring
Distribution cables
Streetlight
LED street light bulb
Lamppost
Cables
Installation
Site preparation
Primary component installation
Household distribution installation
Others
Studies and surveys
Training
Trials (Pretesting)
Grand TOTAL

124
Detailed Load Assumptions
Table A2. Load assumptions for scenario A
Electrical Appliance Power Consumption Quantity per
Household
Hours of Use
Lamp inside
(3W × 2, 7W × 1)
13 W 1 set 18:00–23:00
Lamp outside
(streetlight)
5 W 1 18:00–24:00
TV 147 W* 0.75 (3 HHs/4 HHs) 1 hour at night
Total daily electricity
consumption
20.5 kWh/day
Note: HH = household.
Assumptions without notes are based on the survey conducted by the authors.
Table A3. Load Assumption for Scenario B.
Electrical Appliance Power Consumption Quantity per Household Hou
rs of
Use
Lamp inside 5 W 5 18:00–23:00
Lamp outside
(streetlight)
5 W 1 18:00–24:00
TV 147 W* 1 1 hour at
night
Rice cooker 584 W* 0.5 0.5* at night
Refrigerator 84 W* 0.1 24
Fan 58 W* 0.6 2.86* in the
daytime
Iron 1,000 W* 0.5 0.27* in the
daytime
Water pump 146 W* 0.15*** 0.88* in the
daytime
Computer 130 W* 0.03*** 4.34* in the
daytime
Printer 30 W 0.01*** 2** in the
daytime
Grinder 120 W** 0.03 (3 carpenters per
village***)
9:00–17:00
Drilling machine 350 W** 0.03 9:00–17:00
Circular saw 1500 W** 0.03 9:00–17:00

125
Planer 450 W** 0.03 9:00–17:00
Sewing machine 120 W** 0.01 9:00–17:00
Total daily
electricity
consumption
227 kWh/day
(daytime: 96,
nighttime:
131)
Source: * (M. P. Aye, 2015) ; ** (Blum et al., 2013) ; *** Survey by the authors.

126
Appendix 4: Guidelines for Environmental Protection in Foreign Investment and
Cooperation
February 18, 2013
Guidelines for Environmental Protection in Foreign Investment and Cooperation18
Source: Ministry of Commerce and Ministry of Environmental Protection of China
Article 1. These Guidelines are hereby formulated to direct enterprises in China to improve their
regularisation of environmental protection in foreign investment and cooperation activities, to
ensure timely identification and prevent environmental risks, to actively perform their social
responsibilities regarding environmental protection, to set up a good international image for
Chinese enterprises, and to support the sustainable development efforts of the host country.
Article 2. These Guidelines are applicable to the environmental protection of Chinese
enterprises in foreign investment and cooperation activities, which shall be implemented
consciously by enterprises.
Article 3. It is advocated that in the course of active implementation of their responsibilities on
environmental protection, enterprises should respect the religious beliefs, cultural traditions,
and national customs of local communities in the host country; safeguard the legitimate rights
and interests of labor; offer training, employment, and re-employment opportunities to
residents in the surrounding areas; promote harmonious development of the local economy,
environment, and community; and cooperate to ensure mutual benefits.
Article 4. Enterprises shall adhere to the concepts of environmental friendliness and resource
conservation, develop low-carbon and green economies, and implement sustainable
development strategies so as to realise a ‘win-win’ situation, benefiting both corporate interest
and environmental protection.
Article 5. Enterprises shall comprehend and implement all the provisions pertaining to the
environmental protection laws and regulations of the host country.
For projects investing in construction and operation, enterprises shall file applications for
environmental protection permits with the local government in accordance with the laws and
regulations of the host country.
18 See the original Guidelines in Chinese at http://www.mofcom.gov.cn/article/b/bf/201302/20130200039930.shtml and the official English translation at
http://english.mofcom.gov.cn/article/policyrelease/bbb/201303/20130300043226.shtml

127
Article 6. Enterprises shall include environmental protection as well as production and operation
plans in their enterprise development strategies; establish the corresponding rules and
regulations for environmental protection; and manage all aspects related to the enterprise’s
environment, health, and production safety. In addition, enterprises shall be encouraged to
utilise integrated environmental services.
Article 7. Enterprises shall establish a sound environmental protection training system to provide
employees with appropriate education and training with respect to the environment, health, and
production safety. Enterprises shall enable employees to understand the relevant laws and
regulations of the host country regarding environmental protection and disposal of harmful
substances, prevention of environmental accidents, and other environmental aspects, so as to
improve employees’ awareness on regulatory issues and environmental protection.
Article 8. Enterprises shall, in accordance with the requirements of the laws and regulations of
the host country, conduct an environmental impact assessment on the development and
construction of all projects, as well as their production and operation activities. Enterprises shall
take reasonable measures to reduce possible adverse impacts based on the findings of such
environmental impact assessments.
Article 9. Enterprises are encouraged to consider the impacts of their development and
construction projects as well as production and operation activities on the social environment
such as historical and cultural heritage, scenic spots, and folk customs. Enterprises shall take
reasonable measures to reduce possible adverse impacts.
Article 10. Enterprises shall, attending to the requirements of the laws, regulations, and
standards of the host country concerning environmental protection, install and operate pollution
prevention equipment, implement pollution prevention interventions, and ensure that pollutant
emissions, wastewater effluent, solid waste, and all other pollutants meet the pollutant
emission/discharge standards of the host country.
Article 11. Enterprises are encouraged to, prior to the construction of the project, conduct
environmental monitoring and evaluation for the proposed construction site, obtain an
understanding of the environmental background of the project location and its surrounding
areas, and publicly disclose the environmental monitoring and evaluation results.
Enterprises are encouraged to monitor the pollutants of primary concern, be cognisant of the
pollution generated by the enterprises at all times, and disclose the monitoring results.
Article 12. Enterprises are advocated to conduct environmental due diligence activities for target
overseas enterprises before acquiring them, focusing the evaluation on the hazardous waste
formed as part of their previous/historical operation as well as soil and underground water
pollution, and environmental legacies of the target enterprises. Enterprises are encouraged to
undertake best environmental practices to reduce the potential environmental risks and
liabilities.
Article 13. Enterprises shall establish management plans for hazardous waste that may be
generated during production, the contents of which shall include measures to reduce the

128
amounts and risks of hazardous waste, as well as measures to store, transport, utilise, and
dispose of them.
Article 14. Regarding potential risks of environmental accidents, enterprises shall formulate
contingency plans for environmental accidents and other emergencies based on the nature,
features, and possible environmental hazards of the same, and set up a reporting and
communication system with the local government, regulatory environmental protection
authority, the general public that may be affected by the project, and the headquarters of
Chinese enterprises.
Contingency plans shall include the organisational system and responsibilities pertaining to
emergency management, prevention, and early warning mechanism; handling procedures;
emergency guarantees; and recovery and reconstruction after the emergency has been
addressed. Enterprises are encouraged to organise emergency drills and make timely
adjustments to the plans, as well as take measures such as environmental pollution liability
insurance cover to reasonably insure themselves against risks associated with environmental
accidents.
Article 15. Enterprises shall carefully consider the ecological function orientation of the area the
project is located, and may, in coordination with the government of the host country and
community, prioritise such measures as on-site and off-site (e.g., conservation of animal and
plant resources that deserve protection near the project location, to reduce adverse impacts on
the local biodiversity).
For ecological impacts caused by investment activities, enterprises are encouraged to carry out
ecological restoration in accordance with the requirements of the laws and regulations of the
host country or common practices in the industry.
Article 16. Enterprises are encouraged to implement clean production, promote recycling,
reduce pollution at source, improve resource use efficiency, and reduce the generation and
emission of pollutants in the course of production and service/product use.
Article 17. Enterprises are encouraged to implement green procurement and give preference to
environmentally friendly products. Enterprises should apply for relevant environmental
management system certification and environmental label certification for products in light of
the laws and regulations of the host country.
Article 18. Enterprises are encouraged to post their environmental information on a regular basis,
and publish their plans on implementation of laws and regulations on environmental protection,
including measures taken and environmental performance achieved.
Article 19. Enterprises are encouraged to strengthen their contacts and communications with
the government and regulatory authorities in charge of environmental protection in the host
country, and actively seek their opinions and suggestions on environmental protection issues.
Article 20. Enterprises should establish the manner of communication and the dialogue
mechanism pertaining to their environmental and social responsibilities, take initiatives to
strengthen their contacts and communications with communities and relevant social groups, and

129
seek their opinions and suggestions with respect to the environmental impacts of their
construction projects and operation activities through forums and hearings according to the
requirements of the laws and regulations of the host country.
Article 21. Enterprises should actively participate in and support local public benefit activities
for environmental protection, publicise the concept of environmental protection, and build a
good image for themselves in this regard.
Article 22. Enterprises are encouraged to conduct research on and learn from the principles,
standards, and practices relevant to environmental protection and adopted by international
organisations and multilateral financial institutions.