electrical properties of ssl lamps. · 225μh 700μh 100μh 125nf 10Ω 100Ω 4μf 0.025Ω 3.4Ω...
TRANSCRIPT

Electrical properties of SSL lamps. Torsten Lippert
Teddington, April 2013

2
Outline
- Example of electronics - Impedance issues - Impact - Current THD - Flicker

3
Electronics
PRO Light LED Standard 1,2 W

4
Electronics
PRO Light LED Standard 1,2 W Diagram T800mA Diode bridge (rectifier) ~ + 51Ω 230 V 390V 4,7µ LED Varistor ~ – 220k 220k 0,33µ

5
Electronics
Common SSL circuits T800mA Diode bridge 10 Ω Diode bridge
440 kΩ 4,7 µF 6,8 µF
4,7 mH
0,33 µF
SSL lamps are non-linear loads High current distortion

6
Electronics
Impedance of some typical lamps Impedance Resistance Reactance Z (kΩ) R (kΩ) X (kΩ) Pro Light 1,2 W 9,61 2,47 -9,19 Paulmann 3 W 9,88 6,03 -7,83 Philips 5 W 10,45 10,21 -2,25 Philips 12 W 4,06 4,05 -0,31 Osram 8 W 6,00 5,18 -3,02 Osram 4,5 W 11,67 11,56 -1,75 Osram 12 W 3,84 3,73 -0,88

7
Impedance
Consequences: Current signal rich in harmonics, 30% - 200 % THD - affects current and power measurements Power factor far below 1, down to 0,25 Highly frequency dependent impedance - High impedance at low frequency - Low impedance at high frequency Frequency dependency, up to 2 %/Hz

8
Impedance
Basic Model Highly frequency dependent impedance Zs
Vs ZL IL Vm, Im
The source impedance standard value suggested by IEC-725(1981) is 0.4 + j0.25 Ω (~800µH) at 50 Hz.

9
Impedance
Contour of the relative deviation (%) in RMS current value with variable source impedance D. Zhao

10
Impedance
225μH
700μH
100μH
125nF
100Ω10Ω
4μF
0.025Ω
3.4Ω
10kΩ
1Ω
4Ω
0.1Ω500μH EUT
Power Supply
50μF
Proposed source impedance stabilization network The calculated current deviation becomes less than 0.02 % - major improvement
D. Zhao

11
Impedance
100μH
125nF
100Ω10Ω
4μF
Ω
Ω
EUT
Proposed simplified source impedance stabilization network
D. Zhao

12
Impedance
Influence of current shunt resistance a: 3 Ω 41,61 mA b: 0,9 Ω 41,73 mA c: 0,09 Ω 42,65 mA ~ 2,5% difference BUT: Extremely lamp dependent
a, b, c

13
Impedance
Influence of current shunt resistance 50 mA - 8 Ω, 100 mA - 4 Ω, 200 mA - 2 Ω
Lamp Shunt I (mA) P (W) S (VA) Q (Var) PF
PRO Light 1,2 W 50 mA 24,90 1,417 5,727 5,549 0,247
100 mA 0,34% 0,11% 0,33% 0,34% -0,20%
200 mA 0,20% -0,20% 0,19% 0,22% -0,36%
Osram 4,5 W 50 mA 40,91 4,308 9,408 8,364 0,458
100 mA 2,59% 0,17% 2,62% 3,25% -2,38%
200 mA 3,27% -0,47% 3,25% 4,22% -3,60%

14
Impedance
Main dependencies to be considered: Lamps (electronics) Power supply Current shunt Cables (length) Observed differences for the same lamp model up to several %.

15
Current THD
Total Harmonic Distortion, Current Digitizer: Entire spectrum in accordance with sample rate Power Analyzer: Limited no. of harmonics (harmonic analysis mode) Key parameters may still be determined using the full bandwidth (V, I, P, PF, THD) – instrument dependent

16
Current THD
Typical Spectrum

17
Current THD
Current, Total Harmonic Distortion or

18
Current THD
Some typical results, THD L1 196 % L2 68% L3 31% L4 29% L5 30% L1+L3+L5 36%
Variations among lamps
of the same model can be several %

19
Current THD
THD - Voltage dependence Lamp L5 L6 100 - 240 V 230 V 100 V 24% 52% 150 V 18% 41% 200 V 25% 35% 230 V 30% 31%

20
Flicker
IEC 61000-4-15: Flickermeter 1 - 60 W, Incandescent 2 - 4.5 W (L1) 3 - 12 W (L3) 4 - 8 W (L5)

21
Flicker
Sine wave: 230 V, 50 Hz Square wave modulation: 8,8 Hz Longe term flicker Plt: Plt = = 0,87 (N = 15) 3
N
ist
N
P∑

22
Flicker
Measured Plt values: Applied: 0,87 1 - 60 W Inc.: 0,81 2 - 4.5 W LED: 13,93 3 - 12 W LED: 0,26 4 - 8 W LED: 1,94

23
Acknowledgements
The research leading to these results has received funding from the European Union on the basis of Decision No 912/2009/EC.
The research leading to these results has received funding from the Danish Agency for Science Technology and Innovation under the Ministry of Science Technology and Innovation.

24
SSL Power
Extras
25
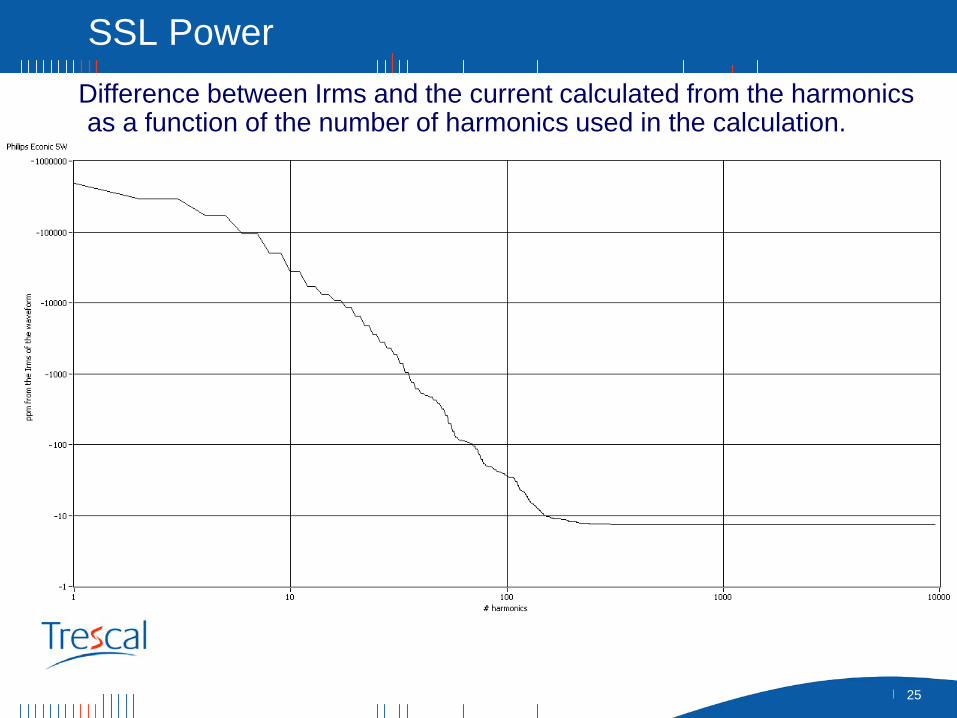
SSL Power Difference between Irms and the current calculated from the harmonics
as a function of the number of harmonics used in the calculation.

26
SSL Power
Current waveform, Philips Econic, 5 W

27
SSL Power
Current waveform, Philips Econic with dimmer, 6 W

28
SSL Power
Current waveform, Osram, 12 W

29
SSL Power
Current waveform, Philips MyVision, 5 W

30
SSL Power
Frequency spectrum (500 kHz), Philips Econic, 6 W

31
SSL Power
Frequency spectrum (500 kHz), Philips MyVision, 5 W

32
SSL Power
Frequency spectrum (500 kHz), Osram, 12 W

33
SSL Power
Frequency spectrum (500 kHz), Philips Econic, 5 W