electrical and seismic tomography used to image the structure of a tailings pond at the abandoned...
TRANSCRIPT

TECHNICAL ARTICLE
Electrical and Seismic Tomography Used to Image the Structureof a Tailings Pond at the Abandoned Kettara Mine, Morocco
Meriem Lghoul • Teresa Teixido • Jose Antonio Pena •
Rachid Hakkou • Azzouz Kchikach • Roger Guerin •
Mohammed Jaffal • Lahcen Zouhri
Received: 14 October 2011 / Accepted: 26 January 2012 / Published online: 10 February 2012
� Springer-Verlag 2012
Abstract The Kettara site (Morocco) is an abandoned
pyrrhotite ore mine in a semi-arid environment. The site
contains more than 3 million tons of mine waste that were
deposited on the surface without concern for environmental
consequences. Tailings were stockpiled in a pond, in a dyke,
and in piles over an area of approximately 16 ha and have
generated acid mine drainage (AMD) for more than
29 years. Geophysical methods have been used at the
Kettara mine site to determine the nature of the geological
substrate of the tailings pond, the internal structure of the
mine wastes, and to investigate the pollution zones associ-
ated with sulphide waste dumps. Electrical resistivity
tomography (ERT) and seismic refraction data were
acquired, processed, and interpreted; the results from ERT
and seismic refraction were complementary. A topograph-
ical survey of the tailings disposal area was also undertaken
to estimate the volume of wastes and quantify the AMD
process. Two-dimensional inverse models were used to
investigate the geophysical data and indicated alteration
zones at depth. It was determined that the material could be
classified into three categories: tailings, with low resistivity
(5–15 X m) and low velocity (500–1,800 m/s); altered,
black shales, with intermediate resistivity (20–60 X m) and
velocity (2,000–3,500 m/s), and; materials with high
resistivity and velocity ([60 X m and [4,000 m/s,
respectively), including unaltered shales associated with
quartzite seams. The low-resistivity zone generates AMD,
which migrates downward through fractures and micro-
fractures. The substrate is composed of broken and altered
shale, which facilitates AMD infiltration.
Keywords Acid mine drainage (AMD) � Mine waste �Electrical resistivity tomography (ETR) �Kettara mine site � Seismic refraction tomography
Introduction
Geophysical methods are increasingly being used with
great success to delineate areas contaminated with poten-
tially harmful elements and compounds, including acidic
seepage at industrial landfills and mine waste sites. These
methods have also been used to define the petrophysical
properties and internal structure of tailings impoundments
and waste rock piles (Buselli and Lu 2001; Campbell and
Fitterman 2000; Chouteau et al. 2005; Guerin et al. 2004;
Martin-Crespo et al. 2010; Martinez-Pagan et al. 2009;
Placencia-Gomez et al. 2010; Poisson et al. 2009; Rucker
et al. 2009; Shemang et al. 2003; Sjodahl et al. 2005;
Vanhala et al. 2005). To monitor or decontaminate affected
sites, a complete knowledge of their geology and
M. Lghoul � A. Kchikach � M. Jaffal
Equipe de recherche E2G, Cadi Ayyad University (UCAM),
BP 549, 40000 Marrakech, Morocco
M. Lghoul � R. Hakkou (&)
IDRC (Canada) Research Chair in Management
and Stabilization of Mining and Industrial Wastes,
LCME, Cadi Ayyad University (UCAM), Marrakech, Morocco
e-mail: [email protected]; [email protected]
M. Lghoul � R. Guerin
UMR 7619 Sisyphe, Univ Pierre and Marie Curie-Paris 6,
Case 105, 4 Place Jussieu, 75252 Paris Cedex 05, France
T. Teixido � J. A. Pena
Instituto Andaluz de Geofısica, Univ de Granada,
Granada, Spain
L. Zouhri
Institut Polytechnique La Salle Beauvais,
Beauvais, France
123
Mine Water Environ (2012) 31:53–61
DOI 10.1007/s10230-012-0172-x

hydrogeology is necessary, as is knowledge of the behav-
iour of the pollutants and their means and routes of trans-
port. Geophysical methods are very useful in providing this
information (Guerin et al. 2004) and can be a cost-effective
alternative to expensive drilling and sampling programs in
engineering, geological, and hydrogeological applications
(Nasab et al. 2011). Geophysics can be applied with great
value to generate information about the subsurface over a
large area in a reasonable time frame and in a cost-effective
manner (Burger et al. 2006).
Mine wastes containing metallic sulphides commonly
generate acid mine drainage (AMD). There are many phys-
ical, geochemical, and biological processes that lead to the
production of AMD; these have been summarized elsewhere
(e.g. Evangelou 1995; Kleinmann et al. 1981; Singer and
Stumm 1970). The site-specific reactions are largely dictated
by internal structure and the physical and chemical proper-
ties of the mine wastes (Ramalho et al. 2009).
However, direct observation by drilling and excavation
of trenches can be difficult due to the heterogeneous nature
of the materials. Moreover, the information obtained is
localized and the destructive nature of drilling disturb the
structure of materials and can be a source of pollution.
Under these conditions, geophysical methods offer a rela-
tively low cost alternative for characterizing the internal
structure of the tailings and determining the extent of AMD
migration. Geophysical methods are nondestructive in
nature and are simple to implement, compared to drilling.
The characterisation of contaminated sites using geophys-
ical methods is essential for the successful design of
remediation strategies.
The Marrakech area (Fig. 1a) is one of the principal
metallogenic provinces of Morocco. Several mine sites there
are either being exploited or are currently abandoned. The
present study relates to the abandoned Kettara mine, which is
representative of the Marrakech area; it generates significant
AMD and a rehabilitation project has been initiated.
The rehabilitation scenario being investigated at the
Kettara mine involves using fine alkaline phosphate waste
(APW) as both an amendment and a ‘store and release’ (SR)
cover (Hakkou et al. 2009). This process will require that all
of the Kettara coarse tailings be collected and placed over the
old tailings pond. The coarse tailings would be amended with
approximately 20 cm of APW. Then, an APW capillary
barrier would be placed over the Kettara mine waste; in the
semi-arid climate, this barrier is expected to limit infiltration
of water to the reactive mine wastes, thus reducing AMD
production (Hakkou et al. 2009). To facilitate the success of
this rehabilitation project, it was important to determine the
nature of the geological substrate of the tailings pond and
the internal structure of the mine wastes, and to estimate
the volume of tailings by determining the thickness of the
tailings layer in the tailings pond.
Site Description
Geological Setting
The central Jebilet metapelites (Sarhlef schists) outcrop a
few kilometres north of Marrakech in a wide area corre-
sponding to the central unit of the Hercynian Jebilet massif.
The Sarhlef schists are derived from Middle to Upper
Visean shales deposited in an anoxic platform and are
affected by a very-low-to low-grade metamorphism con-
temporaneous with a post-Visean shortening. Deformation
and metamorphic gradients are observed towards the major
shear zones, and there are numerous intrusions present in
the unit (Huvelin 1977). Sulphide deposits in the studied
area are generally located close to the intrusions. These ore
bodies are organised into subvertical lineaments concur-
rently with the regional schistosity.
The Kettara sulphide deposit is a typical example of a
metamorphosed deposit hosted by Visean volcano-sedi-
mentary formations. The tectonic and microtectonic
structures observed in the neighbourhoods of the principal
surface of the tailings correspond to strike-slip faults with
quartzo-carbonated seams and micro-fractures with
quartzitic seams, and schistosity, which affects all of the
black shale formation (Lghoul et al. 2012).
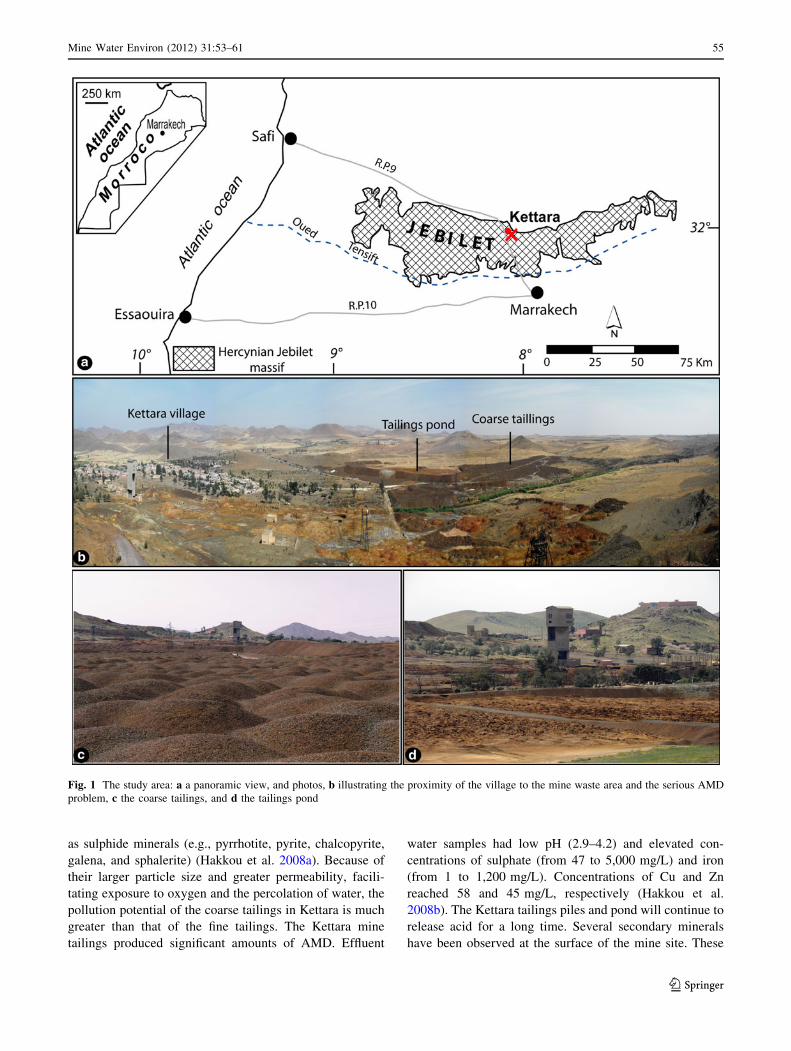
Kettara Mine
The abandoned Kettara pyrrhotite ore mine, exploited by
the SYPEK corporation, is located approximately 30 km
north–north–west of the town of Marrakech in the core of
the central Jebilet Mountains (Fig. 1a). The mining village
of Kettara and the mining infrastructure are located
downstream from the tailings pond area (Fig. 1b).
According to the latest statistics (2004), the population of
Kettara is approximately 2,000. The climate is classified as
semi-arid with a mean annual rainfall of approximately
250 mm. Rainfall can occur over short periods and with
high intensity. The annual potential evaporation typically
exceeds 2,500 mm. From 1964 to 1981, the mine produced
more than 5.2 million metric tons (Mt) of pyrrhotite con-
centrate containing an average of 29% wt sulphide. Pyr-
rhotite was extracted from the ore by gravimetric
separation (jigs). This ore enrichment process generated a
wide range of particle size fractions in the tailings (jigs
refuse materials). Although ore reserves were still abun-
dant, the mine was closed in June 1982 due to difficulties
encountered during pyrrhotite concentrate production.
The tailings can be divided into two broad classes of
material; coarse tailings (fine gravel) were deposited on the
15 m high dyke and in 1 m high tailings piles, while fine
tailings (silt) were deposited in the tailings pond (Fig. 1d).
The Kettara wastes contain 1.6–14.5 wt% sulphur, mainly
54 Mine Water Environ (2012) 31:53–61
123
as sulphide minerals (e.g., pyrrhotite, pyrite, chalcopyrite,
galena, and sphalerite) (Hakkou et al. 2008a). Because of
their larger particle size and greater permeability, facili-
tating exposure to oxygen and the percolation of water, the
pollution potential of the coarse tailings in Kettara is much
greater than that of the fine tailings. The Kettara mine
tailings produced significant amounts of AMD. Effluent
water samples had low pH (2.9–4.2) and elevated con-
centrations of sulphate (from 47 to 5,000 mg/L) and iron
(from 1 to 1,200 mg/L). Concentrations of Cu and Zn
reached 58 and 45 mg/L, respectively (Hakkou et al.
2008b). The Kettara tailings piles and pond will continue to
release acid for a long time. Several secondary minerals
have been observed at the surface of the mine site. These
Fig. 1 The study area: a a panoramic view, and photos, b illustrating the proximity of the village to the mine waste area and the serious AMD
problem, c the coarse tailings, and d the tailings pond
Mine Water Environ (2012) 31:53–61 55
123
minerals occur as extremely fine-grained particles or as a
continuous precipitate layer known as hardpan. Additional
precipitates occur in other forms, such as ‘blooms’ or
efflorescent salts. The presence of these minerals in large
quantities shows that AMD generation is still very active at
Kettara.
The substrate is composed of broken shale, which could
facilitate AMD infiltration. Furthermore, the principal
groundwater table is located in this formation, at a depth
between 10 and 20 m. Groundwater sampled from wells
downstream of the mining wastes is contaminated by the
AMD, mainly by sulphates ([1,200 mg/L) and have high
conductivity values (3,000–3,680 lS/cm) (Lghoul et al.
2012). Understanding the processes that control the extent
and dispersion of contaminants away from the abandoned
mines could help reduce adverse effects at active mining
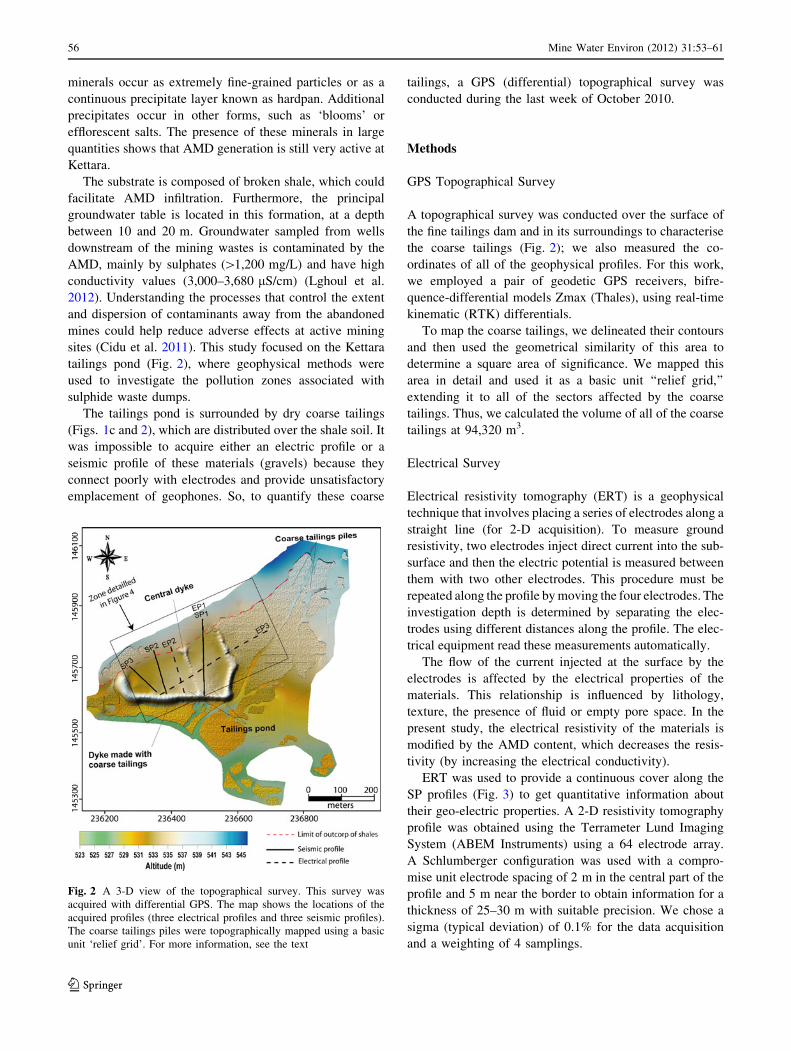
sites (Cidu et al. 2011). This study focused on the Kettara
tailings pond (Fig. 2), where geophysical methods were
used to investigate the pollution zones associated with
sulphide waste dumps.
The tailings pond is surrounded by dry coarse tailings
(Figs. 1c and 2), which are distributed over the shale soil. It
was impossible to acquire either an electric profile or a
seismic profile of these materials (gravels) because they
connect poorly with electrodes and provide unsatisfactory
emplacement of geophones. So, to quantify these coarse
tailings, a GPS (differential) topographical survey was
conducted during the last week of October 2010.
Methods
GPS Topographical Survey
A topographical survey was conducted over the surface of
the fine tailings dam and in its surroundings to characterise
the coarse tailings (Fig. 2); we also measured the co-
ordinates of all of the geophysical profiles. For this work,
we employed a pair of geodetic GPS receivers, bifre-
quence-differential models Zmax (Thales), using real-time
kinematic (RTK) differentials.
To map the coarse tailings, we delineated their contours
and then used the geometrical similarity of this area to
determine a square area of significance. We mapped this
area in detail and used it as a basic unit ‘‘relief grid,’’
extending it to all of the sectors affected by the coarse
tailings. Thus, we calculated the volume of all of the coarse
tailings at 94,320 m3.
Electrical Survey
Electrical resistivity tomography (ERT) is a geophysical
technique that involves placing a series of electrodes along a
straight line (for 2-D acquisition). To measure ground
resistivity, two electrodes inject direct current into the sub-
surface and then the electric potential is measured between
them with two other electrodes. This procedure must be
repeated along the profile by moving the four electrodes. The
investigation depth is determined by separating the elec-
trodes using different distances along the profile. The elec-
trical equipment read these measurements automatically.
The flow of the current injected at the surface by the
electrodes is affected by the electrical properties of the
materials. This relationship is influenced by lithology,
texture, the presence of fluid or empty pore space. In the
present study, the electrical resistivity of the materials is
modified by the AMD content, which decreases the resis-
tivity (by increasing the electrical conductivity).
ERT was used to provide a continuous cover along the
SP profiles (Fig. 3) to get quantitative information about
their geo-electric properties. A 2-D resistivity tomography
profile was obtained using the Terrameter Lund Imaging
System (ABEM Instruments) using a 64 electrode array.
A Schlumberger configuration was used with a compro-
mise unit electrode spacing of 2 m in the central part of the
profile and 5 m near the border to obtain information for a
thickness of 25–30 m with suitable precision. We chose a
sigma (typical deviation) of 0.1% for the data acquisition
and a weighting of 4 samplings.
Fig. 2 A 3-D view of the topographical survey. This survey was
acquired with differential GPS. The map shows the locations of the
acquired profiles (three electrical profiles and three seismic profiles).
The coarse tailings piles were topographically mapped using a basic
unit ‘relief grid’. For more information, see the text
56 Mine Water Environ (2012) 31:53–61
123
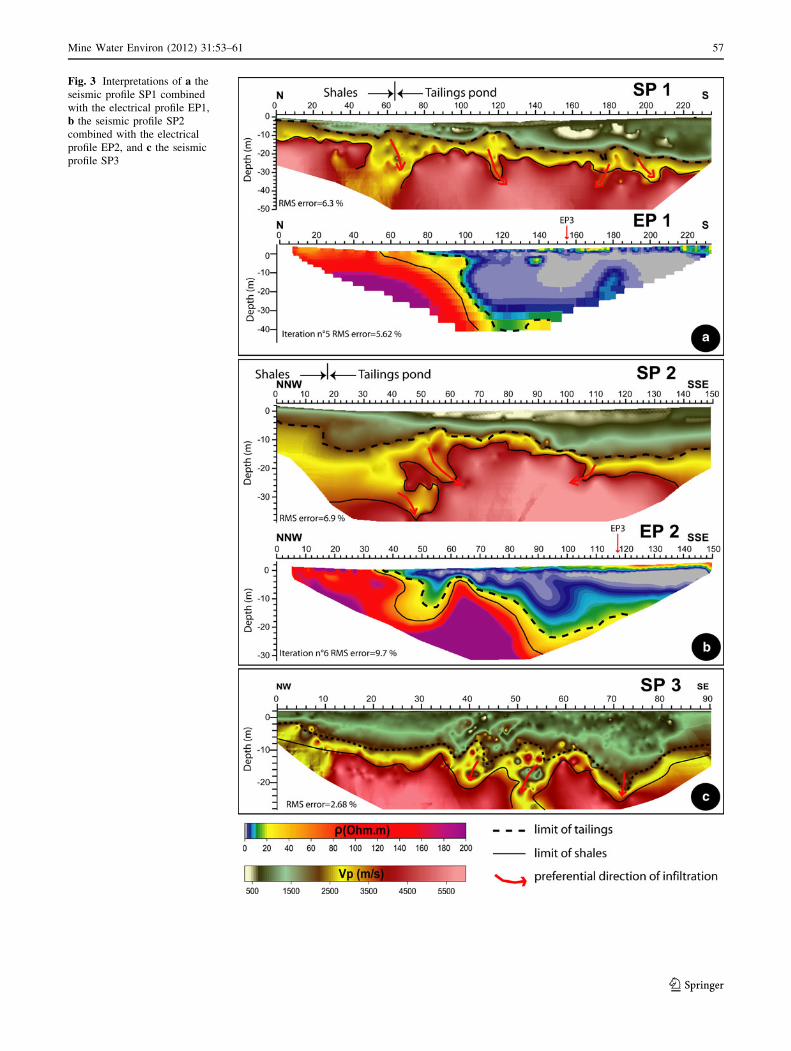
Fig. 3 Interpretations of a the
seismic profile SP1 combined
with the electrical profile EP1,
b the seismic profile SP2
combined with the electrical
profile EP2, and c the seismic
profile SP3
Mine Water Environ (2012) 31:53–61 57
123

The data collected are called apparent resistivities
because they are influenced by the resistivities of all of the
layers that the current has crossed. To determine apparent
resistivities, we must calculate the real resistivities of the
ground. ERT data must be inverted to produce detailed
electrical structures of the cross-sections below the survey
lines; these are classically presented as pseudo-sections.
These measured pseudo-sections include topographic
variations for processing with a 2-D inverse modeling
technique, and to give the estimated true resistivities.
Schematically, the subsurface is divided into a grid in
which each cell is assigned a resistivity value. Usually, the
initial model is an average of the apparent resistivities from
the field data (experimental apparent resistivity). Through
this initial model, we calculate the apparent resistivities
(calculated apparent resistivity), and the difference
between the experimental apparent resistivities allows for
the modification of the cell resistivity (real resistivity)
values and for the generation of a second 2-D model; the
iterative process continues until the differences between
the apparent calculated and apparent experimental resis-
tivities (% RMS) are minimal.
The ERT data were inverted using the software package
Res2DInv (Geotomo Software, possessed by Instituto
Andaluz de Geofisica, Granada, Spain). The inversion
process used in this forward modeling program is based on
the robust-constrained least-squares method (Loke and
Barker 1996). This produces a model that emphasizes the
vertical resistivity features, because in the geological
context, sharp interfaces between the different units are
expected. We choose the following inversion options: (a) a
model refinement that allows us to get model cells with a
width equal to half the unit electrode spacing. This helps to
obtain more accurate results when large resistivity changes
are expected near the ground surface, (b) a maximum
number of iterations, equal to 9, for the inversion process,
The ERT data were also processed and interpreted by
geophysicists of the Laboratory of Applied Geophysics,
University and Polytechnic Institute of Lasalle-Beavais,
France). The results converge with those resulting from
inversion made in Granada. For the all profiles, the root
mean square (RMS) error was less than 10%.
Seismic Survey
Seismic refraction tomography is a geophysical method
that generates and records elastic refraction waves from
the ground boundaries; these layers reflect changes in the
mechanical properties of strata at the Earth’s surface. The
current practice is to employ a seismic source (in this case, an
8 kg hammer) and to record the wave-front propagation over
the terrain surface through an array of receivers. In most
cases, the geophones are placed at a fixed distance from one
another, and a predetermined number of shots (hammer
strikes) should be taken along the survey. We set off shots at
10 m intervals along realized seismic profiles. Our field data
were acquired with a Stratavisor (Nz-24, Geometrics Inc.)
seismograph with an array of 48 geophones.
Seismic profiles were constructed on the same days, and
in close proximity, to the ERT profiles. Their lengths
ranged from 115 to 235 m with geophones spaced at dis-
tances of 3 and 5 m. Profiles SP1 and EP1 (Fig. 2) were
coincident so that we could correlate the two geophysical
responses.
For each shot, a seismic register was created to record
the arrival times of the waves at each geophone. We cal-
culated the velocities of the propagation waves based on
the geometry of the sensor array. The seismic velocities
were affected by the mechanical properties, the lithology,
and the extent of compaction of the materials. In the
present study, the seismic response did not allow us to
delineate the boundary between the tailings and substrate,
due to comparable compactness between the two, but we
were able to identify velocity variations within the tailings
and the substrate, which we attributed to preferred zones of
AMD circulation.
The seismic refraction tomography method is based on
the timing of P-refraction waves and results in P-velocity
models (2-D). The geophysical inversion process begins
with calculating all times for all ray-paths starting from a
shoot point and ending at the geophones. These rays record
mechanical information of the entire path; therefore, this
information must be sorted and assigned to the corre-
sponding subsurface location. This sorting is achieved with
specific inversion algorithms [wavepath Eikonal travel
time (WET) tomography processing; Lecomte et al. 2000].
Similar to the electric inversion schema, the subsurface is
divided into a grid in which each cell is assigned one
velocity value. In most cases, the initial model is an
average of the velocity ray-paths. The first stage is to
calculate the arrival times of each ray, i.e., the time cor-
responding to each shot-geophone pair. Second, these
calculated times are compared with the experimental times,
and their difference is used to modify the velocity values in
each cell, and then generate a second 2-D model. This
iterative process continues until the differences between
the apparent calculated and apparent experimental resis-
tivities (% RMS) are minimal. We used RayFract (V 3.18,
Intelligent Resources Inc.) code for the processing of this
seismic data.
Results and Discussion
Seismic profiles have been proposed as a means to distin-
guish the basement morphology of shales because the
58 Mine Water Environ (2012) 31:53–61
123

lithology of the basement is more compact than the tail-
ings. The black or altered shales investigated in this study
had resistivity values between *60 and 500 X m, which
varied due to the presence or absence of quartzite seams.
These resistivities are regarded as an upper limit to dis-
tinguish the uncontaminated shales.
To correlate the electrical and seismic geophysical
responses of the materials present in the study area, we
ensured that the seismic profile SP1 coincided with the
electrical profile EP1 and that the electrical profile EP2 was
parallel with SP2 (Fig. 2).
The section profile EP1 shows a low resistivity zone
(\15 X m) beginning at a distance of 75 m, which reflects
the tailings ponds. This zone can reach a depth of more
than 40 m at the core of the dam. This suggests that tailings
were stockpiled in a large pit located to the east of the
tailings pond. At the 100 m distance, towards the initial
extreme of the profile, the resistivity increased signifi-
cantly, with values higher than 80 X m (Fig. 3a). This
transition occurred gradually and in a vertical direction.
The boundary with a yellow-orange colour corresponds to
the top of the altered or black shales. The high resistivities
of the shales may be explained by the presence of quartz
seams. Two boundaries are defined: the limit of the mine
tailings (at 15 X m) and the top of the shales (60 X m).
The SP1 seismic profile also shows three layers. The
first layer has an average velocity between 350 and
2,000 m/s, with a thickness ranging from 8 m in the north
to 20 m in the extreme south. This layer corresponds to the
tailings pond deposits. The second interpreted layer has a
velocity between 2,000 and 3,800 m/s, with an irregular
morphology, and corresponds to the altered shales. Below
this layer, there is a third layer with a velocity average of
4,000 m/s, corresponding to the shales. The transition
towards the shales is described by an increase in velocity in
a narrow horizon (Fig. 3a). The two defined boundaries:
the limit of the tailings (1,800 m/s) and the limit of the
shales (3,800 m/s).
The obtained pseudo-section of the EP2 profile shows
low resistivity (15 X m) values starting at a distance of
40 m. This profile corresponds to the materials affected by
AMD; the depth of this effect expands for 20 m at a dis-
tance between 84 and 104 m (Fig. 3b). A resistant body is
located at a distance between 62 and 64 m, which divides
two polluted zones: a great area towards the centre-south of
the tailings pond and a small area towards the north. The
high resistivity area corresponds to the fresh shales. The
irregular boundary between high and low resistivity indi-
cates the top of altered shales (the limit of the tailings).
Three horizons were also interpreted in the SP2 seismic
model. The first horizon, with an average velocity ranging
between 350 and 2,000 m/s and a thickness between 5 and
18 m, is composed of tailing pond deposits. Between a
distance of 52 and 90 m, a layer with a very low velocity
(\500 m/s) was detected, which corresponds to the much
altered tailings pond at the surface. The following seismic
horizon has an average velocity of 3,000 m/s and corre-
sponds to the altered shales. As demonstrated in profile
SP1, the transition between the altered and unaltered shales
is very well defined, especially towards the northern part of
the study area. The third layer corresponds to the almost
unaltered shales, with an average velocity of 3,800 m/s (the
limit of the shales).
The SP3 seismic profile also shows three layers
(Fig. 3c); the first layer has an average velocity between
350 and 2,000 m/s. This layer has an irregular morphology
and corresponds to the tailings pond deposits. The second
interpreted layer has a velocity between 2,000 and
3,800 m/s and corresponds to the altered shales. Below this
layer, there is a third layer with a velocity average of
4,000 m/s, corresponding to the unaltered shales. The
tailings substrate (indicated by arrows) clearly act as pre-
ferred flow zones for the AMD.
In this study, the geophysical methods used highlighted
the following points: the electrical resistivity of the tailings
(\20 X m) is definitely different from the shale substrate
([80 X m). This was also confirmed by the previous study
(Lghoul et al. 2012). Since, in this context, the resistivity is
primarily related to the electrolytes, we think that this
boundary between the tailings and substrate is most real-
istic. The boundary provided by the seismic method does
not always coincide with that given by ERT; we think that
cementation of the lower part of tailings conferred com-
pactness comparable with that of the higher altered part of
the substrate, which makes it difficult to use the method to
differentiate the two materials. However, the highlighted
seismic zones with low velocities should correspond to the
more altered zones of the tailings and are rooted in the
substrate (Fig. 3 SP1, SP2, and SP3). These are zones
which could constitute preferred paths of AMD circulation.
The fractures and N50�-oriented micro-fractures apparently
act as preferential drains of leachates, and so these micro-
fractures are being eroded and altered by the leachates
(Lghoul et al. 2012). Underground flow would be prefer-
entially directed along these structures.
The resistivity and seismic velocity increase from the
top to the bottom of the tailings pond and correspond to the
compaction of this material. The high values in resistivity
and seismic velocity of the shales correspond to the pres-
ence of quartzite seams.
Figure 4 shows the three electric profiles and the two
seismic profiles located in the western part of the study
area. In these schematic models, three major layers were
defined for each profile: the first layer corresponds to
altered materials (tailings pond), the second corresponds to
the altered shales and the third corresponds to the unaltered
Mine Water Environ (2012) 31:53–61 59
123

shales. The electric profiles describe two major zones of
the expansion of leachate present on both sides of the
central dyke.
The waste volumes calculated using the 2-D geophysical
models coupled with relatively little geological data may
have led to an initial overestimation of waste volumes
(Chambers et al. 2005). Moreover, the resistivity model
provides only an approximate guide to the subsurface
resistivity distribution, due to the smoothing and averaging
effects and the decreased resolution with depth inherent in
the smoothness-constraint inversion technique.
We have considered, in calculating the volume of
wastes, the ERT-defined boundary between the tailings and
the precise topographical measurements made at the sur-
face. Isosurfaces were used to define waste volumes with
resistivities below 15 X m. The 15 X m contour fell at a
depth broadly corresponding to the estimated depth to
bedrock indicated by the resistivity model and site inves-
tigation data. The volume of the western area tailings pond
is estimated at 176,200 m3. The estimated volume of the
eastern area tailings is substantially greater, at 286,200 m3.
The oxidation of 1,341,000 t (the specific gravity of the
tailings is 2.9) of fine tailings containing 4 wt% of sulphide
sulphur will release more than 161,000 t of sulphates. This
high sulphate load may be critically detrimental to the local
water resources. The average sulphate production rate of
fine tailings is very high: 2,000–8,000 mg SO4/kg/week
(Hakkou et al. 2008b). This suggests that fine tailings will
continue to release acid and sulphates for a long time.
According to the geophysical interpretation, infiltration
should preferentially flow towards the altered shales,
particularly in the north. The most important infiltration
zone is located to the west of the central dyke.
Conclusion
The electrical tomography data showed close agreement in
the physical properties of the area and the presence of con-
ductive zones and their characteristics. The seismic refrac-
tion data, though better suited to stratigraphic environments,
complemented the other geophysical information.
Additionally, using seismic refraction, we imaged the
structure of the underlying subsoil and leakage pathways in
the bedrock that could work as AMD conduits. These results
show that joint use of these geophysical methods can be
successfully employed to provide a better understanding of
how geological features develop at depth and to estimate the
extent of AMD. They also allowed us to categorize the
materials into three categories. The first category corre-
sponds to the tailings, which have low resistivity (5–15 X m)
in the electric profiles and low velocity (500–1,800 m/s) in
the seismic profiles. The second layer corresponds to the
altered, black shales, which have intermediate resistivity
(20–60 X m) and velocity (2,000–3,800 m/s). The last cat-
egory, with high resistivity and velocity ([60 X m and
[4,000 m/s, respectively) corresponds to the unaltered
shales associated with quartzite seams.
The tailings pond contains 1,780,000 t of wastes, which
will release more than 280,000 tons of sulphate. AMD
generation will continue for decades or centuries if no
remedial actions are taken. The broken and altered shales
will facilitate AMD infiltration.
This work reveals that joint use of geophysical techniques
enables a complete environmental characterisation of mine
sludge structures, allowing the monitoring and estimation of
potential pollution. Geophysical results will also help locate
where best to drill to confirm the depth of tailings.
Acknowledgments This work was supported through the Interna-
tional Research Chairs Initiative, a program funded by the Interna-
tional Development Research Centre, and by the Canada Research
Chairs program, Canada. The authors also thank the AECI (Agencia
Espanola de Cooperacion Internacional, Ref. A/025780/09) and
Comites Mixtes Interuniversitaires Franco-Marocaine (Action In-
tegree n�MA/09/209) for their financial and technical support.
References
Burger HR, Sheehan AF, Jones CH (2006) Introduction to applied
geophysics: exploring the shallow subsurface. WW Norton and
Company, New York City
Buselli G, Lu K (2001) Groundwater contamination monitoring with
multichannel electrical and electromagnetic methods. J Appl
Geophys 48:11–23
Fig. 4 A 3-D synthetic model of the acquired profiles; three layers
were identified: the first corresponds to the affected materials, the
second to the altered black shales, and the last to the unaltered shales.
These layers are bounded by the limit of the tailings and the top of the
shales
60 Mine Water Environ (2012) 31:53–61
123
Campbell DL, Fitterman DV (2000) Geoelectrical methods for
investigating mine dumps. In: Proceedings of 5th international
conference on acid rock drainage (ICARD), Soc for Mining,
Metallurgy and Exploration, Littleton CO, USA, pp 1513–1523
Chambers JE, Meldrum PI, Ogilvy RD, Wilkinson PB (2005)
Characterization of a NAPL-contaminated former quarry site
using electrical impedance tomography. Near Surf Geophys
3:79–90
Chouteau M, Poisson J, Aubertin M, Campos D (2005) Internal
structure and preferential flow of a waste rock pile from
geophysical surveys. In: Proceedings of symp for the application
of geophysics to environmental and engineering problems
(SAGEEP), pp 289–297
Cidu R, Frau F, Da Pelo S (2011) Drainage at abandoned mining
sites: natural attenuation of contaminants under different
seasons. Mine Water Environ 30:113–126
Evangelou VP (1995) Pyrite oxidation and its control. CRC Press,
Boca Raton
Guerin R, Begassat P, Benderitter Y, David J, Tabagh A, Thiry M
(2004) Geophysical study of the industrial waste land in
Mortagne-du-Nord (France) using electrical resistivity. Near
Surf Geophys 3:137–143
Hakkou R, Benzaazoua M, Bussiere B (2008a) Acid mine drainage at
the abandoned Kettara mine (Morocco). 1. Environmental
characterization. Mine Water Environ 27:145–159
Hakkou R, Benzaazoua M, Bussiere B (2008b) Acid mine drainage at
the abandoned Kettara mine (Morocco). 2. Mine waste geo-
chemical behavior. Mine Water Environ 27:160–170
Hakkou R, Benzaazoua M, Bussiere B (2009) Laboratory evaluation
of the use of alkaline phosphate wastes for the control of acidic
mine drainage. Mine Water Environ 28:206–218
Huvelin P (1977) Etude geologique et gıtologique du massif
hercynien des Jebiletes (Maroc occidentale). Notes et Memoires
du Service Geologique du Maroc, 232 bis, p 307
Kleinmann RLP, Crerar DA, Pacelli RR (1981) Biogeochemistry of
acid mine drainage and a method to control acid formation.
Mining Eng 79:300–305
Lecomte I, Gjoystdal H, Dahle A, Pedersen OC (2000) Improving
modeling and inversion in refraction seismics with a 1rst-order
Eikonal solver. Geophys Prospect 48:437–454
Lghoul M, Kchikach A, Hakkou R, Zouhri L, Guerin R, Bendjoudi H,
Teıxido T, Pena JA, Enrique L, Jaffal M, Hanich L (2012) Etude
geophysique et hydrogeologique du site minier abandonne de
Kettara (region de Marrakech, Maroc): contribution au projet de
rehabilitation. Hydrolog Sci J 57:1–12
Loke MH, Barker RD (1996) Rapid least squares inversion of
apparent resistivity pseudosections by a quasi-Newton method.
Geophys Prospect 44:131–152
Marti9n-Crespo T, De Ignacio-San JoseC, Gomez-Ortiz D, Marti9n-
Velazquez S, Lillo-Ramos J (2010) Monitoring study of the mine
pond reclamation of Mina Concepcion, Iberian Pyrite Belt
(Spain). Environ Earth Sci 59:1275–1284
Marti9nez-Pagan P, Faz-Cano A, Aracil E, Arocena JM (2009)
Electrical resistivity imaging revealed the spatial properties of
mine tailing ponds in the Sierra Minera of southeast Spain.
J Environ Eng Geophys 14:63–76
Nasab N, Hojat A, Kamkar-Rouhani A, Javar HA, Maknooni S (2011)
Successful use of geoelectrical surveys in Area 3 of the Gol-e-
Gohar iron ore mine, Iran. Mine Water Environ 30:208–213
Placencia-Gomez E, Parviainen A, Hokkanen T, Loukola-Ruskeeni-
emi K (2010) Integrated geophysical and geochemical study on
AMD generation at the Haveri Au–Cu mine tailings, SW
Finland. Environ Earth Sci 61:1435–1447
Poisson J, Chouteau M, Aubertin M, Campos D (2009) Geophysical
experiments to image the shallow internal structure and the
moisture distribution of a mine waste rock pile. J Appl Geophys
67:179–192
Ramalho E, Carvalho J, Barbara S, Monteiro Santos F (2009) Using
geophysical methods to characterize an abandoned uranium
mining site, Portugal. J Appl Geophys 67:14–33
Rucker DF, Glaser DR, Osborne T, Maehl WC (2009) Electrical
resistivity characterization of a reclaimed gold mine to delineate
acid rock drainage pathways. Mine Water Environ 28:146–157
Shemang EM, Laletsang K, Chaoka TR (2003) Geophysical inves-
tigation of the effect of acid mine drainage on the soil and
groundwater near a mine dump, Selebi-Phikwe Cu-Ni Mine, NE
Botswana. In: Proceedings of SAGEEP, pp 930–937
Singer PC, Stumm W (1970) Acidic mine drainage: the rate
determining step. Science 167:1121–1123
Sjodahl P, Dahlin T, Johansson S (2005) Using resistivity measure-
ments for dam safety evaluation at Enemossen tailings dam in
southern Sweden. Environ Geol 49:267–273
Vanhala H, Raisanen ML, Suppala I, Huotari T, Valjus T, Lehtimaki J
(2005) Geophysical characterizing of tailings impoundment: a
case from the closed Hammaslahti Cu–Zn mine, eastern Finland.
Geological Survey of Finland, Current Research (2003–2004),
special paper 38, pp 49–60
Mine Water Environ (2012) 31:53–61 61
123