electric versus steam energy for pipe-line tracing
TRANSCRIPT

IEEE TRANSACTIONS ON INDUSTRY AND GENERAL APPLICATIONS, VOL. IGA-6, NO. 5, SEPTEMBER/OCTOBER 1970
Electric versus Steam Energy for Pipe-Line TracingROGER L. DECKER
Abstract-Under no-flow conditions, the energy required tomaintain a given temperature on a pipe line is directly proportionalto the product of the line temperature above ambient and the timethat the temperature is maintained. Since outside ambient tem-perature varies as a sine curve about the average temperature, theamount of heat required is also continuously changing. On a linetraced to prevent freezing manually, controlled, or uncontrolled,steam will expend over 700 percent more energy to maintain thetemperature than will electric tracing. With flow in the pipe, theheat wasted by steam can be even greater since the flowing materialacts as a heat sink. Since the flow conditions affecting heat lossvary greatly, each installation must be calculated separately. It isquite possible that a steam tracer will expend energy at its maximumrate under conditions that would not require any heat. Steamtracing is more efficiently used on lines requiring a temperatureapproaching that of the tracing steam.
INTRODUCTIONONE of the factors an engineer must weigh in choosing
between steam and electric power for pipe-linetracing is the cost of energy. Typical comparative costsper million Btu might be
electricity $1 . 00steam 0. 59.
Too often, only the unit cost of energy has been con-sidered, and the much greater efficiency of the electricheaters has been overlooked. This paper will consider theeffect of efficiency on energy cost. In so doinig, an attemptto show where each method of heating is most effectivelyapplied will be made.
DISCUSSIONThis comparison of the energy expended in supplying
make-up heat in pipe-line tracing is based on
1) uncontrolled 100-psig steam with saturation tem-perature of approximately 338°F;
Paper 69 TOD 137-IGA, approved by the Electric Process Heat-ing Committee of the IEEE IGA Group for presentation at the 1969Biennial Conference on Electric Process Heating in Industry, Phil-adelphia, Pa., April 23-24. Manuscript received May 11, 1970.The author is with the American Oil Company, Whiting, Ind.
46394.
ea~~~~~~t01
Fig. 1. Typical cross section of traced pipe.
2) average daily temperature at the Midway Airport,Chicago, Ill.;
3) thermostatically controlled electric power.
As shown in Fig. 1, heat can leave the tracer eitherthrough the insulation to the surrounding air Q, or throughthe pipe wall to the fluid in the pipe Q2. If there is flow inthe pipe, heat can also enter or leave the system viathe fluid. Case I will consider stagnant or no flow condi-tions, and Case II will consider conditions with flow in thepipe.
Case I: Static Conditions, No Flow
The energy expended in heating a line is directlyproportional to the product of the line temperature aboveambient and the time that the temperature is maintained.This product is hereafter referred to as degree-days.The temperature of a line heated by uncontrolled
steam t, must always be the desired line temperature T1minus the minimum expected ambient temperatureTa mi above ambient ta, except that in no case can theline temperature exceed the temperature of the tracersteam.
In equation form
ts = T1- Ta mmin + t0. (1)
For a line heated to prevent freezing, the design tem-perature is normally 40°F, and the minimum ambient isconsidered to be - 100F.
517

IEEE TRANSACTIONS ON INDUSTRY AND GENERAL APPLICATIONS, SEPTEMBER/OCTOBER 1970
TABLE IAVERAGE TEMPERATURE AT MIDWAY AIRPORT, CHICAGO, ILL.*
MonthSep- Octo- Nov- De-
Day January February March April May June July August tember ber ember cember
1 27 27 31 43 56 66 75 76 71 62 48 342 27 27 31 43 56 66 75 76 71 61 47 333 27 27 32 44 56 67 75 76 70 61 46 334 26 27 32 44 57 67 75 76 70 61 45 325 26 27 32 45 57 68 75 76 70 61 45 326 26 27 33 45 57 68 75 76 69 60 45 327 26 27 33 45 57 68 75 76 69 60 44 318 26 27 33 46 58 69 75 76 69 59 44 319 26 27 34 46 58 69 76 76 68 59 43 3110 26 27 34 47 59 69 76 76 68 59 43 3111 26 27 35 47 59 70 76 76 68 58 42 3012 26 28 35 48 59 70 76 76 67 57 42 3013 26 28 35 48 60 71 76 76 67 57 41 3014 26 28 36 49 60 71 76 75 67 57 41 2915 26 28 36 50 60 71 76 75 67 56 40 2916 26 28 36 50 60 71 76 75 67 56 40 2917 26 28 37 50 61 72 76 75 66 56 39 2918 26 28 37 51 61 72 76 75 66 55 39 2919 26 28 38 51 61 72 76 75 66 55 38 2920 26 28 38 51 62 73 76 74 66 54 38 2821 26 28 38 52 62 73 76 74 65 54 38 2822 26 29 39 52 62 73 76 74 65 53 37 2823 26 29 39 53 63 73 76 74 65 52 37 2824 26 29 39 53 63 74 76 73 64 52 36 2825 26 29 40 53 63 74 76 73 64 51 36 2726 26 30 40 54 64 74 76 73 64 51 36 2727 26 30 41 54 64 74 76 73 63 50 35 2728 26 30 41 55 64 74 76 72 63 50 35 2729 26 42 55 65 75 76 72 62 50 34 2730 26 42 56 65 75 76 72 62 49 34 2731 27 43 66 76 71 48 27
* From U.S. Department of Commerce, weather bureau local climatological data.
From (1)
ts = 400 - (100) + ta(la)
ts = 50 + ta.
For a day of - 10°F ambient
ts = 50°- 100 = 40°F.
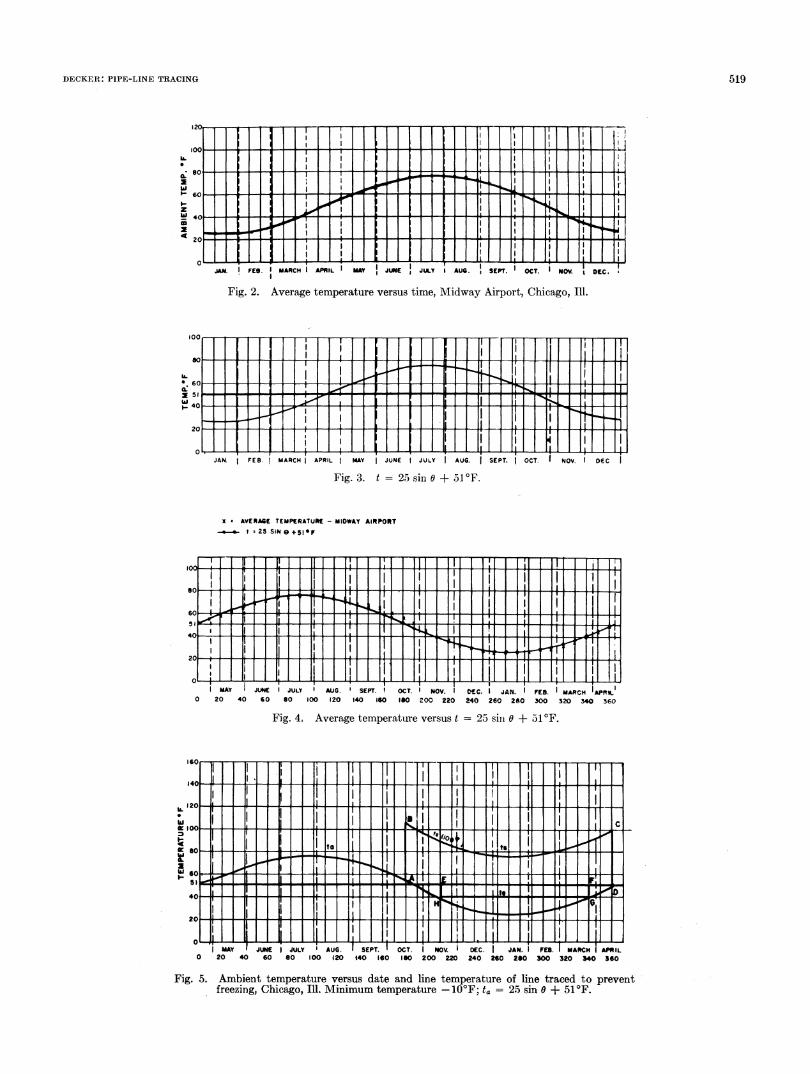
The daily average temperature at the Midway Air-port, Chicago, is tabulated in Table I and shown graphi-cally in Fig. 2. From Fig. 2 we note that the curve ofaverage temperature is sinusoidal and find that it can be.closely represented by the equation
ta = 25 sin a + 51°F (2)
where t0 is the average ambient temperature at anydate, 0 is the angle obtained by multiplying the numberof days N beyond day 1 of that date by the ratio 360(degrees in a circle)/365 (days per year).Day 1 is April 19, and
0 = 0.987N. (3)
The curve ta, = 25 sin 0 + 51°F is plotted in Fig. 3 andreplotted in Fig. 4, where April 19 is day 1. The averageambient temperature is also shown in Fig. 4 for comparison.
Fig. 5 is the average-temperature curve plotted withApril 19 as day 1, and the temperature of a line traced toprevent freezing by both steam and electricity super-imposed. The curve ABCD shows the steam-traced linetemperature. The curve HG shows the electrically tracedline temperature. Operational procedure requires thesteam tracers for such lines to be turned on October 15and turned off April 15. The areas between these curvesand the average ambient-temperature curve representsthe degree-days of energy expanded in heating.For electric tracing, the area is calculated as follows:
rF rFf t dO = 25 sinG dO = 25(cos O)EF.
From Table I (or Fig. 2), H = November 15, or day211, and G = M\Jarch 25, or day 341, giving a heatingseason of 130 days. From (3) at E, 0 = 0.987 X 211 =
2070 and at F, 0 = 0.987 X 341 - 3350. Expanded to thecorrect units of degree-days,
Ft dO = 1454'cos 335°-cos 207°)
= -2610 degree-days.
518
DECKER: PIPE-LINE TRACING
os
w
_-40 F O gIJ|4u.|E|X
I.-I
JAN. FE. I MARCHI APIL MAY JUNE JULY I AUG. SSEPT. OCT. NOV. IDC.E
Fig. 2. Average temperature versus time, Midway Airport, Chicago, Ill.
100
80
Ui.60IL2 5HSI I----11 :slWDw
JAN. FEB. MARCH APRIL MAY JUNE JULY | AUG. | SEPT. | OCT. I NOV. DEC
Fig. 3. t = 25 sin 0 +51°F.
X * AVERAE TEMPERATURE - MIDWAY AIRPORT2t25 SINO+51OF
60 1Li tl
LI[g{1l:: Ih
MAY JUNE JULY AUG. SEPT. OCT. 0Y. DE C. I JAN. FEB. MARCH APRIL0 20 40 60 so 00 120 140 160 1IS 200 220 240 260 280 300 320 34 360
Fig. 4. Average temperature versus t = 25 sini 0 + 51°F.
ISO
140-soSl:il toi1llXN j!:tsol 0010} 0 1i ;l 11111 1 1
o' l; I T{ L ! tl40
I-~~~~~~~~~~~~~~~~~~~~~~~~~~~~-
0
Fig. 5.
519
MAY JUNE JULY AUG. SEPT. OCT. NOv. DEC. JAN. ES.IMARCHIAIL20 40 60 80 100 120 t40 160 1S 200 220 240 260 2S0 300 320 340 360
Ambient temperature versus date and line temperature of line traced to preventfreezing, Chicago, Ill. Minimum temperature - 10°F; te = 25 sin 0 + 51 OF.

IEEE TRANSACTIONS ON INDUSTRY AND GENERAL APPLICATIONS, SEPTEMBER/OCTOBER 1970
7.0
6070 "iN, IIIII11
43.C - -0
I. - - - - --C. - 4-
0 20 40 60 o 00 120 140 160 180 200 220 240 260 280 300 320 340
LINE TEMPERATURE *F
Fig. 6. Ratio E,/Ee versus line temperature.
TABLE II
LowestTem- Ee/Ee
perature (40°Fin line
Normal tem-Location Year ta perature)
Bismarck, N.D. -40°F 31.5 sin 0 + 39.50F 4.85St. Louis, Mo. -10°F 25 sin O + 550F 12.2Norfolk, Va. 10OF 18.5 sin 0 + 58.50F a)*
* Minimum mean temperature at Norfolk is approximately39.5°F. See Figs. 7, 8, and 9.
The negative sign, having no physical significance, canbe dropped. 2610 degree-days is the total area below theline EF (Fig. 5). However, the energy expended byelectric heat is the area below the line HG. Subtracting thearea HEFG from the total area results in
2610 degrees-days - [(51-40) degrees X 130 days]
-1180 degree-days.
The equation of the steam-traced line temperature is
ts = 500 + 4, (4)
For a line temperature of 400F, the ratio of the einergyexpended by steam ES to the energy expended by elec-tricity Ee is
Es 9100 degree-days= ~~~~=7.72.
Ee 1180 degree-days - 7
For a line temperature of 76°F
Ee = (76°F - 51°F) X 365 days/year= 9125 degree-days/year
ts = 76 - (-100F) + tabut
ta = 250 sinl + 51 F (5)
then
ts 25' sin 0 + 101°F
ts - ta - 50°F.
From Fig. 5, the steam tracers are turned on October15, or day 180, and are turned off April 15, or day 362.The duration of the steam heating season is
362 - 180 = 182 days.
The energy expended is
500 X 182 days = 9100 degree-days.
(6)4, = 860F + 25 sin 6 + 51°F
4, = 25 sin 6 + 137°F
ts - ta = (25 sin 0 + 137°F)- (25 sin 0 + 510F) = 86°F
Es = 86°F X 365 days/year
= 31 400 degree-days/year
Es 31 400 degree-days/yearEe 9125 degree-days/year
For a line temperature of 1000FEe = (100 - 76) X 365 + 9125
= 17 875 degree-days/year
520

521DECKER: PIPE-LINE TRACING
h6
I-hia-
_I
0
Fig. 7.
LA6
IL-4£
MAY JUNE ILT AUG. i .SEPT. I OCT. i NOV. DEC. IJAN. itFE. MAR. APRJ20 40 60 SO 100 20 140 1SO IS 200 210 240 260 250 30 320 3 3O
Ambient temperature versus time, Bismark, N.D. Minimum temperature -40°F;t. = 31.5 sin 6 + 39.5°F.
20 t
-20W S S H XtMAY JUNE JULY | AUG. SET. OCT. OV DEC. JAN-. FE2. NW. APR.I
0 20 40 60 S0 100 120 140 160 1IS 200 220 240 M 2O 300 320 340 360
Fig. 8. Ambient temperature versus time, St. Louis Mo. Minimum temperature - 10°F;ta = 25 sin 0 + 55°F; November 1 is date when increasing probability of frost in fall reaches10 percent; April 15 is date when decreasing probability of frost in spring reaches 10percent.
1000|so 1jw60 W W E.IX.| O.I E.IJK I Ft| . A.
2c 40 60 so 100 120 140 160 IW 200 220 240 260 2S0 300 3W 340 360
Fig. 9. Ambient temperature versus time, Norfolk, Va. iMinimum temperature 10°F; ta =
18.5 sin 0 + 58.50F; November 15 is date when increasing probability of frost in fallreaches 10 percent; April 1 is date when decreasing probability of frost in spring reaches10 percent.
ooo
100
-20
.can
v:
a
<1 O
lic11
IL
0
ti-1
4

IEEE TRANSACTIONS ON INDUSTRY AND GENERAL APPLICATIONS, SEPTEMBER/OCTOBER 1970
a.
I~-
2I
STOAMSAT+5 AM0IENT
?o &44%AMBENTSF%LLO5 _ 5(SU W H 00-20 20 24000v-S55-__ ___-ITOUT TR CER TRACI
5C -__ ___ .__ _. .___.20°l~GAMBENT 100% FL
ELECTRIC I ACER OFF 20AM1311NT 44% FLOM_W
4-o 4000 czoo 12000D ALO 2PIPE 24000
DISTANCE ALONG PIPE IN FEET
Fig. 10. Pipe temperature versus distance from inlet; 4-inch water line, 1-inch insulationl,100-psig tracer steam, 36-Btu/hr/ft tracer capacity.
;Es =110 X 365 = 40 100 degree-days/year
Es 2.25.Ee
In general, as the desired line temperature approachesthe temperature of the tracer steam, the energy expendedby electricity approaches the energy expended by steam,and the ratio ES/Ee approaches 1, as shown in Fig. 6.When Es/Ee = cost of electricity/cost of steam, energy
costs are equal. Lines with temperatures above thistemperature can be more cheaply traced by steam. Lineswith temperatures below this temperature can be more
cheaply traced with electricity.For example, if steam costs $0.59/million Btu and
electricity costs $1.00/million Btu ($0.00343/kWh),then the energy costs are equal when
Es cost of electricity $1.00= = = ~~~~~~1.695.
Ee cost of steam $0.59
From Fig. 6, when Es/Ee = 1.695, the line temperatureis 138°F.
Likewise, assuming that the steam-heating season
extends from the date when the increasing probability offrost in fall reaches 10 percent to the date when the de-creasing probability of frost in spring reaches 10 percent,the data for other selected areas are as tabulated inTable II (Figs. 7-9).
Case II: With Flow in PipeWith flow in a traced pipe, heat can enter the system
from either the tracer or the fluid flowing in the pipe.In many cases, the heat entering a pipe via the fluid flowwill maintain the desired temperature, making energyfrom the tracer unnecessary. The electric tracer, beingcontrolled by a thermostat, will not be energized so longas the heat from the incoming fluid maintains the desiredline temperature. The steam tracer will remain hot and,in many cases, will dissipate its entire capacity into thefluid flowing in the pipe.
The following example illustrates this point. Maintain a
temperature of 40°F in a 4-inch water line, 1-inch in-sulation thickness, 10-ft/s flow rate, 100-psig tracersteam, incoming water at the average ground-watertemperature of 550F, minimum expected ambient tem-perature -20°F, average ambient temperature 51°F,
A\T = -20°F - 40°F = 60°F, heat loss = 30 Btu
ft/hr
Add 20 percent for damaged thermal insulation. Totaltracer design capacity = 36 Btu/ft/hr. A foot-longsection of incoming water weighs 5.51 pounds and at a
flow rate of 10 ft/s will traverse 36 000 feet of pipe in 1hour. It can lose 5.51 pounds X 1 Btu/lb/°F X 15'F =
82.65 Btu before cooling to 40°F. The approximatetemperature of the pipe line is shown in Fig. 10 forvarious conditions of ambient temperature and flow.(All temperatures shown are based on heat loss of 36Btu/hr/ft.)We can readily calculate that a flow rate of 0.121 ft/s/
1000 feet of line will maintain an outlet temperature of 40°Fin a - 20°F ambient. In more familiar terms, 4.8 gal/mim1000 ft are required for 40°F outlet temperature.Each line to be heated must be analyzed for entering
fluid temperature, heat content, rate of flow, and percenttime for given rate of flow. However, flow in a pipe can
only increase the spread in heat dissipated by the twosystems. For the electric tracer the condition of no flow isthe worst case. For the steam tracer the condition of flowis the worst.So far only the inefficiency due to lack of control of
steam has been considered. Additional heat is lost at thetraps. Of the 1166 Btu required to raise one pound of55°F water to 100-psig steam, approximately 286 Btuor nearly 25 percent are wasted at the trap. Correcting theprevious example to allow for trap loss we have
E. X 1.25 cost of electricity $1.00_ = 1.36.
Ee cost of steam $0.59
522
2900 32000 30

523DECKER: PIPE-LINE TRACING
From Fig. 6 when ES/Ee = 1.36, the line temperatureis 220°F. For the stated power costs and climate condi-tions (Chicago), the energy costs will be less for stagnantlines at 220°F or below, if they are traced electrically.If there is flow in the line, this temperature limit willincrease.This paper is limited to a comparison of the energy
cost, but this is only one of the factors that enter into thechoice between steam and electricity for pipe-line tracing.Reliability, safety, temperature, temperature control,installation cost, and maintenance cost must also beconsidered. Properly designed and installed electricaltracing will compare favorably with steam in each of thesefacets.
CONCLUSIONFrom an energy-cost view, electrical tracing is most
economically used
1) under stagnant conditions at lower pipe-linetemperatures and
2) under most flow conditions, especially when thetemperature of the entering fluid exceeds therequired line temperature.
The maximum economical temperature for electric tracingincreases with an increase in the percent of flow time andwith an increase in the rate of flow. Steam tracing be-comes more efficient as the desired line temperature ap-proaches the temperature of the tracer steam.
Roger L. Decker was born in Pennsylvania, on March, 4,1923. He received the B.S.E.E. de-gree from Pennsylvania State University, University Park, in 1948 and has done graduate workat the Illinois Institute of Technology, Chicago.He is with the American Oil Company, Whiting, Ind., in their Planning and Engineering
Department. He has been a Guest Lecturer at the Calumet Extention of Purdue University,Hammond, Ind.
Mr. Decker is a Registered Professional Engineer in the State of Indiana.