electra partners’ presentation of the results for the six ... · electra partners’ presentation...
TRANSCRIPT
Electra Partners’ presentation of the results for the six months to 31 March 2016 for Electra Private Equity PLCMay 2016

About Electra
2

Electra Private Equity PLC
3
• Investment trust since 1935, listed since 1976
• Net assets £1.8 billion at 31 March 2016
• Investment objective is to achieve a compound return on equity of 10-15% per year over the long term…
• … by investing in a portfolio of private equity assets
• Managed on an exclusive and fully discretionary basis by Electra Partners
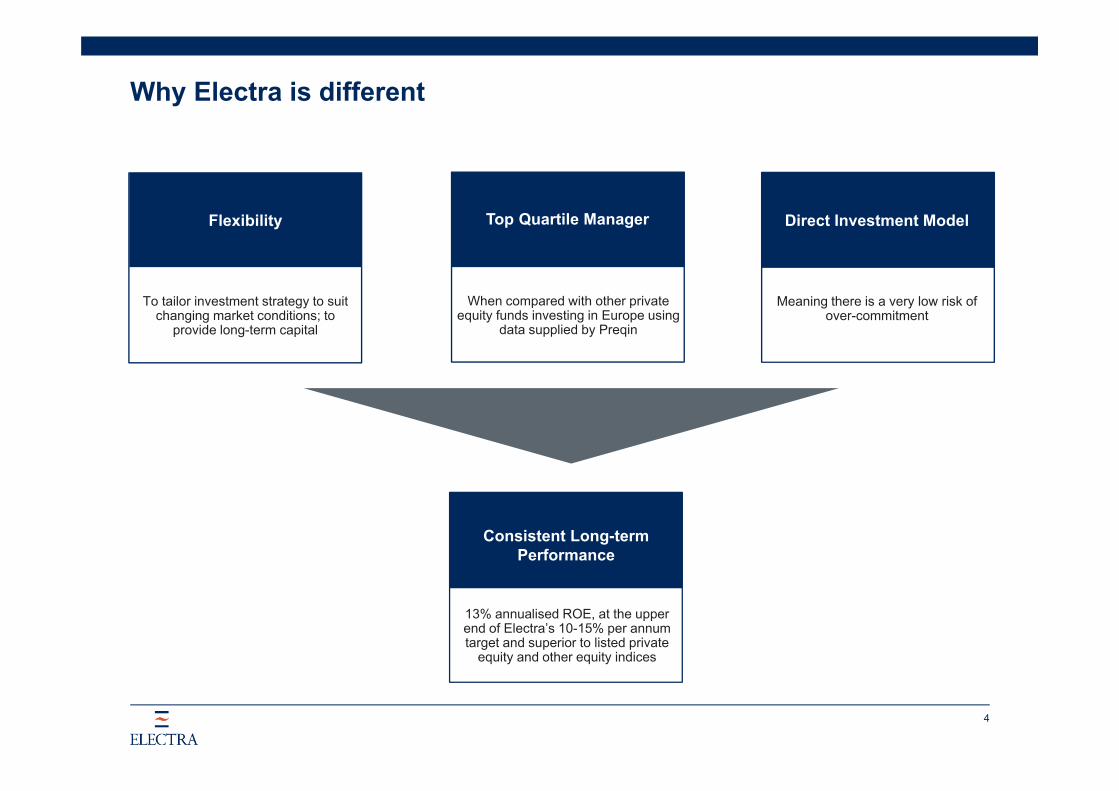
Why Electra is different
4
Consistent Long-term Performance
Flexibility
To tailor investment strategy to suit changing market conditions; to
provide long-term capital
When compared with other private equity funds investing in Europe using
data supplied by Preqin
Direct Investment Model
Meaning there is a very low risk of over-commitment
13% annualised ROE, at the upper end of Electra’s 10-15% per annum target and superior to listed private
equity and other equity indices
Top Quartile Manager

Portfolio disclosure updated to reflect Electra Partners’ investment strategy
1. Buyouts & Co-investments
2. Secondaries
3. Debt
• Direct investments• High-quality, well-managed businesses• Potential for profit growth• Buyouts: £40–150 million investment in UK-centric companies• Co-investments: £30–100 million investment in UK or international companies
• Individual fund positions• Portfolios of fund positions• Secondary directs
• Cash yield strategy – primary / secondary performing debt, direct or through an SPV
• Capital growth strategy – secondary stretched debt
5

Electra Partners’ investment approach
6
Buying well
Transaction/business complexity
Buy-and-build
Active ownership
Management
Business performance
Strategy
M&A
Financing
Creating returns
Profits growth
Cash flow
Multiple expansion

Half Year Results
7

Another strong six months for Electra – NAV per share total return of 15%
• NAV per share of 4,405p
• Total return of 15% contrasts with FTSE All-Share return of 4%
• Total return of 28% over the last 12 months
• £203 million* invested
• £384 million realised – nearly 25% of the opening portfolio value
• Active ownership approach driving performance in the portfolio
• Transformational M&A completed by three of Electra’s largest portfolio companies
• Portfolio well positioned for further strong performance
• Interim dividend of 44p per share
8
* £158 million invested in the period, plus the £45 million commitment to Grainger Retirement Solutions.

9
Consistent Out-performance over the long-term
Source: Morningstar and Electra Partners.* Performance calculated on a total return basis with dividends reinvested.Ʊ Source: Bloomberg, using weekly data points.** This index reflects the performance of 20 private equity vehicles, excluding Electra, listed on the London Stock Exchange.
Period to 31 March 2016
Six months
%
1year
%
3 years
%
5 years
%
10 years
%
Electra NAV per share*
- Percentage increase 15 28 69 107 228
- Annualised rate of return 31 28 19 16 13
Electra share price*
- Percentage increase 9 13 52 116 182
- Annualised rate of return 19 13 15 17 11
Electra alpha vs FTSEAll-share (annualised)
n/a 12 14 14 9
-50
0
50
100
150
200
SixMonths
1 Year 3 Years 5 Years 10 Years
Electra Share Price
Morningstar PE Index share price (ex. Electra)**
FTSE All-Share Index
Relative ReturnAbsolute Return
%
Ʊ

10
Six months to 31 March 2016All segments of the portfolio performing well
Valuation at 30 Sept 2015
£m
New Investment
£mRealisations
£m
Total Return
£m
Valuation at 31 Mar 2016
£mPerformance
%
Buyouts & Co-investments 1,418 93 331 268 1,448 19.0
Secondaries 92 7 20 7 86 8.5
Debt 17 53 14 3 59 18.6
1,527 153 365 278 1,593 18.3
Non-core investment portfolio 103 5 19 21 110 18.7
1,630 158 384 299 1,703 18.3

11
Higher level of investment activity in the period
0
50
100
150
200
250
300
350
400
450
30 Sept2011
31 Mar2012
30 Sept2012
31 Mar2013
30 Sept2013
31 Mar2014
30 Sept2014
31 Mar2015
30 Sept2015
31 Mar2016
Investments Realisations
Investments and realisations per six month period£m
Six months ended

12
Buyouts & Co-investments: Investment performance
-30 -10 10 30 50 70
Unrealised Losses
Total returnin six months Performance
Company £m %
Parkdean Resorts 80 28AXIO 63 32Elian 39 32TOBC 31 31Audiotonix 25 28Daler-Rowney 21 168Innovia 17 59Davies Group 14 60Allflex 9 13Treetops 8 29Premier 4 14PINE 4 7Kalle 3 23Photobox Group 2 n/aPromontoria 1 8Sentinel 1 n/aCALA (2) (4)Knight Square (5) (16)TGI Fridays (12) (10)Hotter (29) (47)
Realised Gains
£m
Unrealised Gains
Since inceptionGrossIRR Multiple% of cost
44 2.9x76 3.8x55 2.0x94 2.7x42 1.9x12 1.7x21 1.4x(1) 1.0x8 1.2x38 2.5x(0) 1.0x12 1.9x19 2.5x13 1.0x16 2.1x(41) 0.1x19 1.5x20 1.9x4 1.1x(35) 0.4x

0
50
100
150
200
250
300
Realised Return Earnings Growth Debt Repayment Multiple Change Total Return
13
Six months to 31 March 2016Buyouts and Co-investments - Analysis of total return
29
130
73 268
£m
49%
13%
27% 100%
36
11%

14
Transformational merger is the latest step in an exciting journeyParkdean Resorts
• Parkdean Resorts is a leading UK operator of caravan holiday parks with 35,000 pitches across 72 sites
• Strategy was to restructure the senior debt Electra held in Park Resorts in order to take equity control, and then to grow the business organically and through acquisition. This was delivered through a 2013 refinancing, together with the acquisitions of South Lakeland Parks, Southview and Manor Parks and Summerfields Holiday Park (known as the “Park Resorts Group”)
• In November 2015, the Park Resorts Group merged with Parkdean Holidays to create Parkdean Resorts - an enlarged company with an enterprise value of £960 million and more than £100 million EBITDA. The business is now focussed on a number of growth investment programmes as well as on post-merger integration
8% Revenue growth
16% Profits growth
£272m Valuation at 31 Mar 2016
£80m Total return in six months
£132m Original cost
2.9x Multiple of cost
44% IRR

15
AXIO Data Group - Video

16
Successful execution of business improvement and realisation strategyAXIO Data Group
• A portfolio of seven information businesses serving a range of sectors in over 25 countries
• Strategy is to transform each business, both operationally and through M&A, and then to realise multiple expansion by selling the portfolio’s components to strategic acquirers
• MIMS was successfully sold in the period meaning AXIO has now sold three of its seven businesses –all at valuation multiples more than twice Electra’s entry multiple
• The portfolio now comprises four remaining market-leading businesses (OAG, Vidal, TechInsights and RISI) which continue to make good progress as they develop growth and business improvement initiatives
5% Revenue growth*
15% Profits growth*
£160m Valuation at 31 Mar 2016
£63m Total return in six months
£91m Original cost
3.8x Multiple of cost
76% IRR
* For retained businesses only.

17
SFM acquisition completes Elian’s transformation into a diversified, standalone business
Elian
• A leading provider of offshore trust, fund and company administration services
• Strategy is to increase the breadth of services offered to clients, expanding the office network into new geographies, and make acquisitions in a fragmented market
• Completed two acquisitions, SFM Europe and Allied Trust, which have expanded the business’ international reach and added additional product expertise
• Strong performance a result of business development initiatives, increased commercial insight and continuing drive for internal efficiencies, all of which have been a focus of Electra Partners’ efforts
8% Revenue growth
11% Profits growth
£159m Valuation at 31 Mar 2016
£39m Total return in six months
£81m Original cost
2.0x Multiple of cost
55% IRR

18
The Original Bowling Company - Video
19
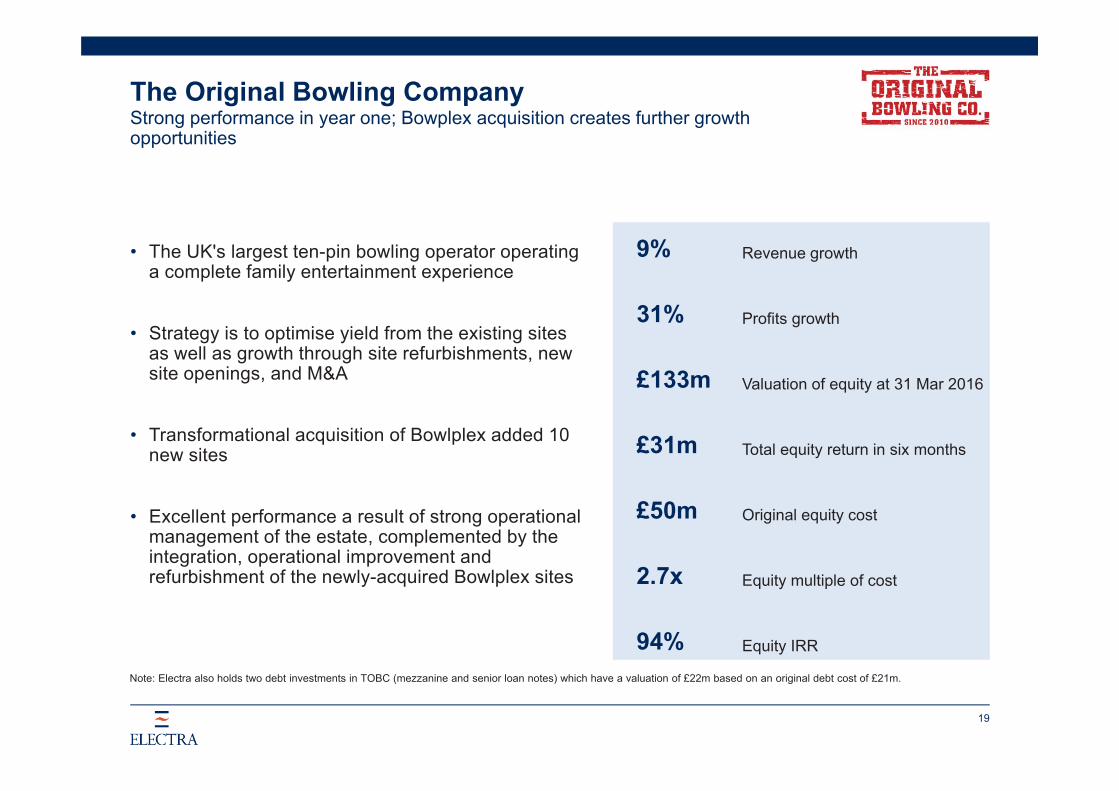
Strong performance in year one; Bowplex acquisition creates further growth opportunities
The Original Bowling Company
• The UK's largest ten-pin bowling operator operating a complete family entertainment experience
• Strategy is to optimise yield from the existing sites as well as growth through site refurbishments, new site openings, and M&A
• Transformational acquisition of Bowlplex added 10 new sites
• Excellent performance a result of strong operational management of the estate, complemented by the integration, operational improvement and refurbishment of the newly-acquired Bowlplex sites
9% Revenue growth
31% Profits growth
£133m Valuation of equity at 31 Mar 2016
£31m Total equity return in six months
£50m Original equity cost
2.7x Equity multiple of cost
94% Equity IRR
Note: Electra also holds two debt investments in TOBC (mezzanine and senior loan notes) which have a valuation of £22m based on an original debt cost of £21m.

20
Realisation of Daler-Rowney continues the run of exit success…
Portfolio company Date
Sale proceeds
£m
Proceeds to Electra
£mEBITDAmultiple Return
Oct 15 $250m £95m Teens n/a
Oct 15 £82m £82m 9.0x* 19.3x18% IRR
Feb 16 Not disclosed £33m Doubledigit
1.7x12% IRR
* Source: Capital IQ.
Realisations in the Period

… and takes the average uplift on exit to 60%
21
-25%
0%
25%
50%
75%
100%
125%
150%
175%
200%
225%
250%
60%Weighted average uplift on exit to prior carrying value
* Except where the prior valuation at the time reflected the impending realisation, in which case the “prior, prior” valuation has been used.
Uplift to Prior Carrying Value*1 Apr 2011 – 31 Mar 2016(excludes Debt investments)

22
Vintage performance
2006 fund
Top 30%
£436m
1.6x
1.6x
10.9%
11.3%
Amount invested:
Distributions to Paid-In capital (“DPI”):
Total Value to Paid-In capital (“TVPI”):
Fund net IRR:
Preqin 75th percentile net IRR:
2009 fund
Top quartile
£361m
0.9x
1.8x
22.7%
17.0%
2012 fund
Top quartile
£784m
0.4x
1.6x
28.0%
21.8%
Source: Preqin data for other private equity funds investing in Europe as at 26 April 2016; Electra Partners LLP analysis.
Note: DPI, TVPI and IRR are standardised measures widely used in private equity to calculate and present investment performance.
23
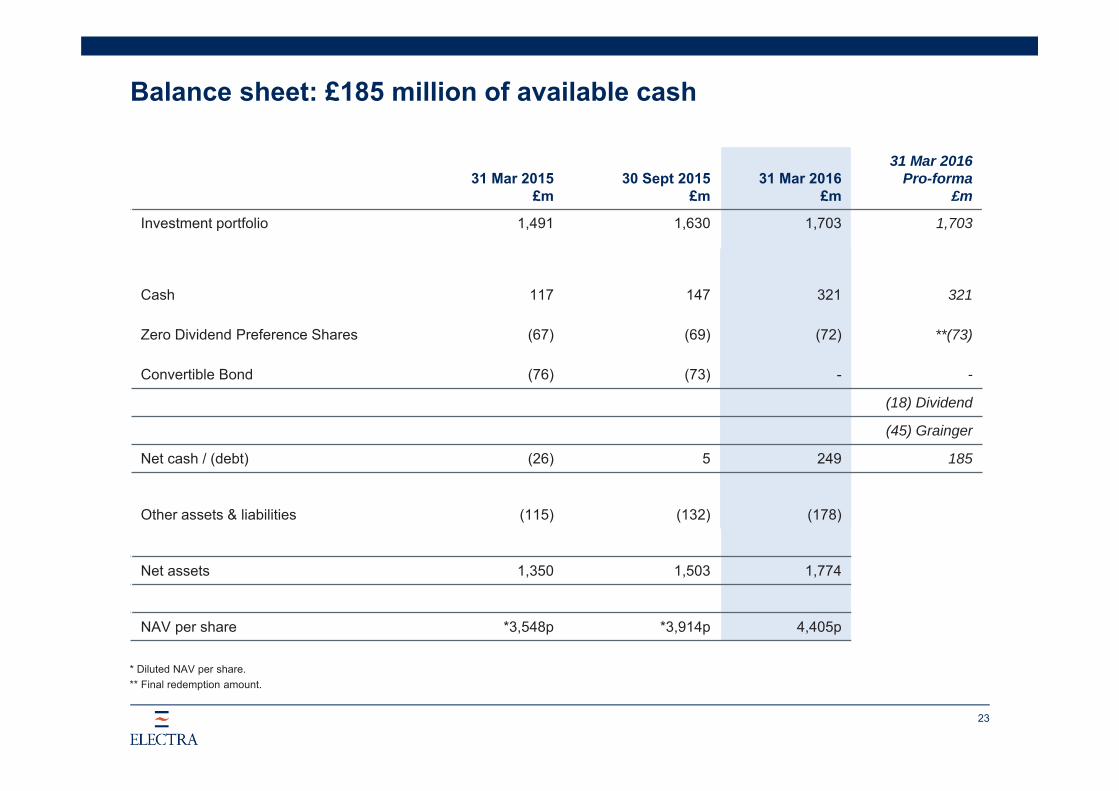
Balance sheet: £185 million of available cash
31 Mar 2015£m
30 Sept 2015£m
31 Mar 2016£m
31 Mar 2016 Pro-forma
£m
Investment portfolio 1,491 1,630 1,703 1,703
Cash 117 147 321 321
Zero Dividend Preference Shares (67) (69) (72) **(73)
Convertible Bond (76) (73) - -
(18) Dividend
(45) Grainger
Net cash / (debt) (26) 5 249 185
Other assets & liabilities (115) (132) (178)
Net assets 1,350 1,503 1,774
NAV per share *3,548p *3,914p 4,405p
* Diluted NAV per share.** Final redemption amount.

3,700
3,900
4,100
4,300
4,500
4,700
4,900
30 Sept 2015 Capital Gains& Income
IncentiveProvision
PriorityProfitShare
FinanceCosts
Expenses, FXand Taxation
TotalReturn
Dividend 31 Mar 2016
24
Total return of 569p per share in the six months
NAV per sharePence
742p (117)p
(78)p(9)p(35)p (12)p
4,405p
3,914p
Return over period 569p

Portfolio
25

A portfolio of real scale and modest gearing*
0%
10%
20%
30%
40%
50%
60%
70%
80%
90%
100%
26
£0.8bn
£1.3bn
* Buyouts & Co-investments over £5 million excluding CALA, PINE and Promontoria which are valued on a net assets basis.
£2.4bn Revenue**
£0.5bn EBITDA**
21% EBITDA margin
9.3x Weighted average valuation multiple
18%Weighted average EBITDA growth rate
3.0xWeighted average net debt / EBITDA multiple
** These are aggregate numbers and do not reflect Electra’s ownership interest in each individual portfolio company.
Ʊ Bolt-on acquisitions by portfolio companies accounted for approximately three percentage points of this growth.
Third-party net debt
Equity
Ʊ

27
Buyouts and Co-investments
Company Sector
Financial year of
investment Valuation basis
Originalinvestment
£m
Net capital at risk
£m
Valuation at 31 Mar 2016
£m% oftotal
Cumulative%
Parkdean Resorts Caravan parks operator 2012 Earnings 132 23 272 19 19
AXIO B2B information services 2013 Earnings 91 (95) 160 11 30
Elian Fiduciary Services 2014 Earnings 81 74 159 11 41
TOBC Ten-pin bowling centre operator 2014 Earnings 50 48 133 9 50
Audiotonix Audio mixing consoles 2014 Earnings 64 60 116 8 58
TGI Fridays Restaurant chain 2015 Earnings 99 96 101 7 65
Photobox Group Personalised products / gifts 2016 Recent transaction 89 87 89 6 71
Allflex Animal tagging 2013 Earnings 68 68 82 6 77
CALA Premium house builder 2013 Net assets 32 32 48 3 80
Innovia Speciality films 2014 Earnings 33 33 47 3 83
PINE Nursery school finance 2005 Net assets 31 13 40 3 86
Davies Group Insurance claims 2011 Earnings 41 40 38 3 89
Treetops Nursery education 2012 Earnings 15 12 35 2 91
Premier Asset management 2007 Earnings 57 31 33 2 93
Hotter Shoe manufacturer 2014 Earnings 84 82 32 2 95
Knight Square Property management 2012 Earnings 22 8 29 2 97
Kalle Food containers 2010 Earnings 9 3 17 1 98
Promontoria Property holding Co 2007 Net assets 15 (11) 8 1 99
1,439
Direct investments– Sundry 9 1 100
Total 1,448
Individual investments greater than £5 million in value

Investment activity
£89m
£4m£7m
£53m
£5m
Photobox
Other Buyouts & Co-investments
Secondaries
Debt
Non-core portfolio
£103m
£95m£82m
£33m
£18m
£20m£14m£19m
AXIO*Park Resorts GroupZensarDaler-RowneyOther Buyouts & Co-investmentsSecondariesDebtNon-core portfolio
28
* Net of £5 million of new loan notes issued on the restructuring of the AXIO group of companies.
Realisations (£384m)Investments (£158m)

29
An exciting new growth investmentPhotobox Group
• £89m investment alongside Exponent Private Equity
• Europe's leading digital consumer service for personalised products and gifts. Sold through the PhotoBox, Moonpig, PaperShaker, Sticky9, Hofmann, Posterjack and posterXXL brands
• Due to its scale as the European market leader Photobox is well placed to capture further market growth, which is expected to continue as a result of the growth in digital photography and personalised products
• Strategy is to accelerate growth through improving the rate and economics of customer acquisition as well as through product innovation, and to ensure that growth is delivered effectively and efficiently
• Performance has been ahead of the Electra Partners investment case since the acquisition was agreed in October 2015

Company Business description Date
New capital invested / Committed Ownership Investment rationale
Purchase of two secondary fund positions which sit within EP 1
Dec 15 £7m n/a
Attractive acquisition discount at c.20%, cash-generative and mature underlying assets
30
New investments – Secondaries
EP 1
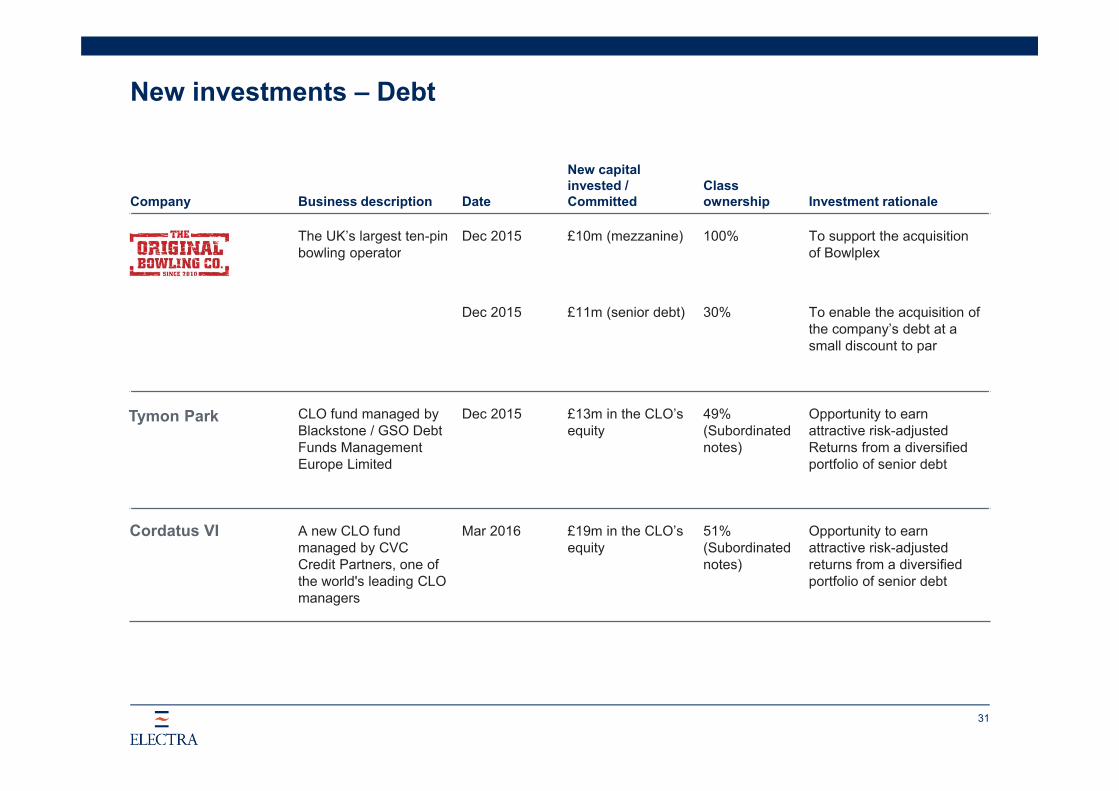
Company Business description Date
New capital invested / Committed
Classownership Investment rationale
The UK’s largest ten-pinbowling operator
Dec 2015 £10m (mezzanine) 100% To support the acquisition of Bowlplex
Dec 2015 £11m (senior debt) 30% To enable the acquisition of the company’s debt at a small discount to par
CLO fund managed by Blackstone / GSO Debt Funds Management Europe Limited
Dec 2015 £13m in the CLO’s equity
49%(Subordinated notes)
Opportunity to earn attractive risk-adjustedReturns from a diversified portfolio of senior debt
A new CLO fund managed by CVCCredit Partners, one of the world's leading CLO managers
Mar 2016 £19m in the CLO’s equity
51% (Subordinated notes)
Opportunity to earn attractive risk-adjustedreturns from a diversified portfolio of senior debt
31
New investments – Debt
Cordatus VI
Tymon Park

Portfolio company Target company Business description DateEnterprisevalue Investment rationale
Acquisition of two nursery freeholds from the Bright Horizons Group
Oct 15 £4m Expands PINE’s portfolio of nursery properties to 31 sites which increases scale and further diversifies the portfolio
Parkdean Holidays is a UK focused self-catering holiday park operator with 24 sites primarily located South West of England and in Scotland
Nov 15 £960m Merger of the Park Resorts Group with Parkdean Holidays created a group with 72 sites, EBITDA of over £100 million and strong organic growth prospects
Argent is the property and liability loss adjusting business of Parabis Group
Nov 15 £2m Davies’s acquisition of Argent strengthens its existing presence in property and liability claims management
32
Portfolio M&A activity

Portfolio company Target company Business description DateEnterprisevalue Investment rationale
SFM Europe is a leading provider of corporate services with more than €1 trillion of assets under administration
Dec 15 Notdisclosed
SFM is an attractive business with an excellent reputation and a blue chip client base. Compelling strategic fit which will complement Elian's corporate services team and extend the group's geographic reach
Bowlplex operates 16 high-quality ten-pin bowling centres across the UK, primarily located in leisure or retail parks
Dec 15 Notdisclosed
Transformational transaction to acquire well located additional sites where performance can be improved. Acquisition builds real scale for TOBC
33
Portfolio M&A activity – Cont.

Company Activity Business description DateEnterprisevalue Detail
New investment of£45 million (subjectto completion) alongside Patron Capital
Grainger Retirement Solutions is the home reversion equity release business of Grainger plc
Subject to completion
£325m Offers an attractive risk-adjusted return, as well as some exciting opportunities for organic and acquisition-led growth. The transaction is expected to complete shortly
Portfolio bolt-on Kindercare is a leading operator of nursery schools in Yorkshire
Apr 16 £10m Kindercare adds 10 sites and nearly 900 places to Treetops' existing estate of 49 nurseries
Sale (subject to completion)
Kalle is one of the world’s leading producers of artificial casings for processed meat products
Subject to completion
Notdisclosed
Upon completion Electra is expected to receive proceeds of £22m (based on current exchange rates). Together with earlier proceeds, this equates to a return of 3.0x original cost, an IRR of 21%
34
Activity post-Half Year 2016
Grainger Retirement Solutions

Continued concentration on core investments
35
0
200
400
600
800
1,000
1,200
1,400
1,600
1,800
31 Mar 2012(£786m)
31 Mar 2016(£1,703m)
Core Investments Non-core Investments
£m
Core:+163%
Non-Core:-39%
77%
94%
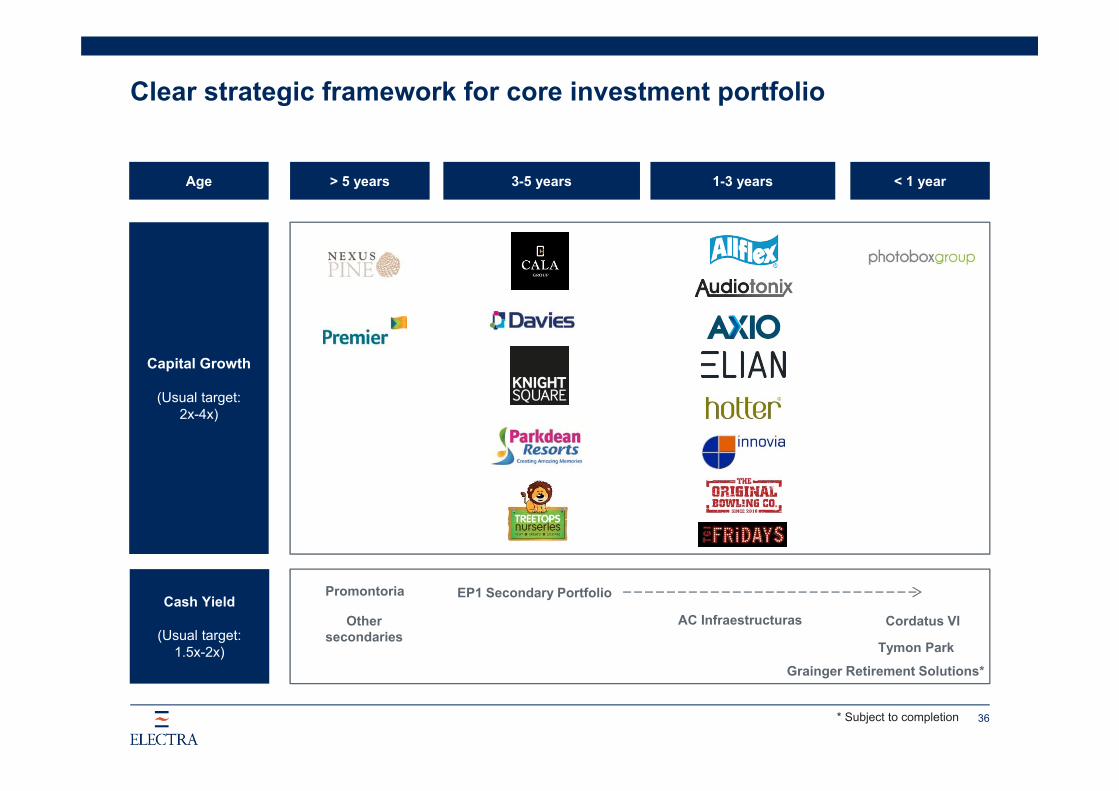
Clear strategic framework for core investment portfolio
36
Capital Growth
(Usual target:2x-4x)
Age > 5 years 3-5 years 1-3 years < 1 year
Cash Yield
(Usual target:1.5x-2x)
EP1 Secondary Portfolio
Cordatus VI
Tymon Park
AC Infraestructuras
Promontoria
Other secondaries
Grainger Retirement Solutions*
* Subject to completion

Market
37

38
Quarterly UK Deal Volumes£75m - £300mNo. of
Deals
Market deal volumes continue to be low…
Source: Mergermarket (completed deals; purchased by private equity; only where an EV is provided).
0
5
10
15
20
25
2007 2008 2009 2010 2011 2012 2013 2014 2015 H12016
Year to 30 September

39
Deal Price (EV / EBITDA)UK private equity backed buyouts > £10m
Average EBITDA Ratio
… but pricing has come off slightly
Source: CMBOR.
7
8
9
10
11
12
13
2008 2009 2010 2011 2012 2013 2014 2015 H12016
Year to 30 September
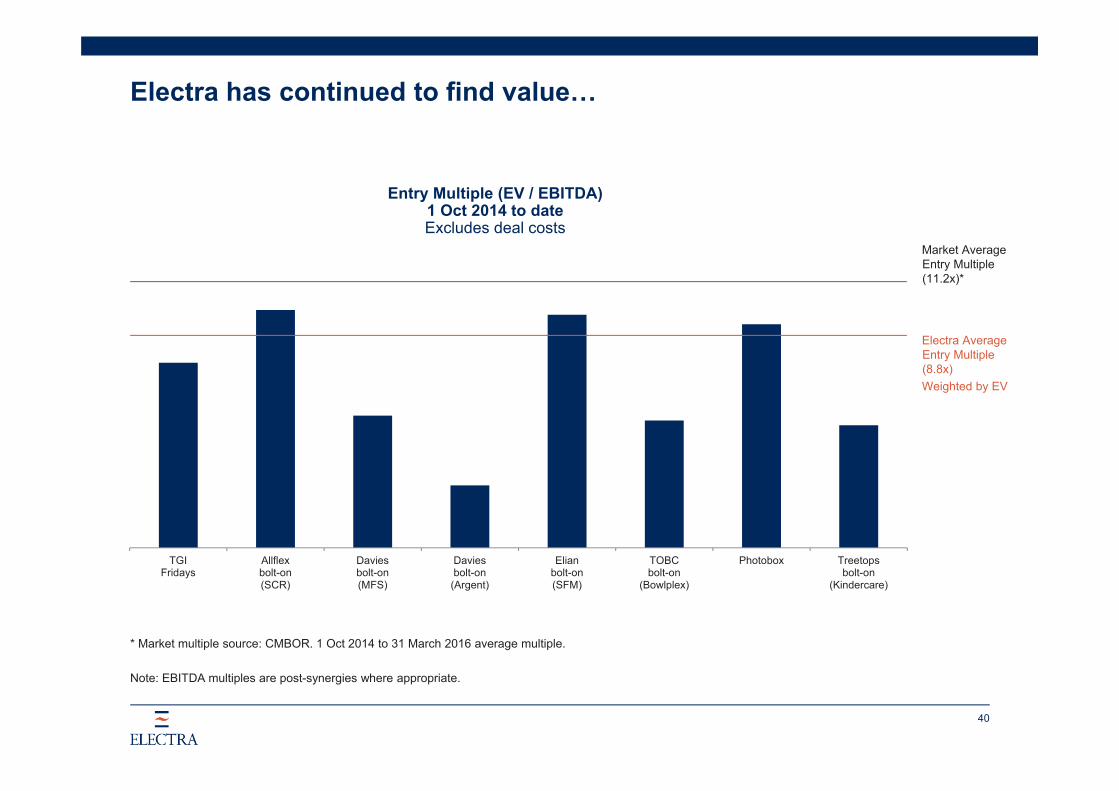
40
TGIFridays
Allflexbolt-on(SCR)
Daviesbolt-on(MFS)
Daviesbolt-on
(Argent)
Elianbolt-on(SFM)
TOBCbolt-on
(Bowlplex)
Photobox Treetopsbolt-on
(Kindercare)
* Market multiple source: CMBOR. 1 Oct 2014 to 31 March 2016 average multiple.
Note: EBITDA multiples are post-synergies where appropriate.
Entry Multiple (EV / EBITDA) 1 Oct 2014 to dateExcludes deal costs
Market Average Entry Multiple (11.2x)*
Electra Average Entry Multiple (8.8x)Weighted by EV
Electra has continued to find value…

41
The pipeline remains full, but we are extremely selective
Opportunities investigated by Electra Partners
Six months to 31 March 2016 Number
Opportunities investigated 143
Of which were bid on by Electra / Portfolio Companies 39
Of which completed:- Buyouts & Co-investments- Secondaries- Debt- Portfolio company M&A
1145
Current position Number
Deals closed post 31 March 2016
Deals in process of closing
Other deals in advanced stages
2
1
3

Appendices

43
Buyouts and Co-investments – Valuation multiples
0
50
100
150
200
250
300
350
400
450
5-6x 6-7x 7-8x 8-9x 9-10x > 10x
Portfolio value(Total £1,345m)
EBITDA Multiple*Weighted average 9.3x
(30 September 2015 = 8.6x)Portfolio Value£m
£29m
£134m
£310m
£416m
Number of investments within associated band
1
1
4
3
2%
10%
23%
31%
12%
£241m
2
18%£215m
4
16%
* Buyouts & Co-investments over £5 million excluding CALA, PINE and Promontoria which are valued on a net assets basis.

44
Buyouts and Co-investments – EBITDA growth rates
0
100
200
300
400
500
600
700
800
≤0% 0 - 10% 10 - 20% >20%
Portfolio value(Total £1,345m)
EBITDA Growth (LTM)*Weighted average growth rate of 18%**
Portfolio Value£m
4%11%
£737m
£400m
Number of investments within associated band
2
3
5
5
£61m
£147m
55%
30%
* Buyouts & Co-investments over £5 million excluding CALA, PINE and Promontoria which are valued on a net assets basis.
** Bolt-on acquisitions by portfolio companies accounted for approximately three percentage points of this growth.

45
Buyouts and Co-investments – Net Debt / EBITDA ratio
0
100
200
300
400
500
600
≤0 0-1 1-2 2-3 3-4 4-5 5-6 6-7 7-8
Portfolio value(Total £1,345m)
Net Debt / EBITDA Multiple*Weighted average 3.0x
(30 September 2015: 2.5x)Portfolio Value£m
£193m
£134m
£189mNumber of investments within associated band
2
1
3
£29m
1
£198m
4
£82m
1
£520m
3
* Buyouts & Co-investments over £5 million excluding CALA, PINE and Promontoria which are valued on a net assets basis.

Buyouts and Co-investments – Age profile & valuation basis
46
Valuation basis
£80m
39%
6%
31%
5%
19%
87%
7%
£mLess than 1 year old 901-2 years old 5572-3 years old 2753-4 years old 77Over 4 years old 449Total 1,448
£mEarnings 1,258Recent transaction 90Net assets 100Total 1,448
At 31 March 2016
6%
(of original platform deal)Age profile

84%
10%5%
UK
Continental Europe
USA
Asia and elsewhere
47
Geographic split
22%
19%
15%10%
8%
7%
6%5%
Travel & LeisureHouse, Leisure & Personal GoodsSupport ServicesMediaIndustrial General & TransportationTechnology Hardware & EquipmentPrivate Equity FundsSecondariesReal EstateFinancial & InsuranceOtherFood & Beverage
Buyouts and Co-investments – Sector & geographic basisAt 31 March 2016
1%2%3%
1%2%
Classification and distribution

0
20
40
60
80
100
120
140
160
180
Buyouts & Co-investments Secondaries Debt
48
£m
Electra investment*Since 1 October 2015
Electra’s flexible mandate remains important
£93m
£7m
£53m
Grainger Retirement Solutions**
* Core investment portfolio only.** Subject to completion.

49
Listed portfolio
Valuation31 Mar 2016
£m
Nmas1 Dinamia 10.3
EQMC 5.8
Meghmani 3.0
Moser Baer 0.9
IGAS 0.7
20.7

FX
50
£1,325m
£229m
£145m
GBP Euro US Dollar Other
£4m
Note: Calculated using the reporting currency of the investment, not its underlying exposures.
At 31 March 2016
Investments £1,703m

51
Experienced Senior management have on average 22 years’ experience in private equity
In private equity long enough to invest through several business cycles
Short decision lines
Well resourced 15 investment professionals
Supported by a team experienced in compliance, finance, investor relations and marketing
Zoe Clements Investment DirectorSarah Williams Investment DirectorOwen Wilson Investment DirectorIan Wood Investment DirectorNicola Gray Investment ManagerTom Stenhouse Investment ManagerHugh Mumford Chairman of Investment CommitteeDavid Symondson Deputy Chairman of Investment CommitteeOliver Huntsman Portfolio Manager
Investment Team
Alex Fortescue Managing PartnerBill Priestley Chief Investment PartnerAlex Cooper-Evans PartnerCharles Elkington PartnerChris Hanna PartnerSteve Ozin Partner
(CFO and Compliance)
Note: Arvind Tewari joining as Investment Manager on 13 June 2016.

The information contained in this presentation is restricted and is not for release, publication, or distribution, directly or indirectly, in or into the United States, Canada, Japan, Australia or New Zealand. The information in these materials does not constitute an offer of securities for sale in the United States, Canada, Japan, Australia or New Zealand. No information contained in this presentation shall form the basis of, or be relied upon in connection with, any offer or commitment whatsoever in any jurisdiction.
This presentation is not an offer to sell or a solicitation of any offer to buy any securities of Electra Private Equity PLC or Electra Private Equity Investments PLC (the "Company", and “EPEI” respectively and such securities, the "Securities") in the United States or any other jurisdiction. The Company and EPEI are not registered under the U.S. Investment Company Act of 1940, as amended(the "Investment Company Act"), and holders of any Securities will not be entitled to the benefits of the Investment Company Act. The Securities have not been and will not be registered under the U.S. Securities Act of 1933, as amended (the "Securities Act"), and may not be reoffered, resold or transferred in the United States or to, or for the account or benefit of, U.S. persons (as such term is defined in Regulation S under the Securities Act) unless registered under the Securities Act or an exemption from such registration is available. Copies of this presentation are not being, and should not be, distributed or sent into the United States. No public offering of Securities is being made in the United States. If for any reason in the future an offering of the Securities is made, such offering will be made by means of a prospectus that may be obtained from the Company and/or EPEI and will contain all relevant information about the Company, EPEI, their management, and their financial statements.
52