electoral gender quotas and measures of …
TRANSCRIPT
ELECTORAL GENDER QUOTAS AND MEASURES OF INSTITUTIONAL GENDER
INEQUALITY
A Thesis
submitted to the
Graduate School of Arts and Sciences
at Georgetown University
in partial fulfillment of the requirements for the degree of
Master of Public Policy
By
Victoria Anne Glock-Molloy, B.A.
Washington, DC
December 10, 2013
ii
Copyright 2013 by Victoria Anne Glock-Molloy
All Rights Reserved
iii
ELECTORAL GENDER QUOTAS AND MEASURES OF INSTITUTIONAL GENDER
INEQUALITY
Victoria A. Glock-Molloy, B.A.
Thesis Advisor: Robert W. Bednarzik , Ph.D.
ABSTRACT
Women experience discrimination and gender-based inequality in numerous ways, from the
unequal property and custody rights found within legal systems to the acceptance of domestic
violence or sexual harassment that still prevails throughout the world. Collectively, these types
of occurrences are termed “institutional gender discrimination,” or “those established laws,
customs, and practices which systematically reflect and produce group-based inequities in any
society” based on gender or sex (Henry 2010, p. 427). Institutional gender discrimination is a
global problem, inhibiting women’s property rights, civil liberties, economic opportunities, and
physical integrity. Gender discrimination is associated with poor performance on development
indicators ranging from education to children’s nutrition (OECD, 2012a). This paper examines
the relationship between electoral gender quotas and measures of institutional gender equity in
developing countries.
Electoral gender quotas have been established worldwide as a tool to mitigate gender
discrimination and inequality in the institutions of government and law-making bodies. Several
studies (Chattopadhyay and Deflo 2004, Chen 2010) have found a statistically significant
positive relationship between electoral gender quotas and government social programs and
building projects that reflect women’s interests. While most of the literature has examined the
relationship between gender quotas and government spending on social welfare programs or

iv
infrastructure, this study explores specifically the relationship between gender quotas and the
prevalence of inequality and discrimination.
Using an Ordinary Least Squares model, this study tested whether there was a statistically
significant negative relationship between the existence of an electoral gender quota in a
particular country and a high prevalence of gender inequality in five different types of social
institutions: family code, civil liberties, physical integrity, son bias, and access to resources. This
study showed little evidence for this hypothesis. There was no statistically significant
relationship between electoral gender quotas and inequality in family code, son bias, and access
to resources. There was, however, a small positive relationship between gender quotas and
gender inequality related to physical integrity. The relatively recent introduction of electoral
gender quotas in many countries, and the percentage of gender quotas that were enacted after
conflict and during political transitions may have an impact on the ability for electoral gender
quotas to mitigate gender inequality in many of the countries that have adopted this electoral
mechanism.
v
To Prof. Robert Bednarzik, Mr. Eric Gardner, and Mr. Mike Barker for their assistance and
guidance throughout the thesis process;
To my family for their unending love and support over the years, even along the detours on my
academic path;
To my mother, who I believe has read everything I have ever written, who has answered every
late night phone call, and who might hold a record for most care packages sent lovingly from
New Jersey;
To my fellow Hoyas, who have inspired me from my first day on the Hilltop. I am thankful for
every moment I have shared with you- whether back in the Harbin common room, on the
Poulton stage, in the pews at Dahlgren, on the road in a CSJ van, or around a table in Lauinger
Library at 2 AM;
And to Georgetown University. Over six-and-a-half years and two degrees, you have challenged
me and encouraged me to be my best person. Thank you for the friendships, the eye-opening
experiences, and the rigorous, thoughtful Jesuit education you have provided. You have shown
me time and again what it means to educate the whole person and to live as women and men for
others.
And for that I am forever grateful.
Hoya Saxa,
Victoria Anne Glock-Molloy
vi
Table of Contents
I. Introduction ……………………………………………………………...……....……1
II. Literature Review…………………………………………………..………….……....2
III. Hypothesis…………………………………………………...……………………….11
IV. Data……………………………………………..…………….……………………...12
V. Methodology and Model………………...…………………………………………...12
VI. Analysis…………………………………………………………...………………….20
VII. Conclusions and Policy Implications…………………………………………….…..26
Appendix…………………………………………....…………………..……………34
Works Cited………………………………………….……………………...……….49
vii
Table of Tables
Table 1: Variable Matrix and Rationale………………………………………………….…..18-19
Table 2: Prevalence of Electoral Gender Quotas and SIGI Scores………………………...…….20
Table 3: OLS Regression Results with Indicators of Gender Equality as Dependent
Variables………………………………………...……………………………...………21
1
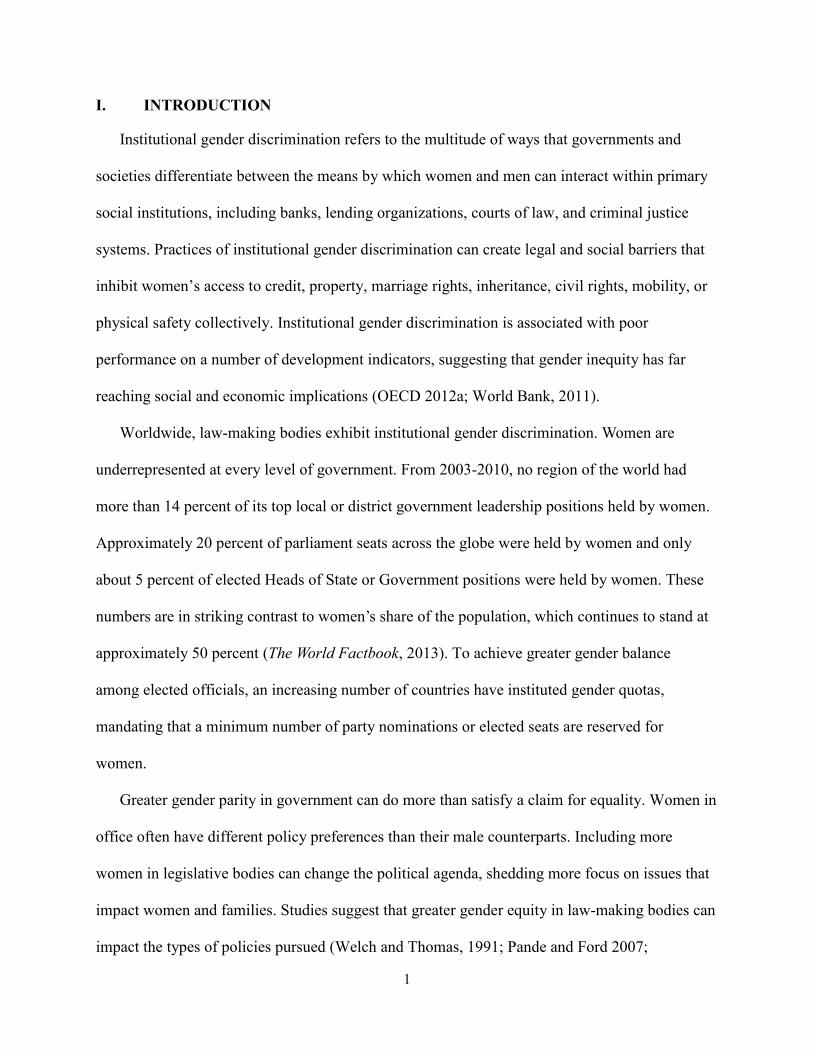
I. INTRODUCTION
Institutional gender discrimination refers to the multitude of ways that governments and
societies differentiate between the means by which women and men can interact within primary
social institutions, including banks, lending organizations, courts of law, and criminal justice
systems. Practices of institutional gender discrimination can create legal and social barriers that
inhibit women’s access to credit, property, marriage rights, inheritance, civil rights, mobility, or
physical safety collectively. Institutional gender discrimination is associated with poor
performance on a number of development indicators, suggesting that gender inequity has far
reaching social and economic implications (OECD 2012a; World Bank, 2011).
Worldwide, law-making bodies exhibit institutional gender discrimination. Women are
underrepresented at every level of government. From 2003-2010, no region of the world had
more than 14 percent of its top local or district government leadership positions held by women.
Approximately 20 percent of parliament seats across the globe were held by women and only
about 5 percent of elected Heads of State or Government positions were held by women. These
numbers are in striking contrast to women’s share of the population, which continues to stand at
approximately 50 percent (The World Factbook, 2013). To achieve greater gender balance
among elected officials, an increasing number of countries have instituted gender quotas,
mandating that a minimum number of party nominations or elected seats are reserved for
women.
Greater gender parity in government can do more than satisfy a claim for equality. Women in
office often have different policy preferences than their male counterparts. Including more
women in legislative bodies can change the political agenda, shedding more focus on issues that
impact women and families. Studies suggest that greater gender equity in law-making bodies can
impact the types of policies pursued (Welch and Thomas, 1991; Pande and Ford 2007;
2
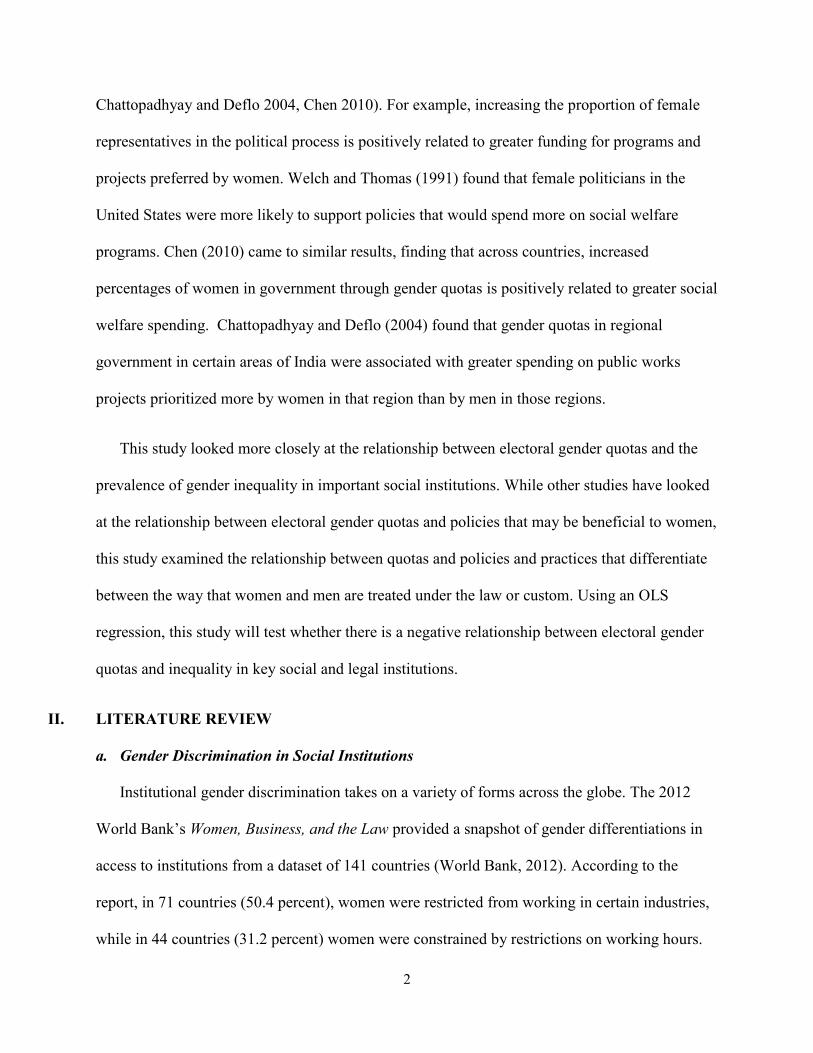
Chattopadhyay and Deflo 2004, Chen 2010). For example, increasing the proportion of female
representatives in the political process is positively related to greater funding for programs and
projects preferred by women. Welch and Thomas (1991) found that female politicians in the
United States were more likely to support policies that would spend more on social welfare
programs. Chen (2010) came to similar results, finding that across countries, increased
percentages of women in government through gender quotas is positively related to greater social
welfare spending. Chattopadhyay and Deflo (2004) found that gender quotas in regional
government in certain areas of India were associated with greater spending on public works
projects prioritized more by women in that region than by men in those regions.
This study looked more closely at the relationship between electoral gender quotas and the
prevalence of gender inequality in important social institutions. While other studies have looked
at the relationship between electoral gender quotas and policies that may be beneficial to women,
this study examined the relationship between quotas and policies and practices that differentiate
between the way that women and men are treated under the law or custom. Using an OLS
regression, this study will test whether there is a negative relationship between electoral gender
quotas and inequality in key social and legal institutions.
II. LITERATURE REVIEW
a. Gender Discrimination in Social Institutions
Institutional gender discrimination takes on a variety of forms across the globe. The 2012
World Bank’s Women, Business, and the Law provided a snapshot of gender differentiations in
access to institutions from a dataset of 141 countries (World Bank, 2012). According to the
report, in 71 countries (50.4 percent), women were restricted from working in certain industries,
while in 44 countries (31.2 percent) women were constrained by restrictions on working hours.
3
In 52 countries, women had a younger mandatory retirement age than men, even though women
are demographically more likely to live longer. Five countries (3.5 percent) allowed more
personal income tax deductions for men, while only 15 (10.6 percent) allowed childcare
payments to be tax-deductible. Policies such as these reinforce traditional roles of men as the
primary earner and women as the primary childcare provider. In terms of parental leave, many
countries offer paid leave to one or both parents, but differences in the amount of time (paid or
unpaid) varied greatly by gender and by country. In general, paternal leave is unequal to
maternal leave or absent entirely, providing incentives for women in many countries to stay at
home and remain out of the workforce longer than their husbands or male partners because
maternal leave is often better subsidized (Ray, Gornick and Schmitt, 2008, p. 5). In terms of
access to a fair legal process, 11 countries (7.8 percent) had laws that made “the testimony of a
woman carries less evidence than that of a man”, and in one country, Democratic Republic of
Congo, “married women need(ed) the permission of their husbands in order to initiate legal
proceedings in court” (World Bank, 2012, p. 22-23).
The OECD Social Institution Gender Index measures institutional gender equity in non-
OECD countries. The OECD used this index in connection with social outcomes and found:
“in 21 countries where social institutions discriminate against women the most……primary
school completion is on average more than 15 percent lower, nearly twice as many children
suffer from malnutrition, and maternal mortality rates are twice as high when compared with
other developing countries.” (OECD, 2010, p.2).
These findings indicate a widespread ripple effect of institutional gender discrimination on social
and economic indicators of development. In many countries, women are responsible for
childcare, and any lack of access to resources or gender differentiations in social institutions can
result in a diminished capacity to provide for families. For example, the number of child
malnourishment is 60 percent higher than average in countries that restrict women’s land

4
ownership, and 85 percent higher in countries that restrict women’s access to credit (OECD,
2010, p.2-3). In countries with high rates of early marriage, school attendance and completion
were lower than average, with as few as “half the primary school aged children….in school”
(OECD, 2010, p.4). Not only do many girls fail to finish primary or secondary education if they
marry before the age of 19, but very young mothers tended to have less decision making capacity
in their households, making it less likely that their children will attend school. The OECD report
suggested that acceptance of gender-based violence, domestic abuse, and female genital
mutilation- all restrictions on women’s physical integrity- can create medical complications (as
can pregnancy at a young age).
b. Policy Implications of Women’s Political Participation
Literature has suggested that increasing the number of women in government and public life
can substantially refocus policies toward issues that impact women or that women tend to
prioritize. Lovenduski and Norris (2003) looked at the outcomes of the 1997 cohort of female
politicians in British national politics. After controlling for political party, social background,
age, income, and education, Lovenduski and Norris (2003) found a statistically significant
preference among female candidates for issues that relate specifically to women’s lives,
including affirmative action and gender equality. The differences in policy preferences between
male and female politicians were even more dramatic in the United States. Welch and Thomas
(1991) studied female legislators in the United States in the late 1980s and 1990s. They found
that female politicians tended to be more supportive of traditional “women’s issues” (i.e. issues
pertaining to equal pay, women’s reproductive and sexual health, etc.). Yet across party lines,
women also tended to place a higher priority on domestic social issues, including education,
childcare, and healthcare (Welch and Thomas, 1991, p. 14-17).

5
c. Critical Mass Theory
Critical Mass Theory is an important and reoccurring topic in discussion of women’s
political representation, used to explain the value of promoting greater gender equity within
governing bodies. Childs and Krook (2008) explain Critical Mass Theory as the argument that
“women are not likely to have a major impact on legislative outcomes until they grow from a
few token individuals into a considerable minority of all legislators: only as their numbers
increase will women be able to work more effectively together to promote women-friendly
policy change and to influence their male colleagues to accept and approve legislation promoting
women’s concerns” (Childs and Krook, 2008, p. 725). Supporter of this theory argue that true
representation of women’s interests requires that the percentage of women in government reach a
“critical mass,” making up at least a sizeable minority in law-making bodies.
Rosabeth Moss Kanter’s research on minority behavior provides the basis for much of the
academic literature surrounding Critical Mass Theory in the context of women’s political
representation. Her work built from the research of George Simmel, who studied the impact of
changing numbers of group on group interactions (Kanter 1977).
In the 1970’s, Kanter studied women in corporate business, looking specifically at the impact
that minority status in a primarily male workplace had on women’s performance and behavior.
Many women in her study said that they felt their “token” status made their work more visible,
creating greater “performance pressure” and more often “the subject of conversation,
questioning, gossip, and careful scrutiny” (Kanter, 1977, p. 972). These conditions encourage
and create several outcomes: a demand to overachieve or limit visibility, isolation, and role
entrapment “which obliges them to choose between alternative female stereotypes like the
mother, the seductress, the pet or the iron maiden” (Childs and Krook, 200.k8, p.727). Under
6
these circumstances, token women are pressured to adopt the behavior and mannerisms of the
majority, thus limiting their positions as outsiders. Token status creates incentives for women to
maintain the status quo in corporate and public policy, because advocacy for greater gender
equity or more favorable conditions for women come at great personal cost to the few token
women in power. According to Childs and Krook, “Tokenism in this manner becomes self-
perpetuating: rather than paving the way for others, it reinforces low numbers of women, leaving
outside intervention as the only means for increasing their presence” (Childs and Krook, 2008,
p.727).
While numerous contemporary scholars have offered competing arguments to classic Critical
Mass Theory, it remains an important condition in dialogue surrounding women’s political
participation, particularly in advocacy for electoral gender quotas. Drude Dahlerup made the
argument that the conversation regarding critical mass is important in itself. While rejecting the
concept that a specific uniform percentage of women in parliament is necessary for reaching a
critical mass for adequate women’s representation, Dahlerup argued that “the story of critical
mass” (Dahlerup, 2006a, p. 514) has created an environment more conducive to women pursuing
women’s issues in political office. While studying Nordic states with relatively high percentages
of female representation, Dahlerup argued that there is no single specific number or percentage
of women in parliament that will create prime working conditions for women in all cases. She
argued “that no turning point can be identified, and that consequently the critical mass
perspective should be replaced by a focus on critical acts that will empower women in general,
for example, gender quotas” (Dahlerup, 2006a, p. 513). Dahlerup argues that gender quotas go
beyond creating a “critical mass” of women, but rather help create an environment that supports
women and enables them to form alliances to pursue women’s issues, even while in the minority.

7
Dahlerup rejects there is an ideal percentage that can change the impact of women’s
representation, but that the very act of legislating a quota percentage can change the political
environment in favor of women.
d. Gender Quotas
While increasing gender equality in government and public life provides a platform for
women’s policy, women are still widely underrepresented in governing bodies across the world.
One increasingly popular solution to gender inequity in public office is the establishment of a
gender quota. In countries with a gender quota, seats or party nominations are reserved for
women, mandating that a specific number or percentage of elected officials or candidates is
female. Proponents of quotas argue that these measures improve both “descriptive” and
“substantive” representation (Wangnerud, 2009). They improve the gender balance in law-
making bodies. By doing so, the change in the gender balance increases the representation of
issues prioritized more often by women (Pande and Ford, 2007, p. 11).
Many different varieties of gender quotas exist around the world. Quotas can be legally-
binding constitutional mandates, or they can be voluntary intra-party policies. Quotas can be set
or established for the pool of potential candidates, for the pool of candidates who actually run for
office, or for the actual seats in an elected body, whereby a minimum number of seats would be
reserved for women. Quotas can establish a minimum percentage of female representation, or
they can mandate so-called “gender neutral” quotas, which require either 50:50 male to female
ratio or establish a maximum percent of representation for both women and men, which in some
leftist Scandinavian parties has actually increased the representation of men. Argentina and
Belgium have in place additional requirements to their list quota system- women not only have

8
to represent a certain proportion of candidates, but they must also be represented near the top of a
list, increasing their chances of being elected (Dahlerup, 2003, p.4).
Because many quota systems establish quotas for candidates, not seats, they do not guarantee
an automatic shift in the gender balance of political institutions. Enforcement of quotas and
sanctions for non-compliance also impact the efficacy of quota policies. Yet quotas have created
enormous shifts in women’s political representation. Scandinavian countries have a long history
of gradual gender equality and for years had the highest proportions of women in elected offices
worldwide through incremental progress. In the last decade, countries with quota systems have
increasingly been at the top of the world’s ranking in terms of proportion of women in
parliament. In 2012, for example, Rwanda ranked highest for women in parliament, with 56.3
percent of its parliament consisting of female members (UNDATA). In 2002, a year before
Rwanda passed its new constitution mandating gender quotas (Powley, 2005, p. 155), women
made up only 25.7 percent of Rwanda’s parliament (UNDATA). Other countries with quota
systems, including Costa Rica, Argentina, Mozambique, and South Africa have also rapidly
improved their rankings for share of women politicians, often surpassing Scandinavian countries
with the before mentioned gradual process of gender equality (Dahlerup, 2005, p.145).
e. Policy Implications of Gender Quotas
Quotas are by no means a flawless solution to increasing the percentage of women in
legislatures. Dahlerup and Freidenvell (2005) argue that the quota system allows women to
overcome structural barriers and resource limitations to reach positions of power, but that this
“fast track” may create sentiments that a female candidate “ only got the position because she
was a woman,” making some women token representatives without real power or influence.
Meanwhile, incremental improvements in gender ratios, such as was the case in Scandinavia,

9
ensure that women actually have a base of power and support (Dahlerup and Freidenvall, 2005,
p. 42). Dahlerup and Freidenvall suggested that certain design and enforcement mechanisms can
mitigate some of these obstacles to an effective quota system.
Moreover, research suggests that gender quotas can have a meaningful impact on public
policy. Studies by Chen (2010), Sacchet (2008), Pande (2003, 2007), and Chattopadhyay and
Deflo (2004), provide some evidence that gender quotas can have a substantial impact on the
prioritization of women’s issues.
Chen (2010) studied the impact of electoral gender quotas on policy outcomes. She examined
government spending before and after the introduction of electoral gender quotas. Across
countries and type of quota systems, the introduction of electoral gender quotas had a statistically
significant positive relationship with government social welfare expenditures, spending 3.38
percentage points more on social welfare than those countries without gender quotas (Chen,
2010, p. 21).
Sacchet (2008) suggested that the institution of gender quotas may have an additional
influence on the political agenda unrelated to increasing the proportion of women in government.
According to Sacchet (2008), the very institution of gender quotas, and even the controversies
that surround them can raise awareness of more issues traditionally associated with women. In
the case of Brazil, Sacchet (2008) argued that quotas “encouraged debates inside political parties
and in social movements, propelling a greater questioning of women’s political under-
representation and increased understanding of gender issues” (Sacchet, 2008, p.381).
Chattopadhyay and Deflo (2004) published a pivotal paper on the impact of gender quotas on
policy outcomes. They studied the impact of a unique policy change in India that organically
created a controlled environment for social science research. In 1992, India instituted gender
10
quotas for lawmakers in all village, block, and district governments. The Indian states of West
Bengal and Rajastjan extended this policy, creating a system in the late 1990’s which reserved
certain Pradhan (council chief) positions for women as well. One third of the Gram Pachayats
(the village level government) were selected to reserve their Pradhan position for women. The
selection process was random, essentially creating a randomized controlled policy experiment, in
which some otherwise similar local law-making bodies in the same two states in India had
leadership positions reserved for women and others did not (Chattopadhyay and Deflo, 2004,
1410-1413). They concluded that:
“Mandated representation of women has important effects on policy decisions in local
government. Women elected as leaders under the reservation policy invest more in the
public goods more closely linked to women’s concerns: drinking water and roads in West
Bengal and drinking water in Rajasthan. They invest less in public goods that are more
closely linked to men’s concerns: education in West Bengal and roads in Rajasthan.”
(Chattopadhyay and Deflo, 2004, p. 1440).
In India, in addition to quotas for women, seats in government are also reserved for other
historically marginalized minority groups. In a study about the impact of mandated political
representation in India, Pande (2003) found that there is a positive correlation between minority
quotas and financial transfers that specifically benefit the particular groups that hold those
reserved seats. These results provide further support for the argument that including
marginalized voices in the political process changes the conversation and may better address the
needs of traditionally under-represented groups.
If electoral gender quotas are positively related with greater gender equity in social
institutions, policy makers might consider the benefit of mandating women’s representation in
government. The appropriate type of quota- candidate list, reserved seat, etc.- may differ across
countries and electoral systems. Some countries- particularly those without a proportional
representation system, the system that is most compatible with gender quotas- might find a
11
legislated quota to be politically infeasible, unpopular with constituents, or otherwise unsuitable.
Yet if gender quotas are associated with a decrease in gender discrimination, countries might still
want to further study the impact of women’s participation in government, and to explore
voluntary means to improve gender equity in government.
This literature suggests that greater gender equality in government, and the establishment of
electoral gender quotas to increase women’s participation, can have a substantial impact on
policy preferences. Gender quotas are positively related to government spending on projects
valued by women. Yet while studies have researched the impact of gender quotas on decreasing
the gender gap among elected officials, there are few quantitative studies that examine the
impact of gender quotas on specific indicators of gender discrimination in social institutions.
Gender quotas can be a powerful way to improve women’s representation in government- and
which in turn might improve women’s access to social institutions, personal physical integrity,
and equal rights under law and custom. Building from prior research, this study will further
explore the relationship between gender quotas and gender equality in social institutions. Is there
a relationship between electoral gender quotas and measures of gender inequality in social
institutions? Are gender quotas related to policies and practices that dictate the way women and
men are treated in terms of family code, physical integrity, marriage, property rights, and civil
liberties?
III. HYPOTHESIS
Across developing countries, gender quotas for elected officials and gender inequality in
social institutions are negatively related. The presence of gender quotas are related to lower
scores of gender inequality on the OECD Social Institution and Gender Index indicators (lower
scores on these indexes indicate less gender inequality, i.e. greater gender equality).
12
IV. DATA
The data used in this paper are from the OECD’s Social Institutions Gender Index, a subset
of the Gender, Institutions, and Development Database. It has information from 121 countries
that are non-OECD and non-European, that have a national population of over one million, and
that have available information regarding discriminatory laws and institutions [ ] 2012a,
p.10). This database provides information about specific indicators of gender equity and an
overall score based on sub-index scores for gender equality in the following areas:
discriminatory family code, restricted physical integrity, son bias, restricted resources and
entitlements, and restricted civil liberties. Sub-index scores are assigned to each country by
combining weighted variables in each category heading. Using these sub-index scores, an overall
index is provided, ranking countries in terms of gender equality. In determining the overall
index, each sub-index score is weighted equally, giving no additional significance to one area of
gender equality over another (OECD, 2012b).
The main challenge to this proposed model is the sample size of the dataset. While the
dataset consists of 121 countries, only 86 countries have data available for all variables and are
included in the general index ranking in 2012 (OECD 2012a).
V. METHODLOGY AND MODEL
a. Theoretical Foundation and Methodology
This study uses an OLS model to examine the relationships between gender quotas (the
independent variable) and the OECD’s measures of gender inequality (the dependent variables).
The models used in this study are based primarily on two studies –Chen (2010) and
Chattopadhyay and Deflo (2004)- that found a positive relationship between gender quotas and
social outcomes that benefit women. Studies such as these rely on the concept of Critical Mass
13
Theory (Kanter, 1977, and Dahlerup, 2006a) as applied to women’s political participation,
promoting the idea that increased percentages of women in law-making bodies is related to more
policies that promote women’s interests.
b. Model Description
This analysis is based on the research model used by Chen (2010) and Chattopadhyay and
Deflo (2004), Critical Mass Theory, and the OECD Social Institutions Gender Index (SIGI)’s
design as a measure of socially relevant variables. To capture the relationship between quotas
and equity, it is important to control for other influences. These control variables in the models
are chosen based on prior research related to gender quotas and analyses that have used the SIGI
dataset. The model will control for:
Region of country - While gender inequality varies from country to country, the
OECD reports using the SIGI dataset suggest distinct regional trends. Some of the
variation in discriminatory social institutions might be explained by regional
factors. The control variables to be included for region will follow OECD
classifications: Latin America/ Caribbean, East Asia/ Pacific, Europe/Central
Asia, South Asia, Middle East/ North Africa, and Sub-Saharan Africa. Dummy
variables will be used for each region with Europe/Central excluded as the
baseline (OECD, 2012a).
Income-. Chen (2010) found that the outcomes of gender quotas vary between
developed and developing countries. While all countries in this data-set are non-
OECD countries, they vary greatly in GDP and economic growth. The OECD
SIGI dataset (2012) categorizes countries as High Income Group (HIC), Upper
Middle Income Countries (UMIC), Low Middle Income Countries (LMIC), and
14
Other Low Income Countries (OLIC) (OECD, 2012b). The model will include
dummy variables for these categories, with HIC omitted as a baseline.
Proportional Representation System- In his book Women, Quotas, and Politics
Dahlerup argued that some types of electoral systems are more amenable to
establishing gender quotas (Dahlerup, 2006b, p. 10-12, 20-21). Gender quotas are
most frequently introduced in proportional representation systems. A dummy
variable for proportional representation systems will be used in this model.
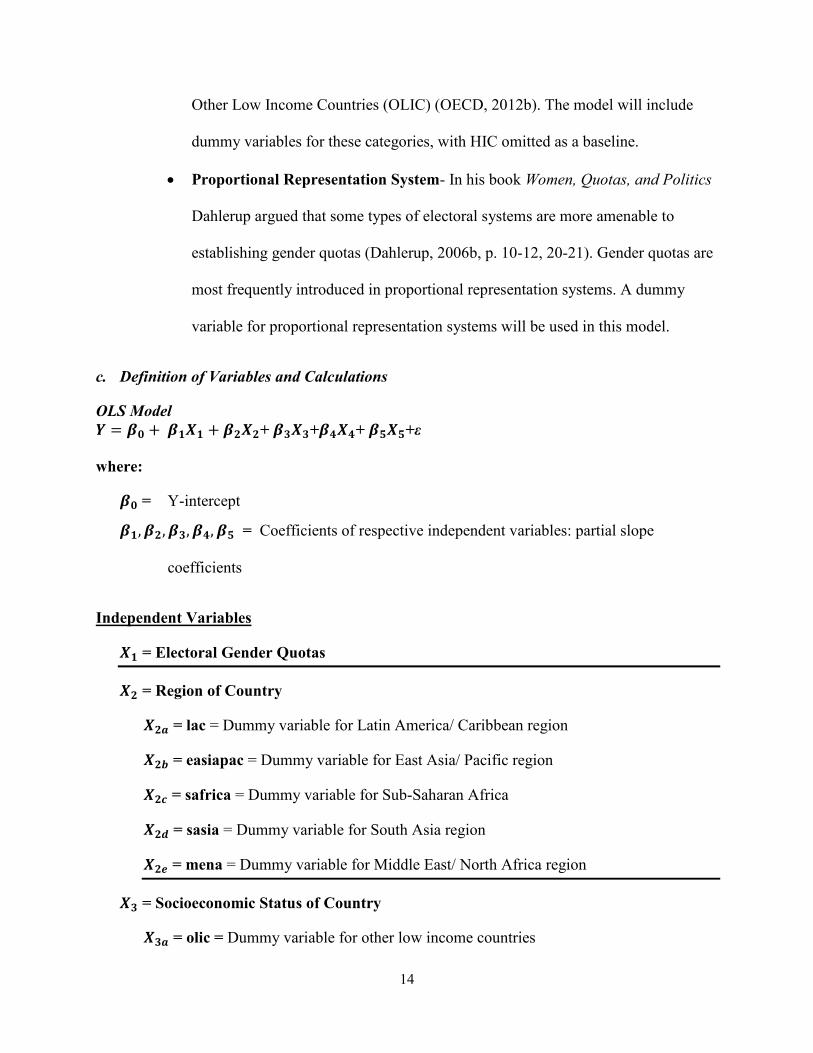
c. Definition of Variables and Calculations
OLS Model
+ + + +ε
where:
= Y-intercept
= Coefficients of respective independent variables: partial slope
coefficients
Independent Variables
= Electoral Gender Quotas
= Region of Country
= lac = Dummy variable for Latin America/ Caribbean region
= easiapac = Dummy variable for East Asia/ Pacific region
= safrica = Dummy variable for Sub-Saharan Africa
= sasia = Dummy variable for South Asia region
= mena = Dummy variable for Middle East/ North Africa region
= Socioeconomic Status of Country
= olic = Dummy variable for other low income countries
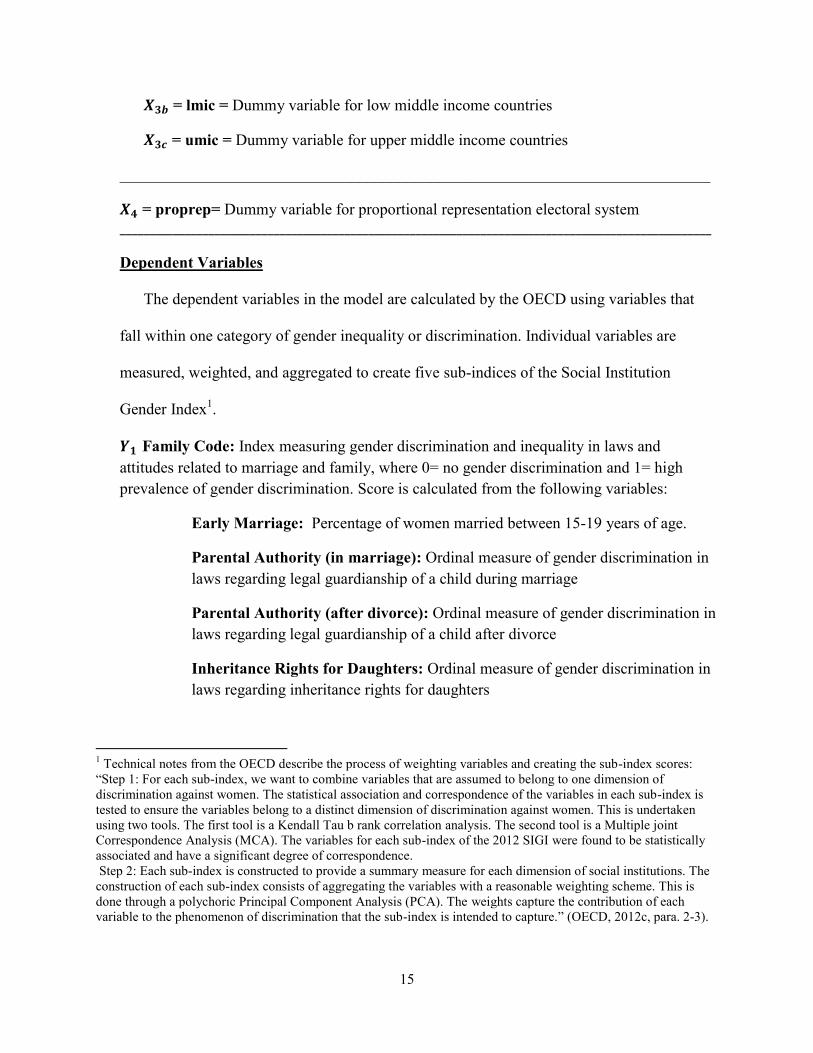
15
= lmic = Dummy variable for low middle income countries
= umic = Dummy variable for upper middle income countries
__________________________________________________________________________
= proprep= Dummy variable for proportional representation electoral system
Dependent Variables
The dependent variables in the model are calculated by the OECD using variables that
fall within one category of gender inequality or discrimination. Individual variables are
measured, weighted, and aggregated to create five sub-indices of the Social Institution
Gender Index1.
Family Code: Index measuring gender discrimination and inequality in laws and
attitudes related to marriage and family, where 0= no gender discrimination and 1= high
prevalence of gender discrimination. Score is calculated from the following variables:
Early Marriage: Percentage of women married between 15-19 years of age.
Parental Authority (in marriage): Ordinal measure of gender discrimination in
laws regarding legal guardianship of a child during marriage
Parental Authority (after divorce): Ordinal measure of gender discrimination in
laws regarding legal guardianship of a child after divorce
Inheritance Rights for Daughters: Ordinal measure of gender discrimination in
laws regarding inheritance rights for daughters
1 Technical notes from the OECD describe the process of weighting variables and creating the sub-index scores:
“Step 1: For each sub-index, we want to combine variables that are assumed to belong to one dimension of
discrimination against women. The statistical association and correspondence of the variables in each sub-index is
tested to ensure the variables belong to a distinct dimension of discrimination against women. This is undertaken
using two tools. The first tool is a Kendall Tau b rank correlation analysis. The second tool is a Multiple joint
Correspondence Analysis (MCA). The variables for each sub-index of the 2012 SIGI were found to be statistically
associated and have a significant degree of correspondence.
Step 2: Each sub-index is constructed to provide a summary measure for each dimension of social institutions. The
construction of each sub-index consists of aggregating the variables with a reasonable weighting scheme. This is
done through a polychoric Principal Component Analysis (PCA). The weights capture the contribution of each
variable to the phenomenon of discrimination that the sub-index is intended to capture.” (OECD, 2012c, para. 2-3).
16
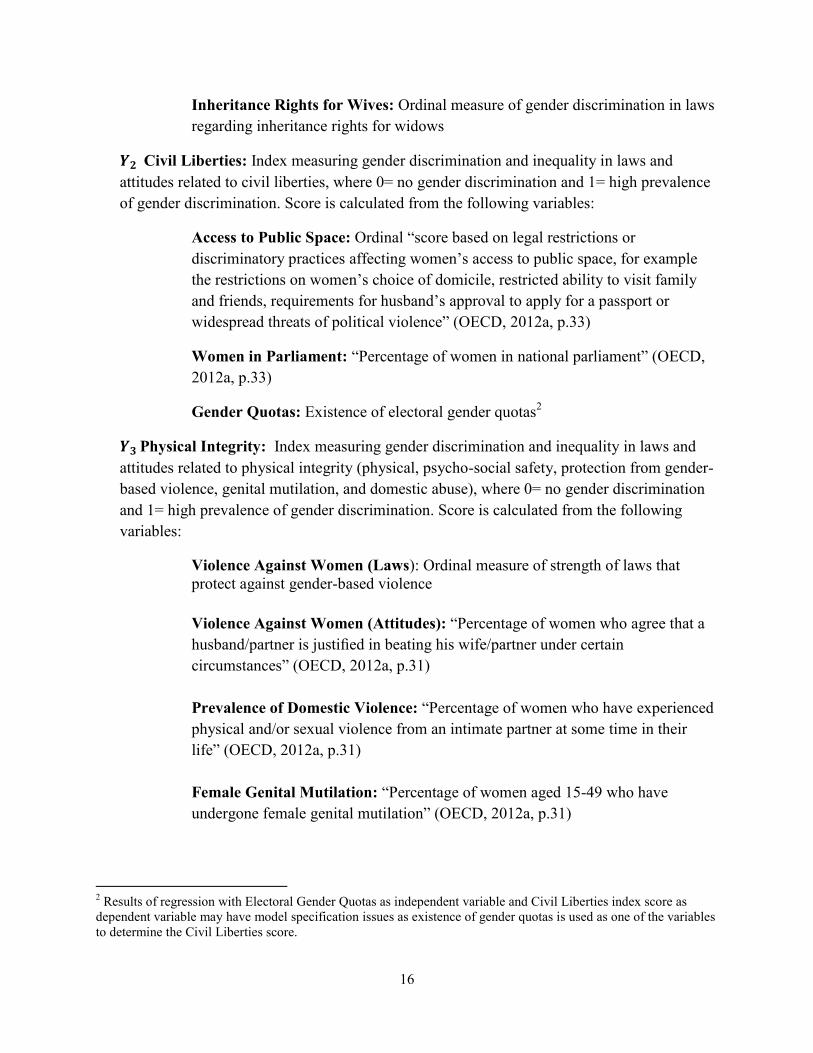
Inheritance Rights for Wives: Ordinal measure of gender discrimination in laws
regarding inheritance rights for widows
Civil Liberties: Index measuring gender discrimination and inequality in laws and
attitudes related to civil liberties, where 0= no gender discrimination and 1= high prevalence
of gender discrimination. Score is calculated from the following variables:
Access to Public Space: Ordinal “score based on legal restrictions or
discriminatory practices affecting women’s access to public space, for example
the restrictions on women’s choice of domicile, restricted ability to visit family
and friends, requirements for husband’s approval to apply for a passport or
widespread threats of political violence” (OECD, 2012a, p.33)
Women in Parliament: “Percentage of women in national parliament” (OECD,
2012a, p.33)
Gender Quotas: Existence of electoral gender quotas2
Physical Integrity: Index measuring gender discrimination and inequality in laws and
attitudes related to physical integrity (physical, psycho-social safety, protection from gender-
based violence, genital mutilation, and domestic abuse), where 0= no gender discrimination
and 1= high prevalence of gender discrimination. Score is calculated from the following
variables:
Violence Against Women (Laws): Ordinal measure of strength of laws that
protect against gender-based violence
Violence Against Women (Attitudes): “Percentage of women who agree that a
husband/partner is justified in beating his wife/partner under certain
circumstances” (OECD, 2012a, p.31)
Prevalence of Domestic Violence: “Percentage of women who have experienced
physical and/or sexual violence from an intimate partner at some time in their
life” (OECD, 2012a, p.31)
Female Genital Mutilation: “Percentage of women aged 15-49 who have
undergone female genital mutilation” (OECD, 2012a, p.31)
2 Results of regression with Electoral Gender Quotas as independent variable and Civil Liberties index score as
dependent variable may have model specification issues as existence of gender quotas is used as one of the variables
to determine the Civil Liberties score.
17
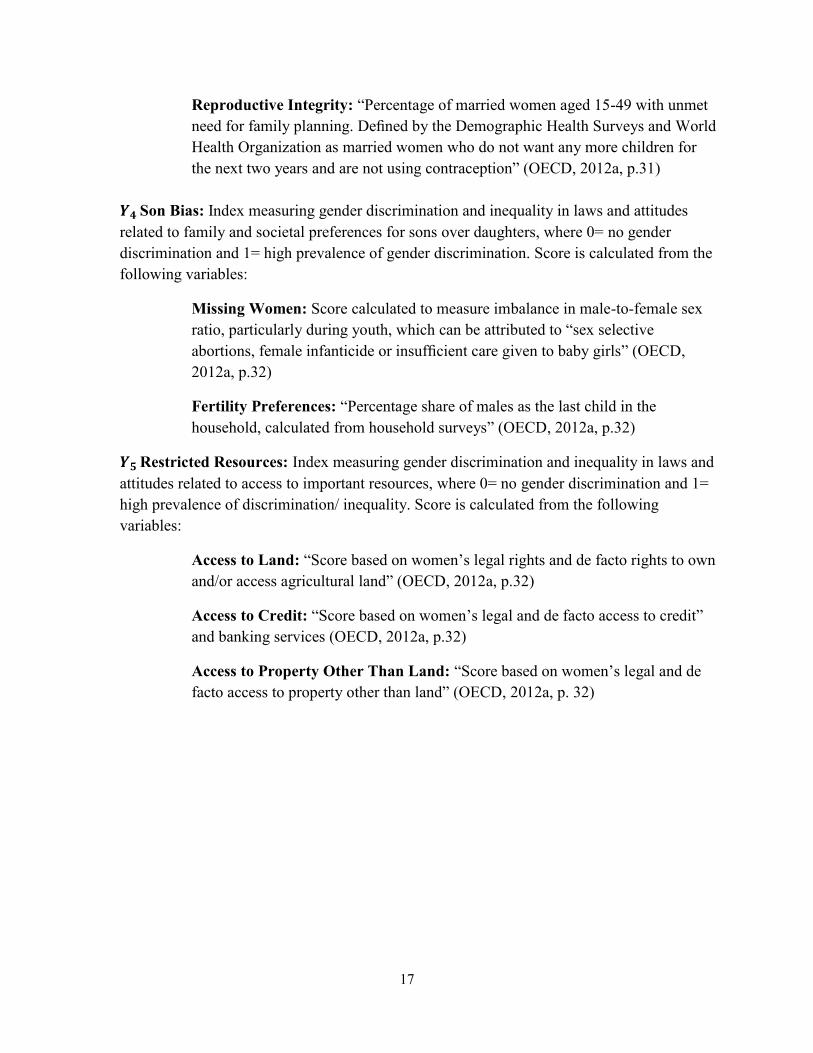
Reproductive Integrity: “Percentage of married women aged 15-49 with unmet
need for family planning. Defined by the Demographic Health Surveys and World
Health Organization as married women who do not want any more children for
the next two years and are not using contraception” (OECD, 2012a, p.31)
Son Bias: Index measuring gender discrimination and inequality in laws and attitudes
related to family and societal preferences for sons over daughters, where 0= no gender
discrimination and 1= high prevalence of gender discrimination. Score is calculated from the
following variables:
Missing Women: Score calculated to measure imbalance in male-to-female sex
ratio, particularly during youth, which can be attributed to “sex selective
abortions, female infanticide or insufficient care given to baby girls” (OECD,
2012a, p.32)
Fertility Preferences: “Percentage share of males as the last child in the
household, calculated from household surveys” (OECD, 2012a, p.32)
Restricted Resources: Index measuring gender discrimination and inequality in laws and
attitudes related to access to important resources, where 0= no gender discrimination and 1=
high prevalence of discrimination/ inequality. Score is calculated from the following
variables:
Access to Land: “Score based on women’s legal rights and de facto rights to own
and/or access agricultural land” (OECD, 2012a, p.32)
Access to Credit: “Score based on women’s legal and de facto access to credit”
and banking services (OECD, 2012a, p.32)
Access to Property Other Than Land: “Score based on women’s legal and de
facto access to property other than land” (OECD, 2012a, p. 32)
18
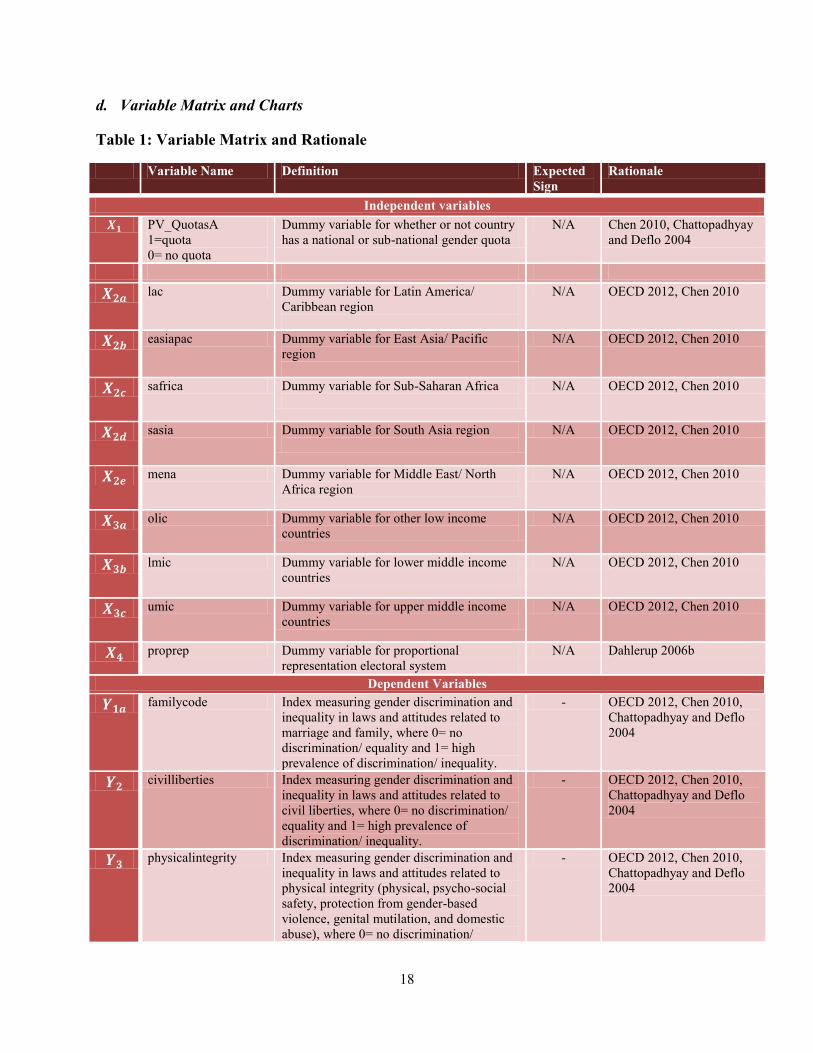
d. Variable Matrix and Charts
Table 1: Variable Matrix and Rationale
Variable Name Definition Expected
Sign
Rationale
Independent variables
PV_QuotasA
1=quota
0= no quota
Dummy variable for whether or not country
has a national or sub-national gender quota
N/A Chen 2010, Chattopadhyay
and Deflo 2004
lac Dummy variable for Latin America/
Caribbean region
N/A OECD 2012, Chen 2010
easiapac Dummy variable for East Asia/ Pacific
region
N/A OECD 2012, Chen 2010
safrica Dummy variable for Sub-Saharan Africa
N/A OECD 2012, Chen 2010
sasia Dummy variable for South Asia region
N/A OECD 2012, Chen 2010
mena Dummy variable for Middle East/ North
Africa region
N/A OECD 2012, Chen 2010
olic Dummy variable for other low income
countries
N/A OECD 2012, Chen 2010
lmic Dummy variable for lower middle income
countries
N/A OECD 2012, Chen 2010
umic Dummy variable for upper middle income
countries
N/A OECD 2012, Chen 2010
proprep Dummy variable for proportional
representation electoral system
N/A Dahlerup 2006b
Dependent Variables
familycode Index measuring gender discrimination and
inequality in laws and attitudes related to
marriage and family, where 0= no
discrimination/ equality and 1= high
prevalence of discrimination/ inequality.
- OECD 2012, Chen 2010,
Chattopadhyay and Deflo
2004
civilliberties Index measuring gender discrimination and
inequality in laws and attitudes related to
civil liberties, where 0= no discrimination/
equality and 1= high prevalence of
discrimination/ inequality.
- OECD 2012, Chen 2010,
Chattopadhyay and Deflo
2004
physicalintegrity Index measuring gender discrimination and
inequality in laws and attitudes related to
physical integrity (physical, psycho-social
safety, protection from gender-based
violence, genital mutilation, and domestic
abuse), where 0= no discrimination/
- OECD 2012, Chen 2010,
Chattopadhyay and Deflo
2004
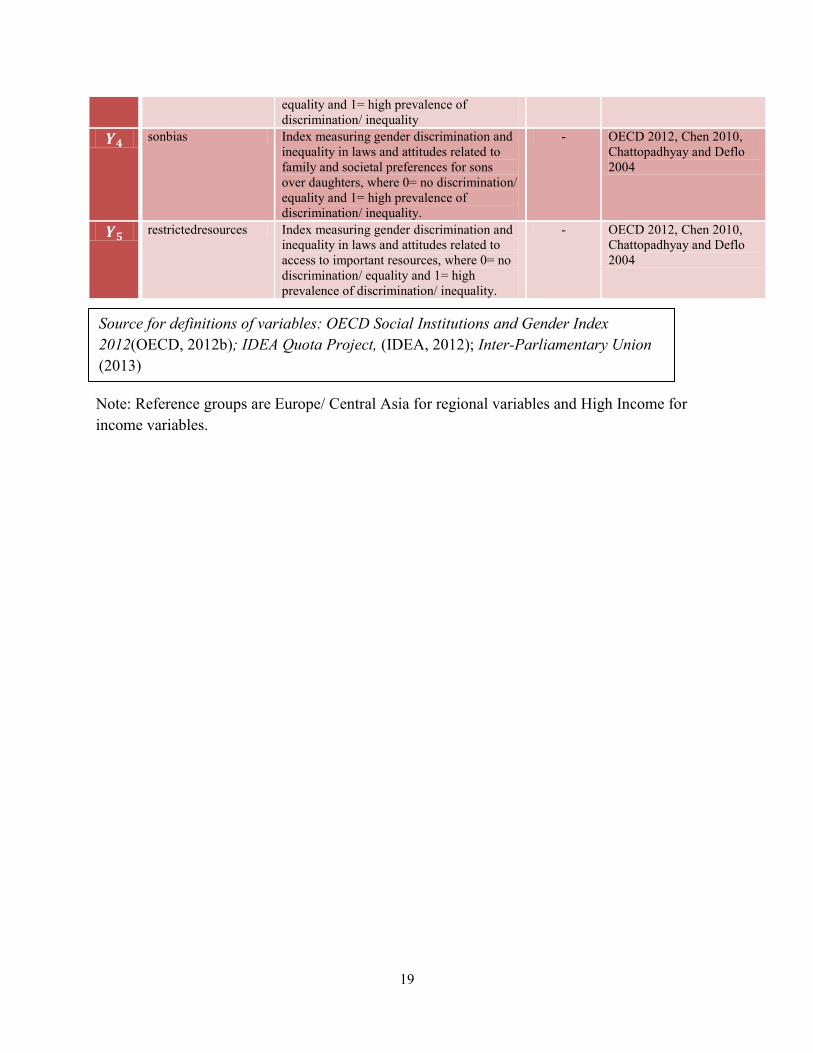
19
equality and 1= high prevalence of
discrimination/ inequality
sonbias Index measuring gender discrimination and
inequality in laws and attitudes related to
family and societal preferences for sons
over daughters, where 0= no discrimination/
equality and 1= high prevalence of
discrimination/ inequality.
- OECD 2012, Chen 2010,
Chattopadhyay and Deflo
2004
restrictedresources Index measuring gender discrimination and
inequality in laws and attitudes related to
access to important resources, where 0= no
discrimination/ equality and 1= high
prevalence of discrimination/ inequality.
- OECD 2012, Chen 2010,
Chattopadhyay and Deflo
2004
VI. ANALYSIS
Note: Reference groups are Europe/ Central Asia for regional variables and High Income for
income variables.
Source for definitions of variables: OECD Social Institutions and Gender Index
2012(OECD, 2012b); IDEA Quota Project, (IDEA, 2012); Inter-Parliamentary Union
(2013)
20
VII. ANALYSIS
a. Descriptive Results Analysis
Table 2: Prevalence of Electoral
Gender Quotas and SIGI Scores (for selected
countries, 2012)
Prevalence of Gender Discrimination
in Social Institutions
Average
Overall SIGI
Score
Countries with
Electoral Gender
Quotas
Low 0.11605753 19 (67.9 percent)
Moderate 0.2360076 17 (58.2 percent)
High 0.4032007 16 (55.2 percent)
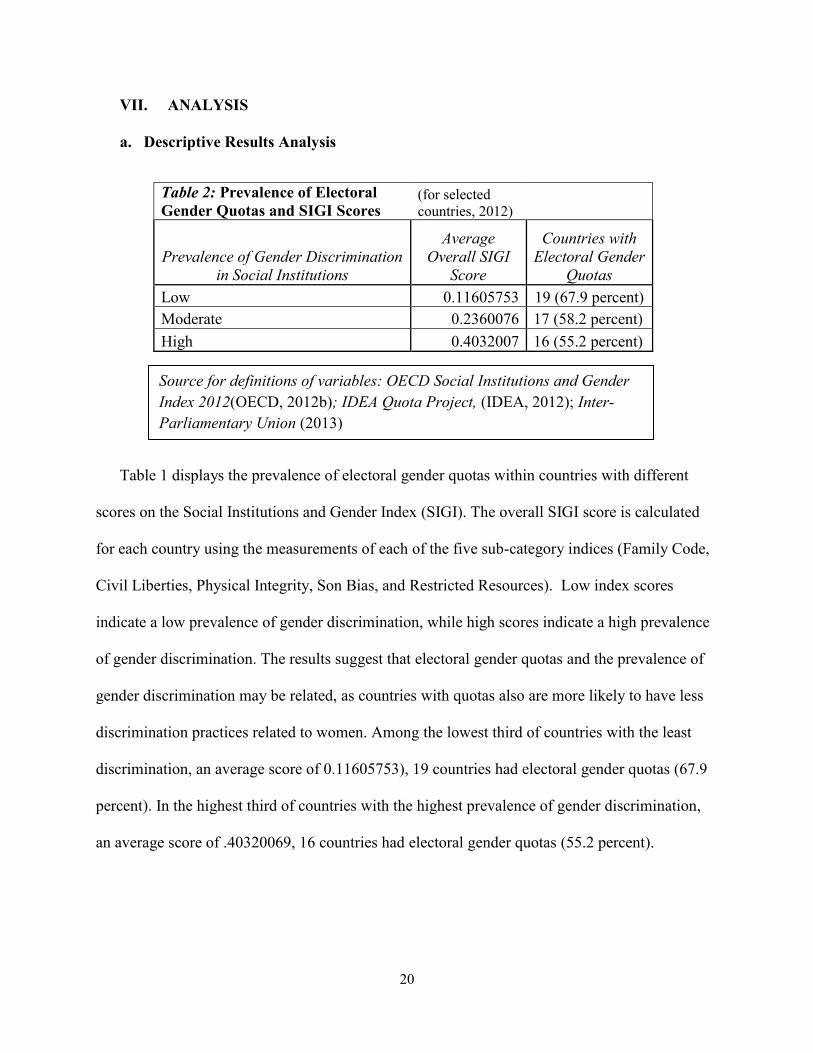
Table 1 displays the prevalence of electoral gender quotas within countries with different
scores on the Social Institutions and Gender Index (SIGI). The overall SIGI score is calculated
for each country using the measurements of each of the five sub-category indices (Family Code,
Civil Liberties, Physical Integrity, Son Bias, and Restricted Resources). Low index scores
indicate a low prevalence of gender discrimination, while high scores indicate a high prevalence
of gender discrimination. The results suggest that electoral gender quotas and the prevalence of
gender discrimination may be related, as countries with quotas also are more likely to have less
discrimination practices related to women. Among the lowest third of countries with the least
discrimination, an average score of 0.11605753), 19 countries had electoral gender quotas (67.9
percent). In the highest third of countries with the highest prevalence of gender discrimination,
an average score of .40320069, 16 countries had electoral gender quotas (55.2 percent).
Source for definitions of variables: OECD Social Institutions and Gender
Index 2012(OECD, 2012b); IDEA Quota Project, (IDEA, 2012); Inter-
Parliamentary Union (2013)
21
b. Regression Results Analysis
Table 3: OLS Regression Results with Indicators of Gender Equality as Dependent Variables
Independent (Explanatory
Variables)
Dependent Variables
(1)
Family Code
(2)
Civil
Liberties
(3)
Physical Integrity
(4)
Son Bias
(5)
Restricted Resources
Electoral Gender Quotas
-0.0172
(-0.39)
-0.461***
(-12.71)
0.0884*
(2.03)
0.0429
(1.09)
0.0620
(1.16)
Latin America/Caribbean
0.0757
(1.44)
0.00830
(0.19)
-0.0776
(-1.45)
-0.238***
(-5.20)
-0.0144
(-0.20)
East Asia/ Pacific
0.0314
0.0599
-0.0853
-0.112*
0.0441
(0.55) (1.22) (-1.37) (-2.07) (0.56)
Sub-Saharan Africa
0.313***
0.144**
0.160**
-0.258***
0.196**
(6.07) (3.34) (2.98) (-5.49) (2.80)
South Asia
0.247**
0.159*
-0.0418
0.0835
0.0760
(3.27) (2.41) (-0.56) (1.22) (0.79)
Middle East/ North Africa
0.340***
(5.46)
0.289***
(5.61)
0.190**
(2.78)
-0.0548
(-0.79)
0.137
(1.72)
Other Low Income
Countries
0.0801
(1.05)
0.0421
(0.65)
0.133
(0.73)
-0.0602
(-0.39)
0.242*
(2.53)
Lower-Middle Income
countries
0.0580
(0.83)
0.0300
(0.51)
0.0263
(0.15)
0.00572
(0.04)
0.193*
(2.24)
Upper Middle Income
Countries
-0.101
(-1.40)
-0.0189
(-0.31)
-0.0988
(-0.55)
-0.0288
(-0.19)
0.114
(1.29)
Proportional Representation
System
-0.00751
(-0.21)
0.0167
(0.55)
-0.123**
(-3.09)
-0.0610
(-1.70)
0.0334
(0.74)
_cons 0.191*
(2.58)
0.539***
(8.59)
0.348
(1.96)
0.738***
(4.93)
0.0708
(0.75)
N 114 114 99 95 115
t statistics in parentheses * p <
0.05, **
p < 0.01, ***
p < 0.001
22
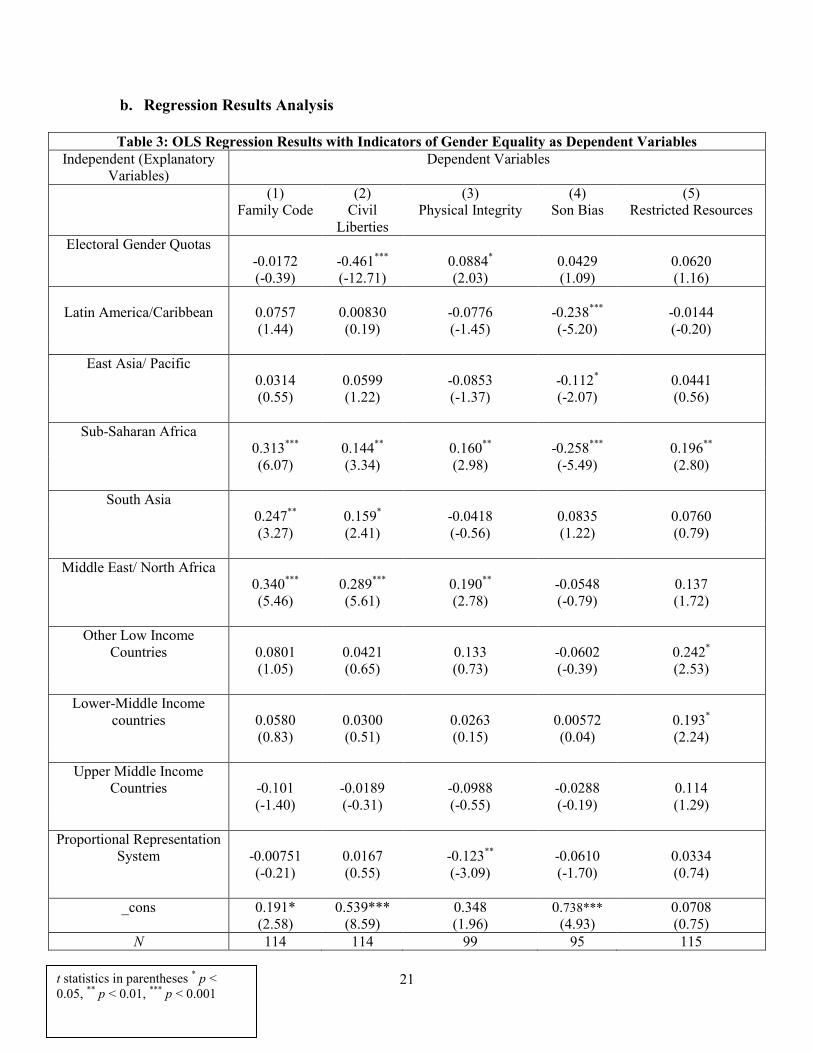
Overall, the results do not show strong support for the initial hypothesis that electoral gender
quotas are associated with lower rates of gender discrimination in social institutions.
Table 1 displays the results of ordinary least squares regressions of electoral gender quotas,
region, socioeconomic status, and proportional representation electoral system on various
measures of gender inequality. The hypothesis tested is that there is a negative relationship
between electoral gender quotas and gender discrimination in social institutions. That is, gender
quotas could be a useful policy tool to improve the standing of women in society.
Columns 1-5 show the results of the regressions with each of the respective inequality
indexes as the dependent variable. Ordinary least squares regression shows that only two of the
relationships between electoral gender quotas and the various inequality indexes are statistically
significant. All other variables in the model held constant, electoral gender quotas had a
statistically significant relationship with the Civil Liberties Index and the Physical Integrity
Index scores3.
Regression results show a strongly significant negative relationship between electoral gender
quotas and inequality in laws and institutions related to civil liberties (p < 0.001). These findings
support the hypothesis, and suggest that on average, electoral gender quotas are related to lower
rates of gender discrimination related to civil liberties. However, there is likely a model
specification error in the form of simultaneity bias. Part of the index for civil liberties is
determined by the presence of electoral gender quotas. In this case, the strong statistically
significant relationship between electoral gender quotas and the Civil Liberties Index may be due
3 Diagnostic tests suggest that Model 3 (those with Physical Integrity Resources as the dependent variables) had no
specification errors. See Appendix.
23
to the construction of the index. It could be that higher rates of violence toward women are
prompting countries to enact quotas for women in government.4
Columns 1, 4, and 5 display that no statistically significant relationship was found between
electoral gender quotas and discrimination related to family code, son bias, or restricted
resources5.
While electoral gender quotas were not found to have strong statistically significant
relationships with measures of gender discrimination, other factors in the analysis were found to
have strong significant relationships with the dependent variables. For example, several of the
regional variables were found to have statistically significant relationships with several of the
dependent variables.
Column 1 displays that Sub-Saharan Africa has a statistically significant positive relationship
with all the measures of gender discrimination. This means that on average, countries in this
region are more likely to have higher rates of gender discrimination.
South Asia, and Middle East/North Africa are also more likely to have higher rates of gender
discrimination in the laws and customs related to civil liberties, as well as family size.
Middle Eastern/North African countries are on average more likely to experience
discrimination in areas related to physical integrity, including laws and restrictions regarding
gender-based violence, female genital mutilation, and reproductive rights.
Column 4 shows that Latin American (p < 0.001), East Asian/Pacific (p < 0.05), and Sub-
Saharan Africa (p < 0.001) have a statistically significant negative relationships with the Son
4 The link test and the plot of residuals against the dependent variable suggest specification errors for Model 2 (Civil
Liberties as dependent variable). See Appendix. 5 Diagnostic tests suggest that Models 1 and 5 (those with Family Code and Restricted Resources as the dependent
variables) have no specification errors. The Ramsey’s RESET test and plot of residuals against dependent variable
suggest there may be an omitted variable problem for Model 4 (Son Bias as dependent variable). See Appendix.
24
Bias Index, indicating that on average, women in these regions were less likely to experience
discriminatory issues such as a preference for sons and the “gender bias in mortality due to sex
selective abortions, female infanticide or insufficient care given to baby girls,” more frequently
referred to as “missing women” (OECD, 2012a, p. 32).
Some of these results support the findings of the OECD Social Institution Gender Index
(SIGI) 2012 analysis regarding gender and development in different regions of the world. The
OECD ranked the Sub-Saharan Africa and Middle East/North Africa (the two regions in this
study most often associated with indicators of greater gender discrimination) as the regions with
greatest gender discrimination. Latin America/Caribbean and East Asian/ Pacific (the only two
regions in this analysis to be significantly associated with less gender discrimination) were
ranked first and second on the OECD regional rankings, indicating that these regions were found
to have the least institutional gender discrimination.
Income or socioeconomic status did not have a statistically significant relationship with most
of the indicators of gender inequality. The regression results did show that the countries within
the lowest socio-economic brackets were on average more likely to have greater discrimination
in access to resources. However the direction of the relationship is not clear from the results of
this study. It may be that gender inequality in access to resources might be a causal factor in
perpetuating low-income status, rather than low income status contributing to gender inequality.
These findings support prior research that suggests that extreme poverty is related to gender
inequality in access to resources. A World Bank report suggested that gender inequality in access
to resources is a barrier to economic development, which might help explain the statistically
significant relationship between these two variables in this study. A World Bank report described
gender inequality as an inefficient use of a country’s resources and that by
25
“hindering the accumulation of human capital in the home and the labor market, and by
systematically excluding women or men from access to resources, public services, or
productive activities, gender discrimination diminishes an economy’s capacity to grow and to
raise living standards.” (King and Mason, 2000, p.10).
This study also found that the variable for proportional representation system, the only
independent variable related to electoral systems, also had a statistically significant relationship
with one of the gender index dependent variables. Results shown in Column 3 portray a
statistically significant negative relationship between the variable for proportional representation
system and the Physical Integrity Index (p < 0.01). Countries with proportional representation
systems are less likely to exhibit gender discrimination in the laws and customs related to
physical integrity. Literature has suggested that proportional representation systems offer more
opportunities for minority or female representation through greater opportunity for “descriptive
representation” or the “extent to which a representative resembles those being represented”
(Dovi, 2011, para. 15). Norris writes that “A series of studies since the mid-1980s have
confirmed that more women have usually been elected to parliament under party list proportional
representation (PR) than under majoritarian electoral systems… . This pattern holds both within
established democracies and also across a broader range of developing societies worldwide”
(Norris, 2006, 201). The statistically significant relationship in this study suggests that
proportional representation systems may also encourage “substantive representation”, defined as
the “activity of representatives…taken on behalf of, in the interest of, as an agent of, and as a
substitute for the represented” (Dovi, 2011, para. 16). This study suggests that proportional
representation systems may encourage voting behavior that protects women’s rights to physical
integrity, without taking into account whether the representatives passing such legislation are
women themselves.
26
VII. CONCLUSIONS AND POLICY IMPLICATIONS
a) Electoral Gender Quotas
The regression results of this study did not show strong support for the hypothesis that
electoral gender quotas are related to gender inequality.
These results may in part be due to the circumstances in which gender quotas are established
in many countries. Quota systems and changes in electoral systems in general often occur after
periods of conflict or transition, when institutional change is already occurring and constitutions
are sometimes re-written. Dahlerup (2005) writes that:
“In post-conflict societies, the international community today is putting strong pressure on
the actors of reconstruction to take effective measures to include women. Thus we see gender
quotas of 25–35 percent being introduced in strongly patriarchal cultures where very few
women were represented earlier, for example, in the post-conflict societies of Afghanistan
and Iraq.” (Dahlerup, 2005, 148).
The lack of significance between electoral gender quotas and most of the discrimination
measures index scores may be due to the fact of the different environments in which gender
quotas are initiated. In some countries, gender quotas may be an indicator of a country’s existing
progress toward gender equality; in other countries, quotas may be a reaction to a long-standing
discriminatory system and discrimination may still be strongly embedded in the country’s social
practices. Gender quotas are also a fairly recent innovation in electoral construction, only
becoming common in the 1990’s and 2000’s (Dahlerup, 2005). The full impact of instituting
gender quotas may not be realized until after more election cycles.
Further study regarding the influence of electoral gender quotas could take into account other
control variables such as prevalence of recent conflict or political transition and years since a
gender quota has been instituted.
27
b) Results and Critique of Critical Mass Theory in Women’s Political Representation
While many proponents of quotas cite the importance of a critical percentage of women in
law-making bodies in order to foster pro-women policy, critics of Critical Mass Theory claim
that numbers and percentages of women in legislatures are not strong predictors of successful
women’s interest policies. Dahlerup, while a great proponent for electoral gender quotas, did
suggest that numerous other factors may also impact women’s substantive representation and the
success of pro-women’s policy. She also suggested that it may be the circumstances that
surround electoral gender quota enactment and the empowering nature of these inclusive policies
that makes them successful, not the actual percentage of women in government (Dahlerup,
2006).
Kathleen Bratton explored Critical Mass Theory in the context of state legislatures in the
United States, studying whether the percentage of women in a state legislature impacted the
success of bills they sponsored, and additionally the success of women’s interest bills. She
argued that “a ‘critical mass’ is not necessary for substantive representation on the part of
individual female state legislators” (Bratton, 2005, p.97). Instead, her results suggested the
opposite, and she found that women might even benefit from “their token status” (Bratton, 2005,
p. 115). As she explored the success rate of women’s bill sponsorship in numerous states over
time, she found several examples of women’s success rate decreasing as the percentage of
women in the legislature increased (Bratton, 2005). In her results, she observed that
“women are generally at least as likely as men to pass legislation even when they make up a
very small minority of the institution. In two states (California and Illinois), token women are
actually more successful relative to men achieving passage of the bills they sponsor.”
(Bratton, 2005, p. 121).
These results were similar even when she narrowed her study to examine only the success of
bills related to women’s interests that were sponsored by female legislators.

28
While Bratton agrees with Kanter’s conclusions that token women face increased visibility
and pressures to perform, she argues that more women than expected might take the route of
overachievement over group assimilation or efforts to diminish the appearances of their
differences. She also makes the arguments that other factors “including the mass public,
institutional climate and culture, individual partisanship and ideology, and majority party status”
(Bratton, 2005, p. 122) may have as much or more of a difference on women’s behavior in
legislature and the success of women’s interest legislation as the number and percentages of
women in office.
The results of this study may provide additional skepticism for Critical Mass Theory in the
study of women’s political participation. Additional research could look further into the role of
other factors that support and encourage women in politics, and the possible interactions among
the percentage of women in government and other environmental factors and their combined
relationship on the success of women’s interest policy.
c) Geographic Region, Socio-Economic Status, and Electoral System
This study found evidence that geographic region, socio-economic status, and existence of a
proportional representation electoral system were related to various indicators of gender
inequality. These findings suggest further areas of study and areas of need for policy
intervention.
The most substantial findings in this study were the statistically significant relationships
between certain geographic regions- primarily Sub-Saharan Africa and North Africa/ Middle
East and nearly every indicator of gender inequality. These findings support the research in
OECD’s 2012 summary of gender discrimination in social institutions, which details the
prevalence of gender inequality by geographic region. The OECD found that Sub-Saharan

29
Africa, followed by North Africa/ Middle East, were the two poorest performing regions in terms
of gender equality. The OECD report also describes unique obstacles to reform through electoral
and legislative means. In Sub-Saharan Africa, for example,
“Discrimination in the family and in accessing resources often stems from dual or tri-
partite legal systems, where customary or religious laws often discriminate against
women. Even where civil laws have been introduced to provide equal rights to
inheritance and ownership, these are not necessarily implemented or respected at a local
level due to persistent social norms and discriminatory attitudes.”(OECD 2012a).
The OECD report describes similar challenges in the Middle East, where:
“In many countries in the region, women’s rights within the family are restricted due to
the application of religious law. This includes rights in relation to consent to marriage,
choice of marriage partner (women cannot marry outside the faith), equality within
marriage (with the husband named head of household), inheritance rights, rights to
divorce and custody rights in the event of divorce.” (2012a).
In regions where enforcement of civil law is a challenge, and where customary law often takes
precedence, more women in government office and more laws promoting gender equality may
not be sufficient to mitigate discriminatory practices.
The results of this study indicate that countries Sub-Saharan Africa and the Middle East/
North Africa are more likely to discriminate against women. Evaluating successful policies- and
remaining obstacles- in these regions can help suggest future area of research and policy
development. Two countries in particular are of key interest: South Africa and Morocco. While
these countries are in the two regions ranked by the OECD as having the most gender
discrimination, they are the best-performing scoring countries in each of their respective regions,
with the low prevalence of discrimination against women. Policies that have been successful in
these two countries- and the challenges that remain- offer important feedback for policy makers.
In South Africa, recent policies have addressed discrepancies between civil and customary
law. For example, South African law now recognizes women’s custody and inheritance rights in
30
customary and polygamous marriages. South African policymakers have also tried to address
problems of gender-based violence and rape from a social perspective. In addition to
strengthening laws that protect women against domestic violence, South Africa has also
established care centers for survivors of sexual assault to provide more holistic support and to
encourage more effective reporting and conviction of offenders (OECD, 2012a).
Like South Africa, Morocco created programs that educate citizens, support women, and
address gender discrimination on a social and community-based level. The Moroccan
government particularly addressed inequalities in employment and business ownership and
“launched numerous initiatives to support women’s entrepreneurship, including numerous
trainings, income-generating projects and micro-credit initiatives targeted at women” (OECD
2012a).
Yet even in these high-performing countries, certain obstacles to gender equality remain.
South Africa struggles with enforcement of laws that protect against domestic violence. The
OECD summary also noted that “new laws to ensure women’s inheritance and property rights
also need to be accompanied by awareness-raising and enforcement efforts” (OECD 2012a). In
Morocco, gender discrimination still exists in the legal code that governs inheritance rights.
Morocco also has a high prevalence and acceptance of gender-based violence. (In Morocco“64%
of women agree that domestic violence is justified in certain circumstances”) (OECD 2012a).
These high-scoring countries illustrate many regional best practices and highlight important
challenges to gender equality and important policy implications.
i.) Improving policy implementation: This study primarily evaluated the relationship
between electoral gender quotas and measures of gender inequality. Quotas can impact
the make-up and the functioning of regional and federal governments, potentially
31
changing the type of legislation passed. Implementation of those laws can still remain a
challenge. Yet the OECD cited policy implementation as a key challenge even for high-
performing countries such as South Africa, Morocco, and numerous other countries. The
overall impact of legislation is only as powerful as the ability to implement new policy.
For example, while South Africa has legislation against rape and sexual violence,
implementation of these laws is inadequate and these crimes often go unreported.
ii.) Addressing gender discrimination on a community level through supportive programs:
South Africa and Morocco have both passed laws that reform their legal code to
criminalize acts of gender discrimination or gender-based violence. But they also had
programs that supported victims or increased education on gender-based issues. Many
of the variables used to calculate OECD index scores focus on more macro-level reforms
that prohibit cases of legal discrimination. Future research on the impact of gender
quotas- and future policy designed to promote gender equality- might focus on
prescriptive measures that directly impact communities, rather than just proscriptive
measures that ban discriminatory behavior. Many of the successful programs in South
Africa and Morocco were community-based initiatives that promote gender equality,
such as the centers for victims of sexual violence in South Africa, or the educational
programs for potential female entrepreneurs in Morocco. These programs directly support
women in their communities. Through social services and advocacy, they have a unique
opportunity to provide support, educate communities, and change public views and
opinions about gender equality.
32
c) Conclusions
In social institutions ranging from inheritance rights to marriage customs, women face
discrimination and separate treatment. When women lack the capacity to control core elements
of their own lives such as their financial stability, their children’s education, or their personal
physical integrity, other areas of society can be negatively impacted.
The 2012 World Bank Gender Equality and Development Report emphasizes the importance
of gender equality to successful economic growth and development:
“Gender equality is smart economics: it can enhance economic efficiency and improve
other development outcomes in three ways. First, removing barriers that prevent women
from having the same access as men to education, economic opportunities, and
productive inputs can generate broad productivity gains—gains all the more important in
a more competitive and globalized world. Second, improving women’s absolute and
relative status feeds many other development outcomes, including those for their
children. Third, leveling the playing field where women and men have equal chances to
become socially and politically active, make decisions, and shape policies—is likely to
lead over time to more representative, and more inclusive, institutions and policy choices
and thus to a better development path.”(World Bank, 2011, p.3).
According to this logic, addressing the policies that perpetuate gender inequality
will have lasting change on a country’s economic growth and development. The impact of
gender quotas on economic and legal reform is important because it can have significant
development repercussions for both women and men.
Further research on electoral gender quotas and these other variables is important to
economic, political, and human development throughout the world, as gender discrimination is
associated with poor performance on a number of development indicators. For example,
according to OECD,
“in 21 countries where social institutions discriminate against women the most (those ranked
in the top SIGI quintile), primary school completion is on average more than 15 percent
lower, nearly twice as many children suffer from malnutrition, and maternal mortality rates
are twice as high when compared with other developing countries.” (OECD, 2010, p.2).
33
It remains vitally important to study ways to combat gender inequality- not just to accomplish
fairness and equity, but to achieve development goals and to mitigate poverty. The presence of
women in elected office can be an important component to pursuing gender equity. Further study
regarding electoral gender quotas is valuable to understanding the best ways to promote
women’s descriptive and substantive representation, and to benefit from public policy that
incorporates women’s voices in the political process.
34
APPENDIX
Model 1: Dependent Variable: Family Code
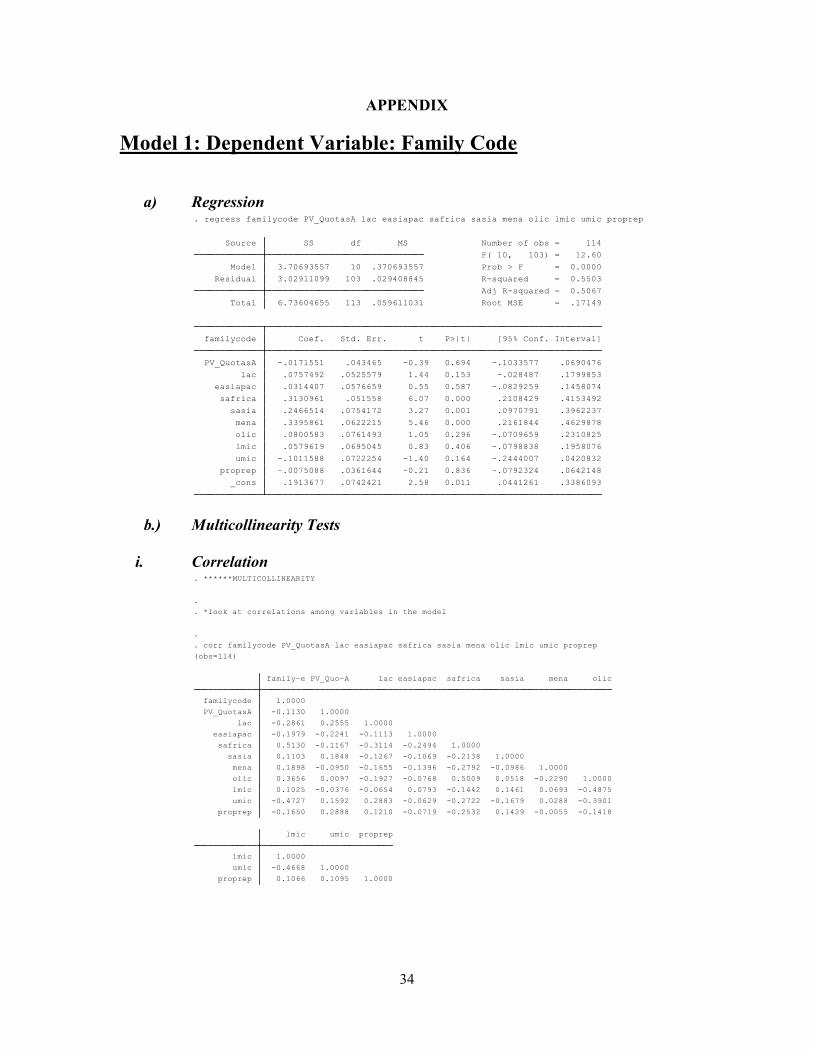
a) Regression
b.) Multicollinearity Tests
i. Correlation
_cons .1913677 .0742421 2.58 0.011 .0441261 .3386093
proprep -.0075088 .0361644 -0.21 0.836 -.0792324 .0642148
umic -.1011588 .0722254 -1.40 0.164 -.2444007 .0420832
lmic .0579619 .0695045 0.83 0.406 -.0798838 .1958076
olic .0800583 .0761493 1.05 0.296 -.0709659 .2310825
mena .3395861 .0622215 5.46 0.000 .2161844 .4629878
sasia .2466514 .0754172 3.27 0.001 .0970791 .3962237
safrica .3130961 .051558 6.07 0.000 .2108429 .4153492
easiapac .0314407 .0576659 0.55 0.587 -.0829259 .1458074
lac .0757492 .0525579 1.44 0.153 -.028487 .1799853
PV_QuotasA -.0171551 .043465 -0.39 0.694 -.1033577 .0690476
familycode Coef. Std. Err. t P>|t| [95% Conf. Interval]
Total 6.73604655 113 .059611031 Root MSE = .17149
Adj R-squared = 0.5067
Residual 3.02911099 103 .029408845 R-squared = 0.5503
Model 3.70693557 10 .370693557 Prob > F = 0.0000
F( 10, 103) = 12.60
Source SS df MS Number of obs = 114
. regress familycode PV_QuotasA lac easiapac safrica sasia mena olic lmic umic proprep
proprep 0.1066 0.1095 1.0000
umic -0.4668 1.0000
lmic 1.0000
lmic umic proprep
proprep -0.1650 0.2888 0.1210 -0.0719 -0.2532 0.1429 -0.0055 -0.1418
umic -0.4727 0.1592 0.2883 -0.0629 -0.2722 -0.1679 0.0288 -0.3901
lmic 0.1025 -0.0376 -0.0654 0.0793 -0.1442 0.1461 0.0693 -0.4875
olic 0.3656 0.0097 -0.1927 -0.0768 0.5009 0.0518 -0.2290 1.0000
mena 0.1898 -0.0950 -0.1655 -0.1396 -0.2792 -0.0986 1.0000
sasia 0.1103 0.1848 -0.1267 -0.1069 -0.2138 1.0000
safrica 0.5130 -0.1167 -0.3114 -0.2494 1.0000
easiapac -0.1979 -0.2241 -0.1113 1.0000
lac -0.2861 0.2555 1.0000
PV_QuotasA -0.1130 1.0000
familycode 1.0000
family~e PV_Quo~A lac easiapac safrica sasia mena olic
(obs=114)
. corr familycode PV_QuotasA lac easiapac safrica sasia mena olic lmic umic proprep
.
. *look at correlations among variables in the model
.
. ******MULTICOLLINEARITY
35
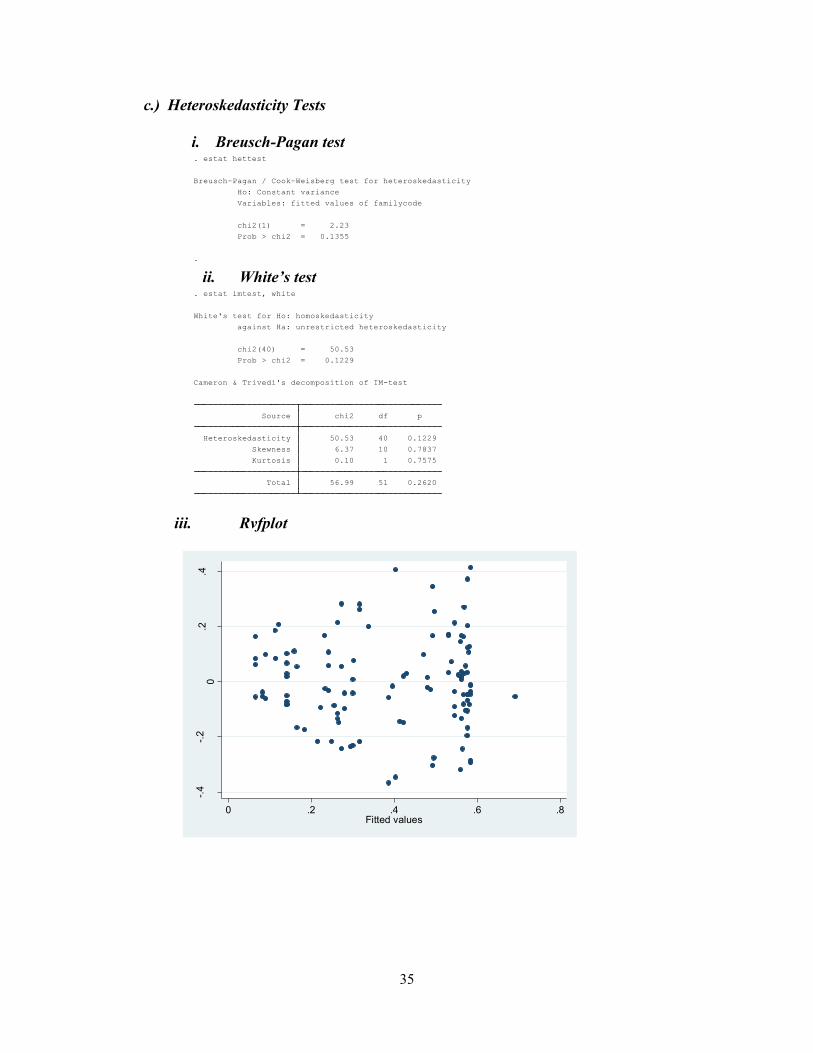
c.) Heteroskedasticity Tests
i. Breusch-Pagan test
ii. White’s test
iii. Rvfplot
.
Prob > chi2 = 0.1355
chi2(1) = 2.23
Variables: fitted values of familycode
Ho: Constant variance
Breusch-Pagan / Cook-Weisberg test for heteroskedasticity
. estat hettest
Total 56.99 51 0.2620
Kurtosis 0.10 1 0.7575
Skewness 6.37 10 0.7837
Heteroskedasticity 50.53 40 0.1229
Source chi2 df p
Cameron & Trivedi's decomposition of IM-test
Prob > chi2 = 0.1229
chi2(40) = 50.53
against Ha: unrestricted heteroskedasticity
White's test for Ho: homoskedasticity
. estat imtest, white
-.4
-.2
0.2
.4
Resid
uals
0 .2 .4 .6 .8Fitted values
36
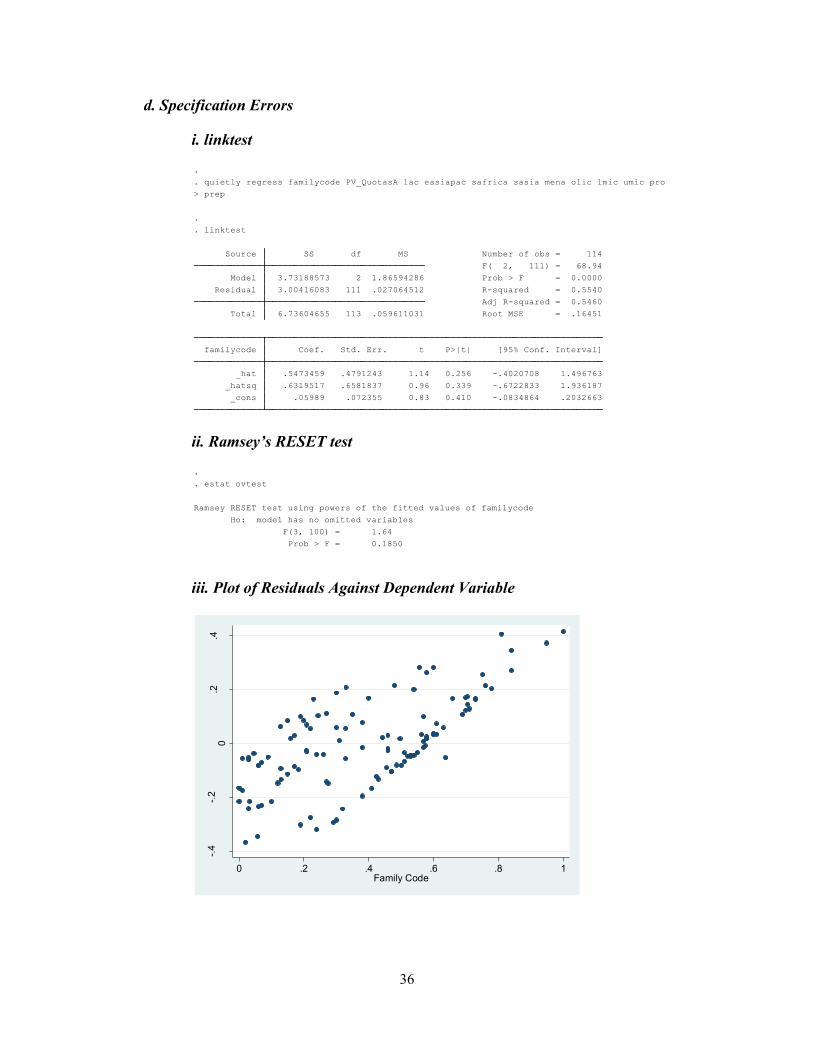
d. Specification Errors
i. linktest
ii. Ramsey’s RESET test
iii. Plot of Residuals Against Dependent Variable
_cons .05989 .072355 0.83 0.410 -.0834864 .2032663
_hatsq .6319517 .6581837 0.96 0.339 -.6722833 1.936187
_hat .5473459 .4791243 1.14 0.256 -.4020708 1.496763
familycode Coef. Std. Err. t P>|t| [95% Conf. Interval]
Total 6.73604655 113 .059611031 Root MSE = .16451
Adj R-squared = 0.5460
Residual 3.00416083 111 .027064512 R-squared = 0.5540
Model 3.73188573 2 1.86594286 Prob > F = 0.0000
F( 2, 111) = 68.94
Source SS df MS Number of obs = 114
. linktest
.
> prep
. quietly regress familycode PV_QuotasA lac easiapac safrica sasia mena olic lmic umic pro
.
Prob > F = 0.1850
F(3, 100) = 1.64
Ho: model has no omitted variables
Ramsey RESET test using powers of the fitted values of familycode
. estat ovtest
.
-.4
-.2
0.2
.4
Resid
uals
0 .2 .4 .6 .8 1Family Code
37
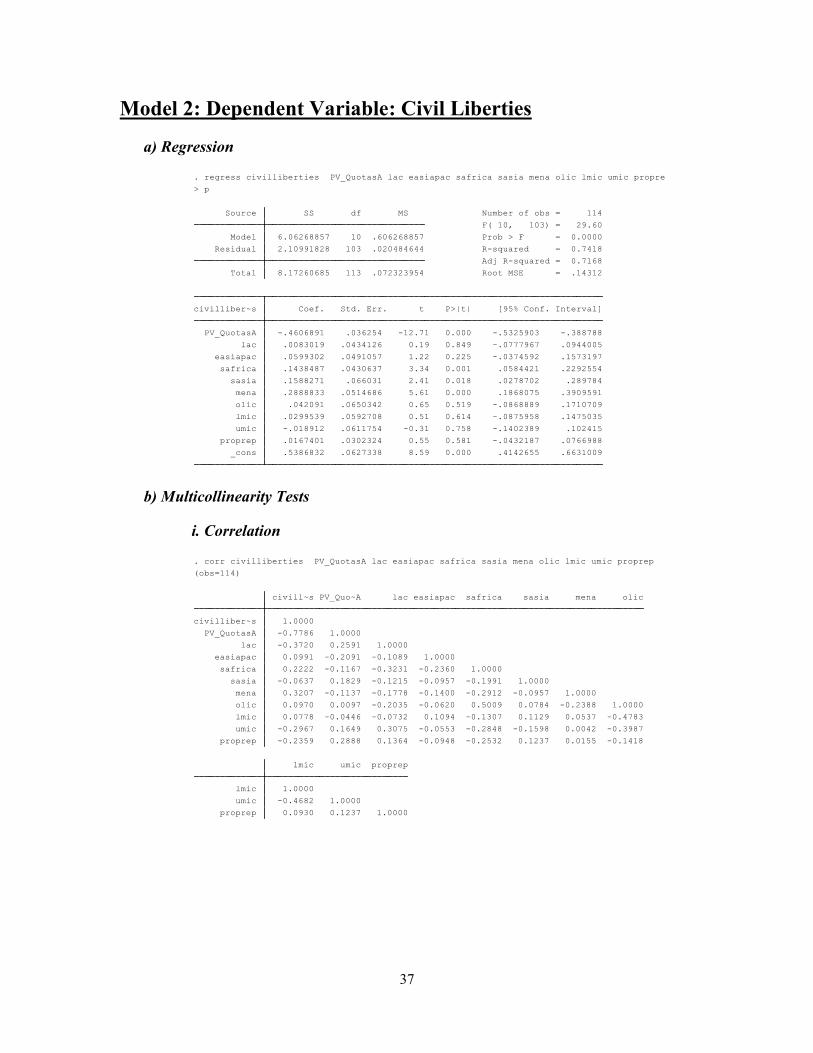
Model 2: Dependent Variable: Civil Liberties
a) Regression
b) Multicollinearity Tests
i. Correlation
_cons .5386832 .0627338 8.59 0.000 .4142655 .6631009
proprep .0167401 .0302324 0.55 0.581 -.0432187 .0766988
umic -.018912 .0611754 -0.31 0.758 -.1402389 .102415
lmic .0299539 .0592708 0.51 0.614 -.0875958 .1475035
olic .042091 .0650342 0.65 0.519 -.0868889 .1710709
mena .2888833 .0514686 5.61 0.000 .1868075 .3909591
sasia .1588271 .066031 2.41 0.018 .0278702 .289784
safrica .1438487 .0430637 3.34 0.001 .0584421 .2292554
easiapac .0599302 .0491057 1.22 0.225 -.0374592 .1573197
lac .0083019 .0434126 0.19 0.849 -.0777967 .0944005
PV_QuotasA -.4606891 .036254 -12.71 0.000 -.5325903 -.388788
civilliber~s Coef. Std. Err. t P>|t| [95% Conf. Interval]
Total 8.17260685 113 .072323954 Root MSE = .14312
Adj R-squared = 0.7168
Residual 2.10991828 103 .020484644 R-squared = 0.7418
Model 6.06268857 10 .606268857 Prob > F = 0.0000
F( 10, 103) = 29.60
Source SS df MS Number of obs = 114
> p
. regress civilliberties PV_QuotasA lac easiapac safrica sasia mena olic lmic umic propre
proprep 0.0930 0.1237 1.0000
umic -0.4682 1.0000
lmic 1.0000
lmic umic proprep
proprep -0.2359 0.2888 0.1364 -0.0948 -0.2532 0.1237 0.0155 -0.1418
umic -0.2967 0.1649 0.3075 -0.0553 -0.2848 -0.1598 0.0042 -0.3987
lmic 0.0778 -0.0446 -0.0732 0.1094 -0.1307 0.1129 0.0537 -0.4783
olic 0.0970 0.0097 -0.2035 -0.0620 0.5009 0.0784 -0.2388 1.0000
mena 0.3207 -0.1137 -0.1778 -0.1400 -0.2912 -0.0957 1.0000
sasia -0.0637 0.1829 -0.1215 -0.0957 -0.1991 1.0000
safrica 0.2222 -0.1167 -0.3231 -0.2360 1.0000
easiapac 0.0991 -0.2091 -0.1089 1.0000
lac -0.3720 0.2591 1.0000
PV_QuotasA -0.7786 1.0000
civilliber~s 1.0000
civill~s PV_Quo~A lac easiapac safrica sasia mena olic
(obs=114)
. corr civilliberties PV_QuotasA lac easiapac safrica sasia mena olic lmic umic proprep
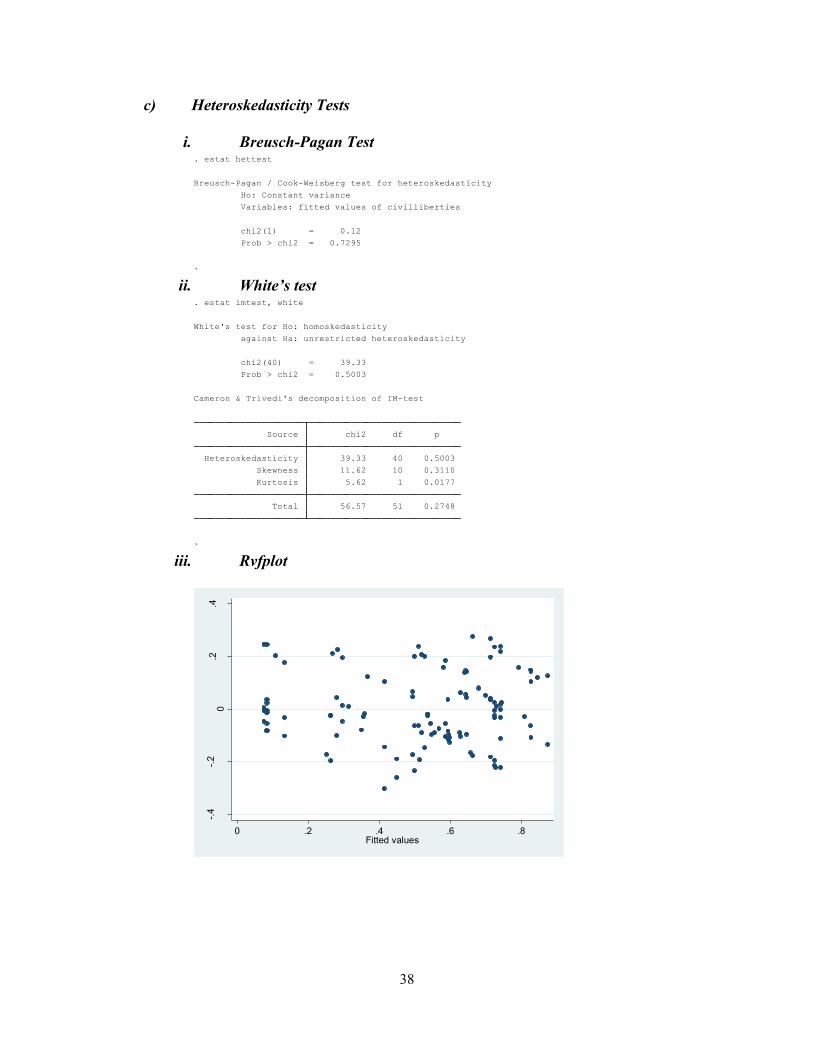
38
c) Heteroskedasticity Tests
i. Breusch-Pagan Test
ii. White’s test
iii. Rvfplot
.
Prob > chi2 = 0.7295
chi2(1) = 0.12
Variables: fitted values of civilliberties
Ho: Constant variance
Breusch-Pagan / Cook-Weisberg test for heteroskedasticity
. estat hettest
.
Total 56.57 51 0.2748
Kurtosis 5.62 1 0.0177
Skewness 11.62 10 0.3110
Heteroskedasticity 39.33 40 0.5003
Source chi2 df p
Cameron & Trivedi's decomposition of IM-test
Prob > chi2 = 0.5003
chi2(40) = 39.33
against Ha: unrestricted heteroskedasticity
White's test for Ho: homoskedasticity
. estat imtest, white
-.4
-.2
0.2
.4
Resid
uals
0 .2 .4 .6 .8Fitted values
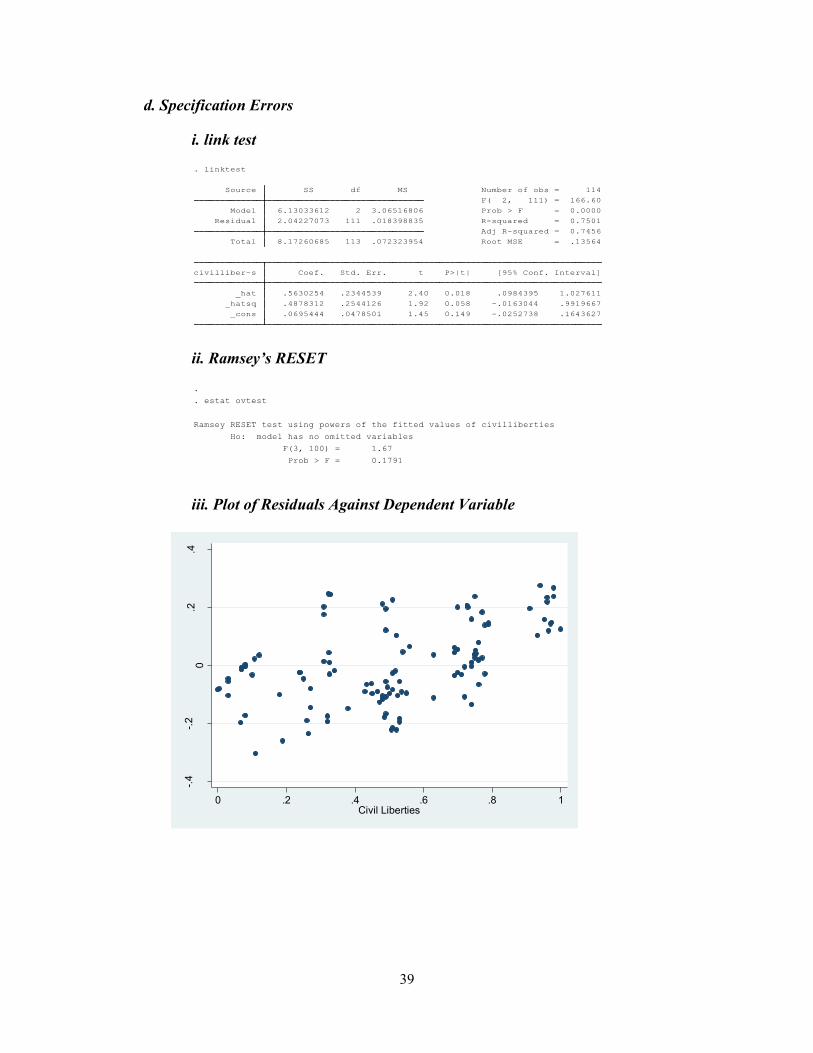
39
d. Specification Errors
i. link test
ii. Ramsey’s RESET
iii. Plot of Residuals Against Dependent Variable
.
.
.
_cons .0695444 .0478501 1.45 0.149 -.0252738 .1643627
_hatsq .4878312 .2544126 1.92 0.058 -.0163044 .9919667
_hat .5630254 .2344539 2.40 0.018 .0984395 1.027611
civilliber~s Coef. Std. Err. t P>|t| [95% Conf. Interval]
Total 8.17260685 113 .072323954 Root MSE = .13564
Adj R-squared = 0.7456
Residual 2.04227073 111 .018398835 R-squared = 0.7501
Model 6.13033612 2 3.06516806 Prob > F = 0.0000
F( 2, 111) = 166.60
Source SS df MS Number of obs = 114
. linktest
Prob > F = 0.1791
F(3, 100) = 1.67
Ho: model has no omitted variables
Ramsey RESET test using powers of the fitted values of civilliberties
. estat ovtest
.
-.4
-.2
0.2
.4
Resid
uals
0 .2 .4 .6 .8 1Civil Liberties

40
Model 3: Dependent Variable: Physical Integrity
a) Regression
b. Multicollinearity Tests
i. Correlations
_cons .3475991 .1769015 1.96 0.053 -.0039555 .6991537
proprep -.1225477 .0396078 -3.09 0.003 -.2012598 -.0438355
umic -.098765 .1780684 -0.55 0.581 -.4526386 .2551086
lmic .0263351 .1792475 0.15 0.884 -.3298816 .3825517
olic .1330103 .182502 0.73 0.468 -.229674 .4956946
mena .1903865 .0685998 2.78 0.007 .0540589 .3267142
sasia -.041807 .0747085 -0.56 0.577 -.1902744 .1066604
safrica .1598443 .0537083 2.98 0.004 .0531103 .2665783
easiapac -.085318 .0622298 -1.37 0.174 -.2089866 .0383506
lac -.0775991 .0535169 -1.45 0.151 -.1839527 .0287545
PV_QuotasA .0883581 .0435602 2.03 0.046 .0017914 .1749247
physicalin~y Coef. Std. Err. t P>|t| [95% Conf. Interval]
Total 5.70391865 98 .058203252 Root MSE = .16861
Adj R-squared = 0.5115
Residual 2.50184744 88 .028430085 R-squared = 0.5614
Model 3.2020712 10 .32020712 Prob > F = 0.0000
F( 10, 88) = 11.26
Source SS df MS Number of obs = 99
> prep
. regress physicalintegrity PV_QuotasA lac easiapac safrica sasia mena olic lmic umic pro
proprep 0.1198 0.0738 1.0000
umic -0.4984 1.0000
lmic 1.0000
lmic umic proprep
proprep -0.3329 0.2656 0.0921 -0.0747 -0.3287 0.1417 0.1604 -0.1666
umic -0.4273 0.0992 0.2368 -0.0233 -0.2945 -0.1955 0.0973 -0.4557
lmic -0.0750 -0.0622 -0.0485 0.0668 -0.2080 0.1611 0.1262 -0.5224
olic 0.5064 -0.0150 -0.2271 -0.0382 0.5203 0.0328 -0.2185 1.0000
mena 0.0656 -0.0669 -0.1541 -0.1118 -0.2496 -0.0938 1.0000
sasia -0.0672 0.1768 -0.1445 -0.1048 -0.2340 1.0000
safrica 0.5809 -0.1454 -0.3319 -0.2130 1.0000
easiapac -0.2036 -0.1911 -0.0907 1.0000
lac -0.3486 0.2085 1.0000
PV_QuotasA -0.0085 1.0000
physicalin~y 1.0000
physic~y PV_Quo~A lac easiapac safrica sasia mena olic
(obs=99)
>
. corr physicalintegrity PV_QuotasA lac easiapac safrica sasia mena olic lmic umic proprep
.
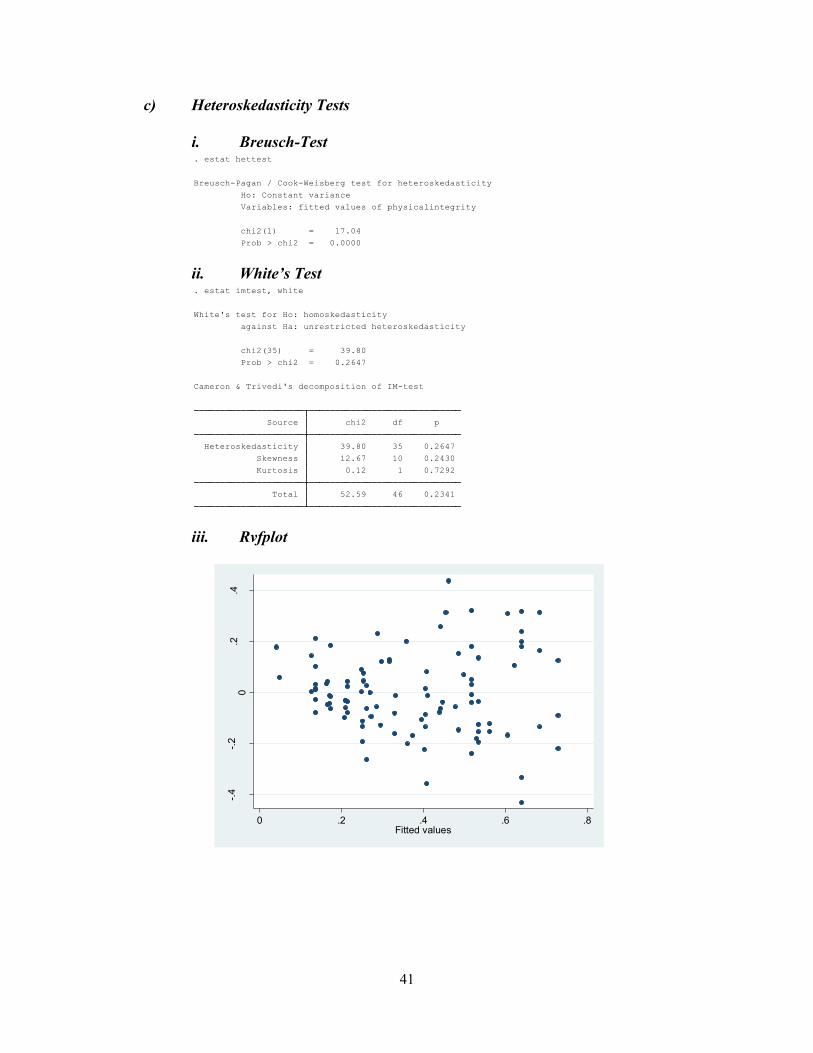
41
c) Heteroskedasticity Tests
i. Breusch-Test
ii. White’s Test
iii. Rvfplot
Prob > chi2 = 0.0000
chi2(1) = 17.04
Variables: fitted values of physicalintegrity
Ho: Constant variance
Breusch-Pagan / Cook-Weisberg test for heteroskedasticity
. estat hettest
Total 52.59 46 0.2341
Kurtosis 0.12 1 0.7292
Skewness 12.67 10 0.2430
Heteroskedasticity 39.80 35 0.2647
Source chi2 df p
Cameron & Trivedi's decomposition of IM-test
Prob > chi2 = 0.2647
chi2(35) = 39.80
against Ha: unrestricted heteroskedasticity
White's test for Ho: homoskedasticity
. estat imtest, white
-.4
-.2
0.2
.4
Resid
uals
0 .2 .4 .6 .8Fitted values
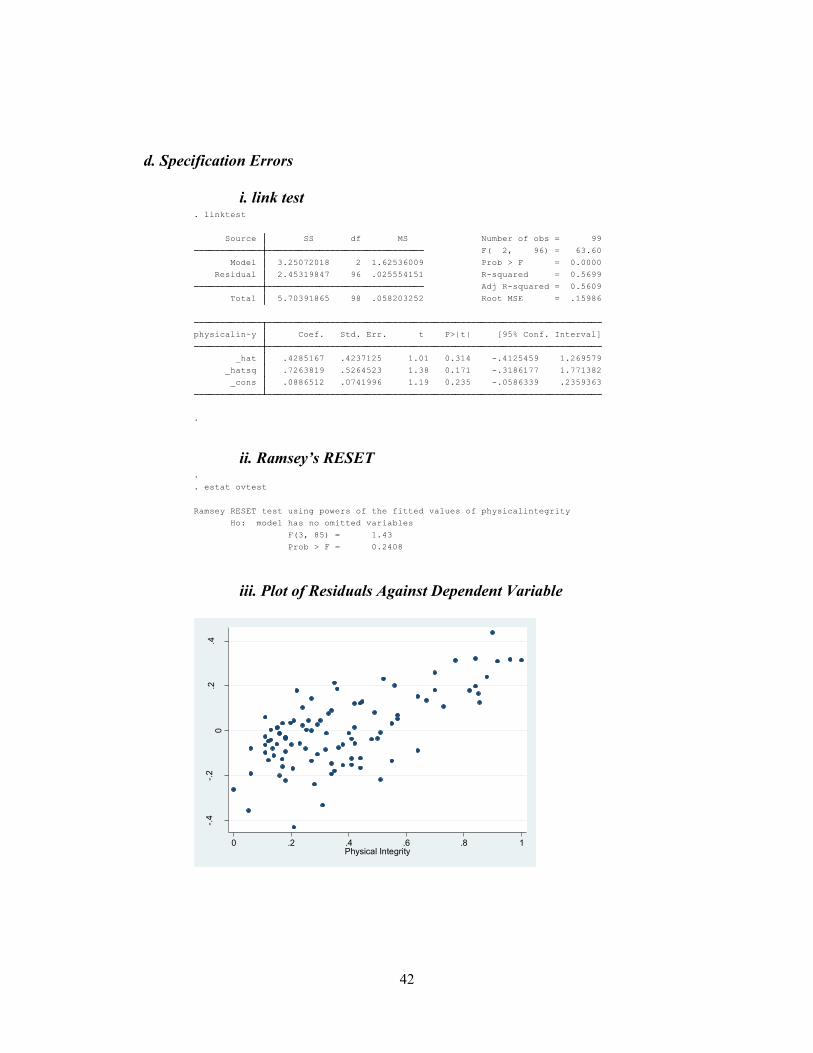
42
d. Specification Errors
i. link test
ii. Ramsey’s RESET
iii. Plot of Residuals Against Dependent Variable
.
_cons .0886512 .0741996 1.19 0.235 -.0586339 .2359363
_hatsq .7263819 .5264523 1.38 0.171 -.3186177 1.771382
_hat .4285167 .4237125 1.01 0.314 -.4125459 1.269579
physicalin~y Coef. Std. Err. t P>|t| [95% Conf. Interval]
Total 5.70391865 98 .058203252 Root MSE = .15986
Adj R-squared = 0.5609
Residual 2.45319847 96 .025554151 R-squared = 0.5699
Model 3.25072018 2 1.62536009 Prob > F = 0.0000
F( 2, 96) = 63.60
Source SS df MS Number of obs = 99
. linktest
Prob > F = 0.2408
F(3, 85) = 1.43
Ho: model has no omitted variables
Ramsey RESET test using powers of the fitted values of physicalintegrity
. estat ovtest
.
-.4
-.2
0.2
.4
Resid
uals
0 .2 .4 .6 .8 1Physical Integrity
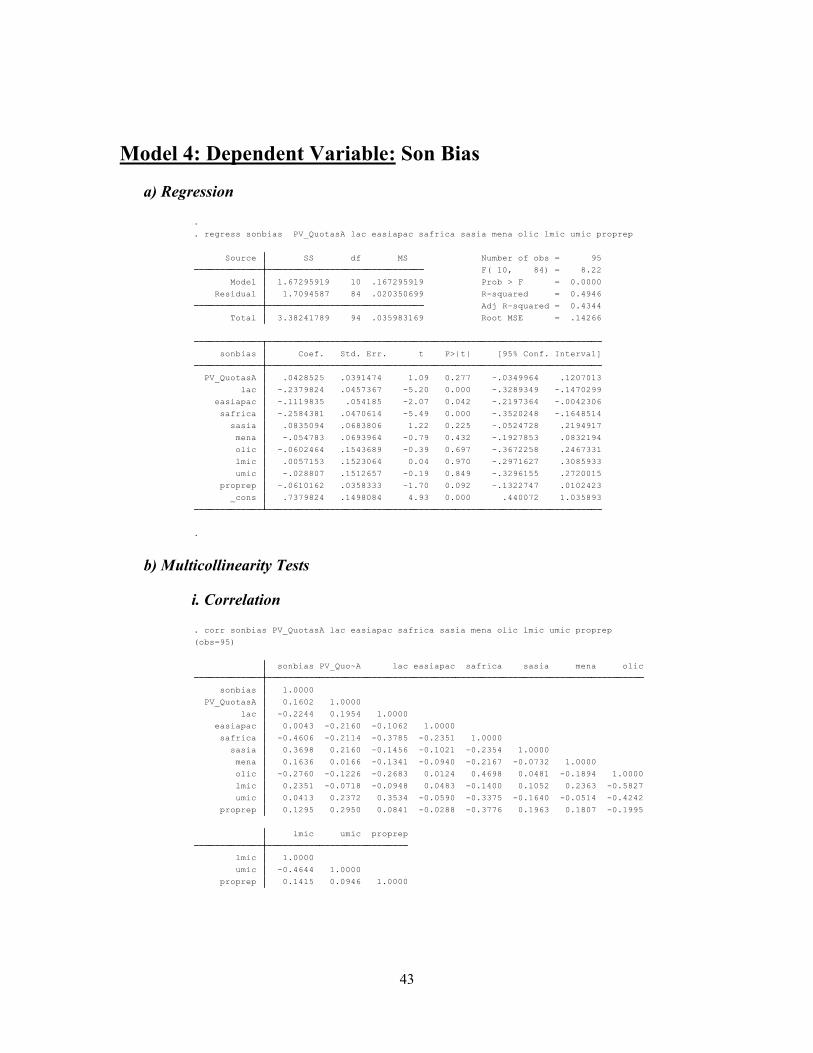
43
Model 4: Dependent Variable: Son Bias
a) Regression
b) Multicollinearity Tests
i. Correlation
.
_cons .7379824 .1498084 4.93 0.000 .440072 1.035893
proprep -.0610162 .0358333 -1.70 0.092 -.1322747 .0102423
umic -.028807 .1512657 -0.19 0.849 -.3296155 .2720015
lmic .0057153 .1523064 0.04 0.970 -.2971627 .3085933
olic -.0602464 .1543689 -0.39 0.697 -.3672258 .2467331
mena -.054783 .0693964 -0.79 0.432 -.1927853 .0832194
sasia .0835094 .0683806 1.22 0.225 -.0524728 .2194917
safrica -.2584381 .0470614 -5.49 0.000 -.3520248 -.1648514
easiapac -.1119835 .054185 -2.07 0.042 -.2197364 -.0042306
lac -.2379824 .0457367 -5.20 0.000 -.3289349 -.1470299
PV_QuotasA .0428525 .0391474 1.09 0.277 -.0349964 .1207013
sonbias Coef. Std. Err. t P>|t| [95% Conf. Interval]
Total 3.38241789 94 .035983169 Root MSE = .14266
Adj R-squared = 0.4344
Residual 1.7094587 84 .020350699 R-squared = 0.4946
Model 1.67295919 10 .167295919 Prob > F = 0.0000
F( 10, 84) = 8.22
Source SS df MS Number of obs = 95
. regress sonbias PV_QuotasA lac easiapac safrica sasia mena olic lmic umic proprep
.
proprep 0.1415 0.0946 1.0000
umic -0.4644 1.0000
lmic 1.0000
lmic umic proprep
proprep 0.1295 0.2950 0.0841 -0.0288 -0.3776 0.1963 0.1807 -0.1995
umic 0.0413 0.2372 0.3534 -0.0590 -0.3375 -0.1640 -0.0514 -0.4242
lmic 0.2351 -0.0718 -0.0948 0.0483 -0.1400 0.1052 0.2363 -0.5827
olic -0.2760 -0.1226 -0.2683 0.0124 0.4698 0.0481 -0.1894 1.0000
mena 0.1636 0.0166 -0.1341 -0.0940 -0.2167 -0.0732 1.0000
sasia 0.3698 0.2160 -0.1456 -0.1021 -0.2354 1.0000
safrica -0.4606 -0.2114 -0.3785 -0.2351 1.0000
easiapac 0.0043 -0.2160 -0.1062 1.0000
lac -0.2244 0.1954 1.0000
PV_QuotasA 0.1602 1.0000
sonbias 1.0000
sonbias PV_Quo~A lac easiapac safrica sasia mena olic
(obs=95)
. corr sonbias PV_QuotasA lac easiapac safrica sasia mena olic lmic umic proprep
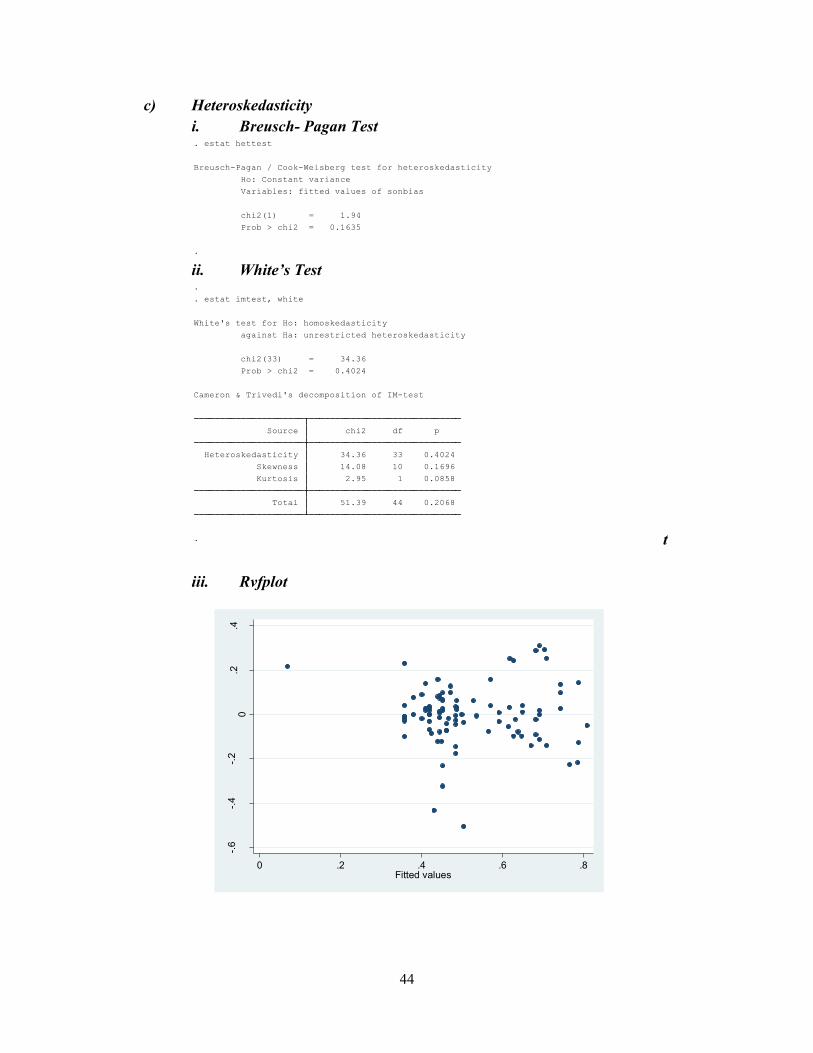
44
c) Heteroskedasticity
i. Breusch- Pagan Test
ii. White’s Test
t
iii. Rvfplot
.
Prob > chi2 = 0.1635
chi2(1) = 1.94
Variables: fitted values of sonbias
Ho: Constant variance
Breusch-Pagan / Cook-Weisberg test for heteroskedasticity
. estat hettest
.
Total 51.39 44 0.2068
Kurtosis 2.95 1 0.0858
Skewness 14.08 10 0.1696
Heteroskedasticity 34.36 33 0.4024
Source chi2 df p
Cameron & Trivedi's decomposition of IM-test
Prob > chi2 = 0.4024
chi2(33) = 34.36
against Ha: unrestricted heteroskedasticity
White's test for Ho: homoskedasticity
. estat imtest, white
.
-.6
-.4
-.2
0.2
.4
Resid
uals
0 .2 .4 .6 .8Fitted values
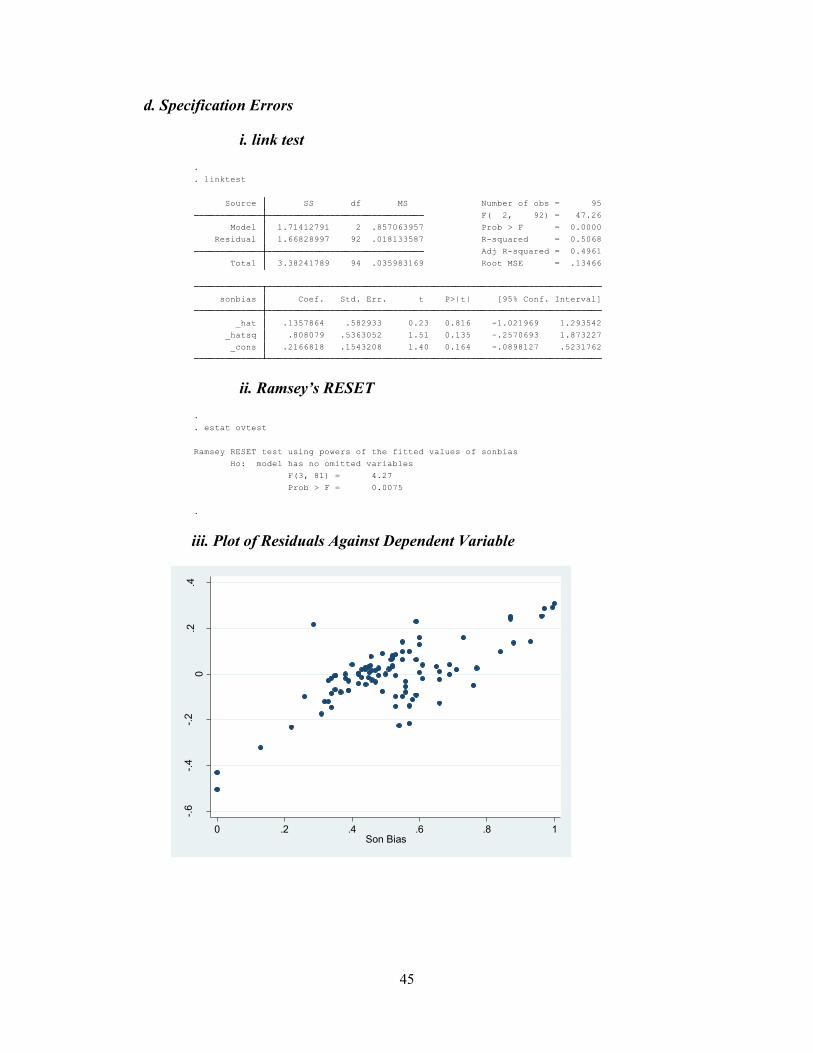
45
d. Specification Errors
i. link test
ii. Ramsey’s RESET
iii. Plot of Residuals Against Dependent Variable
_cons .2166818 .1543208 1.40 0.164 -.0898127 .5231762
_hatsq .808079 .5363052 1.51 0.135 -.2570693 1.873227
_hat .1357864 .582933 0.23 0.816 -1.021969 1.293542
sonbias Coef. Std. Err. t P>|t| [95% Conf. Interval]
Total 3.38241789 94 .035983169 Root MSE = .13466
Adj R-squared = 0.4961
Residual 1.66828997 92 .018133587 R-squared = 0.5068
Model 1.71412791 2 .857063957 Prob > F = 0.0000
F( 2, 92) = 47.26
Source SS df MS Number of obs = 95
. linktest
.
.
Prob > F = 0.0075
F(3, 81) = 4.27
Ho: model has no omitted variables
Ramsey RESET test using powers of the fitted values of sonbias
. estat ovtest
.
-.6
-.4
-.2
0.2
.4
Resid
uals
0 .2 .4 .6 .8 1Son Bias
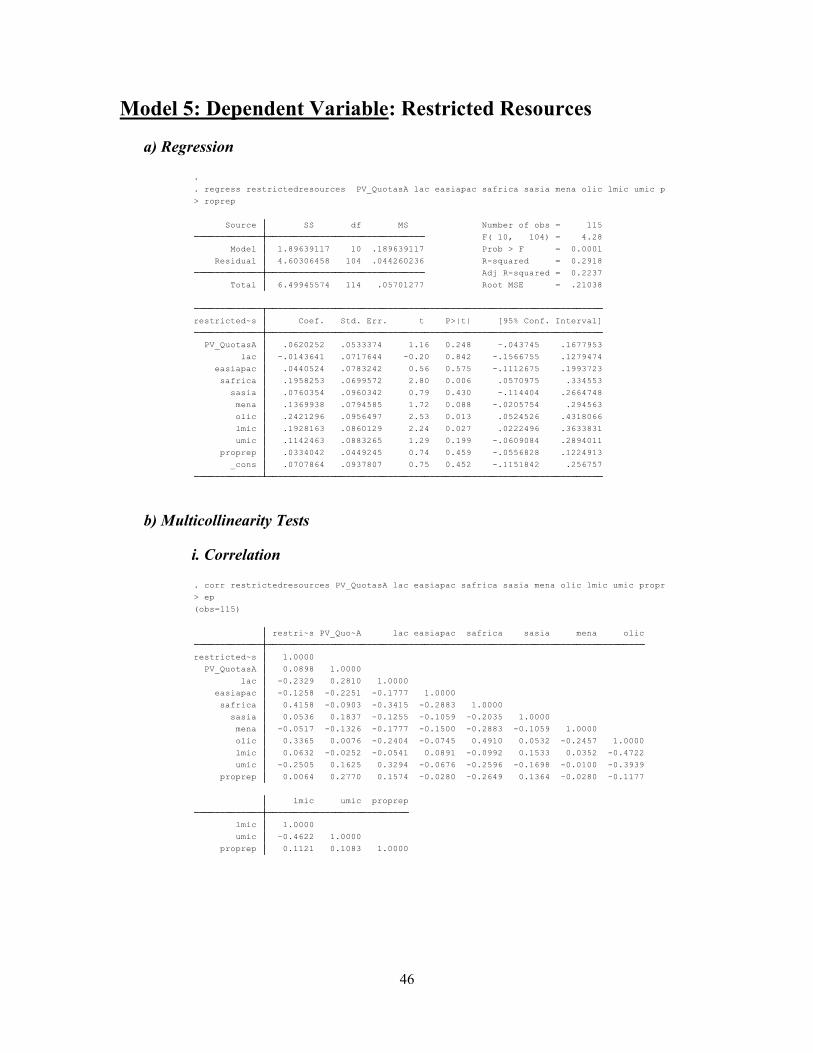
46
Model 5: Dependent Variable: Restricted Resources
a) Regression
b) Multicollinearity Tests
i. Correlation
_cons .0707864 .0937807 0.75 0.452 -.1151842 .256757
proprep .0334042 .0449245 0.74 0.459 -.0556828 .1224913
umic .1142463 .0883265 1.29 0.199 -.0609084 .2894011
lmic .1928163 .0860129 2.24 0.027 .0222496 .3633831
olic .2421296 .0956497 2.53 0.013 .0524526 .4318066
mena .1369938 .0794585 1.72 0.088 -.0205754 .294563
sasia .0760354 .0960342 0.79 0.430 -.114404 .2664748
safrica .1958253 .0699572 2.80 0.006 .0570975 .334553
easiapac .0440524 .0783242 0.56 0.575 -.1112675 .1993723
lac -.0143641 .0717644 -0.20 0.842 -.1566755 .1279474
PV_QuotasA .0620252 .0533374 1.16 0.248 -.043745 .1677953
restricted~s Coef. Std. Err. t P>|t| [95% Conf. Interval]
Total 6.49945574 114 .05701277 Root MSE = .21038
Adj R-squared = 0.2237
Residual 4.60306458 104 .044260236 R-squared = 0.2918
Model 1.89639117 10 .189639117 Prob > F = 0.0001
F( 10, 104) = 4.28
Source SS df MS Number of obs = 115
> roprep
. regress restrictedresources PV_QuotasA lac easiapac safrica sasia mena olic lmic umic p
.
proprep 0.1121 0.1083 1.0000
umic -0.4622 1.0000
lmic 1.0000
lmic umic proprep
proprep 0.0064 0.2770 0.1574 -0.0280 -0.2649 0.1364 -0.0280 -0.1177
umic -0.2505 0.1625 0.3294 -0.0676 -0.2596 -0.1698 -0.0100 -0.3939
lmic 0.0632 -0.0252 -0.0541 0.0891 -0.0992 0.1533 0.0352 -0.4722
olic 0.3365 0.0076 -0.2404 -0.0745 0.4910 0.0532 -0.2457 1.0000
mena -0.0517 -0.1326 -0.1777 -0.1500 -0.2883 -0.1059 1.0000
sasia 0.0536 0.1837 -0.1255 -0.1059 -0.2035 1.0000
safrica 0.4158 -0.0903 -0.3415 -0.2883 1.0000
easiapac -0.1258 -0.2251 -0.1777 1.0000
lac -0.2329 0.2810 1.0000
PV_QuotasA 0.0898 1.0000
restricted~s 1.0000
restri~s PV_Quo~A lac easiapac safrica sasia mena olic
(obs=115)
> ep
. corr restrictedresources PV_QuotasA lac easiapac safrica sasia mena olic lmic umic propr

47
c) Heteroskedasticity Test
i. Breusch-Pagan Test
ii. White’s Test
iii. Rvflot
Prob > chi2 = 0.3261
chi2(1) = 0.96
Variables: fitted values of restrictedresources
Ho: Constant variance
Breusch-Pagan / Cook-Weisberg test for heteroskedasticity
. estat hettest
Total 43.10 49 0.7102
Kurtosis 0.64 1 0.4234
Skewness 10.99 10 0.3587
Heteroskedasticity 31.47 38 0.7639
Source chi2 df p
Cameron & Trivedi's decomposition of IM-test
Prob > chi2 = 0.7639
chi2(38) = 31.47
against Ha: unrestricted heteroskedasticity
White's test for Ho: homoskedasticity
. estat imtest, white
-.5
0.5
Resid
uals
0 .2 .4 .6Fitted values
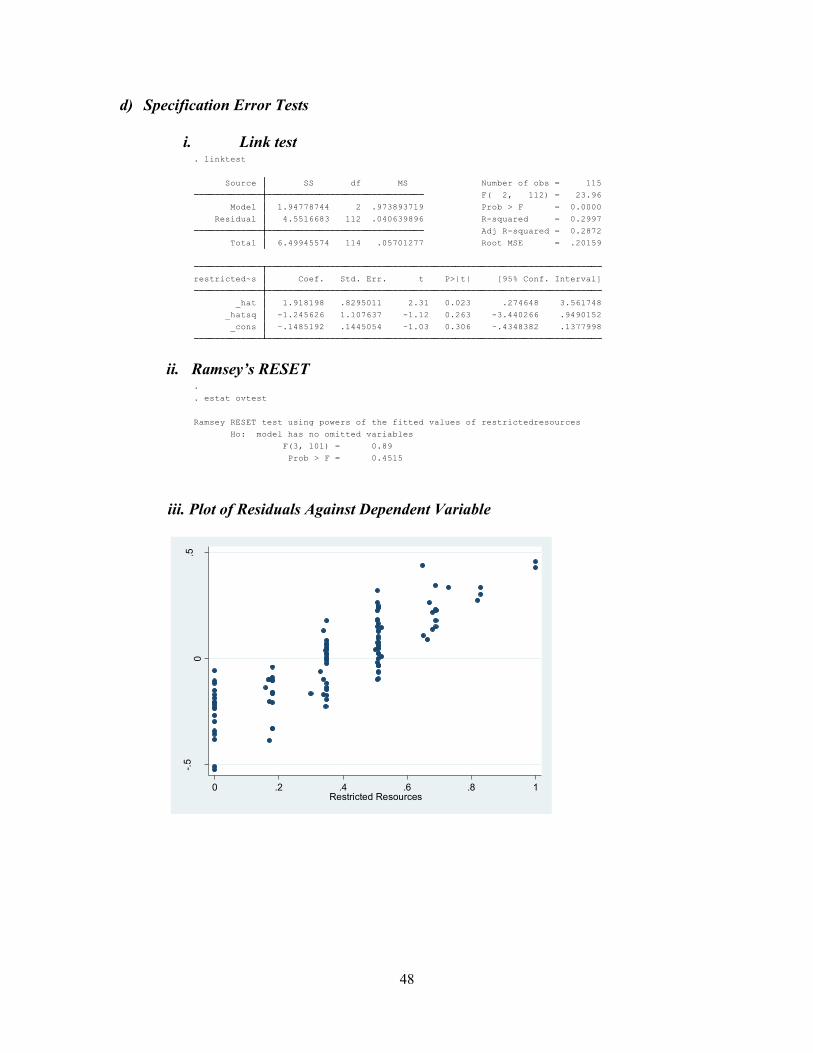
48
d) Specification Error Tests
i. Link test
ii. Ramsey’s RESET
iii. Plot of Residuals Against Dependent Variable
_cons -.1485192 .1445054 -1.03 0.306 -.4348382 .1377998
_hatsq -1.245626 1.107637 -1.12 0.263 -3.440266 .9490152
_hat 1.918198 .8295011 2.31 0.023 .274648 3.561748
restricted~s Coef. Std. Err. t P>|t| [95% Conf. Interval]
Total 6.49945574 114 .05701277 Root MSE = .20159
Adj R-squared = 0.2872
Residual 4.5516683 112 .040639896 R-squared = 0.2997
Model 1.94778744 2 .973893719 Prob > F = 0.0000
F( 2, 112) = 23.96
Source SS df MS Number of obs = 115
. linktest
Prob > F = 0.4515
F(3, 101) = 0.89
Ho: model has no omitted variables
Ramsey RESET test using powers of the fitted values of restrictedresources
. estat ovtest
.
-.5
0.5
Resid
uals
0 .2 .4 .6 .8 1Restricted Resources
49
WORKS CITED
Bratton, Kathleen. (2005). Critical Mass Theory Revisited: The Behavior and Success of Token
Women in State Legislatures. Politics and Gender, 1, 1, 97-125. Retrieved December 7,
2013 from http://dx.doi.org.proxy.library.georgetown.edu/10.1017/S1743923X0505004X
Chattopadhyay, Raghabendra and Esther Duflo. (2004).Women as Policy Makers: Evidence
from a Randomized Policy Experiment in India. Econometrica, Vol. 72, No. 5
1409–1443. Retrieved July 6, 2013 from http://economics.mit.edu/files/792 1412.
Chen, Li-Ju.(2010). Do Gender Quotas Influence Women’s Representation and Policies? The
European Journal of Comparative Economics, 7, 13-60. Retrieved August 10, 2013 from
http://eaces.liuc.it/18242979201001/182429792010070102.pdf
Childs and Krook. (2008). Critical Mass Theory and Women’s Political Representation. Political
Studies, 56, 725-736. Retrieve December 7, 2013 from
http://onlinelibrary.wiley.com.proxy.library.georgetown.edu/doi/10.1111/j.1467-
9248.2007.00712.x/pdf
Central Intelligence Agency. (2013). The World Factbook. Retrieved September 12, 2013 from
https://www.cia.gov/library/publications/the-world-factbook/geos/xx.html
Dahlerup, Drude. (2003).Comparative Studies of Electoral Gender Quotas. Drude Dahlerup.
Paper Presented at International IDEA Workshop. Lima, Peru. Retrieved July 6, 2013
from http://www.equalvoice.ca/pdf/CS_Dahlerup_25-11-2003.pdf
Dahlerup, Drude. (2005). Increasing Women’s Political Representation: New Trends in Gender
Quotas. Women in Parliament: Beyond Numbers (Revised Edition). Ed. Julie Ballington
and Azza Karam. Stockholm, Sweden: International Institute for Democracy and
Electoral Assistance.
Dahlerup, Drude and Lenita Freidenvall. (2005). Quotas as a ‘Fast Track’ to Equal
Representation for Women: Why Scandinavia is No Longer the Model. International
Feminist Journal of Politics. Electoral Assistance.
Dahlerup, Drude. (2006) The Story of the Theory of Critical Mass. Politics &Gender, 2, 4, 511-
522. Retrieved December 7, 2013 from
http://proxy.library.georgetown.edu/login?url=http://search.proquest.com/docview/19467
1526?accountid=11091
Dahlerup, Drude. (Ed.). (2006). Women, Quotas and Politics. New York, NY: Routledge 2006.
Retrieved June 8, 2013 from
http://books.google.com/books?hl=en&lr=&id=rFjdzq687R8C&oi=fnd&pg=PP2&dq=W
omen,+Quotas+and+Politics.+Routledge+2006&ots=p1TpnuejPj&sig=OsjTw3wZiu0veli
kI4tL0RHFy4g#v=onepage&q=Women%2C%20Quotas%20and%20Politics.%20Routle
dge%202006&f=false
50
Dovi, Suzanne (2011). Political Representation. The Stanford Encyclopedia of Philosophy Ed.
Edward N. Zalta. Retrieved December 8, 2013 from
http://plato.stanford.edu/archives/win2011/entries/political-representation/.
Henry, P.J. (2010). Institutional Bias. The SAGE Handbook of Prejudice, Stereotyping and
Discrimination, 426-440. Retrieved October 11, 2013 from
http://nyuad.nyu.edu/content/dam/nyuad/departments/faculty/pj-
henry/documents/publications/2010Henry-chapter-institutiona-bias.pdf
IDEA. (2013). The Quota Project Database. Stockholm, Sweden: International IDEA, Stockholm
University, and Inter-Parliamentary Union. Retrieved June 8, 2013 from
http://www.quotaproject.org/uid/search.cfm
Kanter, Rosabeth Moss. (1977). Some Effects of Proportions on Group Life: Skewed Sex Ratios
and Responses to Token Women. American Journal of Sociology, 82, 5, 965-990.
Retrieved December 7, 2013 from
http://www.jstor.org.proxy.library.georgetown.edu/stable/2777808
King, Elizabeth, and Andrew Mason. (2000). Engendering Development Through Gender
Equality in Rights, Resources, and Voice. Washington, DC: The World Bank. Retrieved
December 8, 2013 from http://www-
wds.worldbank.org/external/default/WDSContentServer/WDSP/IB/2001/02/02/00009494
6_01012505311522/Rendered/PDF/multi_page.pdf
Lovenduski, Joni and Pippa Norris. (2003). Westminster Women: the Politics of Presence.
Political Studies, 51, 84-102. Retrieved July 6, 2013 from
http://onlinelibrary.wiley.com.proxy.library.georgetown.edu/doi/10.1111/1467-
9248.00414/full
Norris, Pippa. (2006). The Impact of Electoral Reform on Women’s Representation. Acta
Politica, 41,2, 197-213. Retrieved December 6, 2013 from:
http://proxy.library.georgetown.edu/login?url=http://search.proquest.com/docview/21717
1026?accountid=11091
Organisation for Economic Co-operation and Development. (2010). Gender Inequality and the
MDGs: What are the Missing Dimensions? Retrieved August 8, 2013 from
http://www.oecd.org/dev/poverty/45987065.pdf
Organisation for Economic Co-operation and Development. (2012). 2012 Social Institutions
and Gender Index Summary: Understanding the Drivers of Gender Inequality. Retrieved
July 20, 2013 from
http://genderindex.org/sites/default/files/2012SIGIsummaryresults.pdf
Organisation for Economic Co-operation and Development. (2012). Social Institutions and
Gender Index (data file). Retrieved from
http://stats.oecd.org/Index.aspx?datasetcode=GIDDB2012#.

51
Organisation for Economic Co-operation and Development. (2012). Technical construction of
the 2012 SIGI. Retrieved 12 November 2013 from
http://genderindex.org/content/technical-construction-2012-sigi.
Pande, Rohini and Deanna Forde. (2007). Gender Quotas and Female Leadership: A Review.
Background Paper for the World Development Report on Gender. Forde. Cambridge,
Massachusetts: Harvard Kennedy School.
Pande, Rohini. (2003). Can Mandated Political Representation Increase Policy Influence for
Disadvantaged Minorities? Theory and Evidence from India. BREAD Working Paper
No. 024.
Political Representation. (n.d). (2011). In Stanford Encyclopedia of Philosophy. Retrieved 26
November, 2013 from http://plato.stanford.edu/entries/political-representation/
Powley, Elizabeth. (2005). Rwanda: Case Study. Women in Parliament: Beyond Numbers
(Revised Edition). Ed. Julie Ballington and Azza Karam. Stockholm, Sweden:
International Institute for Democracy and Electoral Assistance.
Ray, Rebecca, Janet C. Gornick, and John Schmitt (2008).“Parental Leave Policies in 21
Countries: Assessing Generosity and Gender Equality”. Center for Economic Policy and
Research.
Sacchet, Teresa. (2008). Beyond Numbers: The Impact of Gender Quotas in Latin America.
International Feminist Journal of Politics.
Sen, Amartya. (1990). More than 100 Million Women are Missing. The New York Review of
Books. Retrieved October 11, 2013 from
http://www.nybooks.com/articles/archives/1990/dec/20/more-
than-100-million-women-are-missing/?pagination=false
The World Bank. (2012). Women, Business, and the Law: Removing barriers to economic
inclusion. Washington, DC: The World Bank and the International Finance Corporation
co-publication.
The World Bank. (2011). World Development Report 2012: Gender Equality and Development.
(2011). Washington, D.C.: World Bank. Retrieved June 24, 2013 from
http://siteresources.worldbank.org/INTWDR2012/Resources/7778105-
1299699968583/7786210-1315936231894/Overview-English.pdf.
UNDATA. Seats held by women in national parliament, percentage. (2013). Millennium
Development Goals Database. UNDATA: A World of Information. Retrieved July 8,
2013 from http://data.un.org/Data.aspx?q=women&d=MDG&f=seriesRowID%3a557
United Nations Department of Economic and Social Affairs. (2010). The World’s Women:

52
Trends and Statistics. New York: United Nations Publication. Retrieved July 11, 2013
from http://www.quotaproject.org/aboutProject.cfm.
Wangnerud, Lena. (2009). Women in Parliaments: Descriptive and Substantive Representation.
The Annual Review of Political Science, 12, 51-69. Retrieved December 6, 2013 from:
http://www.annualreviews.org.proxy.library.georgetown.edu/doi/pdf/10.1146/annurev.po
lisci.11.053106.123839
Welch, Susan and Sue Thomas. (1991). Do Women in Public Office Make a Difference? Gender
and Policymaking: Studies of Women in Office. Ed. Debra L. Dodson. Rutgers Center for
the American Woman and Politics. New Brunswick, NJ: The Eagleton Institute.
World Bank. (2001). Engendering Development – Through Gender Equality in Rights,
Resources, and Voice. A World Bank Policy Research Report. New York: Oxford
University Press.