elec-e7130 internet traffic measurements and analysis
TRANSCRIPT
ELEC-E7130 Internet Traffic Measurements andAnalysis
Markus Peuhkuri
2021-09-14 (174dc5af81)
AbstractThis material is work-in-process for a part of Internet Traffic Measure-
ments and Analysis course at Aalto University. Feedback and commentsare appreciated via email or via course forum. The bibliography is alsoincomplete.
Material assumes the reader to have basic knowledge on IP networksand Internet.
Contents1 Introduction to traffic measurements 3
1.1 A very short introduction to network measurements . . . . . . . 31.2 Measuring capacity . . . . . . . . . . . . . . . . . . . . . . . . . . 4
1.2.1 How fast web sites load? . . . . . . . . . . . . . . . . . . . 61.3 Why user should care for measurements . . . . . . . . . . . . . . 61.4 Corporate subscriber needs for the measurements . . . . . . . . . 71.5 Network provider business is built on the measurements . . . . . 71.6 Goverment must know what happens in the networks . . . . . . . 91.7 Types of measurements . . . . . . . . . . . . . . . . . . . . . . . 101.8 Network provider requirements for measurements . . . . . . . . . 11
1.8.1 Network provider time scales . . . . . . . . . . . . . . . . 111.9 Vendor measurements . . . . . . . . . . . . . . . . . . . . . . . . 12
2 IP networks and how to measure them 132.1 Measurement types . . . . . . . . . . . . . . . . . . . . . . . . . . 132.2 Packets in IP Networks . . . . . . . . . . . . . . . . . . . . . . . 142.3 Flows in IP Networks . . . . . . . . . . . . . . . . . . . . . . . . 142.4 Defining network properties . . . . . . . . . . . . . . . . . . . . . 152.5 Throughput . . . . . . . . . . . . . . . . . . . . . . . . . . . . . . 162.6 Delay . . . . . . . . . . . . . . . . . . . . . . . . . . . . . . . . . 172.7 Delay variation . . . . . . . . . . . . . . . . . . . . . . . . . . . . 182.8 Error rate . . . . . . . . . . . . . . . . . . . . . . . . . . . . . . . 18
1
3 Active measurements 203.1 Co-operation in measurements . . . . . . . . . . . . . . . . . . . 203.2 Application measurements . . . . . . . . . . . . . . . . . . . . . . 213.3 Application protocol measurements . . . . . . . . . . . . . . . . . 213.4 Transmission protocol measurements . . . . . . . . . . . . . . . . 233.5 Packet level measurements . . . . . . . . . . . . . . . . . . . . . . 233.6 Uniform criteria for performance . . . . . . . . . . . . . . . . . . 253.7 Network throughput measurements . . . . . . . . . . . . . . . . . 263.8 Network delay measurements . . . . . . . . . . . . . . . . . . . . 273.9 When to measure . . . . . . . . . . . . . . . . . . . . . . . . . . . 28
4 Passive measurements 294.1 Counters . . . . . . . . . . . . . . . . . . . . . . . . . . . . . . . . 294.2 Application: log files . . . . . . . . . . . . . . . . . . . . . . . . . 314.3 Packet capture . . . . . . . . . . . . . . . . . . . . . . . . . . . . 334.4 Packet data analysis . . . . . . . . . . . . . . . . . . . . . . . . . 364.5 Flow measurements . . . . . . . . . . . . . . . . . . . . . . . . . . 374.6 Measurement sampling . . . . . . . . . . . . . . . . . . . . . . . . 37
4.6.1 Trajectory sampling . . . . . . . . . . . . . . . . . . . . . 384.7 Analysis based on passive measurements . . . . . . . . . . . . . . 39
4.7.1 Throughput measurements . . . . . . . . . . . . . . . . . 404.7.2 Delay measurements . . . . . . . . . . . . . . . . . . . . . 414.7.3 Loss measurements . . . . . . . . . . . . . . . . . . . . . . 424.7.4 Real-time transport protocol measurements . . . . . . . . 434.7.5 Encrypted connections . . . . . . . . . . . . . . . . . . . . 444.7.6 Anomaly detection . . . . . . . . . . . . . . . . . . . . . . 44
5 Concluding results 445.1 Characterising delay distribution . . . . . . . . . . . . . . . . . . 445.2 How to report quality measures to the users . . . . . . . . . . . . 455.3 User sessions . . . . . . . . . . . . . . . . . . . . . . . . . . . . . 465.4 What are the end points and use case? . . . . . . . . . . . . . . . 475.5 Interactive use . . . . . . . . . . . . . . . . . . . . . . . . . . . . 495.6 Quality needs by application . . . . . . . . . . . . . . . . . . . . 49
5.6.1 Media applications . . . . . . . . . . . . . . . . . . . . . . 495.6.2 Non-media applications . . . . . . . . . . . . . . . . . . . 50
6 Practical aspects of measurements 516.1 Time synchronisation . . . . . . . . . . . . . . . . . . . . . . . . . 52
6.1.1 Network time synchronisation . . . . . . . . . . . . . . . . 536.1.2 Out-of-band synchronisation . . . . . . . . . . . . . . . . 54
6.2 Packet capture . . . . . . . . . . . . . . . . . . . . . . . . . . . . 546.2.1 Port mirroring . . . . . . . . . . . . . . . . . . . . . . . . 546.2.2 Wiretapping . . . . . . . . . . . . . . . . . . . . . . . . . 556.2.3 High-speed capture . . . . . . . . . . . . . . . . . . . . . . 56
2
7 How to use measurements to test systems and networks 577.1 Testing devices . . . . . . . . . . . . . . . . . . . . . . . . . . . . 577.2 Testing networks . . . . . . . . . . . . . . . . . . . . . . . . . . . 587.3 Testing services . . . . . . . . . . . . . . . . . . . . . . . . . . . . 59
7.3.1 DDoS testing . . . . . . . . . . . . . . . . . . . . . . . . . 607.4 Service Level Agreements . . . . . . . . . . . . . . . . . . . . . . 61
7.4.1 Service (plural services) . . . . . . . . . . . . . . . . . . . 61
8 Privacy and protection of personal data 628.1 Identification information . . . . . . . . . . . . . . . . . . . . . . 628.2 Terminology related for data protection . . . . . . . . . . . . . . 638.3 Network measurements and identification information . . . . . . 65
8.3.1 Attacks on pseudonymisation . . . . . . . . . . . . . . . . 668.4 Statistical and scientific use . . . . . . . . . . . . . . . . . . . . . 678.5 Safeguarding data . . . . . . . . . . . . . . . . . . . . . . . . . . 68
9 References 69
1 Introduction to traffic measurementsThis material is work-in-process for a part of Internet Traffic Measurementsand Analysis course at Aalto University. Feedback and comments are appreciatedvia email or via course forum. The bibliography is also incomplete.
Material assumes the reader to have basic knowledge on IP networks andInternet.
1.1 A very short introduction to network measurementsNetworking would be much easier if there would infinite capacity with zerolatency. Until faster-than-light communication is invented, we must live withpresent physical reality limitations for latency. Available bandwidth has beenincreasing with reasonable pace, but also usage has been increasing at the same oreven faster rate. Information theoretical limits of traffic have not been exceeded,just advances in science and technology have made possible to find ways to getmore capacity. In any case, increasing network capacity bears an additional cost.
Through of history, communication has been limited latency: the speed a humancould move by foot or by some animal over long distances; maximum being aroundfew hundred kilometers a day by Pony Express routes. Optical communicationusing fires was used in many places to send an alert on attackers. Propagationspeed exceeded any other means, but information content was only one bit: weare being attacked. More advanced communication is possible using whistlesand drums. These allow distances of 5 or 10 kilometres respectively in goodconditions.
On late 18th century first practical optical telegraph lines were constructed in
3

France. These provided faster communication, but data rate was only one ortwo words in a minute. There was no way other than physically carry letters tocommunicate over oceans.
In 1830s first commercial telegraphs were invented and in 1866 first reliablyworking cable was installed across Atlantic Ocean. Communication was notcheap – sending a minimum-length message (10 words) cost weekly salary of UScongressman. Communication speed was limited mostly by operator skills.
Telephone was invented 1876 and rapidly taken in use around the world. Asnumber of end terminals was much larger than in telegraph, telephone exchangeswere deployed to reduce needed lines. Originally, each pair of lines carried onetelephone call. To increase capacity, additional lines need to be installed. Amajor question was how many lines there should be installed. If there was toofew, users were not happy because calls were blocked very often but installingtoo many become too expensive.
This is the key question still. Is the current network capable to transfer allneeded communication or should it be upgraded. Or, if network is expanded,would there be users demand. Further more, would that be economical?
In 1917 Danish mathematician Erlang published his formula E = λh thatcreated relationship between offered traffic (E), call arrival rate λ and averagecall-holding time h. When there was knowledge on λ and h, it was possible toestimate how many lines were needed. Quite often, parameters were derived frombusy hour figures. As the processes are random, it is still possible that calls blockwith certain probability. Of course, it is important to find out the parameters.There are basically two ways to do it: educated guess and measuring. Measuringmust also happen in similar population. For example, the average call durationvaries around the globe in different cultures.
Later, carrier wave made it possible to have tens of simultaneous phone calls inone coaxial cable or microwave link. Starting from 1970s, digital transmission inoptical lines becomes the standard way for long-distance communication. Thefirst Trans-Atlantic optical cable was taken in use 1988.
This course is about Internet traffic measurements. It means that we have vastlydifferent range of “call” duration and capacity expected compared to telephonenetworks. The network may also have widely variable transmission capacity.
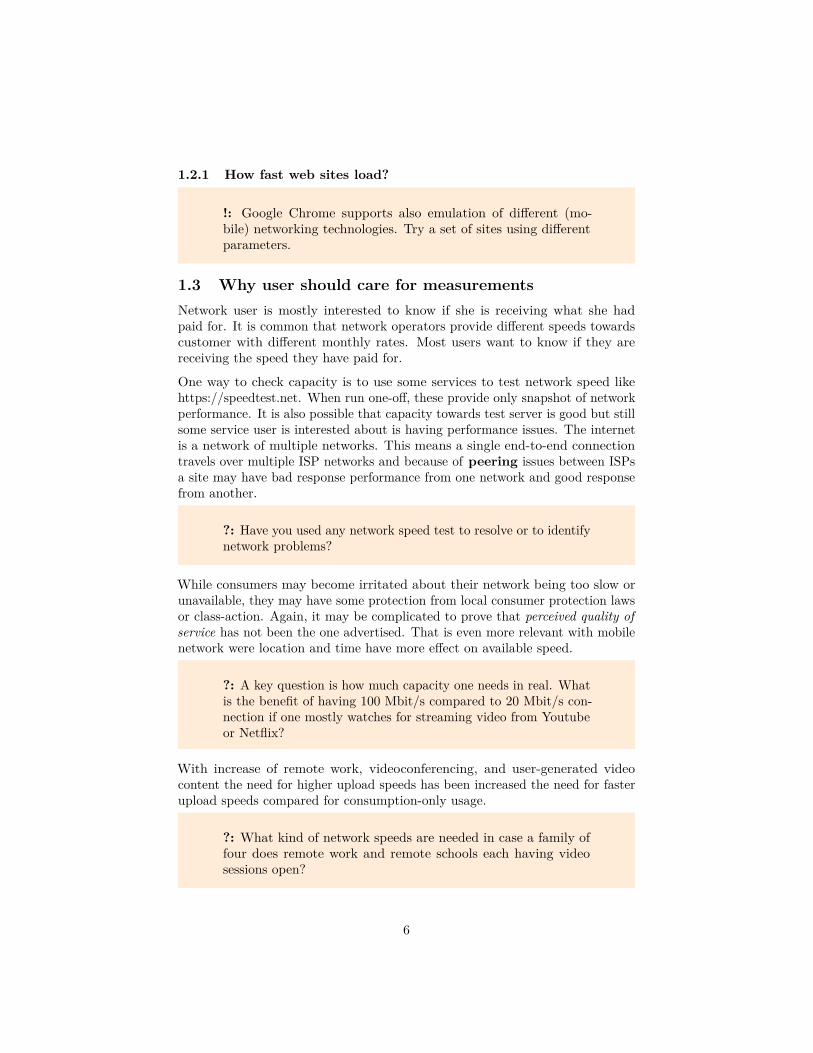
1.2 Measuring capacity
!: open web browser and open developer toolbar (in MozillaFirefox or Google Chrome: Control-Shift-I) and select network.Visit a site by typing address to location bar or select a bookmark.
4
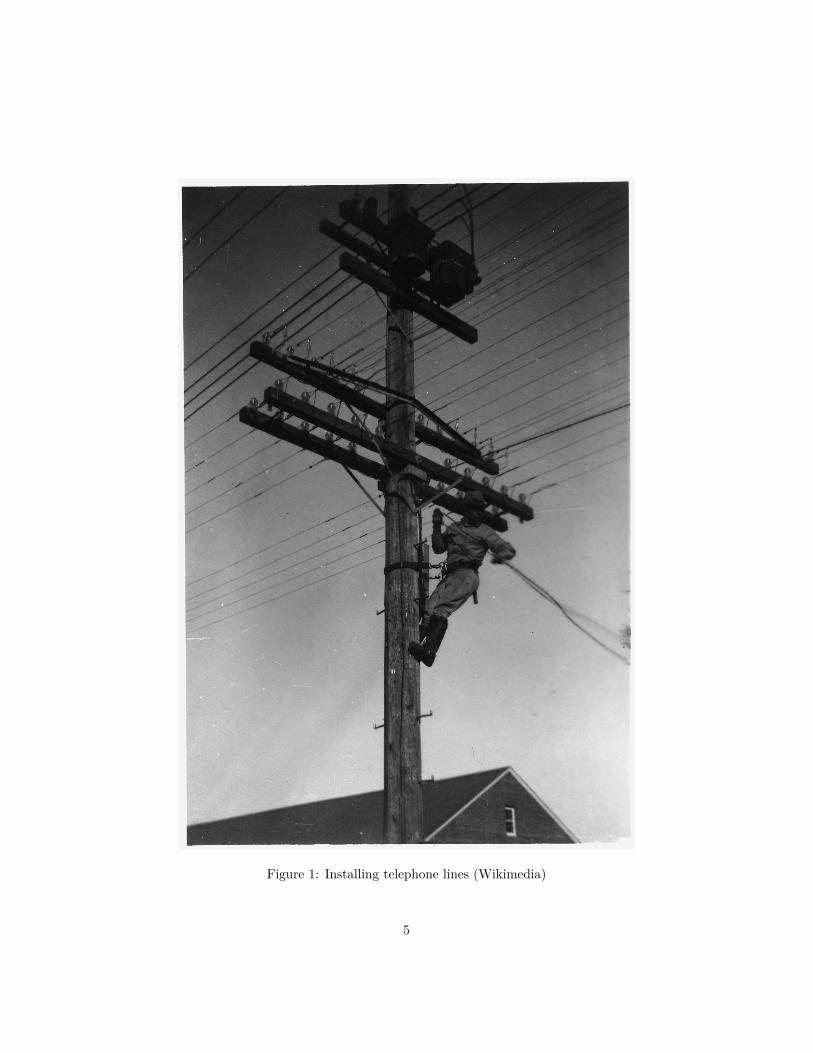
Figure 1: Installing telephone lines (Wikimedia)
5
1.2.1 How fast web sites load?
!: Google Chrome supports also emulation of different (mo-bile) networking technologies. Try a set of sites using differentparameters.
1.3 Why user should care for measurementsNetwork user is mostly interested to know if she is receiving what she hadpaid for. It is common that network operators provide different speeds towardscustomer with different monthly rates. Most users want to know if they arereceiving the speed they have paid for.
One way to check capacity is to use some services to test network speed likehttps://speedtest.net. When run one-off, these provide only snapshot of networkperformance. It is also possible that capacity towards test server is good but stillsome service user is interested about is having performance issues. The internetis a network of multiple networks. This means a single end-to-end connectiontravels over multiple ISP networks and because of peering issues between ISPsa site may have bad response performance from one network and good responsefrom another.
?: Have you used any network speed test to resolve or to identifynetwork problems?
While consumers may become irritated about their network being too slow orunavailable, they may have some protection from local consumer protection lawsor class-action. Again, it may be complicated to prove that perceived quality ofservice has not been the one advertised. That is even more relevant with mobilenetwork were location and time have more effect on available speed.
?: A key question is how much capacity one needs in real. Whatis the benefit of having 100 Mbit/s compared to 20 Mbit/s con-nection if one mostly watches for streaming video from Youtubeor Netflix?
With increase of remote work, videoconferencing, and user-generated videocontent the need for higher upload speeds has been increased the need for fasterupload speeds compared for consumption-only usage.
?: What kind of network speeds are needed in case a family offour does remote work and remote schools each having videosessions open?
6

1.4 Corporate subscriber needs for the measurementsCorporate subscribers, however, do not enjoy similar protection as business-to-business relations are based on contracts. Corporate users also have typicallylarger incentive for establishing they receive capacity they have paid for. Under-performing network may result loss of productivity, loss of sales or even directexpenses.
The corporate subscribers have thus an incentive to monitor their networks andservices. In addition to check if network performance matches the agreement,it is also important to understand how network is being used. Network trafficmonitoring can be divided into following topics:
1. What is current traffic demand? Is traffic increasing or decreasing? Istraffic matrix changing?
2. Is there traffic that is prohibited by policy, malicious or otherwise un-wanted?
3. Are our customers served with good performance?
Having capacity to match for traffic demand is important as it causes directcosts to a company. It is also important to identify trends in communication astypically traffic demand increases over time. If new capacity is acquired onlywhen shortage is already impacting operations, it is too late. Installing newcapacity may not happen overnight or even in month while the demand increasemay result from a single software upgrade.
In agreements between corporations there are service level agreements (SLA)where some key performance indicators (KPI) are defined. These include valuessuch as available throughput, packet loss, downtime and time to repair.
?: Identify what kind of measurement needs there would befor different kind of companies: game server operator, web re-tail store, video streaming service, call centre, architect studio,hospital, . . .
1.5 Network provider business is built on the measure-ments
A larger provider network is a significant investment. For a mixed mobile andfixed line operator the investments are tens of euros per year per consumersubscriber especially when technology change is underway. These are capitalexpenditures (CAPEX). Annual investments can be larger than monthly averagerevenue per user (ARPU). The resources must be used in efficient way.
In addition to CAPEX, companies need to focus also on operating expenses(OPEX). Operators that have significant consumer subscriber base need to carefulto avoid operations that may result large number of customer interactions. Quite
7

often, investments may result lower operational costs. Investments that focus oncapacity increases should be based on a forecast backed by measurements.
?: What expenses are part of CAPEX and what OPEX? Howcan provided move weight into another class?
As networks are more critical for their users and society, reactive problemfixing based on trouble tickets submitted by users is not sufficient. Usingmeasurements and diagnostics from the network it may be possible to identifyproblems developing before they impact users. It is more economical to takecorrective actions in course of normal operation than as emergency repair.
It is not only upgrades to network that put a demand on measurements; ac-counting is one of those. Telephone calls have been charged from early on byduration. On manual exchanges the operator marked calls in book and laterin automated exchanges a pulse was generated with fixed intervals. Subscriberwas charged by number of pulses. On computerized exchanges call lengths arerecorded in seconds and charging can be done exactly if wanted. Some providerscharge minimum call length, like one minute.
?: How is different if pulse is generated evenly from start of callor at random time points
Internet traffic can also be charged by volume or then there may be a monthlyquota. This is common in mobile networks but also many fixed networks includelimits. If quota is exceeded then there are three options:
1. Additional extra traffic charge applies. This may become expensive toa customer and result bad experience. There may be user confirmationneeded for additional “data package”.
2. Service is cut until next period starts.3. Service is rate-limited and/or is put to lower priority compared other
traffic.
In any case, if there are financial implications from measurements, the measure-ment system must be well designed and well tested. If there is disparity of trafficmeasured by operator and traffic measured by customer, it may have significantimplications.
The author has first-hand experience about that: one serverhosting provider had on layer 2 issue in their network. As aresult, the server was accounted nearly thousand time traffic itreally communicated. Without my own monitoring I could havenot convinced hosting provider that volume was in error.
8
In addition to customers, also regulatory authorities may have something to sayabout network performance. It may be, for example that there is mandatedminimum capacity that must be available for every customer. In Finland everypermanent residence must be able to get minimum 1 Mbit/s broadband. Ornetwork disruptions may not exceed certain percentage of time.
As in [Corporate subscribers] was discussed, service level agreements and othercontracts with corporate customers may require provider to measure its network.A monthly report may be required for performance.
Competition is also one motivation for measurements. It is not uncommon thatproviders hire independent companies to conduct measurements and comparequality provided by provider and its competitors. If results are good for theprovider, results can be used in marketing. It is important to remember, byselecting criteria and cherry-picking results the same data can show any provideras “the best”. Of course, also provider can do comparative analysis on othernetworks also by its own – these results are not usable in marketing as one madeby independent company, however.
?: What kind of cherry-picking you have seen network providersto use.
A nice example how to select data points to support wanted conclusions can befound from tamino.wordpress.com.
1.6 Goverment must know what happens in the networksTo govern, one must have sufficient knowledge on economical and societialinfomation. For example, censuses were carried in Egypt around 2000 BC andthe name itself origates from Latin censere (to estimate) that was needed inRome to know how many arms-bearing citizens there was. All kind of data iscollected and utilized by goverments and Internet is not exception on this.
Many goverments have defined for example that everyone should have access tohigh-speed broadband – 1, 10, or 100 Mbit/s typically. But does this actuallyhappen, especially if the last mile is provided by shared wireless technology. Oneneeds measurements to verify. And if some subsidises are given to build thatcapacity, there may be a fraud if promised bandwidths are not reached.
Mobile network providers coverage maps are based on radio propagation modelsthat take account terrain and building with some level of accuracy. But canone reach reasonable broadband speeds with real handsets? In case of naturaldisaster, mobile network providers usually can give number of out-of-servicebasestations. It is harder to say how many subscribers were affected withoutmeasurements.
Goverments do have interest on measurements from broadband policy develop-ment, consumer protection, and infrastructure resliency perspective.
9

1.7 Types of measurementsWhile network users can in most cases handle provider network only as a blackbox, a provider or company running its own network can have more insight onnetwork components.
The first and most basic metric is measuring network performance. It isimportant to monitor any errors or anomalies because these can be a sign ofsoon failing equipment. Network performance can be analysed by sending testtraffic and measuring packet delay and loss among other for that traffic.
A part of network performance is of course individual network devices andend systems. When deploying new hardware, it is very important to verifythey match performance in intended configuration and usage scenario. It isnot uncommon that by enabling both feature A and B would drop throughputsignificantly compared to the case where only one of them is active. If servicesare provided, these must also provide performance required.
Utilisation indicates if there is a need for upgrades or other changes if somelink is too congested. A related metric is traffic demand. If the network isnot able to carry all traffic, the demand can be larger than capacity. Also, ifnetwork quality is bad, users may not be able to utilise it as much as they want.
It is not use to have network that provides high throughput but is unavailablelong periods of time. Availability indicates which part a network is usable forthe user for indented purpose. Typically it is indicated as percent like 99.8% –the network is unavailable nearly 18 hours a year. A related property is stabilitythat can tell if for example delay or throughput varies over time.
?: How long unavailability is allowed if service promise is fivenines (99.999 %)?
Last, but not least is the need to understand user behavior. What is moreimportant is to understand what kind it will be in the future. Like recentincrease in mobile video usage: both creating video and consuming it, has greatlyincreased traffic. Traditionally networks have been planned similarly to broadcastmedia: user is a sink of information receiving lot and sending little. Now usersare creating high-definition video content and uploading should not take toolong time. Or even one should be able to stream video real-time.
Same type of measurements can apply also for corporate networks.
?: What are minimum performance characters you would wantto have your home network? Are they different compared whenyou are at university, café, at cottage, or travelling in train orplain?
10

1.8 Network provider requirements for measurementsAs stated earlier, a network is a long-time investment and operations must havecontinuity. There is a need to have common standards to collect measurementdata. For example, it is not sufficient just to have common protocol to transfermeasurements but also data collection must be uniform: any inconsistencies instatistical definitions, protocol levels, or in data collection should be avoided.For example, are layer 2 headers and framing included in byte counts or just IPpacket content?
Measurement system must scale as network grows and transmission rates in-creases. Data must be aggregated as much as possible to have measurement dataincrease be slower than user traffic increase. If test traffic is sent to network,it should not interfere with user data transmission. This may be a challenge ifthere are very strict requirements for verification or on low-bandwidth links.
?: It is estimated that IoT and digitalisation may increase numberof end hosts 1000-fold. 5G networks will have many more basestations compared to currently in 4G. Some data processing mayhappen on network edge (MEC). What impact this will have onmeasurement architecture?
Traffic engineering (TE) are ways that make possible to optimize networkperformance. These are based on traffic measurements. One important toolis traffic matrix. Traffic matrix tells where traffic originates and where it isdestined. Using traffic engineering it is possible to improve network utilizationby distributing traffic on alternative links.
Mobile Edge Computing (MEC) and similar distributed data processing tech-nologies can also be used optimise traffic flow in the networks and this must bealso be accounted for in making measurements.
Many of criteria above also apply for corporate networks.
1.8.1 Network provider time scales
Network provider can utilize measurements in different timescales.
1. Network planning and extension takes months or years to meet futureneeds for capacity and reliability. Introducing new technologies takes alsolong times depending if they are compatible to already installed base ornot.
2. In hours or days it is possible to reconfigure network to optimize utiliza-tion and performance. For example changing routing to balance traffic isone possibility.
3. In case of failure or traffic surge actions can be taken in near real-timein sub-second scales automatically. Human operation is slower, but expert
11

insight may improve situation compared to pre-planned automation.
?: Think what kind of operations can be accomplished in varioustime scales.
Network utilisation is measured with SNMP data collected with one minuteintervals typically. This provides view to average network load. Howeverin datacenters, especially with distributed big data workloads, there existsmicrobursts i.e. periods of high load less than 200 µs. The time is less than RTTand as a result congestion control based on packet loss or marking (ECN) donot have effect. While switch buffers may be able to absorb these, care must betaken when designing applications and protocols. [1]
1.9 Vendor measurementsCompared to other players, networking hardware and software vendors haveslightly different needs for measurements. Time-frame is much longer, as it cantake years before a planned device is ready to ship to the customer. Softwaremodifications may happen faster. The vendor must be prepared if the realitydoes not match to the forecast.
First and foremost, the prospective buyer will check the raw figures. How manypackets or bytes per second the device is able to relay? How many ports itsupports? Does it support any traffic mix at line rate? If it is a security devicelike IDS1, can it provide protection in high loads too. To verify these, the devicemust be benchmarked.
To help with planning, the vendor needs up-to date information about networkload and traffic characteristics. If a wrong type of traffic is assumed, it may be apoor match for needs. An example is the increase of video uploads: the networkmust support more balanced traffic flows and not just one-way streaming.
It is not sufficient for device to just perform it primary task. It also needshelping functions such as diagnostics and measurement facilities. If device is notperforming as expected, there must be way to extract performance figures froma device. These include different interface counters, system internal indicatorssuch as CPU load and memory usage. The better an expert can have view oninternals of system the better she can pinpoint problems.
!: Resolving problems without sophisticated tools can be verytedious. The system may have option to enable debug log butthis may often result too much information so that the root causeof issue is hard to find.
1Intrusion detection system
12

Device testing can be implemented as black-box testing alone to find performancelimits but for a better understanding some methods from at least grey-box ifnot white-box approach give more fruitful information.
The device must also support measurement needs of the user. At least basictraffic statistics such as packet count and bit rate per interface are the minimum.Flow statistics and sampling packet information can be required by the user.
?: Have you performance-tested any network device? Did itaffect on acquisition of device?
2 IP networks and how to measure themInternet connects different networks together and allows communication even tothe space. While publicly visible Internet is huge, there are many other IP-basednetworks sharing the same technology.
One can measure on links, on network devices or on end systems. Here wepresent basic introduction how different components in the network affect ontraffic going through the network.
?: How one can know if performance problem is at end system,link, on router or on some other component in the network?
2.1 Measurement typesNetwork measurements can be made in two different ways: test traffic or synthetictraffic is used or existing traffic or user traffic is observed. These are knownas active measurements and passive measurements. These terms will be usedthroughout this course.
In active measurements test traffic is injected into network and it is observed.A typical test is to send a packet like ICMP Echo Request to a destinationand wait for a response. If response arrives, one can measure round-trip delay.If no response is received then one of packets was lost in the network or thedestination host is not connected to the network. By sending multiple packets,distribution of delays and proportion of lost packets can be calculated.
As the name indicates, in passive measurements no packets are sent. Existingtraffic is observed. This can be done by capturing packets, monitoring interfacecounters or other ways collecting information. The key benefit is not to addadditional load into network. On the other hand, if there is no traffic towardsdestination nothing can be observed.
13
2.2 Packets in IP NetworksIn the packet networks, like in the Internet, the smallest interesting unit is apacket. The packet arrives to its intended destination or not in which case it isdeclared as lost. It takes some time before packet will arrive to its destinationand this is called as delay. It is also possible that it is delayed more thanexpected and its usefulness is lower or even negative compared if it arrived intime.
Each packet consumes some part of network capacity. While bit-level eventsare not in the interest of this course, they may result in corrupting the packet ifsome bits get inverted, for example. In most cases link-level error detection willdiscard these packets before they are forwarded.
?: What are the most common contributing factors to delay orbit errors?
One transmission typically includes many packets. In ideal case, all packetsarrive destination, have identical, minimal delay and same order they were sent.However, this might not happen. A group of packets can be a flow.
2.3 Flows in IP NetworksWhile routers in network process individual packets, applications typically createflows. A flow is a series of packets travelling from one part of network toanother part of network (packet train). A flow can be either unidirectionalor bidirectional. In first case a packet going A→B is in different flow thanone A←B. Definition depends on both the type of analysis to be done and themeasurement point. It is not guaranteed that one can observe both directions atthe same link or device.
Internet routing is not usually symmetric: so called hot potato routing resultstypically asymmetric paths [2]. If a company has redundant routes to the Internet,response packets may enter via another gateway. For this reason, many analysesin Internet transit networks do assume unidirectional flows. Measurementson network edge or in access network close to the end devices can assumebidirectional flows.
The second property for a flow is its granularity: what criteria are used todetermine which packets belong into one flow and what into another. If a flow isconsidered mostly identical to a TCP connection, then IP source and destinationaddresses, IP protocol, TCP source and destination ports would form a selector.This is the most detailed criteria for a flow that is commonly used.
For example, if we would just try to define all traffic from one user to IMAP-emailserver to be part of a single flow, we would use following selection:
• source IP address defines user host
14
• destination IP address defines server• protocol would be TCP• destination TCP port defines application.
That would be for unidirectional flow. For return traffic, we just need to reverseany source to destination and vice versa. Other commonly used criteria are source-and destination IP addresses or source- and destination networks. One maybe interested traffic between two autonomous systems or domains. In principleanything that can be used packet-by-packet basis can be used, including linksand interfaces.
?: A web browser typically opens multiple TCP connectionseven to a single server. Part of a page may arrive from differentservers. How you would define flow here?
The third property is to define when a flow starts and when it ends. Wecan use protocol messages like with TCP observing SYN/FIN/RST flags. Unfor-tunately, not all protocols have similar and not all connections end gracefully.Also it may happen that one or both parties lose their network connectivity orreboot and so connection is not terminated properly. An universal method is touse timeouts. If there are no packets that are part of flow in 60 seconds2, forexample, we consider the flow to end. Flow timeout selection will have an effecton the size and number of flows, of course.
An alternative to the fixed timeout is to have a dynamic timeout. One initiallydefines maximum packet inter-arrival time to be N seconds and timeout M timesinter-arrival time. If packet inter-arrival time t is larger than N but less thanN×M seconds, inter-arrival time N is increased to value t. This will adapt ondifferent applications by identifying segments of flow.
2.4 Defining network propertiesWhen discussing, it is important that all agree on common terms. Because thisseldom happens universally, we define some terms used in this course.
• Throughput is the number of binary digits that a system accepts anddelivers per unit of time. Unit is bits per second or bytes per second.
• Delay is the time elapsing between the emission of the first bit of datablock by transmitting system and its reception by the receiving system.This is time, typically measured in milliseconds.
• Error rate is count of errors per transmitted data or per time unit.Expressed typically as ten’s negative exponent: 10-6 indicates that one outof million bits (or packet) has an error.
2Another popular time-out is 64 seconds, it makes easier to divide interarrival times intobins of 2Z seconds.
15

2.5 ThroughputThe throughput observed in some part of the network may be quite differentcompared the throughput an application observes. If network conditions are badit may result a large number of retransmissions. A link middle of network doesthen see quite high bit rate but application gets much lower rate. Throughput anapplication sees is sometimes referred as goodput i.e. amount of useful informationcompared to raw bit rate.
?: What properties of application or transmission protocols doaffect if throughput and goodput are near-identical.
Network links are typically key bottleneck in considering throughput. Whilefixed links in cables like electrical and optical links typically have constantcapacity, there can be lots of throughput variation on wireless where capacitymay depend on link length, the number of other users, weather conditions, andradio interference among other resons.
Many wide area networks can be considerd as overlay networks. Those aretypically virtual networks i.e. topology seen on IP level does not match for thephysical network. For example one IP-level link may actually be multiple layer2 links (MPLS, Ethernet VLAN, . . . ). Traffic that is competing from the samecapacity is not visible and available capacity may be much variable. Packets canbe lost on a link without any consideration to possible traffic priorities.
Routers handle packets in network: they receive packets and check where tosend packet next. Routers have internal architecture that may result bottlenecksdepending how traffic flows. A router may also be limited by packet rate: thistypically manifests itself if there are lots of small packets.
Of course, the end system may be ones limiting data throughput. There may beprocessing associated in either sending or receiving data. Or disk, some deviceinternal bus or the network interface card may be a bottleneck. Limits mayresult also from parameters and settings. For example, if TCP window size is 16kilobytes, one cannot expect high throughput.
Many applications do not just open connection, send with maximum throughputand close connection. They may throttle transmission or pause temporarily.For example a web page maybe not load completly at once but is updated andcomponents loaded while user scrolls further.
Traditionally throughput at network level is expressed as bits persecond and “kilo” equals 1,000. At application level also bytesor octets per second is used and “kilo” equals usually 1024. Toavoid vagueness, one should use binary SI prefixes of kibi (Ki),mebi (Mi) and gibi (Gi) when multiplicative prefixes of 210×N
16
are used.
2.6 DelayThere are two main sources of delay: distance and processing.
On network links the delay results from distance and signal propagation speed.While radio waves travel at speed of light, speed in optical cables is “just” 200,000km/s - 5 ms per 1,000 km or 1 ns per 20 cm.3 Another delay component istransmission delay: how long it takes to send full packet on the link. This isderived from bit rate of the link. If the link is shared or slotted like many radionetworks, there is an access delay while system is waiting its turn to send thepacket.
?: How delays compares using geostationary satellites, low-earthorbit satellites, drone planes, or aerostats to provide networkcoverage to rural areas?
Processing delay typically happens in routers. Packet forwarding lookup mayresult (variable) delay. The main source of delay in routers is queuing delay:when there is more traffic offered to a link than it can deliver, a queue will fill.There are different queue management methods to control queue not to becometoo full. While packet is delivered to a link, it is subject to delays on link.
Most network devices receive first whole packet before starting to process it:store-and-forward. This adds delay that depends on line rate. For manypurposes, including checking error correction, whole packet is needed anyway.Some network devices, mainly Ethernet switches for data-center use implementalso so called cut-through forwarding. Here frame forwarding starts once itsdestination address is determined. This reduces latency and is used e.g. instorage networks in data centers where even small latency impacts performance.
?: How much shorter the forwarding delay is for 1500 byteEthernet frame at 10 Gbit/s with cut-through forwarding? Howif jumbo frames with 8 KiB IP payload are used?
Average delay inside router depends on traffic load. As memory prices havebecome lower, adding more buffer memory to routers is not a financial limitation.If packet loss is a problem, by adding more buffers this can fixed for sure.However, large buffers create bufferbloat that only increases delays and in manycases causes unnecessary packet retransmissions.
3A simple rule of thumb: in 1 nanosecond signal travels length of longer side of A4 sheet inair and the shorther one in fibre.
17
On application viewpoint, data may be delayed because of missing TCP segment,for example. Operating system is not able hand already received data toapplication if it has requested continuous stream of bytes but there is a hole insequence. For applications that can allow some data discarded in exchange oftimely delivery, datagram-based protocols (UDP, DCCP) are more suitable.
?: How common network programming API (sockets) works if afragment of data is missing.
2.7 Delay variationIn some cases the impact of the delay variation is more significant than absolutedelay. Even so, the delay of subsequent packets compared to the first packet(s)affects on user experience.
?: What happens in VoIP call if the first packets have lowerdelay than subsequent packets?
Another term for delay variation is jitter. While it is used as synonym, mostoften it is used for bit or sample level delay variation and not on packet levelvariation.
2.8 Error rateIn packet networks, most errors manifest itself as packet loss4. Other types oferrors such as bit errors5 result usually packet to be discarded on next routerincoming interface when link-level error checking code such as CRC fails. It isalso possible packet to be delivered for a wrong end device.
?: IPv6 header does not have a checksum field while IPv4 hasone. What may be the reason not to include checksum to newversion?
Bit errors or data alteration often happen on network links. Optical links arenot affected electromagnetic noise along cable and thus have very low bit errorrate, typically from 10-9 to 10-12 or better. Electrical links like Ethernet ontwisted pair can suffer electromagnetic noise like ones resulting from switchingpower on and off nearby. Radio links have much higher error rates. On fixedradio links the error rate can be quite good like 10-8 but on mobile networkswith poor coverage it can be 10-4 or worse.
4Packet Loss Rate / Ratio (PLR); Packet Error Rate (BER)5Bit Error Rate (BER)
18
If bit error happens and there is no error-correcting code that can fix it, thepacket is most likely discarded by receiving device. However, bit errors canhappen inside devices too. There may be some internal bus operating badly orthen data corruption happens in memory. In these cases error is not detectedwhile in transit so responsibility lies on end systems to check integrity of data.
The most reason for packet loss caused by routers and end devices is queueoverflow. There may just queue becoming full or then there is an active queuemanagement taking place. Also in high-load situations packets may be lostbecause the receiving system is not able process those in time.
Yet another type of error is data duplication. One or more identical copies ofa packet exist in network at same time or within short period of time. There aremultiple possible causes, including equipment malfunctioning, but one commonplace is a wireless network. Because not all devices in wireless network hear everyother device all the time, it may happen that terminal thinks its transmissionhas failed because of collision and re-transmits packet. The receiver, however,receives both successfully. As Ethernet and IP packets do not include uniqueframe identifiers, both are forwarded.
?: IPv4 header has Identification field. Why this cannot be usedto identify duplicated packets?
End systems are prone for many same errors as routers. They may not be able toprocess that many packets per second, for example. Losing packets may happeneven if operating system has received it successfully: an application is not ableto process incoming data fast enough. Data may be corrupted while it is storedinto memory or while it is being transferred to network card or to disk.
?: Have you witnessed data corruption while it has been trans-ferred over network or copied to portable media?
In addition to routers, packets can be handled by some middle boxes like firewalls.These are mostly like routers, but quite often do processing on CPU: this mayresult packet rate limitations and more variable delay. A firewall may recordstate information for each flow. To save memory, old flow information is purgedfrom records every now and then. If a connection has been idle for a while, apacket may be unknown to the firewall and gets rejected.
Also switches handle packets on link layer and may result packet loss in case ofcongestion.
?: Have you identified cases of bit errors either on network orinside end systems?
19

3 Active measurementsIn active measurements test traffic is injected into network and it is observed.Active measurements measure treatment traffic receives when it travels from onepart of network to another. Measurement point is typically in an end system orat some demarcation point, like at the router between customer and networkprovider.
Measurements can be taken one-off in case of resolving an issue or then repeatedfor continuous quality and performance monitoring. Continuous measurementsmay identify problems before they impact on the users.
3.1 Co-operation in measurementsTypically network measurements are performed over long distances requiringto use devices in different locations. We can identify three different classes ofmeasurements:
• SO: Sender Only measurements assume only standard assumed functional-ity from the other end. Every IP device should respond for ICMP EchoRequests, for example. Or a web server would return requested document.
In these measurements it must be assumed that the end system functionsaccording to the standard. This may not be always an case and dependingon measurements, it may not be possible to identify an erroneous behaviour.This is typical case of measurements of services run by other entities.
• SRP: Sender and Receiver Paired measurements. In this case we havecontrol of both ends or the functionality of remote end is well defined.There are properties that allow more accurate measurements by usingsoftware and messages tailored for the measurement in hand.
Typical improvements over standard application protocols include usingof accurate time stamps for both receiving, processing, and sending. Alsoadditional information including likes the CPU load of end systems couldbe included into reports to identify if the challenge is at the end system.
• RO: Recipient Only measurements provide most limited functionality.These provide most limited functionality as the one who measures has nocontrol on sending messages and is even more dependent on the other partyto perform according to specification. Many measurements here relate forPassive measurements.
?: Consider what kind of custom software or hardware deploy-ment needs there are in each class? What is the scale of deploy-ment?
20
3.2 Application measurementsApplication performance is the key aspect that matter to the network user. Whileit at first sight looks easy to measure, it is not always clear how measurementshould be conducted. An application may have very complex interaction withnetwork, uses multiple protocols and accesses different servers. In most cases forexample DNS is used. At worst case some of critical steps are not measured atall.
An obvious way is to record a user performing tasks with application andthen have software to emulate user actions repeatedly around the clock. If anapplication is using a proprietary protocol this may be the only way to estimateit. If task to be tested includes for example entering records to a database, theremay become a problem with data integrity and separating test records from realone. If tests are directed to test data database, then the production databaseperformance is not evaluated. User authentication and authorisation, transactionaudits and similar also be a bottleneck that is different in test environment andproduction environment.
If application uses standard protocols, then it may be easier to enumerate networkoperations the application makes and have these separately tested by usingdifferent software step by step. However, modern single-page web applicationsare more complex to benchmark compared to traditional HTML+images pages.For example, many use websockets to communicate between the server and theclient. Replicating this with traditional HTTP tools is difficult if not impossible.
!: Google Chrome browser has headless mode that allows pro-grammatic browser operation. There are also other programslike cutycapt that interpret CSS ja javascript. The result imagecan be saved as in PDF, JPEG, or PNG format.
3.3 Application protocol measurementsInstead of testing full application, in many cases it is sufficient to test indi-vidual application protocol entities. For example, a simple HTTP query tohttp://example.com/page.html includes following operations simplified:
1. Resolve example.com host name to IP address. This may include manyDNS servers and multiple requests. Let’s assume answer is 192.0.2.3.
2. Open TCP connection to 192.0.2.3 to port 80.3. Issue HTTP request for /page.html that server interprets and retrieves
content from storage like hard drive.4. Response is transferred over TCP connection.5. Connection is closed.
21

The list above is incomplete even in wired Ethernet. If you areconnected via WLAN, what additional steps may take place?
From above, we can identify several phases that contribute overall performanceand can be individually recorded.
1. DNS query time. Because of caching, this can be very variable over time.2. Time to establish TCP connection with 3-way handshake. This depends
on network delay and server load.3. HTTP request processing time including possible look-ups and database
access both in client and server.4. Actual data transfer over network i.e. throughput.
If that would be a real web page, one must retrieve all page components likeimages, style sheets and scripts too. To be able to identify all components, forexample possible JavaScript must be evaluated emulating real browser all displayproperties and such.
Present-day web pages can be very complex to evaluate - part of page may becached in browser cache and not requested with every page load. Also muchof page content can arrive from a content distribution network (CDN) that hasservers closer to the users than the origin server. A part of page content maybe loaded only based on user actions, like howering mouse over elements or byscrolling page further down.
An application may have also multiple different protocols associated with it. AVoIP call, for example, gets started with SIP signaling, media is transportedover RTP and call is again ended with SIP. A measurement would include bothSIP and RTP analysis.
In any case, it is important to include all components of real transaction and beable to identify the problems. It is not worthwhile to try to optimise web serverresponse times if there are problems in WLAN authentication, ARP resolvingor local DNS server.
For practical testing, it may be worthwhile to divide application into componentsand test them separately: tests for DNS requests and set of HTTP tests forvarious page components; maybe just using sample of requests for each server.
?: Visit few different types of web sites. Use developer tools inbrowser to identify
1. how many requests are performed,2. how many servers those are distributed over,3. how many domains those servers are distributed over?
22
3.4 Transmission protocol measurementsOn application measurements the end system and server software plays very sig-nificant role. If one wants to know how the network affects on data transmission,then tests can be done without any application dependent processing.
A simple way to benchmark a network is to just open a TCP connection and thenother end sends dummy test data as fast as possible and other receives as fastas possible. Typically, either fixed amount of data is transferred or transmissionruns fixed time. Average bit rate is simply number of bits transmitted dividedby time.
!: Run an iperf test to iperf.funet.fi.
This removes any server software or subsystem bottlenecks from affecting mea-surements. It does, however, depend on TCP version and parameters used inaddition to hardware.
For example, Linux kernel supports multiple TCP congestion controlmechanisms. By default the kernel in e.g. Ubuntu 16.04 allows cu-bic and reno for normal users. One can check allowed ones from/proc/sys/net/ipv4/tcp_allowed_congestion_control
Linux source code includes more information about each in comments at startof each tcp_*.c file.6 There you can find bibliography or a link describing thatcongestion control.
All modules that are compiled with kernel can be found from /lib/modules/kernelversion/kernel/net/ipv4/tcp_*.Admin user can take them into use by loading the module. To al-low any user to select mechanism, allowed names should be writtentcp_allowed_congestion_control file above.
?: Check what TCP congestion control mechanisms are sup-ported by current operating system version. If you have adminrights, activate few and compare e.g. iperf results.
3.5 Packet level measurementsIn pure Internet, the network only inspects one packet at time and has no memoryof any earlier packets. While this is not always a case – like with traffic inspectingfirewalls or address translation devices – it is still a good approximation.
!: IP networks provide no guarantees that subsequent packetsbetween two hosts travel over same path.
6Note that some tcp_*.c files are not congestion control but some other supporting files.
23

Each and every IP device must be able to process and respond for ICMP messages[3]. Among various error reporting functions, there is a way to ask another hostto send response packet: ICMP Echo Request. On receiving this packet, the hostwill respond with ICMP Echo Response packet destined to sender of the request.
Each ICMP request includes both identifier and sequence number that allowsrequest sender on receiving response to know for which packets it received aresponse for. By sending multiple packets, it is possible to learn few propertiesfrom the network:
• How many packets we received response for?• Round-trip delay for each packet and subsequently we are able to calculate
statistical values like mean and variance out of those.
If response was not received, there are three options we cannot separate fromeach other:
1. Request packet was lost in transit to destination.2. Other system failed to respond. Reasons include overload, policy, rate
limit, and host being down.3. Response packet was lost.
Similarly we cannot know how long the request packet was delayed in networks,how long it took remote system to respond and how long response packet wasdelayed. We just know time it took from sending the packet on receiving to thelast packet. While information is lacking, this is sufficient for most purposes toknow about network conditions. Most protocols do have some kind of request-response structure and total round-trip time is what matters.
?: Have a look on few different protocols like DNS, TCP, RTP,FTP, NFS. Do they have some fields that may allow mappingrequest-response packet pairs?
If we want to improve our measurements, however, there are some simple stepsto implement. At first, remote end keeps track of sequence number of receivedpackets and reports these back to the sender. For example, we could add sequencenumbers or bit mask7 of recently received packets. Now if one reply packet getslost, the sender will still learn fate of packets if it receives some of the responses.
The second improvement is recording time stamp when a packet was receivedand reply was sent. For high accuracy, these are separate time values but for asimple case both can be same. If we assume accurate clocks, one can calculate
7Bit mask is a compact way to represent information. Each byte contains 8 bits so with 4bytes on can report statuses (received/not received) of pktn-1 to pktn-33, for example.
24
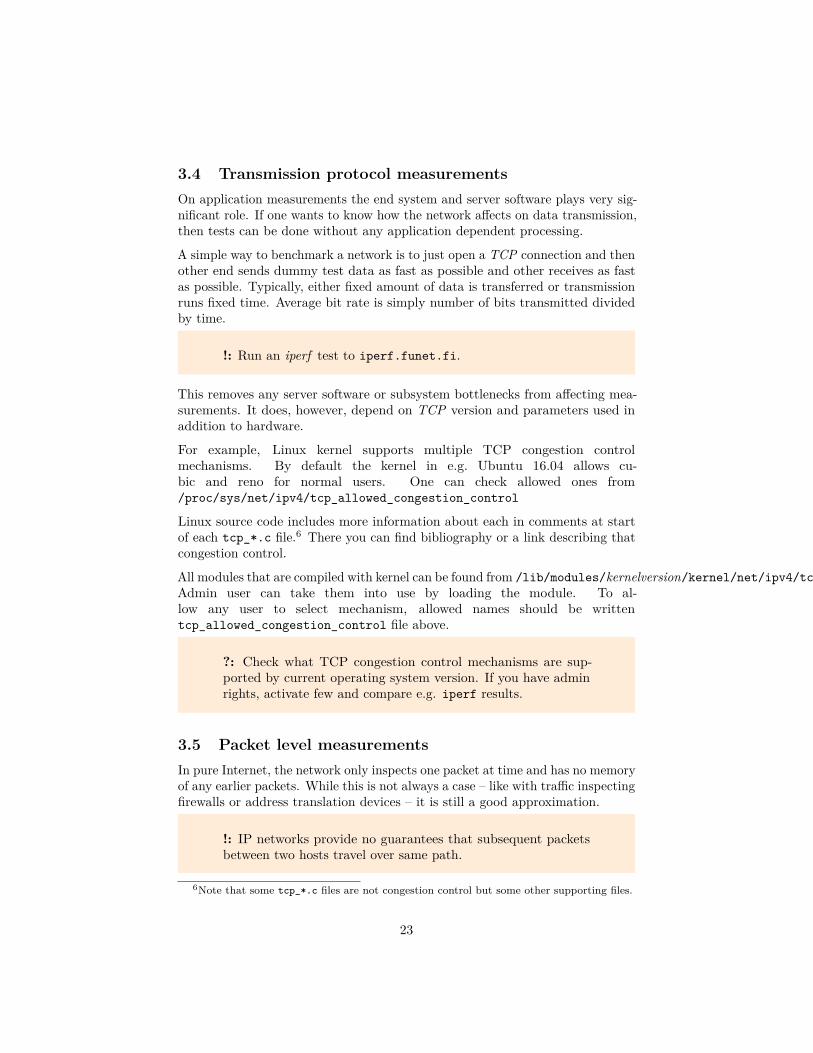
A B
application writes to network
OS, hardware processing at A
network delay to B
processing time at B
network delay to A
processing at A
Figure 2: Delays in RTT mesurement
delays in both directions separately. However, providing accurate time is nottrivial, as we study later in Time synchronisation chapter.
For example IETF OWAMP [4] and TWAMP [5] protocols implement thesefeatures. Application protocols such as RTP include control fields that canprovide diagnostic tools for applications.
?: Look up ICMP, RTP, OWAMP, and TWAMP packet descrip-tions. What kind of measurements latter two allow that ICMPor RTP do not?
3.6 Uniform criteria for performanceDetermining the packet in the network sounds quite simple. One just sends abunch of packets and observers how many replies one gets back. Someone elsecan make the same measurement at the same time on the same network, but getquite different results.
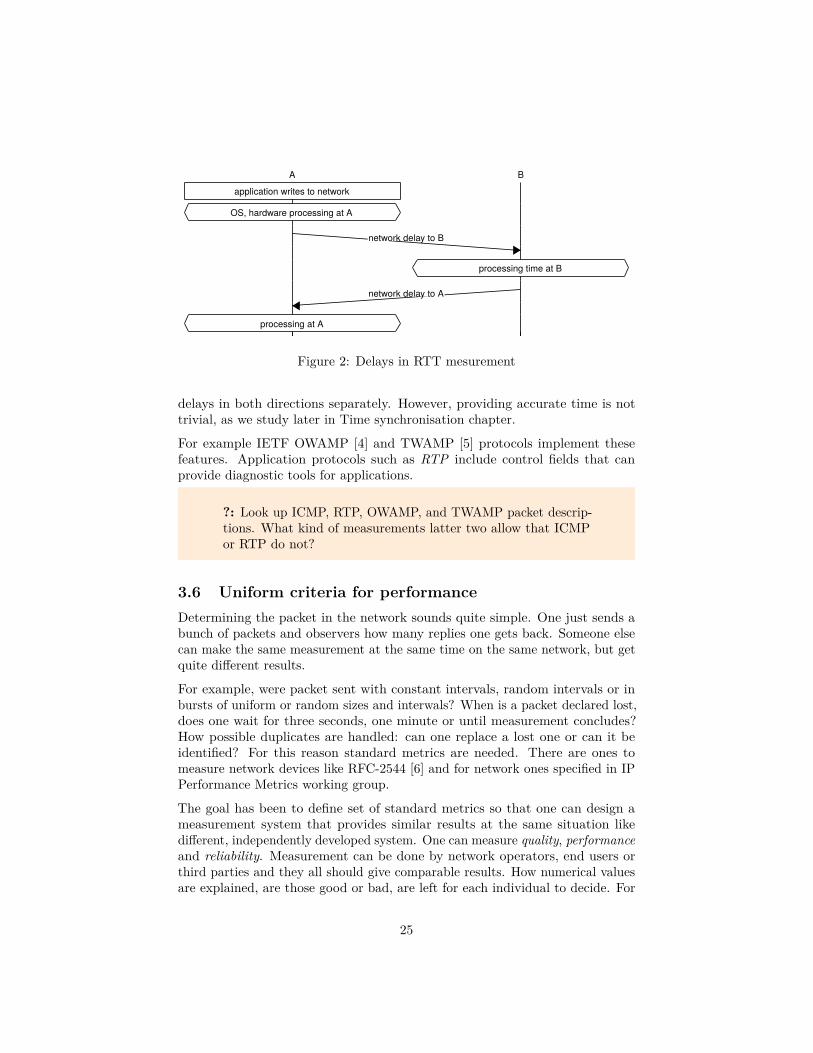
For example, were packet sent with constant intervals, random intervals or inbursts of uniform or random sizes and interwals? When is a packet declared lost,does one wait for three seconds, one minute or until measurement concludes?How possible duplicates are handled: can one replace a lost one or can it beidentified? For this reason standard metrics are needed. There are ones tomeasure network devices like RFC-2544 [6] and for network ones specified in IPPerformance Metrics working group.
The goal has been to define set of standard metrics so that one can design ameasurement system that provides similar results at the same situation likedifferent, independently developed system. One can measure quality, performanceand reliability. Measurement can be done by network operators, end users orthird parties and they all should give comparable results. How numerical valuesare explained, are those good or bad, are left for each individual to decide. For
25
wait IAT time
send a packet
wait random time
send a packet
wait IBT time
N packets sent?
send a packet
wait random time
burst end?
send a packet
Figure 3: Some packet send processes
instance, 0.1 % packet loss is a dreadful value in datacenter storage network butvery tolerable for a mobile network in wilderness.
?: Can you identify applications that are sensitive for one metricbut not as demanding for the other?
Metrics defined in IPPM include connectivity [7], delay and loss for one-way [8],[9] and round-trip [10], delay variation [11], loss patterns [12], packet reordering[13] or duplication [14], bulk transport capacity [15], [16], and link bandwidthcapacity [17]
3.7 Network throughput measurementsConsidering network and its throughput, two properties are most interesting. Thefirst is the maximum throughput i.e. bottleneck capacity. If there is no othertraffic in the network, this is the throughput a connection would archive overcurrent path. The second is available capacity that is often more interestingfrom the user perspective. It is important to understand that current traffic +available capacity does not equal bottleneck capacity.
?: Why current traffic + available capacity 6= bottleneck capacity?
One possible way to identify bottleneck capacity is to send test traffic in manyinstances over period of time. With some probability, the bottleneck link has lowutilization at some point of time and also other links do not limit throughput.The measurement with highest throughput would be the bottleneck throughput.
This approach has its limitations, however. It may require many measurementsto hit “empty” network. Furthermore, it does not identify on which link thatbottleneck is. An alternative is to use packet pairs.
26
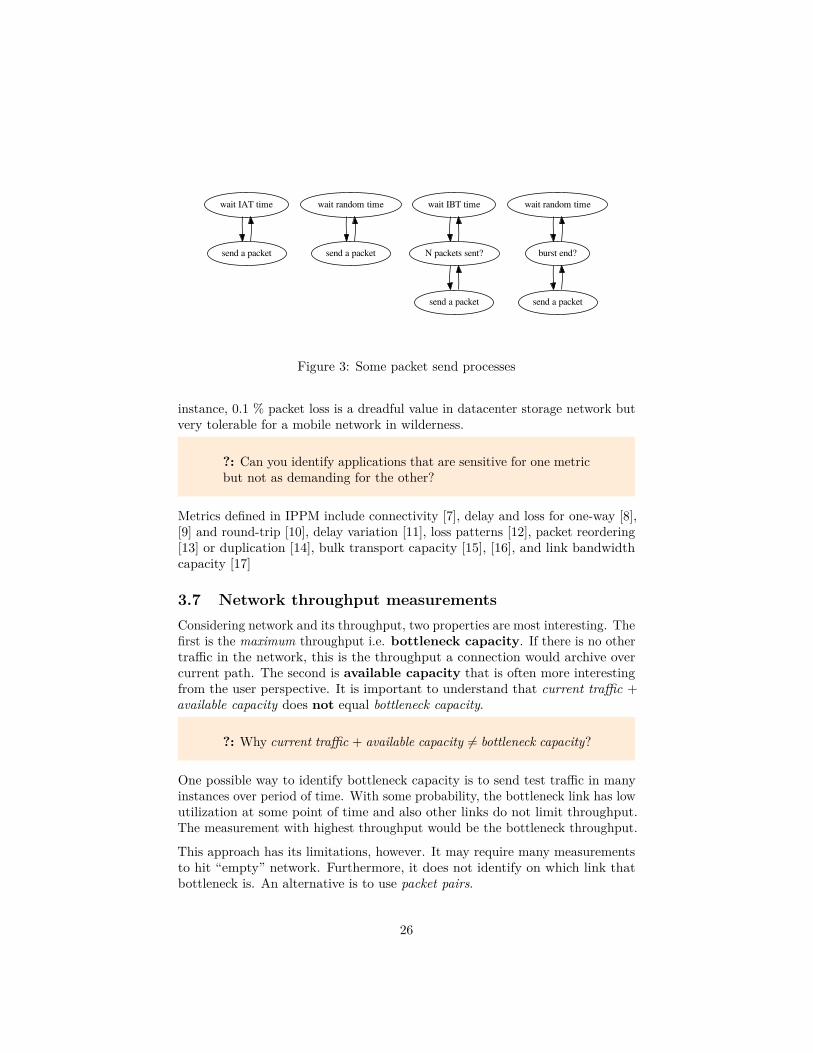
Pr
ArAs
Pb
ReceiverSender
Ab
Figure 4: Self clock in packet networks
If two packets are sent back-to-back as fast as possible the second packet isdelayed by time that is dependent on link speed and packet size. If we assumethe first link is a 1 Gbit/s link, a 1500-byte packet is delayed by 12 µs.8 If thesame packet travels later over link that has bit rate of 10 Mbit/s, the secondpacket is delayed by 1.2 milliseconds. If all other links are have higher bit rateand there is no other traffic, the packets maintain their time separation whenthey arrive to destination.
The destination host then replies to these packets with smaller packets. Again,if there is not much additional traffic, these packets have maintained theirseparation when they arrive to original sender. By measuring the time difference,the bottleneck speed can be identified. [18]
The result still does not tell us which link was the bottleneck. One can identify thebottleneck by sending packets with different time-to-live (TTL) values similarlyto traceroute. Each router in path then replies to packets by its turn and eachlink with its capacity can be identified.
!: Test a network with pchar or bing. Compare results withiperf.
While single pair of packets could give mostly correct results, in practise manymore packet pairs or packet trains are needed to have any confidence on results.[20] Most methods assume traditional fixed line network that has no variabledelay sources other than queuing. These methods work quite badly when theseexpectations are not met like in mobile broadband networks.
3.8 Network delay measurementsDelay measurements are quite easy if one is interested about round-trip time.One sends a packet and waits for the response. A response may be a singlepacket like in ICMP Echo or more complex like TCP 3-way handshake. Both canbe used as a way to estimate for RTT. One needs to take possible end system
810-9 seconds (1 nanosecond) per bit, 8 × 1,500 = 12,000 bits.
27
delays into account. A TCP server, for example may perform some lookups tofind out if it wants to allow us to connect to.
Absolute one-way delays are more difficult to measure. Accurate time synchro-nization is not a trivial task. Typically for example few milliseconds accuracycan be reached with NTP (Network Time Protocol). Short-time changes can bemonitored with better accuracy but also there one must be prepared for a clockskew.
As with any test traffic, a possible traffic classification must be taken into account.The test traffic may receive better or worse treatment compared for normaltraffic. Radio technologies such as UMTS have different channels with differentcharacteristics. Random access channel (RACH) is used if there are only fewpackets to be sent. If mobile staion sends many packets, it may be allocated andedicated channel (DCH). A packet expires lower delay when sent over DCH andthe delay is dependent on packet interval and threshold of RACH-DCH switch.[22]
Network delay measurements are the workhorse of network monitoring. Withfrequent delay measurements, one will learn:
1. Connectivity problems.2. Packet loss.3. Delay variation.4. Network overload situations.
?: What additional value does one receive from measuring direc-tions separately compared to just recording two-way roundtripmessage delays and loss?
3.9 When to measureA straight forward method for measurements is measure continuously or witheven intervals throughout the day. For example, we can monitor delay bysending one packet each second. This is easy to implement and we get 86,400measurement results each day. For each sent packet, the packet is lost or wehave a round-trip-time recorded.
Listing all measurements is a bit too much, so we like to have just one figure toreport. Taking mean value is simple and we only take account any packets thatarrive within 2 seconds. Otherwise we report them as lost.
Our daily average would be then 75 milliseconds that is a reasonable value foran international VoIP traffic. However, we receive complaints about bad qualityrelated for increase of delay at day time. When data is looked more in detail,it is found that during day time (9-15) the mean value is 200 ms that is not agood value for VoIP. Mean value outside of that time is only 33 ms.
28

It is quite clear that monitoring performance of empty network has very a littlevalue - other than checking the network is working. The values derived frommeasurements must be weighted by its impact on users.
?: Consider you are responsible for providing network qualitymeasurement results for a company with 10 sites. You need toprovide for CIO daily report. What kind of report you wouldprovide?
Considering available bandwidth, an similar observation can be made. If you areout of home at daytime and sleeping after nightfall the available bandwidth bethat 20, 50 or 150 Mbit/s to your home does not matter at those times. However,if you want to watch your favourite series from streaming service after dinner,you would be happy to receive constant 5-10 Mbit/s for video.
4 Passive measurementsWhile active measurements provide strong insight towards how network behavesunder additional load, it does not answer about how network and services arebeing used. Passive measurements provide insight on existing traffic in thenetwork. It can answer on many same questions active measurements cananswer too, just a slightly different view. As with active measurements, passivemeasurements have a huge range of scales between very detailed and highlyaggregate information.
Because passive measurements observe user traffic, there is a risk for privacyviolations that may lead into legal problems. User data can include sensitivepersonal information and passwords, credit card number and other confidentialinformation. End point identifiers (IP addresses, telephone numbers) can identifya single person or household. Information about with whom one communicateswith is sensitive information. This can reveal human relations. List of applicationsthat are used within a network segment can be also sensitive information. Thesequestions are discussed in detail in Privacy chapter.
4.1 CountersMost network devices, including end systems, collect very basic statistics ontraffic they generate, forward or receive. Most operating systems have commandnetstat9. When run with -s option it will report large number of differentcounters, including count of IP packets received, forwarded and sent.
Ip:60885114 total packets received
9Modern Linux systems do have netstat replacement as ss command that provides moreTCP and state information but does not provide statistics in same format.
29
9895 with invalid headers192368 forwarded0 incoming packets discarded60681949 incoming packets delivered32992714 requests sent out2800 outgoing packets dropped6203 dropped because of missing rout
...
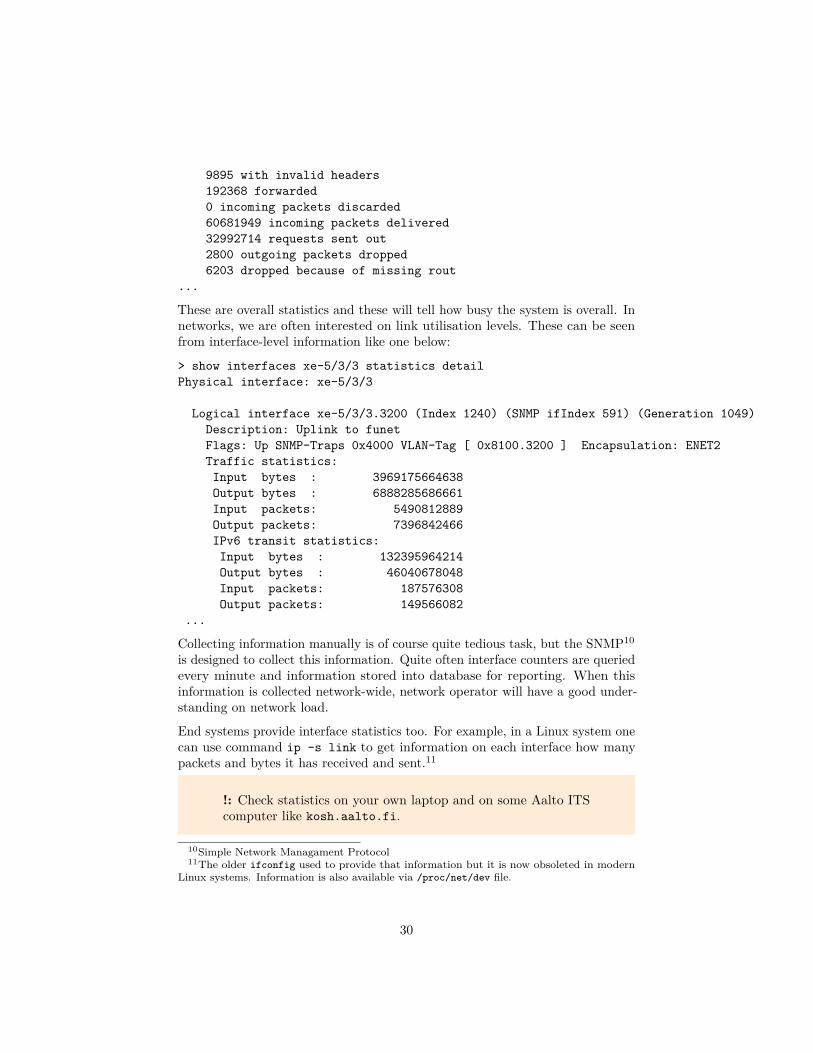
These are overall statistics and these will tell how busy the system is overall. Innetworks, we are often interested on link utilisation levels. These can be seenfrom interface-level information like one below:
> show interfaces xe-5/3/3 statistics detailPhysical interface: xe-5/3/3
Logical interface xe-5/3/3.3200 (Index 1240) (SNMP ifIndex 591) (Generation 1049)Description: Uplink to funetFlags: Up SNMP-Traps 0x4000 VLAN-Tag [ 0x8100.3200 ] Encapsulation: ENET2Traffic statistics:Input bytes : 3969175664638Output bytes : 6888285686661Input packets: 5490812889Output packets: 7396842466IPv6 transit statistics:Input bytes : 132395964214Output bytes : 46040678048Input packets: 187576308Output packets: 149566082
...
Collecting information manually is of course quite tedious task, but the SNMP10
is designed to collect this information. Quite often interface counters are queriedevery minute and information stored into database for reporting. When thisinformation is collected network-wide, network operator will have a good under-standing on network load.
End systems provide interface statistics too. For example, in a Linux system onecan use command ip -s link to get information on each interface how manypackets and bytes it has received and sent.11
!: Check statistics on your own laptop and on some Aalto ITScomputer like kosh.aalto.fi.
10Simple Network Managament Protocol11The older ifconfig used to provide that information but it is now obsoleted in modern
Linux systems. Information is also available via /proc/net/dev file.
30

Figure 5: Traffic statistics from Netnod IX
?: Is there risk of privacy violation if counters are observed?
4.2 Application: log filesA typical example of network traffic related log is a web server access log. Theweb server records information about each request. Depending of configurationand software, it can include following items:
• IP address of the host making request• operation requested (GET, POST, . . . )• resource requested• wall time the request was made• response code (was resource found or permitted)• bytes transferred• time elapsed in serving.
Different stakeholders will look on different items. One responsible for thecontent on server is interested on how many time each resource is requested.Bytes transferred and response time (time elapsed in serving) are interest of whotakes care of server and network performance.
Like web servers, almost all servers include some kind of logging function. Theseare useful also in estimating traffic volume and service times.
Sep 28 21:25:36 mailsrv postfix/cleanup[14351]: 4E677C116E:
31
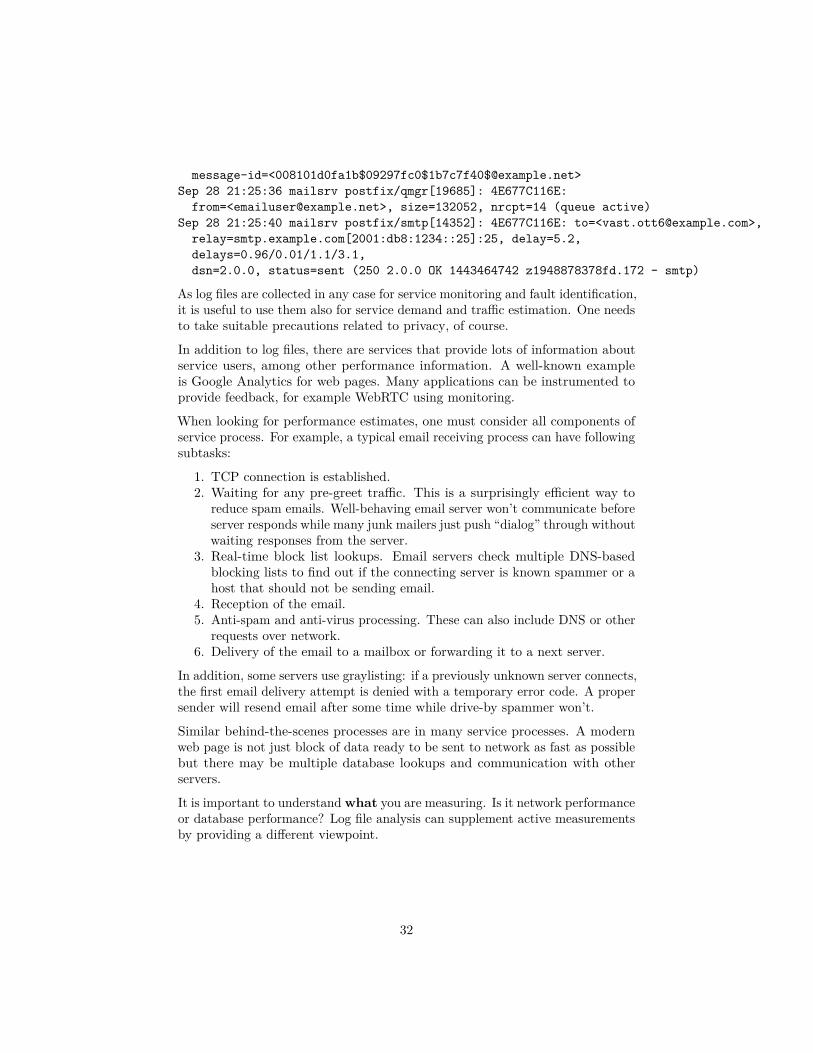
message-id=<[email protected]>Sep 28 21:25:36 mailsrv postfix/qmgr[19685]: 4E677C116E:
from=<[email protected]>, size=132052, nrcpt=14 (queue active)Sep 28 21:25:40 mailsrv postfix/smtp[14352]: 4E677C116E: to=<[email protected]>,
relay=smtp.example.com[2001:db8:1234::25]:25, delay=5.2,delays=0.96/0.01/1.1/3.1,dsn=2.0.0, status=sent (250 2.0.0 OK 1443464742 z1948878378fd.172 - smtp)
As log files are collected in any case for service monitoring and fault identification,it is useful to use them also for service demand and traffic estimation. One needsto take suitable precautions related to privacy, of course.
In addition to log files, there are services that provide lots of information aboutservice users, among other performance information. A well-known exampleis Google Analytics for web pages. Many applications can be instrumented toprovide feedback, for example WebRTC using monitoring.
When looking for performance estimates, one must consider all components ofservice process. For example, a typical email receiving process can have followingsubtasks:
1. TCP connection is established.2. Waiting for any pre-greet traffic. This is a surprisingly efficient way to
reduce spam emails. Well-behaving email server won’t communicate beforeserver responds while many junk mailers just push “dialog” through withoutwaiting responses from the server.
3. Real-time block list lookups. Email servers check multiple DNS-basedblocking lists to find out if the connecting server is known spammer or ahost that should not be sending email.
4. Reception of the email.5. Anti-spam and anti-virus processing. These can also include DNS or other
requests over network.6. Delivery of the email to a mailbox or forwarding it to a next server.
In addition, some servers use graylisting: if a previously unknown server connects,the first email delivery attempt is denied with a temporary error code. A propersender will resend email after some time while drive-by spammer won’t.
Similar behind-the-scenes processes are in many service processes. A modernweb page is not just block of data ready to be sent to network as fast as possiblebut there may be multiple database lookups and communication with otherservers.
It is important to understandwhat you are measuring. Is it network performanceor database performance? Log file analysis can supplement active measurementsby providing a different viewpoint.
32
?: Consider web server. What kind of caveats there is in makingconclusion on network quality?
4.3 Packet captureA network provider or other entity does not have access to all end devices inthe network.12 Monitoring each end device is then out of question. We are thenleft to monitor traffic in the network. A network traffic can be observed viafollowing methods:
1. Capturing outgoing and incoming traffic in end devices. Traffic is limitedto that traffic where a host is participant and then some broadcast andmulticast traffic.
2. Capturing traffic in a network device. This can be a purpose-built devicethat receives traffic, stores a copy and forwards packet. Also some routers,firewalls and network switches can have this kind of functionality but bufferspace is limited making them unsuitable for sustained capture. They can,however provide flow statistics.
3. Mirroring traffic in a network device. Routers and switches can supportport mirroring or monitoring port functionality. A network interface canbe configured to forward a copy of incoming and outgoing packets to amonitoring port. A device to capture traffic would be connected there.Mirroring includes many limitations that are discussed in detail in Portmirroring.
4. Capturing traffic on link. An device that is transparent to routers isinstalled on link. On optical links signal spitter can be used to direct partof light to a monitoring device. On electrical lines there is need for anamplifier that allows multiple devices to be on link. On radio links justantenna is sufficient. These methods will be discussed in Wiretappingchapter.
When traffic is mirrored or wiretapped, the traffic must received by some devicefor real-time analysis or storage. At low bit rates, a normal computer with amatching network interface card is just fine for the purpose. With higher bitrates and especially on high packet rates performance becomes an issue.
?: A residential network provider has an option to put monitoringdevice on each consumer link or alternatively on links aggregatingthese to core routers. Consider benefits of either option.
When a packet is captured, there are lots of information associated with it.12Company network or a network where only provider provisioned devices are used can be
exceptions.
33
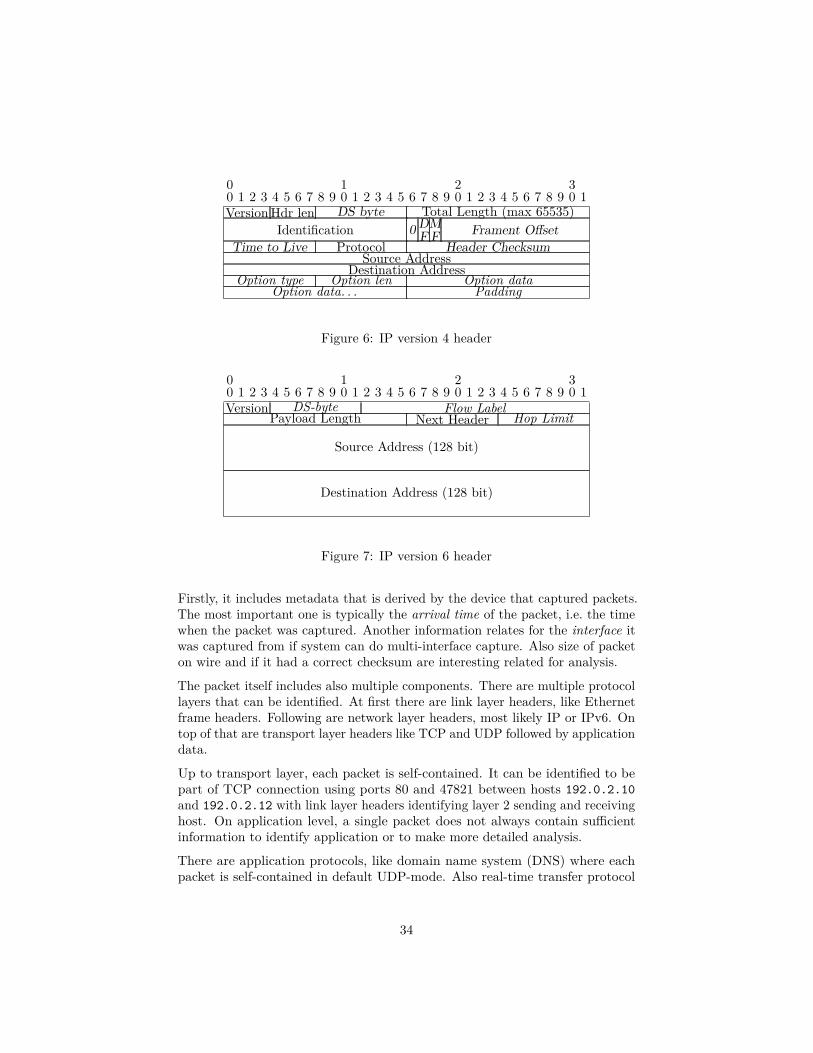
00 1 2 3 4 5 6 7 8 9
10 1 2 3 4 5 6 7 8 9
20 1 2 3 4 5 6 7 8 9
30 1
VersionHdr len DS byte Total Length (max 65535)Identification 0 DF
MF Frament Offset
Time to Live Protocol Header ChecksumSource Address
Destination AddressOption type Option len Option data
Option data. . . Padding
Figure 6: IP version 4 header
00 1 2 3 4 5 6 7 8 9
10 1 2 3 4 5 6 7 8 9
20 1 2 3 4 5 6 7 8 9
30 1
Version DS-byte Flow LabelPayload Length Next Header Hop Limit
Source Address (128 bit)
Destination Address (128 bit)
Figure 7: IP version 6 header
Firstly, it includes metadata that is derived by the device that captured packets.The most important one is typically the arrival time of the packet, i.e. the timewhen the packet was captured. Another information relates for the interface itwas captured from if system can do multi-interface capture. Also size of packeton wire and if it had a correct checksum are interesting related for analysis.
The packet itself includes also multiple components. There are multiple protocollayers that can be identified. At first there are link layer headers, like Ethernetframe headers. Following are network layer headers, most likely IP or IPv6. Ontop of that are transport layer headers like TCP and UDP followed by applicationdata.
Up to transport layer, each packet is self-contained. It can be identified to bepart of TCP connection using ports 80 and 47821 between hosts 192.0.2.10and 192.0.2.12 with link layer headers identifying layer 2 sending and receivinghost. On application level, a single packet does not always contain sufficientinformation to identify application or to make more detailed analysis.
There are application protocols, like domain name system (DNS) where eachpacket is self-contained in default UDP-mode. Also real-time transfer protocol
34
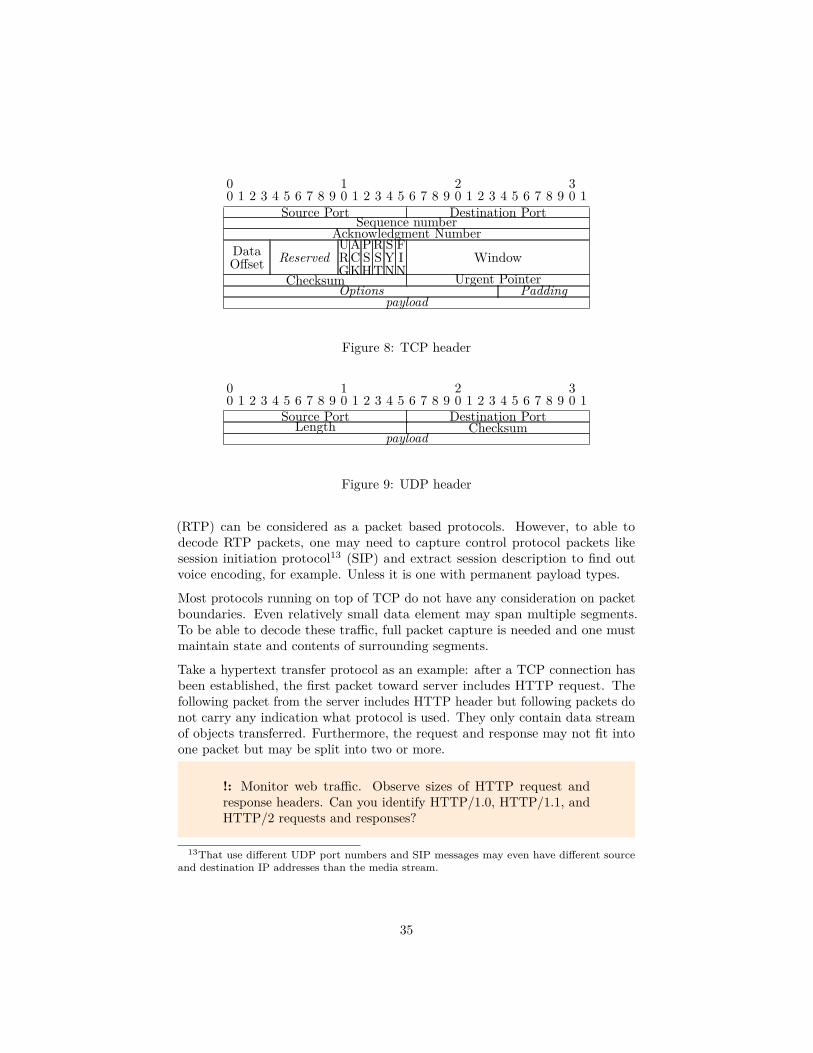
00 1 2 3 4 5 6 7 8 9
10 1 2 3 4 5 6 7 8 9
20 1 2 3 4 5 6 7 8 9
30 1
Source Port Destination PortSequence number
Acknowledgment NumberDataOffset Reserved
URG
ACK
PSH
RST
SYN
FIN
WindowChecksum Urgent Pointer
Options Paddingpayload
Figure 8: TCP header
00 1 2 3 4 5 6 7 8 9
10 1 2 3 4 5 6 7 8 9
20 1 2 3 4 5 6 7 8 9
30 1
Source Port Destination PortLength Checksum
payload
Figure 9: UDP header
(RTP) can be considered as a packet based protocols. However, to able todecode RTP packets, one may need to capture control protocol packets likesession initiation protocol13 (SIP) and extract session description to find outvoice encoding, for example. Unless it is one with permanent payload types.
Most protocols running on top of TCP do not have any consideration on packetboundaries. Even relatively small data element may span multiple segments.To be able to decode these traffic, full packet capture is needed and one mustmaintain state and contents of surrounding segments.
Take a hypertext transfer protocol as an example: after a TCP connection hasbeen established, the first packet toward server includes HTTP request. Thefollowing packet from the server includes HTTP header but following packets donot carry any indication what protocol is used. They only contain data streamof objects transferred. Furthermore, the request and response may not fit intoone packet but may be split into two or more.
!: Monitor web traffic. Observe sizes of HTTP request andresponse headers. Can you identify HTTP/1.0, HTTP/1.1, andHTTP/2 requests and responses?
13That use different UDP port numbers and SIP messages may even have different sourceand destination IP addresses than the media stream.
35
Packet data can be stored to disk for post-processing and analysis or it canbe analysed real-time. The first alternative requires large disk capacity withgood write performance, while the latter requires good processing capacity inreal-time.
4.4 Packet data analysisAnalysing packet traces can be divided into three principal groups. The mostbasic one is to include only those analysis where state information is limited andsmall. Even quite low-performance network device could collect this information.For example, following IP protocol statistics are easy to collect with small tablesof counters:
• IP length distribution. Either using individual values or histogram binslike 0-32, 33-64, 65-128, . . . , 1024-2048.
• IP protocols observed. Eight-bit value, so 256-element table is sufficient.• TCP, UDP and STCP port numbers. If source and destination port
numbers are tabulated separately then two 65536 element tables are neededper protocol. If source-destination port pairs are recorded, then over 4billion (232) elements are needed per protocol.
The second group would be those analysis that have much larger and sparsevalue space but still there is no need to keep information about individual flows.Examples of this kind of analysis include:
• Time between two subsequent packets i.e. packet inter-arrival time(IAT).14
• IP addresses of communicating hosts. While a large server can store datastructure for each possible IPv4 address (232) but not for every possibleIPv6 address (2128), in practise number of hosts communicating towardsone network is much smaller. In core network many addresses are seenover time.
The next step is keep track on individual flows. At this stage there is most likelya need to employ some time based garbage collection to reclaim memory spacefrom information that is not active anymore.
• Flow or TCP connection logging. Each connection (5-tuple as dis-cussed in Flows in IP Networks) or flow will consume amount of memoryto keep track. One will use timeouts to clear old and stale entries.
• TCP connection analysis for congestion windows.
The fourth analysis group requires storing all or part of payload data of transportprotocols. Protocol data units must be defragmented to correctly parse values.Once part of header or payload data is fully analysed, data can be discarded.This type of analysis include:
14Strictly speaking, packet inter-arrival can be anything from minimal packet length dividedby line rate to infinity.
36
• Analysis on application-layer protocols like HTTP, SMTP• Analysis on user data, i.e. deep packet inspection (DPI)
With encrypted connections becoming more prevalent, possibilities of applicationprotocol analysis and DPI have less value.
?: How one could estimate needed memory capacity in each groupof analysis? Are those dependent on traffic volume, number ofnetwork (stub) users, or both?
4.5 Flow measurementsCollecting and storing packet data quite often requires additional hardware toimplement. Many routers implement flow information export, IPFIX protocol[23], or similar vendor defined protocol like NetFlow or J-Flow. This allowscollecting flow data without introducing additional elements on network datapath. Only data collector needs to be installed.
The flow information reporter sends data to collector. A flow record includestypically information common to all packets in flow: IP source and destinationaddresses, DSCP values, transport layer protocol, and transport layer ports.Information related to routing such as input and output interfaces and AS routinginformation can also be included. In addition, there are flow meta informationsuch as flow start and end time, number of bytes and packets in a flow.
?: What would be approximate difference in data volume gener-ated by packet capture and by flow information collection?
It is important to note that statistics collection is a secondary function for arouter. In case router is overloaded, it may drop flow reporting to keep forwardingpackets. Also it is possible that it reports only part of flows, not all.
4.6 Measurement samplingData volumes in both packet and flow-based measurement may be too large toreasonable process them. An obvious question is, can we reduce data by maybetaking only one out of ten packets or flows and still get reasonable good resultsfor our analysis.
How packets or flows are then selected will have an effect on for which analysiswe can use data for. Some common selection processes are following:[24]
• Count-based sampling: every N packet one packet is selected or every Npacket M packets are selected.
• Time-based sampling: in every interval of length T all packets that arrivewithing time t are captured.
37
• Random sampling selecting n out of N packets. For example, a vectorof length N will have n random positions marked. For a sequence of Npackets, those packets are selected whose sequence matches in vector.
• Random sampling with uniform probability p. For each packet a randomselection is made resulting desired probability.
• Random sampling with weighted probability. Some packets are selectedalways (i.e. important packets) or with higher probability than rest ofpackets that are selected based on uniform probability p.
• Filter selection of packets. This is a deterministic selection. Packets maybe selected based on protocol fields in packet like source or destinationaddresses, or protocol numbers. Selection may be based also on events: forexample if the packet is rejected by router access list, fails reverse pathcheck or destination AS number matches for rule.
• Hash-based selection allows selecting quite random but still same packetsat different observation points. This is mainly used for trajectory sampling.
Effect of sampling strategies to analysis is discussed more detail in analysis partof the course.
?: Does some sampling strategy work badly / exceptionally forsome kind of application or protocol?
4.6.1 Trajectory sampling
If we want to observe for example packet delay or packet loss probability betweentwo points in the network we can set up two measurement points and captureall packets at both locations. Then we compare traces and identify packets thatwere seen or should have seen in both locations. This will result lots of data andif they are different locations, packet data must be transferred between sites.
Some sampling could clearly be used. However, selecting every N th packet or apacket randomly with probability p will not provide results we want. In randomselection, if p=0.01, only every 100th sampled packet will match for the packetat remote end and we can use only 1/10,000 of packets. Situation is even worseif we have more measurement locations.
Clearly we must use more deterministic selection process. If it is some knowntest traffic we want to monitor, we could just put the right 5-tuple filter in placeand receive only this test traffic. If we want to select our traffic more randomly,we can use hash-based filtering. We calculate hash value from non-volatile packetheaders and possibly from payload and use it as an selection criteria.
An IP packet is not unmodified while it travels over network. In version 4, atleast time-to-live (TTL) value is decreased by each router resulting also new IPheader checksum to be calculated. Version 6 does not have header checksumbut hop limit is reduced. In addition, differentiated services code points (DSCP)and early congestion notification (ECN) may be changed over life-time of packet.
38
While IPv6 non-zero flow label should not be modified, in certain situations itcan. However, withing one security domain it should stay intact [25]. Transportprotocol headers or payload is not modified.15 Our hash function must excludethose volatile fields. Quite often these are set to defined value, like zero.
If we use only fields that do not change between different packets of the sameconnection, then we are able to capture all packets that are part of same flow.Depending on analysis, this may be desirable. From security perspective, thehash function should be such that malicious players cannot game it to eitheroverload analysis or evading sampling. At minimum the hash seed value andselection value may not be known by outsiders.
?: Could trajectory sampling work if only payload would beincluded into hash calculation.
A hash function is a method to generate fixed length value of arbitrary long datawith low probability two messages producing the same value. Cryptographicmessage digest functions like SHA [26] make it highly difficult to generate twomessages producing same digest value but those algorithms are computationallyexpensive. For many purposes cyclic redundancy check (CRC) family functionsprovide sufficient separation of different messages if no active attacks are expected.
!: There exists command line tools like crc32, md5sum, sha1sum,sha224sum, and others. Run those on some large file and comparetime spent. Command time may be helpful.
If algorithm is implemented on hardware (ASIC or FPGA), CRC functionsare very simple to implement (shift register and XOR gates) compared tocryptographically secure hash algorithms.
4.7 Analysis based on passive measurementsThe location of the observation point – where a packet traffic is captured – islocated, does have an effect on how the results should be interpreted. If thepoint is at the same host as one of end systems, we can assume to have almostthe same view as this end. At high load situations some packets may be losteither by the capture process or by the application. The delays may also beslightly different.
If we want to observe a larger network, one can find points in a network wherewe can observe all traffic towards one end of communication. Many servernetworks do have redundant paths up to close to end systems: in these casestwo measurement points are needed. Wired local area network most likely haslow delay and loss compared to Internet connections or wireless networks. Of
15In principle. Some service providers modify e.g. HTTP traffic by injecting advertisements.
39
course, it is not unheard for a datacenter LAN to have serious problems withpacket loss or capacity.
In any case, we need to take into account any possible events for a packetmay encounter between our observation point and the destination. One cannotassume that a incoming packet seen at datacenter border router will be deliveredto a destination server or packet seen at home cable modem will be deliveredover WLAN to a user device.
!: Send ICMP Echo requests (ping) to WiFi access points (de-fault gateway) when you are connected to network. Let it runfor several hours. Are there any lost packets? How much delayvariation there exists?
4.7.1 Throughput measurements
Finding lower bound for maximum speed a host can send traffic is quite easyfrom packet traces. By aggregating traffic from a source it is possible to calculatetotal throughput. In the smallest timescales some buffering may result too highrates, but on timescales exceeding seconds this should be reasonably good.
Of course, the key question here is if the host is sending with maximum rateat any point of time or is the traffic limited by the application or host itselfor by some part of the network. Using packet traces it is possible to estimatecongestion window at sender. If the congestion window estimate is larger thanactual amount of data in flight, then transmission is limited by sender.
We can use that analysis to extract select only those flows that are not limited byhosts or applications. Another possibility is to identify periods of bulk transfer.For example a HTTP connection can be left idle after transfer has taken placeto wait for additional requests from the same host. Taking average over wholeconnection life-time will result lower measured throughput.
If we have only processed flow data from IPFIX collector and not packets, theanalysis is a bit more complicated. We cannot identify from the flow data ifthere has been any lulls or idle periods where host has not been sending dataactively: it does not have data to send or the recipient is not willing to receivedata.
Different applications utilise network capacity differently. For example videostreaming over HTTP often has high bitrate at start to fill playout buffer butlater reduces to rate close to actual video bit rate. In this way client buffering isreasonable and there is enough data in buffer for most of network slowdowns.The bittorrent application will control its connected peers by throttling thoseconnected peers whose chunks are not preferred ones. TCP connection staysopen but not traffic is exchanged for a period of time.
40

C O S
SYN
SYN+ACKACK
Figure 10: Delay difference at Observer compared to Client or Server
!: Start packet capture on your computer. Visit several videostreaming sites (YouTube, Vimeo, YLE Areena, Netflix. . . ) andwatch some videos, preferable over 15 minutes. Make note ofstart and end times for each. Stop packet capture and identifyvideo streams: most likely these are the largest TCP streams.Observe if there are any differences how network capacity is usedover time of video.
4.7.2 Delay measurements
Any protocol that has request-response type with identifiable packets can besuitable for delay measurements. A prime example is TCP 3-way handshake.Using time difference between SYN and SYN+ACK segments we know round-trip time to the server from the observation poit. Time between SYN+ACK andfirst ACK-only segment is round-trip time to the client.16
Other useful messages include those used in active measurements. Unless theyare encrypted, one can correlate ICMP Echo Requests and Responses, OWAMPand TWAMP messages, and DNS queries among other. Again, one must considerpossible end system delays. Like with DNS queries: can the server respondwithout any additional delay.
?: What other protocols would be good for delay estimates?
We cannot observe individual packets from flow data. However, in case ofunidirectional flow data, we can map both halves of connections and comparestart times. This could give in case of TCP connections the round-trip timetowards server. One must however consider the timestamp accuracy of devicecollecting flow data.
16We use client and server in typical settings: the server makes passive open i.e. listens forincoming connections.
41
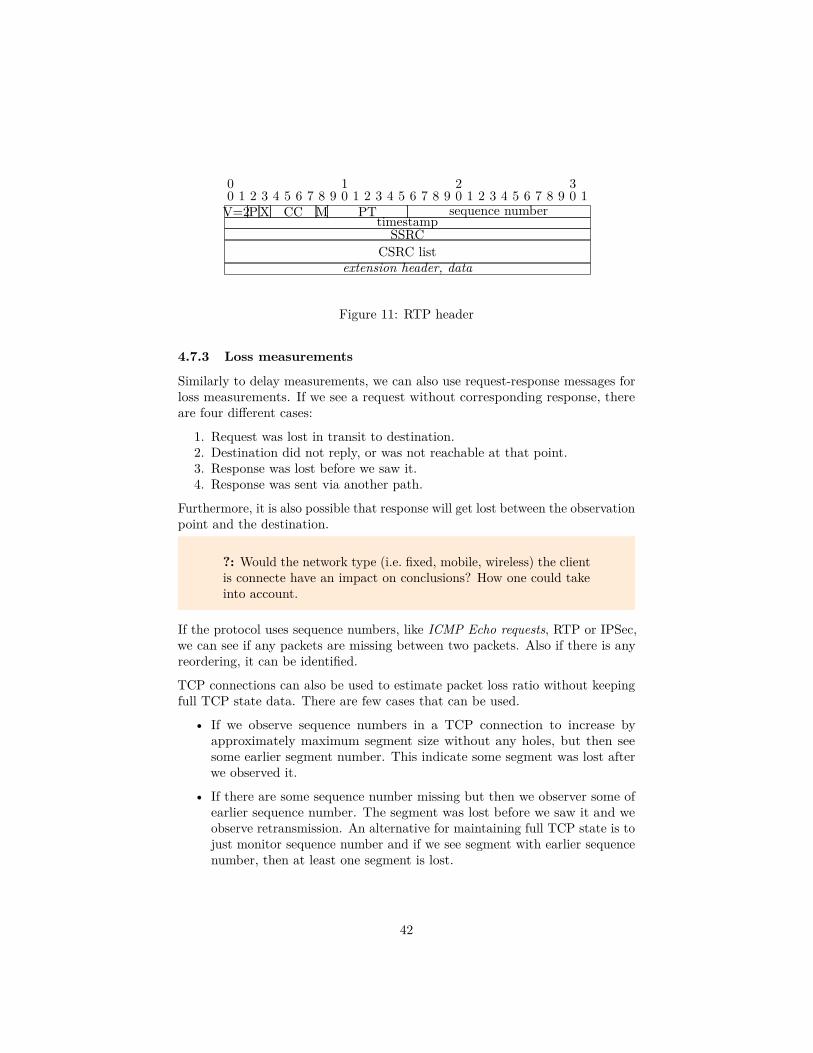
00 1 2 3 4 5 6 7 8 9
10 1 2 3 4 5 6 7 8 9
20 1 2 3 4 5 6 7 8 9
30 1
V=2P X CC M PT sequence numbertimestamp
SSRCCSRC list
extension header, data
Figure 11: RTP header
4.7.3 Loss measurements
Similarly to delay measurements, we can also use request-response messages forloss measurements. If we see a request without corresponding response, thereare four different cases:
1. Request was lost in transit to destination.2. Destination did not reply, or was not reachable at that point.3. Response was lost before we saw it.4. Response was sent via another path.
Furthermore, it is also possible that response will get lost between the observationpoint and the destination.
?: Would the network type (i.e. fixed, mobile, wireless) the clientis connecte have an impact on conclusions? How one could takeinto account.
If the protocol uses sequence numbers, like ICMP Echo requests, RTP or IPSec,we can see if any packets are missing between two packets. Also if there is anyreordering, it can be identified.
TCP connections can also be used to estimate packet loss ratio without keepingfull TCP state data. There are few cases that can be used.
• If we observe sequence numbers in a TCP connection to increase byapproximately maximum segment size without any holes, but then seesome earlier segment number. This indicate some segment was lost afterwe observed it.
• If there are some sequence number missing but then we observer some ofearlier sequence number. The segment was lost before we saw it and weobserve retransmission. An alternative for maintaining full TCP state is tojust monitor sequence number and if we see segment with earlier sequencenumber, then at least one segment is lost.
42
?: What kind of factors at end systems would affect on aboveestimate?
Flow data is little use for loss analysis.
4.7.4 Real-time transport protocol measurements
RTP is a protocol run top of UDP17 to transport time-critical information suchas voice or video between sender and receiver. It also can be used with multicasthaving multiple receivers and senders. It provides sequence numbering and timesynchronisation that is very useful in analysing network quality.
One cannot identify RTP packet from just one packet because it does not usewell-defined port numbers but ones that are randomly allocated by an application.The best way is to monitor signalling protocols like SIP, H.323, or Jingle andextract IP addresses and port numbers there. With SIP, session descriptionprotocol (SDP) contains port and media information. Also it is possible to guessRTP packets by monitoring several packets to check if they would form an RTPsession: sequence number and timestamp would be increasing while other fieldsstay same.
?: Look on RTP header. Can you define a packet to be RTP onebased on single packet? If not, how many packets are needed?
Sequence numbers can be used to find out if there are any lost or duplicatepackets. Delay and delay variation can be measured too if timestamp rate isknown i.e. by SDP or guessing. Many voice codec use timestamp rate of 8000/s.
RTP is accompanied with real-time transport control protocol (RTCP) thathelps with synchronising different senders and provides quality reports. Thesender reports include NTP-RTP timestamp mapping and information how manypackets and bytes the sender has sent.
Receiver reports include percentage18 of packet lost, cumulative count of lostpackets, highest sequence number received, time when last sender report wasreceived and jitter value calculated with formula below:
J(i) = J(i− 1) + (|D(i− 1, i)| − J(i− 1))/16 (1)
D(i, j) = (Rj −Ri)− (Sj − Si) = (Rj − Sj)− (Ri − Si) (2)17Other transport protocols like STCP, DCCP and TCP are also possible, but rarely used.18Actually, how many 1/256th are lost.
43
RTP performance analysis can be used both estimating [voice quality][Voicequality analysis] and overall network quality.
?: What kind of heuristics one could use to identify RTP streamsin the network?
4.7.5 Encrypted connections
IPSec encrypted data can be monitored using IPSec sequence numbers. We cansee if there are some lost packets.
?: Look on headers of IPSec header. What fields can be usedfor analysing connection quality?
It is also possible to identify applications and situations used inside VPN con-nection by observing packet lengths, packet interarrival times and changes inbandwidth consumed. In high security environments Traffic Flow Confidentiality(TFC) mechanisms are often used.
4.7.6 Anomaly detection
An important area related for security is to identify any abnormal changes innetwork traffic. Most Network Intruision Detection Systems (NIDS) are signaturebased, i.e. they match for known malicious traffic. Anomaly detection may beefficient for unknown attacks. However, the challenge is know the baseline andnormal variations.
Furthermore For example, [27] includes survey of various facets of networkanomaly detection.
5 Concluding resultsSo far we have made measurements using active, passive, or both methods.We have some numerical results using analysis on the measurements. Now thequestion: is the network any good for our applications?
5.1 Characterising delay distributionIn typical network that is not heavily congested, delay distribution is left-sided. There is a minimum delay that has no queuing delay but just processing,serialisation, and propagation delays. A majority of packets are close to thisminimum value. There are often some packets that are delayed very much.
If a mean delay is selected as an indicator, the long tail of delays will increaseaverage delay much higher than it really is perceived by users. The most relevant
44

100 200
95th (240)
median (150)average (163)
first (190)
count
delay
14,7%
Figure 12: Delay distributions by Y.1541
definition of delay depends on application and transport protocol used.
For example ITU-T Y.1541 [28] defines following ways to define delay variationor delay distribution:
1. For each packet, variation is difference between then delay of the firstpacket and current packet delay.
2. For each packet, variation is difference between mean delay of populationand current packet delay.
3. Select acceptable delay interval in advance and count the proportion ofpackets that fall outside this interval.
4. Distance between two quantiles like 0.95 and 0.5.
For example from the figure above following values can be identified:
1. First packet delay is 190 ms, so variation for each packet is |di − 190| ms.2. Mean delay is 163 ms, variation is |di − 163|3. If acceptable delay interval is 100-200 ms19 then 14.7 % fall off this region.4. Median delay is 150 ms and 95th percentile is 240 ms so variation is 90 ms.
The third criteria would be suitable for real-time communications if upper boundis set for playout delay. First two are suitable to measure instantaneous delayvariation while the fourth could be a good one for generic use.
?: Consider different types of applications. What delay definitionwould be the most suitable?
5.2 How to report quality measures to the usersProviding 86,400 measurement values for each day and each connection is notvery useful or easy for the user to understand. Situation is harder if one needsto compare different providers. On the other hand, a single number may be
19The shortest delay is more than 100 ms, so lower bound could be zero as well.
45

too little compared for needs. Consider, for example, a journalist working forTV station. There are two needs for her: high capacity link to upload videosegments and low-delay, low-jitter for real-time report in news broadcast. Asingle network may not provide both features.
A good approach is to select few key indicators and provide a single number foreach of those:
1. Median delay for each packets. If packet is lost then its delay is set toinf.
2. Loss ratio with wait time of 2 seconds.3. Delay spread as difference between 25th and 75th percentiles.4. Duplicate packets within 2 seconds.5. Reordering as fraction of packets received later than following packets.
When coupled with nominal or measured throughput figures, these providequality for the network. Smaller values are better.
?: What key metric is missing? Why it is not part of above list?
?: You are looking for a network connection to your home andthere are several providers (with different technologies) and theyprovide estimation of quality metrics above. How you wouldmake decision if there are none above all others in all metrics?
5.3 User sessionsOne can tell difference between humans and machines by one criteria: machinesare more deterministic. In network traffic this is implied by two-level process:most user actions are randomly distributed and can often modelled as Poissonprocess or similar.
For example, the time when a user decides to make a call is an example ofrandom process. After the call has established, the process at packet level followsdeterministic process when packets are sent with fixed intervals, typically every20 milliseconds. If there is a silence suppression, this will result periods of nopackets whose interval and length are randomly distributed. The call length isalso a random.
?: Consider the difference in participating to a conference calland a normal two-party call. How the traffic pattern would bedifferent?
Similarly, a decision to visit a web page by clicking on a link has random timing.Following HTTP requests are deterministic but may depend on the past browsing
46
history as some objects are cached on user device. Those TCP connections thatcarry HTTP requests produce packet flow that is quite similar in many differentnetwork conditions. The next user action resulting network traffic also happensat random point depending when user has completed reading the page or findsthe next link to click to.
One must, however, consider situations where user actions are triggered by someexternal event. In these cases user arrivals are not randomly distributed butthere is a high burst of incoming users. These events are called as flash mobs orslashdot effects where large number of users are trying to reach service at thesame time. Examples include tele-voting in TV programs and ticket sales forpopular events.
!: One of challenges in network security is to differentiate betweenflood of genuine users and distributed denial of service (DDoS)attack.
?: Consider user actions when trying to reach a (suddenly)popular web site overhelming its capacity. How you could identifya situation where many requests fail from a) network traces orb) application logs.
5.4 What are the end points and use case?Quite often, a network user can trade between throughput, delay, and packetloss. However, the use case will have an effect on how much there is room fortrade.
Considering traffic sources, we can identify three different cases:
• Interacting situation where both (or multiple) endpoints produce trafficand changing turns. For example in voice communication one-way delay of150 ms is considered as the limit for a good quality. If the one-way delayexceeds 0.5 seconds it becomes hard to maintain conversation.
When multiple senses are combined, then delay offsets or inter-mediasynchronisation must be quite strict. For example in virtual reality settingeven difference of order 10 ms between visual image and motion can bedisturbing causing motion sickness.
• Live broadcast has more relaxed delay requirements and allows for moreplayout buffer. Playout buffers are used to compensate for possible packetloss or temporary changes in bandwidth. The delay live-to-receiver is asum of encoding delay, network delay and playout buffer delay. The playoutbuffer should be large enough to handle all delay variations.
47

In principle, the playout buffer can be as large as wanted. It is just notnice if a video broadcast you are watching shows a goal only after Twitterfeed. Or worse, shouts of “Gooooal” are heard from neighbour.
• Stored media, for example a movie, does not have any specific real-timerequirements. It is more like file transmission. However, there are fewrequirements that depend on architecture. First of all, the movie shouldstart as soon as possible after user has acted on. At the beginning ahigher throughput is needed to fill in the playout buffer. After that if userperforms any actions like pausing or seeking these should happen within areasonable time. With case of IPTV, channel change time is one criticalcriteria.
?: What would be a tolerable delay for various type of live eventstreaming:
1. Football match2. Tennis game3. Golf tournament4. Live concert5. Lecture having both on-site and remote participants. Dis-
cussion via Twitter wall.6. Prime minister press event announcing establishing top
research unit.7. President declaring war against a rogue nation.8. Publicly traded company announcing acquisition of their
major rival.
It also depends on the receiver what kind of errors are an issue. A humanwatching or listening is mostly sensitive on delay changes. Transitory errors arenot problem if they are not too frequent and there is sufficient error-free timebetween them. In voice communication distortion free interval should be at least1.3 seconds [29].
If the receiver is a recorder, then delay or retransmissions are not a problem.An error-free transmission is preferred. If the sending party has capacity tolocally store all of transmission, non-realtime transfer with TCP may be thebest option.
?: Consider a case of TV series. User has an option to eitherwatch it streaming, download each episode manually and watchwhen download completed, or have a subscription were newepisode is automatically downloaded when published. How thishas impact on network requirements?
48
5.5 Interactive useNon-media applications need also reasonable response times from the usabilityperspective. Usability studies has shown requirement for 0.1/1/10 seconds rule:[30]
• Immediate response withing 0.1 seconds. User feels that the action shemade (mouse click, key press) was registered by the the computer andsome visual or audible feedback is provided if even if the task was not fullycompleted.
• The task initiated should complete within 1 second. This keeps theuser workflow seamless even if the user recognises the delay compared toinstantaneous action. The user feels she is still controlling the device andnot waiting for it.
• If the task could not be completed within 1 second, some feedback shouldbe provided to the user about how long wait is estimated before it iscompleted. If the task is not completed within 10 seconds, the user easilystarts thinking or doing other tasks and it is harder to come back on theoriginal task.
There are some discussion if increased use of networked services has changedthese limits. Even as low values as 4 seconds are provided as critical abandontime for web pages. One such study was sponsored by a company providingfront end web caches, so that may be taken by grain of salt.
For good usability from network side, low latency and sufficient available band-width are needed.
?: Compare HTTP load time for 10 kibibytes document on twodifferent networks:
1. 128 kbit/s, 10 ms round-trip-time2. 1 Mbit/s, 150 ms RTT
5.6 Quality needs by applicationWhat network capacity is then sufficient for an application? For media (voice,video) streams it is quite simple to determine as each quality and compressionlevel and technology requires certain minimum rate.
5.6.1 Media applications
Voice communication can be served in different quality levels: narrowband codecsthat provide telephone quality with 300-3400 Hz frequency range. Widebandcodecs provide better speech fidelity with 8-16 kHz frequency range. Fullbandcodecs cover full human audible spectrum and are suitable also for music.
49
Frequency range for telephone circuits was determined at time of analog circuitsto be sufficient for voice communication. When transition to digital was made, 8bits sampled 8000 times a second was considered sufficient using compandingalgorithm (A or µ-law) to carry 3.1 kHz frequency range. This resulted G.711codec that has bit rate 64 kbit/s. As it is uncompressed algorithm it can toleratequite high bit error rates (10-2).
Voice codecs to provide approximately same quality are commonly used. Thesehave bit rates on 8-16 kbit/s and typically can tolerate 1-4 % packet loss rate.There are even lower bandwidth codecs providing rates of 2 kbit/s and below,typically for military use.
As IP communication like VoIP is not limited by traditional PCM hierarchy, itcan provide better quality voice and audio. Codecs optimised voice communica-tion have typically lower encoding latency compared to ones intended for filedistribution. While “CD quality” audio takes about 1.4 Mbit/s uncompressed,128-384 kbit/s is typically sufficient for the same quality as compressed.
!: A short review of voice codec quality with different codecs canbe found from http://opus-codec.org/comparison/
Video codecs provide even higher reductions between uncompressed and com-pressed video stream. A high definition video (resolution 1920x1080 at 60 framesa second) has uncompressed rate 2 Gbit/s but can be delivered less than 10Mbit/s stream. Normal standard definition TV broadcast is 166 Mbit/s uncom-pressed and 1.2 Mbit/s as compressed. Video compression algorithms continueto evolve thanks to increased processing power and allow higher resolutionswithout significant increase in bit rates.
A trivial implementation of video transmission may lead into very bursty traffic.Key frames can be more than 10 times larger than intermediate frames. If thisis not considered, it may lead into situation where packet loss affects on keyframes and results much worse subjective quality than packet loss suggests.
?: Most audio and video codecs can operate on either as constantbit rate (CBR) or variable bit rate (VBR) modes. For whichuse-cases the CBR is more suitable? What are the benefits ofVBR?
5.6.2 Non-media applications
A web browser is the common platform for accessing network services. Its usageand requirements should follow the 0.1/1/10 seconds rule. One significant changehas been the increase of web page sizes in recent years. While in 1995 the averageweb page was less than 15 KiB, in 2012 the average exceeded 1 MiB. In year
50

2015 average was more than 2 MiB.
Network throughput must be approximately 20 Mbit/s to load 2 MiB page in lessthan one second, depending on latency. On the other hand, it is quite commonthe sites to be application-like: not all of page is loaded every time user makesan action but background actions are taking place.
?: How long it takes to load 15 KiB page with 33.4 kbit/s modem?How about 2 MiB page with 2 Mbit/s mobile connection.
Of course, it is not only the network that is responsible from the user experienceand delay between user action and response. One must account also for bothserver processing (e.g. database searches and program logic) and the clientprocessing (parsing and decoding received data and rendering it to the user).
Then there are also applications that can perform operations on background.For example sending email could be performed on background. Also if thereis a large file to download, user is prepared to wait for it and have it performon background while doing other tasks. This applies both client-server andpeer-to-peer applications. This kind of applications are mainly dependent onthroughput. The lower limit of throughput depends on time user wants to waitfor.
?: How much feedback user must be given that there is outstand-ing operation? In what kind of situations this can be important?
Also operations between server processes often have timeouts. These are inpart defined to protect resources at end hosts. If the other party malfunctions,the other party can clear session after timeout. For example, SMTP has per-command timeout 2-10 minutes and session timeout of one hour. DNS uses5-second timeout with exponential back-off to one minute. Without timeouts,processes may get stuck indefinitely because of some error state.
?: With timeouts a drawback maybe the premature abortion oflong-running task that just takes longer time than anticipatedin system design and configuration. What kind of timeout andwatchdog mechanisms can be implemented?
6 Practical aspects of measurementsMeasurement by itself is quite simple: just send some test traffic or capturepackets from the network. However, there are many small details to be takeninto account while performing measurements. Some of these originate from
51

the very nature of networks that is distributed and highly parallel, others areimplementation artefacts.
6.1 Time synchronisationTo make useful measurements systems should have reasonably accurate clocks.It is much easier to combine results from different hosts if they agree on timereasonably well. For many purposes wrist clock accuracy (i.e. seconds) is justfine considering time zones are taken into account.
?: Systems can keep the time with UTC and represent a localtime to user calculating it based on timezone information. An-other alternative is to use the local time as system time. Whatbenefits either option has?
However, many measurements are easier to implement if each host has a veryaccurate clock. However, this is not typically a case and errors can found be thesame magnitude as the measurement results.
We can define following properties for time keeping:
• Accuracy is information how close to the current universal time the clockis
• Resolution is the smallest measurement unit the clock gives reading. Itis possible that a system gives reading with microsecond resolution but inreality the clock is updated maybe 100 or 1000 times per second. In thelatter case the resolution is only one millisecond.
• Skew is an error in clock rate. Either compared to universal time oragainst some other clock in the system.
• Offset is difference of two clocks or time references. Because of skew, thiswill change over time.
?: Consider different measurements. In what kind of measure-ments offset does not matter if skew is not significant? Whatkind of problems it causes if skew is alternating compared torelatively stable one?
Most ICT equipment have their time-keeping based on crystal oscillators (XO).Typically there is a low-resolution battery-backed real-time clock to keep timewhen powered off. When system is running, time is kept based on crystaloscillator providing also other clock signals. While XOs are quite stable, theyare dependent on operating temperature:
f = f0[1− 0.04ppm(T − T0)2]
(3)
52

Typically the error is around 10-7/Kelvin. One way to stabilise XO is to keep itin controlled temperature (typically around +75°C) and in that way performancearound 10-9/day can be reached with oven-controlled crystal oscillator (OCXO).
?: Why computer do not commonly have OCXO to provide timeinformation?
6.1.1 Network time synchronisation
The common method to synchronise clocks in Internet is to use Network TimeProtocol (NTP) [31]. It builds a multi-tree-like structure having high stratumclocks synchronised to time references at each root. In unloaded network onecan reach accuracy of few milliseconds.
The key uncertainty in NTP are the queuing delays. For example, time a packetwas sent at the host is not exactly know as are not known the delays in routers.To overcome these uncertainties, more detailed control is needed.
?: If you have Linux computer with NTP installed, you canuse ntpq -p command to print out the peers you computer issynchronising to and various statistics. What Stratum valuesyou find?
Precision Time Protocol (PTP, IEEE 1588) is designed to Ethernet networks. Ithas master-slave structure. After a synchronisation message is sent, it is followedby another message including the information of real time the message wassent. For a good accuracy, every devices in path must support PTP. Typically,microsecond is a typical accuracy that can be reached while in some environmentseven 100 ns is reachable.
?: How network technology affects on synchronisation proto-cols? Can one use PTP over WLAN? How about other radiotechnologies?
With PTP one uncertainty is still difference in forward and return path. Amulti-fiber cable each core has typically slightly different length and when cablesare joined together additional differences are created. A variation of PTPv2developed in CERN, WhiteRabbit, runs over single fiber optical link usingdifferent wavelengths for each direction. This guarantees they are the samelength and thus the delay is the same in both directions. A correctly set upsystem can reach accuracy of few nanoseconds. Light travels 30 cm in onenanosecond in air, about 20 cm in fiber.
53

6.1.2 Out-of-band synchronisation
Global Navigation Satellite Systems (GNSS) are based on triangulation usingaccurate time measurement for satellites. This information can be used for timesynchronisation too. A GPS disciplined clock can provide accuracy of order tensof nanoseconds. These have short-term stability based on crystal oscillator thatis tuned with GPS or CDMA clock source.
Most NTP and PTP servers use GNSS time receiver as reference clock and haveOCXO for short-term stability and backup. Modern mobile networks dependon good synchronisation among base stations. This information can be used fortime synchronisation too.
The remaining challenge is to interface this time information (typically 1 pulse-per-second PPS output and 10 MHz reference) to ICT device. Some of thosehave direct inputs but for most devices some add-on card is needed. Not all GPSdevices provide accurate time synchronisation output and are not suitable fortime keeping. They do keep long-term time, but can have error upto one second.
Traditionally serial port signals were used to signal epoach of second, but this isnot very accurate. Furthermore, in modern computers there is no “real” serialports. An interface card with appropriate trigger and counter logic is needed. Inthese cases, also latency resulting internal system bus access must be taken intoaccount.
?: What challenges there are using satellite-based time syncroni-sation compared to using network-based?
6.2 Packet capturePackets travelling over network must be copied to monitoring system to beavailable for analysis. There are several steps, starting with creating a copy ofpacket.
6.2.1 Port mirroring
Most modern wired networks use only point-to-point links and thus a computerconnected to wired network can only see its own, multicast, and broadcasttraffic.20 To capture traffic from point-to-point links one can use monitoring(“mirror”, “span”) ports or VLANs on network switches and routers. Networkinterface card of monitoring device is then connected to monitoring port.
There are many implementation dependent issues to consider on port mirroring:
• If two-way traffic in a port is mirrored to one port, traffic is lost if combined(in+out) port utilisation exceeds one-way line rate.
20There are ways to get around it, but they are more focus of security course.
54
• Switch internal capacity may be limiting number of monitoring sessions.• Not all packets may be mirrored. For example, some devices do not mirror
packets generated by themselves like ICMP Time Exceeded messages orrouting protocol messages.
• VLAN information may not be correctly recorded.
Some switches also support remote mirroring. A port or VLAN can forwardtraffic to a port on another switch over VLAN. This allows some switch-internaltraffic to be collected to central location.
?: Find from Internet the documentation of some networkswitches. Study how port mirroring can be configured. Whatkind of limitations there exists related e.g. for number of sessions,direction of traffic, VLANs, packets generated by switch andcapacity? What differences you can find?
6.2.2 Wiretapping
Optical links are easy to monitor using optical splitter that diverts some partof light to a second output. This causes some signal attenuation on path. Forexample 70/30 splitter allows 70 % of light to travel on original path with 2.5 dBattenuation. At monitoring port attenuation is 6.3 dB. If monitoring happenson remote end of long link there may not enough signal strength for monitoringeven if the actual link still works. There exists multiple split rates, the mostcommon being 90/10, 80/20, 70/30, and 50/50. These work typically on limitedwavelength range; device for 1310 nm does not work at 1550 nm. As passiveoptical devices they are very reliable and do not cause issues after installation.
Complexity in copper wire networks monitoring depends on if there is echocancelling used or not. Ethernet links at 100 Mbit/s and below do not useecho cancelling and using just suitable amplifier to provide strong signal for themonitoring device without attenuation for the link. On gigabit Ethernet as wellin ADSL the device installed must efficiently establish two links (one up, onedown) that makes the device more complicated and dependent on power supply.
?: In wired networks monitoring device is typically installedbetween the device and cross-connect or between two deviceswith normal connectors. Is it possible to wiretap copper cablewithout causing disconnect? How about optical cable?
While radio networks are easy to listen in principle, MIMO environments causesimilar issues as echo cancelling in wired links.
Many devices that are installed on-line like Ethernet demarcation devices mayalso provide monitoring function. Multiport monitoring devices may include
55

either optical switch to select the link to monitor or then may have someaggregation function: this will have similar challenges as switch monitor port.
6.2.3 High-speed capture
Traffic analysis has three time-critical tasks:
1. Packet capture2. Extracting interesting information from data flow3. Writing this information to non-volatile storage
The packet capture is very time-critical, link rate of 1 Gbit/s corresponds to 1MB in 10 ms that is on region on disk access latency. By default buffer size inLinux is 2 MB if the application does not specify other value.
?: What is the impact for analysis if some packets are lost?Would packet loss be correlated to some events in the network?
One possible approach is to utilise purpose-build network capture cards fromcompanies like Emulex or Napatech. These cards have on-board processor andmemory to take care of time-critical steps of packet capture. These provide anAPI to access packet data in efficient manner.
If a normal network interface card is used for capture, then the processor easilybecomes a bottleneck. It is not able to process packets fast enough as onlyone core of CPU can process packets at each time. Fortunately high-end serverinterface cards (10 Gbit/s) provide many queues. A packet is forwarded to aqueue for example based on source and destination IP addresses using selectionsimilar to hash-based sampling. Each queue is served by one processor core.
Linux kernel has support for multi-threaded packet capture using PACKET_FANOUTfrom version 3.1 (Oct 2011). Unfortunately support on user-level libraries(e.g. libpcap) and tools is so far thin.
Recent libpcap versions (1.5.3 or later from end of 2013) support LinuxTPACKET_V3 version that provide better throughput by more flexible bufferimplementation. Again, to use this application program must request it throughlibrary.
Also Data Plane Development Kit (DPDK) and other user space networkingframeworks are an interesting approach. When packet processing is done inlarge scale blocks, for example timing accuracy of individual packet may suffer.Depending on type of analysis wanted, this may be a problem or not.
?: What kind of accuracy one can expect if a captured packet istimestamped in
1. network interface card,
56
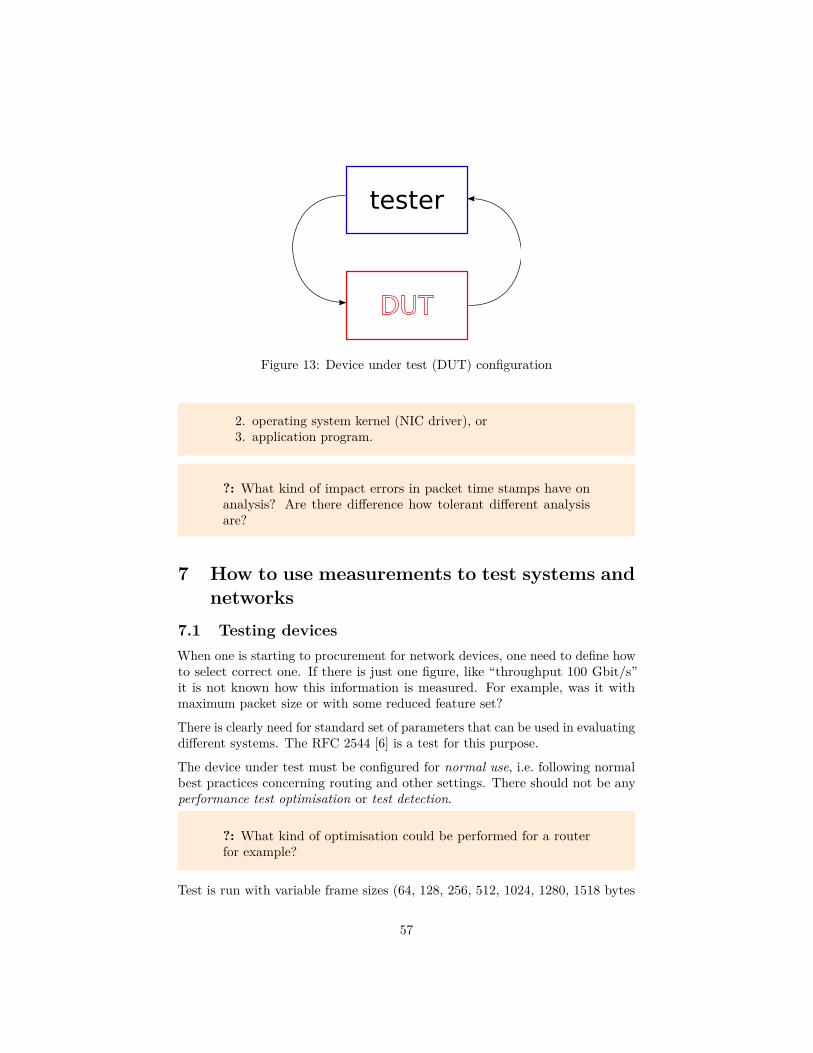
tester
Figure 13: Device under test (DUT) configuration
2. operating system kernel (NIC driver), or3. application program.
?: What kind of impact errors in packet time stamps have onanalysis? Are there difference how tolerant different analysisare?
7 How to use measurements to test systems andnetworks
7.1 Testing devicesWhen one is starting to procurement for network devices, one need to define howto select correct one. If there is just one figure, like “throughput 100 Gbit/s”it is not known how this information is measured. For example, was it withmaximum packet size or with some reduced feature set?
There is clearly need for standard set of parameters that can be used in evaluatingdifferent systems. The RFC 2544 [6] is a test for this purpose.
The device under test must be configured for normal use, i.e. following normalbest practices concerning routing and other settings. There should not be anyperformance test optimisation or test detection.
?: What kind of optimisation could be performed for a routerfor example?
Test is run with variable frame sizes (64, 128, 256, 512, 1024, 1280, 1518 bytes
57

sender DUT receiver
Figure 14: Network under test
for Ethernet) and burst sizes (16, 64, 256, 1024 frames). If the receiver receivesany non-test frames these are not counted for total volume. The report includes:
• dropped frames,• number of subsequent frame losses,• out-of-order frames, and• duplicate frames.
In many cases RFC 2544 is run with zero dropped frames. This is a problem forsoftware-based routers as they may drop some random packets even on quitelow levels of load. In these cases some low percentage of loss is allowed to getpractical throughput figure.
Tests can be run also as bidirectional and multiport tests. These are intended totest internal queuing performance by sending same destination sequence fromeach port.
?: Why sending same destination sequence (A, B, C, . . . ) fromeach port would test queue performance?
The RFC 2544 principle can also be used to test network. The packet structureis device-dependent but in most cases the packets carry sufficient information tomeasure delays and packet losses and identify any bit errors.
7.2 Testing networksWhile the RFC 2544 can be used for service activation tests (SAT) by networkproviders, it is not optimal for multi-class service provisioning. First of all, ituses only one traffic class and no different treatment for different traffic classesare studied. Even if tests are run for each traffic class, those are tested separatelyand no information on interactions between classes are learnt. It has the focuson throughput and no delay information is reported. Full test cycle on RFC2544 can take hours to complete.
The ITU Y.1564 is developed to overcome these limitations. [32] There are threetraffic levels:
• Committed Information Rate (CIR) where the traffic must meet thoseperformance objectives defined in SLA
• Excess Information Rate (EIR) where traffic exceeding CIR is providedbest-effort treatment
58
• Overshoot rate that is rejected by the service.
At CIR level the Key Performance Indicators (KPI) defined include theframe delay, delay variation and loss ratio. Quite often there is a defined lossratio for the service acceptance criteria. If the loss ratio is higher that that, testis considered as failure.
?: If service activation test would be “birth certificate” for aconnection, what kind of periodic checkups are needed? Howthey should be tested or monitored?
7.3 Testing servicesIt is not uncommon that a new service when introduced with fanfare still failsunder load when it is opened for the public and many interested people wantto use it. For that reason it is important to test service capacity both whenintroduced and also regularly when any modifications are made.
?: Some examples of failed deployments of new services? Wasthe reason for those reported afterwards?
For a web service, it is not sufficient just to load the main page but the interactionon the site should correspond to how real users would navigate and use the site.This includes having accounts or other state information per emulated user. Inthat way the full system is tested. If tests are done with one user only, the userdatabase won’t receive any real load, for example.
One challenge is providing this real data to the service. While just copyingexisting production database to test environment would provide exact datamodel for testing, this can have serious issues related for user privacy. For thisreason, test database must be artificially generated in many cases.
?: The company you work for is acquiring new web service toreplace existing site. There has been peak 10,000 daily visitorson the old site while there are 150,000 customers in database.For how many visitors you would stress-test the site.
The service should degrade gracefully, possibly to switch low-fidelity mode if pos-sible. In some cases security of service is compromised because of malfunctioningcomponents allowing unauthenticated users to access data or user is presentedwith other people’s data.
There are many commercial tools and many free tools available for testing. Freetools include jmeter, ab, and siege.
59
With dynamic page updates just loading main page URLs is not enough. Oneneeds to account background communication too. Browser developer tools arehelpful in providing view of resources the browser requests over network.
?: Open developer tools within browser. Open network tab ondev tools. Visit a web page and wait it to load. Right click onlist and select “Copy All as HAR” and paste to editor or “SaveAll as HAR”. The HAR file is JSON format data that includes allrequests made by broser. How many different servers contributeto that web page?
7.3.1 DDoS testing
Denial of Service (DoS) is the prevention of authorised access to a system resourceor the delaying of system operations and functions [33]. If there are a largenumber of hosts attacking (or intermediate) then it is Distributed Denial ofService (DDoS).
The denial of service can be accomplished with multiple ways:
1. Sending large number of traffic so that network links or network devicesare overwhelmed and no useful amount of legitimate traffic can pass.
2. Protocol properties may result that target system must keep lot of stateinformation and the resources are exhausted. A classic example is a TCPSYN flood that may be effective even today.
3. Implementations may have vulnerabilities. A malformed data may resulteither application to crash or consume large amount of processing. This issimilar to the previous one but only affects some implementations.
4. Some operations may be expensive to perform. The attacker may selectinput data that it exploits worst case performance.
5. Attack may target also to infrastructure or supporting functions: powersupply, cooling. Also attacks on routing can be considered infrastructureattacks in may cases.
Protocol and implementation vulnerabilities can be searched using various tools,including fuzzing tools. Typically traffic load in these cases is not high - unlessa bug related for high-load situation is expected. Those include various raceconditions.
One can try to protect from DoS with multiple ways which efficiency dependson type of attack. If attack comes from single or from few sources, it is easy tofilter out. In distributed case it is difficult to filter only malicious traffic withoutimpacting useful traffic. Quite often traffic profile in attack traffic is differentfrom normal traffic and this could be utilised in clearing traffic.
60

A test setup depends on the attack type the system is designed to be protectingfrom. In typical case there would be a normal load traffic testing analysingsystem performance under attack and another system generating attack traffic.In an ideal case normal traffic would not deteriorate at all while the system isunder attack.
7.4 Service Level AgreementsThe Service Level Agreements (SLA) are between customer and serviceprovider. The service provider can be an external organisation, but also anotherdepartment within organisation. With agreements, the parties have commonunderstanding about services, priorities, responsibilities, guarantees and war-ranties.
Service levels are defined using key performance indicators (KPI). Theseare defined as target values, i.e. long-time averages and minimum values over ameasurement period. If targets are not met, there are sanctions towards provider.
Metrics are monitored using SLA assurance tools that monitor KPIs and networkmetrics related to those. For example, a probe could send a packet every 0.1second and monitor how many packets are lost, what is average delay and delayvariation. Email delivery, DNS lookup, and web page requests can be metrics tobe monitored.
?: Who will perform the SLA measurements: customer, provider,or someone else?
Most of SLA measurements are implemented using active probes in networkdevices, separate measurement devices or as a software on client and servercomputers. It is also possible to use passive analysis methods to collect statisticsand build analysis on top of that.
7.4.1 Service (plural services)
Service is:
• An event in which an entity takes the responsibility that something desirablehappens on the behalf of another entity.
• (economics) Action or work that is produced, then traded, bought or sold,then finally consumed.
• (computing) A function that is provided by one program or machine foranother.
• The military.• A set of dishes or utensils.• (sports) The act of initially starting, or serving, the ball in play in tennis,
volleyball, and other games.• A religious rite or ritual.
61
• (law) The serving, or delivery, of a summons or writ.• (public service) that which is provided by the government or its agents• (religion) Doing something for someone else without thought of reward or
payment.
8 Privacy and protection of personal dataAfter Snowden disclosed NSA monitoring, many started to care for their privacymore. Finland has also had case of telephone operator CEO using phone recordsto find out who was leaking information discussed in board meetings to the pressin year 2000.
Different countries have different laws and e.g. relation between employer andemployee or between business and customer vary widely. Something that maybe mandatory in one country may be illegal in another. This text is writtenmostly from Finnish perspective but for many parts it should apply within EU.
The right of privacy and protection of personal data is not an absolute right. Likethe free speech, those rights must be considered in relation to other fundamentalrights should these be in conflict. An example would be aspects of national orUnion security.
8.1 Identification informationThe corner stone in privacy is personal data or identification data. This is datathat can be linked to an individual or household with reasonable effort. If thereare multiple personal data records that are easy to process, it is a personal datafile.21
Personal data must be collected only extent needed and used only for purposethat is compatible with original purpose it was collected for. Use of data forhistorical, scientific, or statistical purposes is permitted.
!: Remember: if you did not collect data at the first place, youcannot lose or disclose it later!
Processing identification data is of course need for many purposes. For example,this is needed to realise services: router must look on IP addresses to forwardpackets. Information security services like firewalls and virus scanners need accessto data. Resolving technical problems, fraud, or misuse22 needs identificationdata. Charging is not possible without revealing the paying party. The otherparty (B-subscriber) is not needed.
21Example: a row of mail boxes with names is not a personal data file because thatinformation is not easy to retrieve. A phone book on the other hand is.
22Misuse must kind of that causes some direct costs or endangers information.
62

Identification information can be used to improve technical implementation orservices. This includes automated statistical analysis as long the final outputdoes not contain any identifiable entities. This includes also scientific research.
Identification data handling has more strict rules if it happens on working place.This is to protect privacy of employee because of the imbalance in relationshipbetween employer and employee.
To summarise how to handle identification data within network operator:
• Only when needed.• Only as much as needed.• Only those whose duties it belongs to.• Handing information over only to those that have right.• Must have an audit trail for two years for any data access to personal data.• Professional discretion must be maintained.
This can be considered as data minimisation: reducing data to minimum suffi-cient.
?: How about user or payload data? Is there a difference ifencrypted connections are used or not?
8.2 Terminology related for data protectionExtract from GDPR
• Personal data means any information relating to an identified or identi-fiable natural person (‘data subject’); an identifiable natural person is onewho can be identified, directly or indirectly, in particular by reference to anidentifier such as a name, an identification number, location data, an onlineidentifier or to one or more factors specific to the physical, physiological,genetic, mental, economic, cultural or social identity of that natural person.
• Processing means any operation or set of operations which is performedon personal data or on sets of personal data, whether or not by auto-mated means, such as collection, recording, organisation, structuring,storage, adaptation or alteration, retrieval, consultation, use, disclosure bytransmission, dissemination or otherwise making available, alignment orcombination, restriction, erasure or destruction.
• Restriction of processing means the marking of stored personal datawith the aim of limiting their processing in the future.
• Profiling means any form of automated processing of personal data con-sisting of the use of personal data to evaluate certain personal aspectsrelating to a natural person, in particular to analyse or predict aspectsconcerning that natural person’s performance at work, economic situation,
63

health, personal preferences, interests, reliability, behaviour, location ormovements.
• Pseudonymisation means the processing of personal data in such amanner that the personal data can no longer be attributed to a specificdata subject without the use of additional information, provided that suchadditional information is kept separately and is subject to technical andorganisational measures to ensure that the personal data are not attributedto an identified or identifiable natural person.
• Filing system means any structured set of personal data which areaccessible according to specific criteria, whether centralised, decentralisedor dispersed on a functional or geographical basis.
• Controller means the natural or legal person, public authority, agency orother body which, alone or jointly with others, determines the purposesand means of the processing of personal data.
• Processor means a natural or legal person, public authority, agency orother body which processes personal data on behalf of the controller.
• Recipient means a natural or legal person, public authority, agency oranother body, to which the personal data are disclosed, whether a thirdparty or not.
• Third party means a natural or legal person, public authority, agency orbody other than the data subject, controller, processor and persons who,under the direct authority of the controller or processor, are authorised toprocess personal data.
• Consent of the data subject means any freely given, specific, informedand unambiguous indication of the data subject’s wishes by which he orshe, by a statement or by a clear affirmative action, signifies agreement tothe processing of personal data relating to him or her.
• Personal data breachmeans a breach of security leading to the accidentalor unlawful destruction, loss, alteration, unauthorised disclosure of, oraccess to, personal data transmitted, stored or otherwise processed.
• Biometric data means personal data resulting from specific technicalprocessing relating to the physical, physiological or behavioural character-istics of a natural person, which allow or confirm the unique identificationof that natural person, such as facial images or dactyloscopic data. Alsoconsider genetic data.
• Data concerning health means personal data related to the physical ormental health of a natural person, including the provision of health careservices, which reveal information about his or her health status.
64
?: Network service provider monitors network and stores IPFIXinformation into database. Network misuse identification isperformed by a contractor. Considering list above, what subjectsexists in this case and in which role?
?: Not all data that is sensitive is personal data. What otherkind of sensitive data there exists?
8.3 Network measurements and identification informationIP addresses can be considered as a personal information. While in many casesthose is randomly allocated and may change for a single device multiple times aday, there are many cases were it can identify a user or household.
?: How often your devices change IP address? You can use ipaddr command on Linux systems (including Android), ipconfigon Windows and ifconfig on MacOS. If you run Nettitutkaauthenticated, you can look on measurements afterwards. Eachmeasurement includes both local and public IP address.
For many types of analysis actual identities are not needed. For some long-timeanalysis it may be useful to know that this user now was the same user yesterday.Having 1:1 mapping between users and identities is useful but IP addresses maynot provide it. This on the other hand carries a risk of disclosure and the datamust be handled as personal data.
The key is then to get rid of any identification information as soon as possible.How anonymisation should be performed depends on kind of analysis wanted.In many cases full anonymisation makes data as useless for analysis as fullyremoving IP addresses. In these cases, pseudonymisation can be used.
When data does not identify a person, it is not anymore identification data. How-ever, it is important to remember that even if data considered to be anonymised,it may still be sensitive. In framework of GDPR also pseudonymous data mustbe considered also as personal data. Disclosure of pseudonymous data must behandled as if actual data was disclosed.
There are basically three different strategies to create pseudonymous identitiesfrom real IP addresses:
1. Random replacement. Each time a new IP address is found, a random IP ad-dress is allocated. In this method no topology information is saved: address192.0.2.1 would map to 10.4.4.5 and 192.0.2.2 to 192.168.254.7.This provides best possible protection of pseudonymous identifiers.
65

2. Prefix-preserving mapping by keeping the upper part of addresses(like 24 bits) unmodified and lower bits are masked. For example192.0.2.1→192.0.2.75 and 192.0.2.2→192.0.2.43. If there are onlyfew users in network, this may result disclosure.
3. Prefix-preserving mapping by anonymising the upper bits. This make tracesanonymous on organisational scale. If organisation (network, i.e. upperbits) is identified then it is possible individual users to be identified. Forexample 192.0.2.1→91.54.1.1 and 192.0.2.2→91.54.1.2.
?: Consider few different kind of analysis from network data.For each to these, is there a difference what of above strategiesis used?
If pseudonymisation is performed once for each batch of data, there is no needto store data further. This will result that the address 192.0.2.1 would firstmap to 172.22.3.4 and on following run to 10.98.76.243 and so forth. If wewant to keep same mapping between data processing runs, the lookup table orrules to generate values must be stored. This table is of course sensitive becauseit would allow reversing identifiers.
8.3.1 Attacks on pseudonymisation
There are many ways to attack on pseudonymisation. The key problem is thatthere are too few IPv4 addresses, too few networks and too few users. Exhaustivesearch is feasible.
?: How IPv6 would change situation if any?
Taken traffic of random IP address, it is usually not possible to determine whosetraffic it is. However, it is often possible to answer opposite: is this IP addressperson X by knowing something a priori about traffic by X. Like what is hernetwork usage pattern.
If very little is known about traffic but the IP address23 of the user is known,one can create traffic that will help identifying user.
By sending packets by using a defined temporal process or other mechanismmaking it possible to later identify packets from anonymised trace, a disclosercan learn it’s own IP address and IP addresses of A, B, and C. In security termsthis is a covert channel used to disclosure sensitive information.
Using suitable external information, pseudonymisation schemes can be broken.This information may be almost anything. For this reason, GDPR considers in
23For example, if the user has visited discussion forum administered by the attacker or IPaddress is revealed with tracker image in email
66
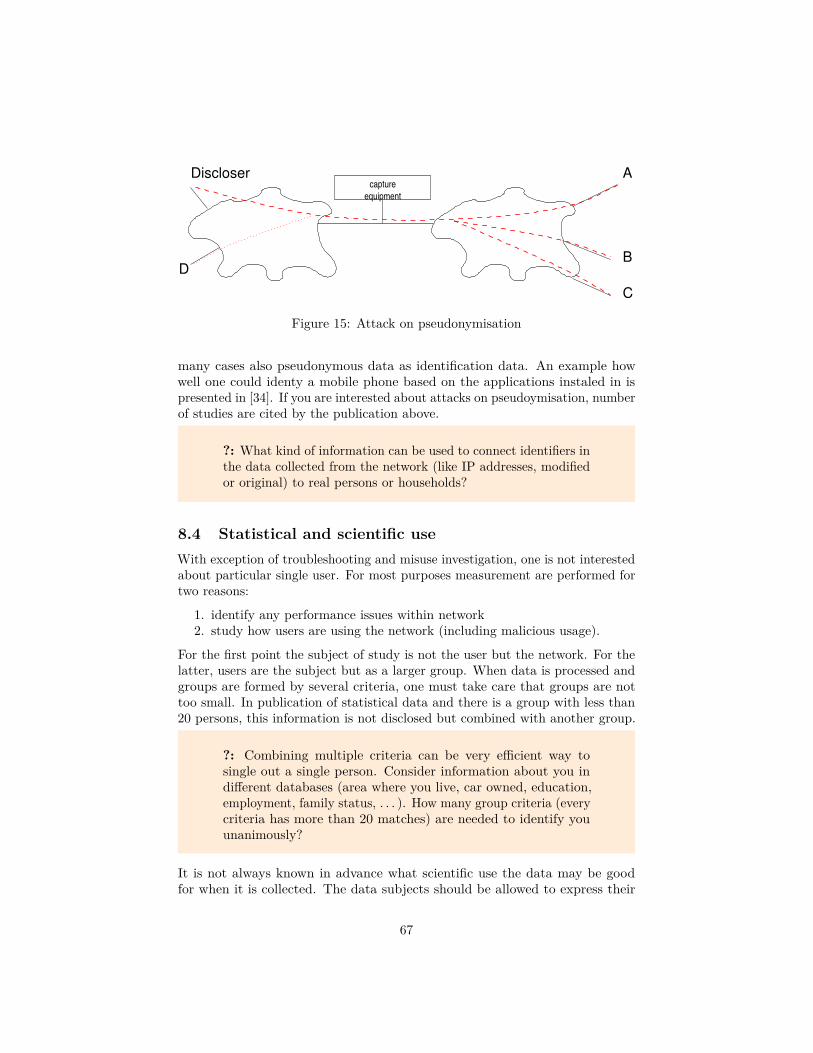
capture
equipment
Discloser
D
A
B
C
Figure 15: Attack on pseudonymisation
many cases also pseudonymous data as identification data. An example howwell one could identy a mobile phone based on the applications instaled in ispresented in [34]. If you are interested about attacks on pseudoymisation, numberof studies are cited by the publication above.
?: What kind of information can be used to connect identifiers inthe data collected from the network (like IP addresses, modifiedor original) to real persons or households?
8.4 Statistical and scientific useWith exception of troubleshooting and misuse investigation, one is not interestedabout particular single user. For most purposes measurement are performed fortwo reasons:
1. identify any performance issues within network2. study how users are using the network (including malicious usage).
For the first point the subject of study is not the user but the network. For thelatter, users are the subject but as a larger group. When data is processed andgroups are formed by several criteria, one must take care that groups are nottoo small. In publication of statistical data and there is a group with less than20 persons, this information is not disclosed but combined with another group.
?: Combining multiple criteria can be very efficient way tosingle out a single person. Consider information about you indifferent databases (area where you live, car owned, education,employment, family status, . . . ). How many group criteria (everycriteria has more than 20 matches) are needed to identify youunanimously?
It is not always known in advance what scientific use the data may be goodfor when it is collected. The data subjects should be allowed to express their
67
permission for the area of study. A person may have positive view on some areaof science and negative for another.
8.5 Safeguarding dataConsequences of data breach can be significant. The GDPR allows upto 20million euros24 administrative fine assigned to a company that fails to protectpersonal information. This gives a good incentive for organisations to keep datasecured. Furthermore, the company must notify supervisory authority latest 72hours after incident has been identified. Also data subjects need to be notifiedin many cases.
Breaches cannot be avoided. Even major companies that audit other companieshave failed as victims of data breaches, often resulting from poor oversightor cutting corners. However, efforts the organisation has put into protectinginformation and reducing damage caused by data leak would count as advantagefor organisation.
Of course, there exists yet not legal cases against any company (as Directiveentered into force in May 2018) were fine would be assigned. A decision regardingWhois data was made by a German court but there was no fine assigned. Itcan be assumed that penalty fee is limited in case organisation has followed andexceeded the industry standard safe-guards. Data protection certificates, sealsand other marks can be used to demonstrate compliance to data subjects butalso to supervisory authority.
?: Look for data protection seals and certificates. What kind ofaudits and tests they perform?
An organisation that has significant personal data processing, must appoint dataprotection officer. Her role is to provide guidance to controller or processorregarding to their obligations, monitor compliance, provide advice on dataprotection impact assessment and to co-operate with supervisory authority.She can be employed by the controller or by processor but position must beindependent and able to report to high management without fear of retaliation.She cannot be fired for performing her duties.
Regulations include rules how personal data can be transferred outside of EU toa third nation. How easy it is depends very much of level of privacy protectionin that nation.
?: What kind of aspects would be related to subcontracting andadministrating systems from non-EU nation?
24Or 4% of annual turnover if larger.
68

9 References[1] Q. Zhang, V. Liu, H. Zeng, and A. Krishnamurthy, “High-resolution mea-surement of data center microbursts,” in Proceedings of the 2017 Internet Mea-surement Conference, 2017, pp. 78–85.
[2] R. Teixeira, A. Shaikh, T. Griffin, and J. Rexford, “Dynamics of hot-potatorouting in IP networks,” in ACM SIGMETRICS Performance Evaluation Review,2004, vol. 32, pp. 307–319.
[3] J. Postel, “Internet Control Message Protocol.” RFC Editor; RFC Editor;RFC 792 (Internet Standard); RFC Editor, Fremont, CA, USA, pp. 1–21,Sep-1981.
[4] S. Shalunov, B. Teitelbaum, A. Karp, J. Boote, and M. Zekauskas, “A One-way Active Measurement Protocol (OWAMP).” RFC Editor; RFC Editor; RFC4656 (Proposed Standard); RFC Editor, Fremont, CA, USA, pp. 1–56, Sep-2006.
[5] K. Hedayat, R. Krzanowski, A. Morton, K. Yum, and J. Babiarz, “A Two-WayActive Measurement Protocol (TWAMP).” RFC Editor; RFC Editor; RFC 5357(Proposed Standard); RFC Editor, Fremont, CA, USA, pp. 1–26, Oct-2008.
[6] S. Bradner and J. McQuaid, “Benchmarking Methodology for NetworkInterconnect Devices.” RFC Editor; RFC Editor; RFC 2544 (Informational);RFC Editor, Fremont, CA, USA, pp. 1–31, Mar-1999.
[7] J. Mahdavi and V. Paxson, “IPPM Metrics for Measuring Connectivity.” RFCEditor; RFC Editor; RFC 2678 (Proposed Standard); RFC Editor, Fremont,CA, USA, pp. 1–10, Sep-1999.
[8] G. Almes, S. Kalidindi, and M. Zekauskas, “A One-way Delay Metric forIPPM.” RFC Editor; RFC Editor; RFC 2679 (Proposed Standard); RFC Editor,Fremont, CA, USA, pp. 1–20, Sep-1999.
[9] G. Almes, S. Kalidindi, and M. Zekauskas, “A One-way Packet Loss Metricfor IPPM.” RFC Editor; RFC Editor; RFC 2680 (Proposed Standard); RFCEditor, Fremont, CA, USA, pp. 1–15, Sep-1999.
[10] G. Almes, S. Kalidindi, and M. Zekauskas, “A Round-trip Delay Metric forIPPM.” RFC Editor; RFC Editor; RFC 2681 (Proposed Standard); RFC Editor,Fremont, CA, USA, pp. 1–20, Sep-1999.
[11] C. Demichelis and P. Chimento, “IP Packet Delay Variation Metric for IPPerformance Metrics (IPPM).” RFC Editor; RFC Editor; RFC 3393 (ProposedStandard); RFC Editor, Fremont, CA, USA, pp. 1–21, Nov-2002.
[12] R. Koodli and R. Ravikanth, “One-way Loss Pattern Sample Metrics.” RFCEditor; RFC Editor; RFC 3357 (Informational); RFC Editor, Fremont, CA,USA, pp. 1–15, Aug-2002.
[13] A. Morton, L. Ciavattone, G. Ramachandran, S. Shalunov, and J. Perser,“Packet Reordering Metrics.” RFC Editor; RFC Editor; RFC 4737 (Proposed
69
Standard); RFC Editor, Fremont, CA, USA, pp. 1–45, Nov-2006.
[14] H. Uijterwaal, “A One-Way Packet Duplication Metric.” RFC Editor; RFCEditor; RFC 5560 (Proposed Standard); RFC Editor, Fremont, CA, USA, pp.1–14, May-2009.
[15] M. Mathis and M. Allman, “A Framework for Defining Empirical BulkTransfer Capacity Metrics.” RFC Editor; RFC Editor; RFC 3148 (Informational);RFC Editor, Fremont, CA, USA, pp. 1–16, Jul-2001.
[16] V. Raisanen, G. Grotefeld, and A. Morton, “Network performance measure-ment with periodic streams.” RFC Editor; RFC Editor; RFC 3432 (ProposedStandard); RFC Editor, Fremont, CA, USA, pp. 1–23, Nov-2002.
[17] P. Chimento and J. Ishac, “Defining Network Capacity.” RFC Editor; RFCEditor; RFC 5136 (Informational); RFC Editor, Fremont, CA, USA, pp. 1–14,Feb-2008.
[18] R. L. Carter and M. E. Crovella, “Measuring bottleneck link speed inpacket-switched networks,” Performance evaluation, vol. 27, pp. 297–318, 1996.
[19] V. Jacobson, “Pathchar: How to Infer the Characteristics of Internet Paths.”Lecture at Mathematical Sciences Research Institute, Apr-1997.
[20] R. Prasad, C. Dovrolis, M. Murray, and K. Claffy, “Bandwidth estimation:metrics, measurement techniques, and tools,” IEEE network, vol. 17, no. 6, pp.27–35, 2003.
[21] N. Hu and P. Steenkiste, “Evaluation and characterization of available band-width probing techniques,” IEEE journal on Selected Areas in Communications,vol. 21, no. 6, pp. 879–894, 2003.
[22] E. Dahlman, B. Gudmundson, M. Nilsson, and A. Skold, “UMTS/IMT-2000based on wideband CDMA,” IEEE Communications magazine, vol. 36, no. 9,pp. 70–80, 1998.
[23] B. C. (Ed.), B. T. (Ed.), and P. Aitken, “Specification of the IP FlowInformation Export (IPFIX) Protocol for the Exchange of Flow Information.”RFC Editor; RFC Editor; RFC 7011 (Internet Standard); RFC Editor, Fremont,CA, USA, pp. 1–76, Sep-2013.
[24] T. Zseby, M. Molina, N. Duffield, S. Niccolini, and F. Raspall, “Samplingand Filtering Techniques for IP Packet Selection.” RFC Editor; RFC Editor;RFC 5475 (Proposed Standard); RFC Editor, Fremont, CA, USA, pp. 1–46,Mar-2009.
[25] S. Amante, B. Carpenter, S. Jiang, and J. Rajahalme, “IPv6 Flow LabelSpecification.” RFC Editor; RFC Editor; RFC 6437 (Proposed Standard); RFCEditor, Fremont, CA, USA, pp. 1–15, Nov-2011.
[26] D. Eastlake 3rd and T. Hansen, “US Secure Hash Algorithms (SHA and SHA-based HMAC and HKDF).” RFC Editor; RFC Editor; RFC 6234 (Informational);
70
RFC Editor, Fremont, CA, USA, pp. 1–127, May-2011.
[27] M. H. Bhuyan, D. K. Bhattacharyya, and J. K. Kalita, “Network AnomalyDetection: Methods, Systems and Tools,” IEEE Communications Surveys Tuto-rials, vol. 16, no. 1, pp. 303–336, 2014.
[28] “Network performance objectives for IP-Based services,” InternationalTelecommunication Union, ITU-T Recommendation Y.1541, 2002.
[29] P. Bardy, “A Statistical analysis of on-off patterns in 16 conversations,” TheBell System Technical Journal, vol. 47, pp. 73–91, Jan. 1968.
[30] J. Nielsen, Usability Engineering. Boston: AP Professional, 1993.
[31] D. Mills, “Network Time Protocol (Version 3) Specification, Implementationand Analysis.” RFC Editor; RFC Editor; RFC 1305 (Draft Standard); RFCEditor, Fremont, CA, USA, pp. 1–109, Mar-1992.
[32] “Ethernet service activation test methodology,” International Telecommuni-cation Union, ITU-T Recommendation Y-1564, 2011.
[33] R. Shirey, “Internet Security Glossary.” RFC Editor; RFC Editor; RFC2828 (Informational); RFC Editor, Fremont, CA, USA, pp. 1–212, May-2000.
[34] V. Sekara, E. Mones, and H. Jonsson, “Temporal Limits of Privacy inHuman Behavior.” 2018.
71