elater ferrugineus and osmoderma eremita, a regional...
TRANSCRIPT
Fakulteten för landskapsplanering, trädgårds- och jordbruksvetenskap
Område Växtskyddsbiologi
Elater ferrugineus and Osmoderma eremita, a regional survey and habitat requirements on different landscape scales Elater ferrugineus och Osmoderma eremita, en regional inventering och habitatkrav på olika landskapsskalor Benjamin Forsmark
Självständigt arbete vid LTJ-fakulteten, SLU Kandidatarbete 15 HP, Alnarp 2012
Elater ferrugineus and Osmoderma eremita, a regional survey and habitat requirements on different landscape scales [Elater ferrugineus och Osmoderma eremita, en regional inventering och habitatkrav på olika landskapsskalor] Benjamin Forsmark Handledare: Mattias Larsson, SLU, Område Växtskyddsbiologi Btr handledare: Per Milberg, Linköpings Universitet, Institutionen för Fysik, Kemi och Biologi
Joseph Burman, SLU, Område Växtskyddsbiologi Examinator: Mats Gyllin, SLU, Område Landskapsplanering Kurstitel: Kandidatarbete inom hortonomprogrammet Kurskod: EX0493 Omfattning: 15 hp Nivå och fördjupning: G2E
Program/utbildning: Fristående Examen: Ämne: Biologi Serienamn: Självständigt arbete vid LTJ-fakulteten, SLU Utgivningsort: Alnarp Utgivningsmånad och -år: mars 2012 Elektronisk publicering: http://stud.epsilon.slu.se
Omslagsbild: Fotografi: Benjamin Forsmark Nyckelord: Landscape Ecology, Saproxylic, Conservation, Coleoptera, Hollow Tree, Habitat, Fragmentation Landskapsekologi, Saproxylisk, Bevarandebiologi, Coleoptera, Hålträd, Habitat, Fragmentering SLU, Sveriges lantbruksuniversitet Fakulteten för Landskapsplanering, trädgårds- och jordbruksvetenskap Område Växtskyddsbiologi
1
Index Index...................................................................................................................................................... 1
Introduction ....................................................................................................................................... 2
Materials and methods ................................................................................................................... 5 Model Species ............................................................................................................................................... 5 Giant tree database ..................................................................................................................................... 9 Study area and field sites.......................................................................................................................... 9 Field trapping ............................................................................................................................................ 10 Habitat factors ........................................................................................................................................... 12 Landscape analysis .................................................................................................................................. 15
Result ................................................................................................................................................. 17 Captures of E. ferrugineus ..................................................................................................................... 17 Captures of O. eremita ............................................................................................................................ 19 Distribution of E. ferrugineus and O. eremita ................................................................................. 21 Landscape analysis .................................................................................................................................. 23
Discussion ........................................................................................................................................ 26 General ......................................................................................................................................................... 26 Landscape analysis interpretation .................................................................................................... 27 The use of the giant tree dataset ......................................................................................................... 29 Statistics....................................................................................................................................................... 30 Indicator species ...................................................................................................................................... 31 Implications for conservation ............................................................................................................. 32
Acknowledgements ....................................................................................................................... 33
Appendix ........................................................................................................................................... 34
References ........................................................................................................................................ 35
Abstract Habitat destruction and fragmentation is the primary cause behind loss of biodiversity. Population dynamics are affected by factors that act on different spatial scales. To direct nature management efforts, the impact of different factors and at which spatial scale they act needs to be taken into consideration. Elater ferrugineus and Osmoderma eremita are rare and threatened (red listed over their entire distribution range) saproxylic beetles associated with hollow deciduous trees. In the present thesis, these beetles have been surveyed using pheromone baited traps at 83 localities in Skåne. A multiscale analysis has been performed testing occupancy data for E. ferrugineus against densities of resources of different sorts of trees. This analysis stresses the requirements of E. ferrugineus for large non-fragmented areas with high densities of giant trees. Few localities match its requirements, and only eight resident populations appear to persist in Skåne. Four previously unknown localities for E. ferrugineus and two novel localities for O. eremita have been revealed in this thesis.
2
Introduction Biodiversity is severely threatened by landscape changes. Habitat destruction is the major cause behind loss of biodiversity (Hannah 1995). Insects constitute a big part of overall biodiversity and respond rapidly to environmental changes. This makes them vulnerable to all sorts of habitat destruction and habitat degradation (Thomas et al. 2004). Many species, known as saproxylic, are involved in the decay and decomposition processes of trees and dead wood. Dead wood is the base of diverse ecosystems with highly adapted organisms, from those feeding directly from the living or newly dead wood all the way up to top predators such as woodpeckers. In Sweden, 12% of the multicellular organisms are dependent on dead wood at some phase of their life cycle (Dahlberg et al. 2004). Among these, a highly specialized fauna is associated with old-growth decidous trees. When trees age, different structures are formed, including tree hollows containing a loose substrate of fungal infested wood mixed with fragments and excrements of inhabiting organisms. This substrate, the wood mould, is essential for a variety of species. Only within the beetles (order Coleoptera), as many as a thousand Swedish species depend on this substrate (Niklasson 2005). Among saproxylic beetles, about 200 species are red listed in Sweden (Antonsson 2001a). Protection of remnant old-growth forests hence has high priority in nature conservation. Among beetles associated with wood mould in hollow deciduous trees, the click beetle Elater ferrugineus (Linnaeus, 1758) and the scarab beetle Osmoderma eremita (Scopoli, 1763) studied in this thesis are demanding species which frequently co-occur. Ranius et al. (2001) and Ranius (2002b) concluded that these beetles are seriously affected by habitat fragmentation. Both species are red listed all over their global distribution range (Nieto et al. 2010). The strong association with old-growth decidous trees makes O. eremita useful as an indicator of primeval forest continuity (Ranius 2002b; Jansson et al. 2009a). For E. ferrugineus, the same has been assumed, but the difficulty of detecting it has made it hard to study (Nilsson et al. 1994; Svensson et al. 2004). Their strict habitat requirements make it possible to consider them as umbrella species for a guild of saproxylic invertebrates associated with hollow deciduous trees. In a nature preservation context, findings of beetles with these properties give strong arguments to protect the areas where they have been found. Until the 18th century, deciduous forests with old-growth characteristics were common in southern Sweden and all over Europe. Since then, rationalization in agriculture and forestry has led to a severe decline in the extent of these forests. A great deal of biodiversity has been lost in this process (Hannah 1995; Eliasson et al. 1999). Today, the distribution of these habitats has mainly retreated to larger estates and parks where the inhabiting fauna has found a refuge. As these remaining refuges are aging, the viable substrate of the beetles in the present study is declining. In the last decades, greater attention has been given to the importance of large, hollow trees in the landscape. Efforts are being made to identify and protect existing hollow trees with valuable saproxylic fauna. Over a longer time frame, the aim for conservation efforts must be to
3
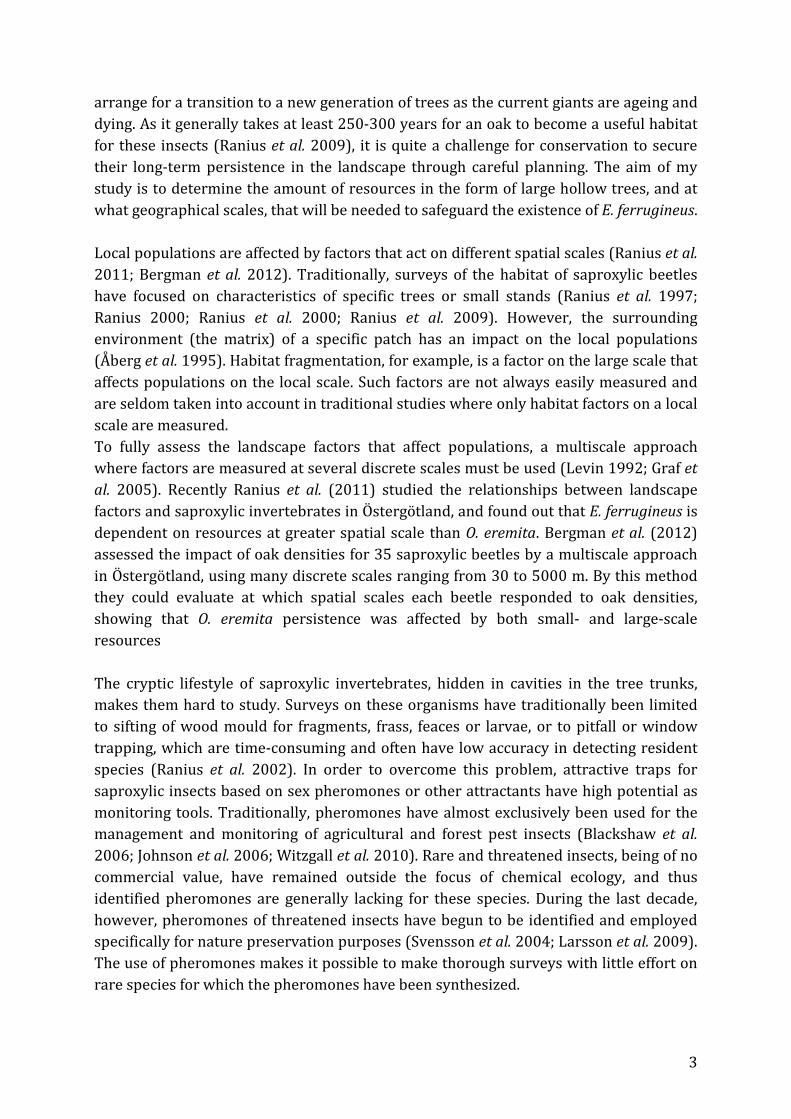
arrange for a transition to a new generation of trees as the current giants are ageing and dying. As it generally takes at least 250-300 years for an oak to become a useful habitat for these insects (Ranius et al. 2009), it is quite a challenge for conservation to secure their long-term persistence in the landscape through careful planning. The aim of my study is to determine the amount of resources in the form of large hollow trees, and at what geographical scales, that will be needed to safeguard the existence of E. ferrugineus. Local populations are affected by factors that act on different spatial scales (Ranius et al. 2011; Bergman et al. 2012). Traditionally, surveys of the habitat of saproxylic beetles have focused on characteristics of specific trees or small stands (Ranius et al. 1997; Ranius 2000; Ranius et al. 2000; Ranius et al. 2009). However, the surrounding environment (the matrix) of a specific patch has an impact on the local populations (Åberg et al. 1995). Habitat fragmentation, for example, is a factor on the large scale that affects populations on the local scale. Such factors are not always easily measured and are seldom taken into account in traditional studies where only habitat factors on a local scale are measured. To fully assess the landscape factors that affect populations, a multiscale approach where factors are measured at several discrete scales must be used (Levin 1992; Graf et al. 2005). Recently Ranius et al. (2011) studied the relationships between landscape factors and saproxylic invertebrates in Östergötland, and found out that E. ferrugineus is dependent on resources at greater spatial scale than O. eremita. Bergman et al. (2012) assessed the impact of oak densities for 35 saproxylic beetles by a multiscale approach in Östergötland, using many discrete scales ranging from 30 to 5000 m. By this method they could evaluate at which spatial scales each beetle responded to oak densities, showing that O. eremita persistence was affected by both small- and large-scale resources The cryptic lifestyle of saproxylic invertebrates, hidden in cavities in the tree trunks, makes them hard to study. Surveys on these organisms have traditionally been limited to sifting of wood mould for fragments, frass, feaces or larvae, or to pitfall or window trapping, which are time-consuming and often have low accuracy in detecting resident species (Ranius et al. 2002). In order to overcome this problem, attractive traps for saproxylic insects based on sex pheromones or other attractants have high potential as monitoring tools. Traditionally, pheromones have almost exclusively been used for the management and monitoring of agricultural and forest pest insects (Blackshaw et al. 2006; Johnson et al. 2006; Witzgall et al. 2010). Rare and threatened insects, being of no commercial value, have remained outside the focus of chemical ecology, and thus identified pheromones are generally lacking for these species. During the last decade, however, pheromones of threatened insects have begun to be identified and employed specifically for nature preservation purposes (Svensson et al. 2004; Larsson et al. 2009). The use of pheromones makes it possible to make thorough surveys with little effort on rare species for which the pheromones have been synthesized.
4
In this thesis, I have used pheromone-baited traps to screen the landscape in virtually the entire province of Skåne for the presence of E. ferrugineus and O. eremita at a large number of sites with hollow trees. The purpose has been to map the recent distribution of the beetles in the landscape and contribute valuable occupancy data and a landscape analysis for conservation and management purposes. O. eremita is normally regarded as a very demanding species in this type of habitat, although E. ferrugineus likely has stricter habitat requirements based on its comparative rarity. I have performed an analysis comparing occupancy data and evaluated the relationship between the two model species. Furthermore, I have characterized the habitat requirements in terms of hollow tree resources necessary for persistence of E. ferrugineus at different spatial scales. This analysis aims to reveal the beetles’ spatial scale of response to its environment, and how it is influenced by the extreme patchiness of habitat resources that is characteristic of the Scanian landscape.
5
Materials and methods
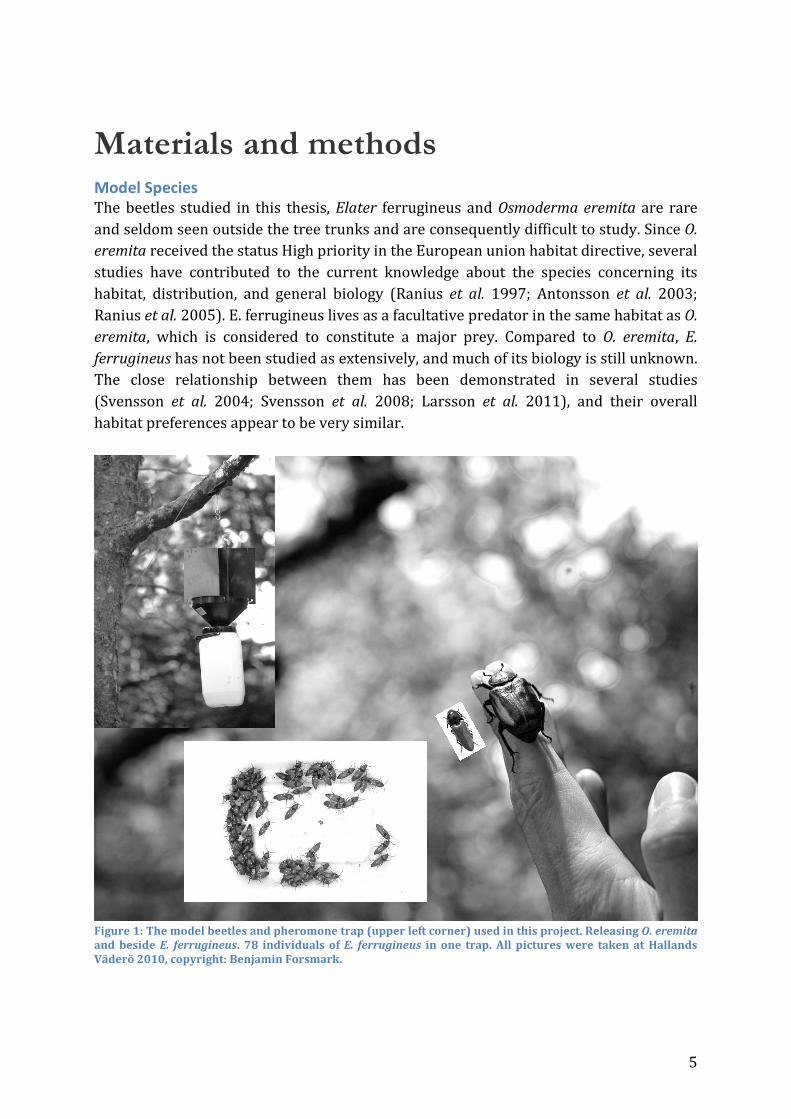
Model Species The beetles studied in this thesis, Elater ferrugineus and Osmoderma eremita are rare and seldom seen outside the tree trunks and are consequently difficult to study. Since O. eremita received the status High priority in the European union habitat directive, several studies have contributed to the current knowledge about the species concerning its habitat, distribution, and general biology (Ranius et al. 1997; Antonsson et al. 2003; Ranius et al. 2005). E. ferrugineus lives as a facultative predator in the same habitat as O. eremita, which is considered to constitute a major prey. Compared to O. eremita, E. ferrugineus has not been studied as extensively, and much of its biology is still unknown. The close relationship between them has been demonstrated in several studies (Svensson et al. 2004; Svensson et al. 2008; Larsson et al. 2011), and their overall habitat preferences appear to be very similar.
Figure 1: The model beetles and pheromone trap (upper left corner) used in this project. Releasing O. eremita and beside E. ferrugineus. 78 individuals of E. ferrugineus in one trap. All pictures were taken at Hallands Väderö 2010, copyright: Benjamin Forsmark.
6
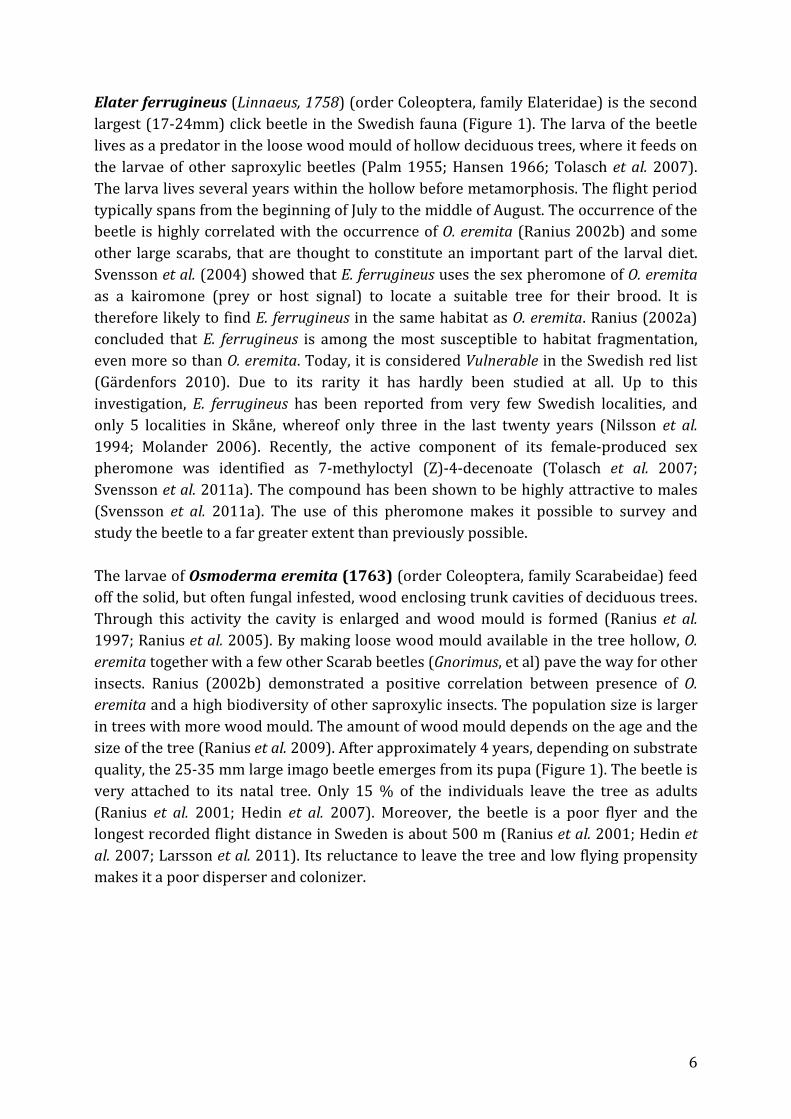
Elater ferrugineus (Linnaeus, 1758) (order Coleoptera, family Elateridae) is the second largest (17-24mm) click beetle in the Swedish fauna (Figure 1). The larva of the beetle lives as a predator in the loose wood mould of hollow deciduous trees, where it feeds on the larvae of other saproxylic beetles (Palm 1955; Hansen 1966; Tolasch et al. 2007). The larva lives several years within the hollow before metamorphosis. The flight period typically spans from the beginning of July to the middle of August. The occurrence of the beetle is highly correlated with the occurrence of O. eremita (Ranius 2002b) and some other large scarabs, that are thought to constitute an important part of the larval diet. Svensson et al. (2004) showed that E. ferrugineus uses the sex pheromone of O. eremita as a kairomone (prey or host signal) to locate a suitable tree for their brood. It is therefore likely to find E. ferrugineus in the same habitat as O. eremita. Ranius (2002a) concluded that E. ferrugineus is among the most susceptible to habitat fragmentation, even more so than O. eremita. Today, it is considered Vulnerable in the Swedish red list (Gärdenfors 2010). Due to its rarity it has hardly been studied at all. Up to this investigation, E. ferrugineus has been reported from very few Swedish localities, and only 5 localities in Skåne, whereof only three in the last twenty years (Nilsson et al. 1994; Molander 2006). Recently, the active component of its female-produced sex pheromone was identified as 7-methyloctyl (Z)-4-decenoate (Tolasch et al. 2007; Svensson et al. 2011a). The compound has been shown to be highly attractive to males (Svensson et al. 2011a). The use of this pheromone makes it possible to survey and study the beetle to a far greater extent than previously possible. The larvae of Osmoderma eremita (1763) (order Coleoptera, family Scarabeidae) feed off the solid, but often fungal infested, wood enclosing trunk cavities of deciduous trees. Through this activity the cavity is enlarged and wood mould is formed (Ranius et al. 1997; Ranius et al. 2005). By making loose wood mould available in the tree hollow, O. eremita together with a few other Scarab beetles (Gnorimus, et al) pave the way for other insects. Ranius (2002b) demonstrated a positive correlation between presence of O. eremita and a high biodiversity of other saproxylic insects. The population size is larger in trees with more wood mould. The amount of wood mould depends on the age and the size of the tree (Ranius et al. 2009). After approximately 4 years, depending on substrate quality, the 25-35 mm large imago beetle emerges from its pupa (Figure 1). The beetle is very attached to its natal tree. Only 15 % of the individuals leave the tree as adults (Ranius et al. 2001; Hedin et al. 2007). Moreover, the beetle is a poor flyer and the longest recorded flight distance in Sweden is about 500 m (Ranius et al. 2001; Hedin et al. 2007; Larsson et al. 2011). Its reluctance to leave the tree and low flying propensity makes it a poor disperser and colonizer.
7
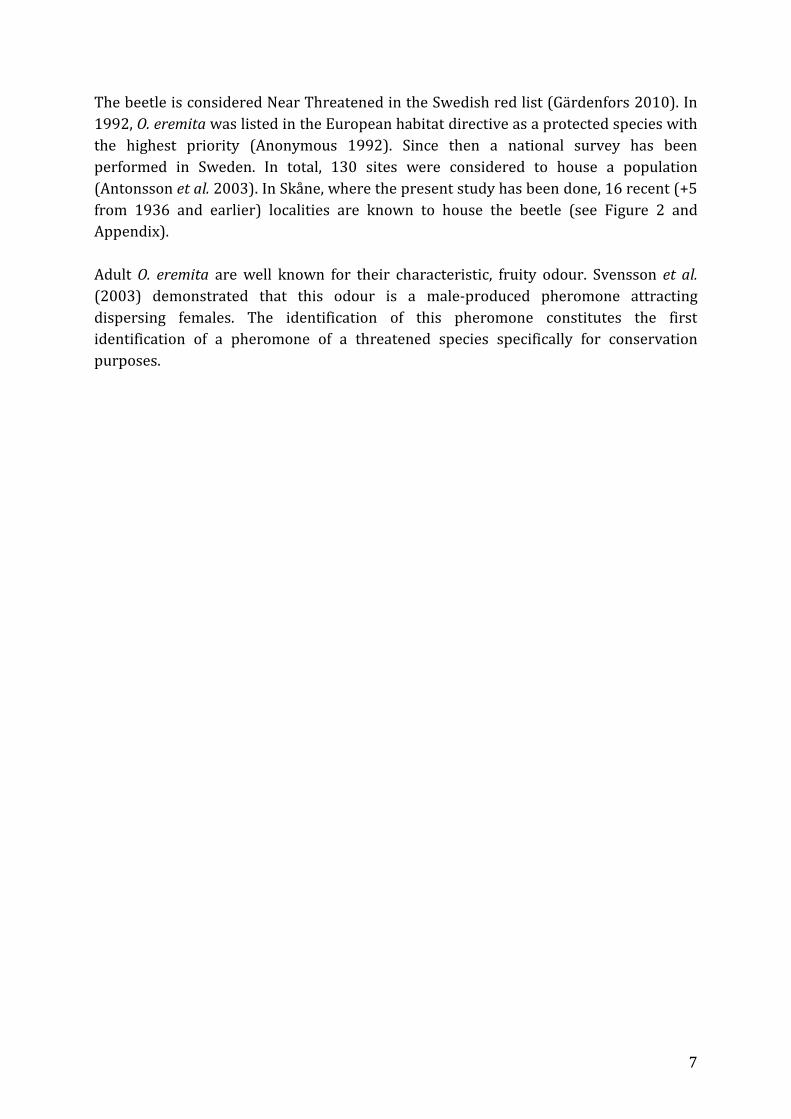
The beetle is considered Near Threatened in the Swedish red list (Gärdenfors 2010). In 1992, O. eremita was listed in the European habitat directive as a protected species with the highest priority (Anonymous 1992). Since then a national survey has been performed in Sweden. In total, 130 sites were considered to house a population (Antonsson et al. 2003). In Skåne, where the present study has been done, 16 recent (+5 from 1936 and earlier) localities are known to house the beetle (see Figure 2 and Appendix). Adult O. eremita are well known for their characteristic, fruity odour. Svensson et al. (2003) demonstrated that this odour is a male-produced pheromone attracting dispersing females. The identification of this pheromone constitutes the first identification of a pheromone of a threatened species specifically for conservation purposes.
8
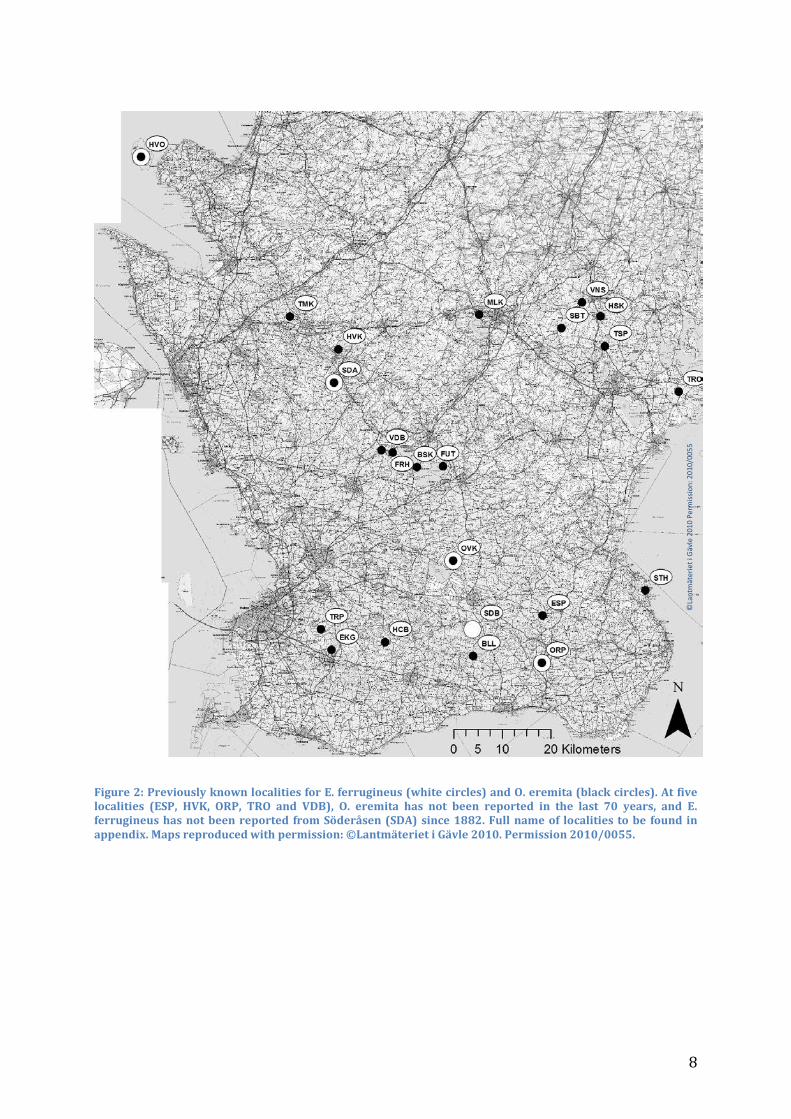
Figure 2: Previously known localities for E. ferrugineus (white circles) and O. eremita (black circles). At five localities (ESP, HVK, ORP, TRO and VDB), O. eremita has not been reported in the last 70 years, and E. ferrugineus has not been reported from Söderåsen (SDA) since 1882. Full name of localities to be found in appendix. Maps reproduced with permission: ©Lantmäteriet i Gävle 2010. Permission 2010/0055.
©La
ntm
äter
iet i
Gäv
le 2
010
Perm
issi
on: 2
010/
0055
9
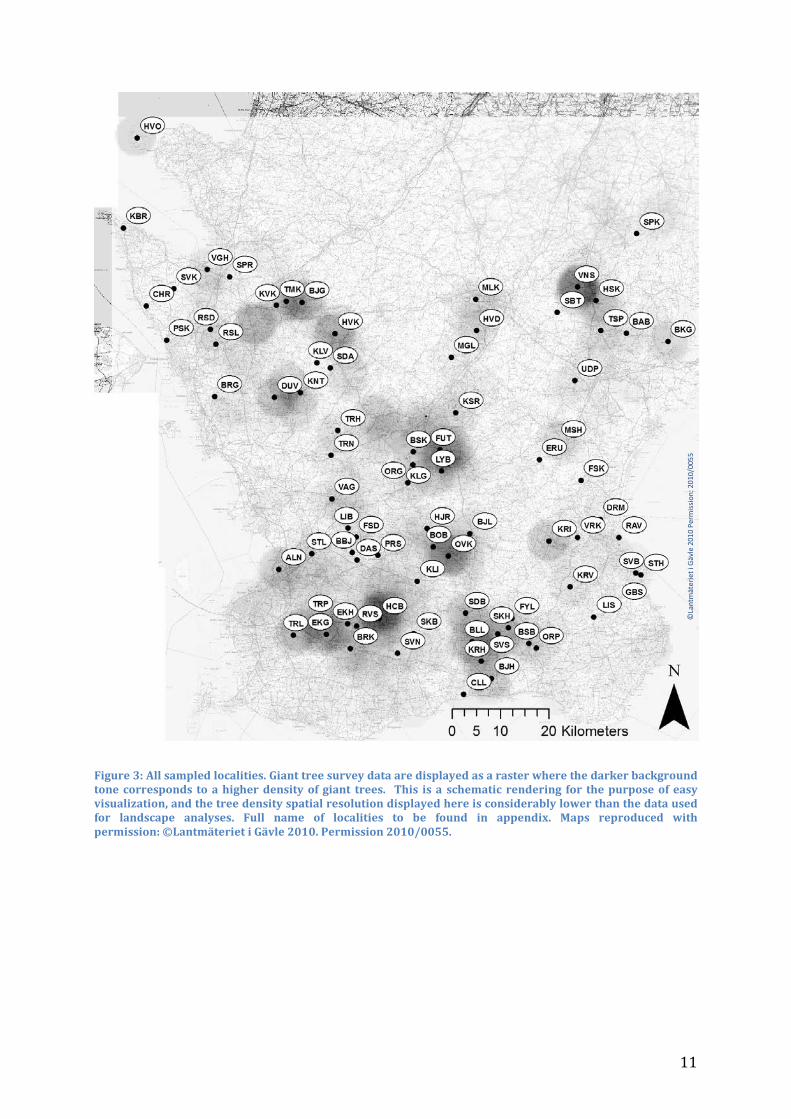
Giant tree database During 2002 to 2009, surveys of giant trees have been performed in the county of Skåne. The purpose has been to map the distribution of suitable habitat for saproxylic fauna. Parts of the survey have been performed by the nature preservation agency (naturskyddsföreningen) and certain municipalities. However, most of the surveys have been performed by the county administrative board of Skåne, who also has compiled and provided me with the dataset. In this project, the dataset was initially used to locate sites potentially constituting a suitable habitat for the species in question. For the spatial analysis the dataset was divided into different characteristics and reorganized into densities at varying spatial scale from each site (see Habitat factors). 56,000 trees of 64 species, including subspecies and exotic trees have been mapped. However, a few species constitute the majority of the material. The two dominating species are oaks and beeches contributing 21,500 and 12,000 trees each. In most cases, data on tree species, diameter, occurrence of hollows and spatial localization (coordinates) has been collected for each tree. In a few cases, extensive data deficits were found in the tree data, and sites affected by this had to be excluded in the spatial analysis. For the purpose of visualizing the density of giant trees in different areas of Skåne, the tree dataset was converted into a raster using the ArcGIS “point to raster - conversion tool” (Figure 3).
Study area and field sites The present study has been performed in the county of Skåne, the southernmost region of Sweden. The studied area covers approximately 11’000 km2. The region is highly affected by anthropogenic activities. With dominance in the northern part, only 30% of the region is forested (Brunet 2005). Since most parts of these forests are subject to active forestry, trees rarely grow old and form the substrates essential to saproxylic fauna. Only a fraction of these forests are habitable for the beetles. A habitable forest has to be old and not too dense. To cope with the climate, sun-exposed stems are considered to be of particular importance. These are found in sparse woodland and cattle pastures where grazing cattle kept the landscape open. These are of the highest interest for saproxylic fauna (Ranius et al. 2000). An array of localities with varying qualities for saproxylic fauna has been surveyed. In total, 83 localities were sampled during the field seasons (summer) 2010 and 2011 (Figure 3). The surveyed sites cover a spectrum of dead wood habitats of varying size, age and tree species composition. All localities (Nilsson et al. 1994; Antonsson et al. 2003; Molander 2006) where either E. ferrugineus or O. eremita been recorded from 1851 and forth has been sampled, with exception for four localities where neither beetle been observed during the last century and where the habitat has been ddestroyed. All data were not collected within the timeframe of this thesis, but to a great extent originate in previous surveys (field season 2010 and 2011) where I collected data for other experimental purposes.
10
Field trapping At each locality, beetles were sampled by the use of one or several pheromone baited funnel traps (Svensson et al. 2008) (Figure 1). The trap is constructed from two black plastic discs intersected over a funnel to a plastic jar. The trap mimics a tree hollow and the pheromone lures the beetles to fly into it, and fall down in the plastic jar where it is kept alive until the trap is emptied and the beetle released. Each trap was baited with 500 µl of neat, racemic gamma-decalactone, the male-produced sex pheromone of O. eremita (Svensson et al. 2004; Svensson et al. 2008). The O. eremita pheromone was loaded in a 4 ml-glass vial with a dental roll as a wick to disperse the pheromone in copious amounts. In parallel, the trap was baited with 2 µl of neat, single-component, female-produced sex pheromone of E. ferrugineus (Tolasch et al. 2007; Larsson et al. 2011) loaded in a PCR tube pierced with an insect pin size 3 to release the pheromone. The trap was hung from a branch in a suitable tree in a position as central as possible in the stand. In a few cases, the central point was not possible to reach due to landowners’ restrictions or landscape barriers etc.; then the trap had to be placed in a more peripheral position in the stand. In a few cases more than one trap were put up at each locality. In most cases, this was done to get appropriate coverage at large localities. At five localities: Torup (TRP), Snogeholm (SNH), Sövdeborg (SDB), Örup (ORP), Övedskloster (OVK) during 2010, trapping was partly performed for the purpose of mark-recapture experiments (compare Larsson et al. (2011) and Svensson et al. (2011b)). In these trials, between eight and fourteen traps were active at the time. Closely situated traps compete for captures. This leads to a smaller average capture rate at these localities. The distance between traps at different localities is at least two kilometers and at these distances, competition will not be a problem (Larsson et al. unpublished). Traps were put up during June and then left out to the end of August. In some cases, trapping at individual localities was terminated when enough individuals of the target species were captured to indicate the presence of a local population. In other cases, traps were repeatedly removed and replaced as part of a mark-recapture scheme, thus shortening the total time that active traps were present. For the purpose of comparing trap effort, the capture period has been calculated as the time a trap has been active (in place and baited) during the flight period of the beetles.
11
Figure 3: All sampled localities. Giant tree survey data are displayed as a raster where the darker background tone corresponds to a higher density of giant trees. This is a schematic rendering for the purpose of easy visualization, and the tree density spatial resolution displayed here is considerably lower than the data used for landscape analyses. Full name of localities to be found in appendix. Maps reproduced with permission: ©Lantmäteriet i Gävle 2010. Permission 2010/0055.
©La
ntm
äter
iet i
Gäv
le 2
010
Perm
issi
on: 2
010/
0055
12
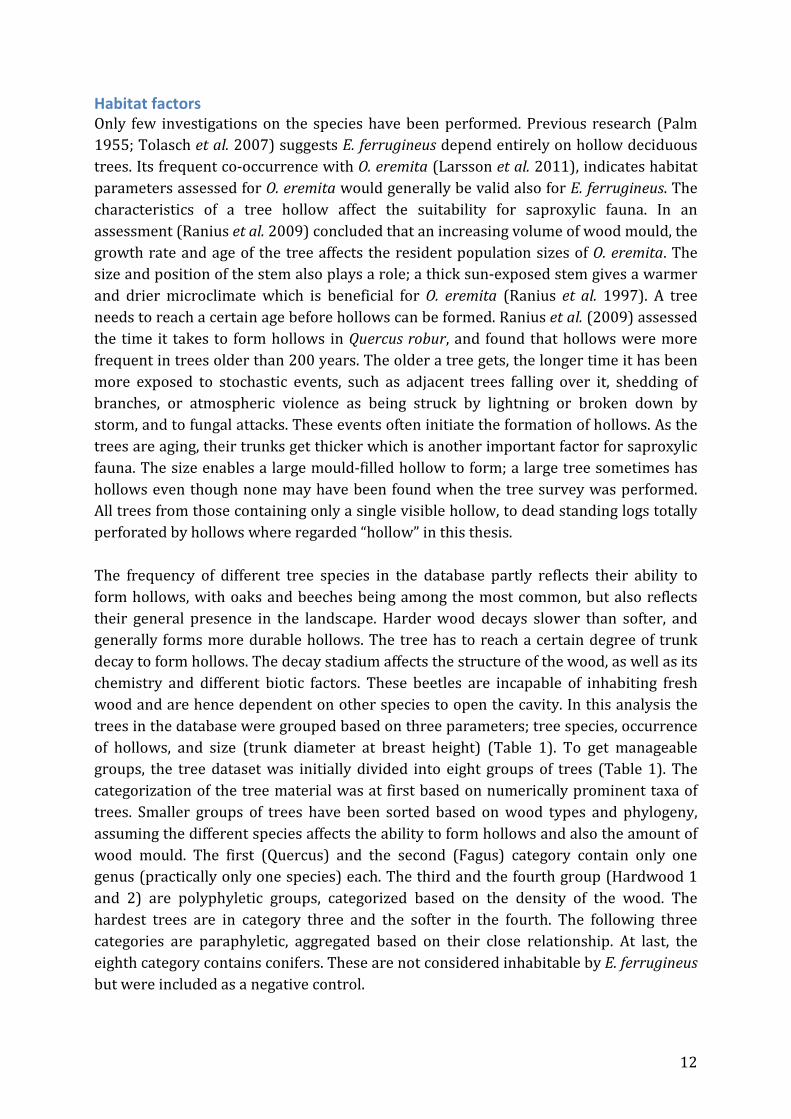
Habitat factors Only few investigations on the species have been performed. Previous research (Palm 1955; Tolasch et al. 2007) suggests E. ferrugineus depend entirely on hollow deciduous trees. Its frequent co-occurrence with O. eremita (Larsson et al. 2011), indicates habitat parameters assessed for O. eremita would generally be valid also for E. ferrugineus. The characteristics of a tree hollow affect the suitability for saproxylic fauna. In an assessment (Ranius et al. 2009) concluded that an increasing volume of wood mould, the growth rate and age of the tree affects the resident population sizes of O. eremita. The size and position of the stem also plays a role; a thick sun-exposed stem gives a warmer and drier microclimate which is beneficial for O. eremita (Ranius et al. 1997). A tree needs to reach a certain age before hollows can be formed. Ranius et al. (2009) assessed the time it takes to form hollows in Quercus robur, and found that hollows were more frequent in trees older than 200 years. The older a tree gets, the longer time it has been more exposed to stochastic events, such as adjacent trees falling over it, shedding of branches, or atmospheric violence as being struck by lightning or broken down by storm, and to fungal attacks. These events often initiate the formation of hollows. As the trees are aging, their trunks get thicker which is another important factor for saproxylic fauna. The size enables a large mould-filled hollow to form; a large tree sometimes has hollows even though none may have been found when the tree survey was performed. All trees from those containing only a single visible hollow, to dead standing logs totally perforated by hollows where regarded “hollow” in this thesis. The frequency of different tree species in the database partly reflects their ability to form hollows, with oaks and beeches being among the most common, but also reflects their general presence in the landscape. Harder wood decays slower than softer, and generally forms more durable hollows. The tree has to reach a certain degree of trunk decay to form hollows. The decay stadium affects the structure of the wood, as well as its chemistry and different biotic factors. These beetles are incapable of inhabiting fresh wood and are hence dependent on other species to open the cavity. In this analysis the trees in the database were grouped based on three parameters; tree species, occurrence of hollows, and size (trunk diameter at breast height) (Table 1). To get manageable groups, the tree dataset was initially divided into eight groups of trees (Table 1). The categorization of the tree material was at first based on numerically prominent taxa of trees. Smaller groups of trees have been sorted based on wood types and phylogeny, assuming the different species affects the ability to form hollows and also the amount of wood mould. The first (Quercus) and the second (Fagus) category contain only one genus (practically only one species) each. The third and the fourth group (Hardwood 1 and 2) are polyphyletic groups, categorized based on the density of the wood. The hardest trees are in category three and the softer in the fourth. The following three categories are paraphyletic, aggregated based on their close relationship. At last, the eighth category contains conifers. These are not considered inhabitable by E. ferrugineus but were included as a negative control.
13
Each group was further subdivided into four additional groups based on hollow stage and size. Classification of hollow stages in the tree database follows that of (Antonsson 2001b), but were in my study reclassified as non-hollow or hollow. The trees were finally divided into groups based on size. A tree was classified as large if its diameter at breast height exceeded 100 cm.
14
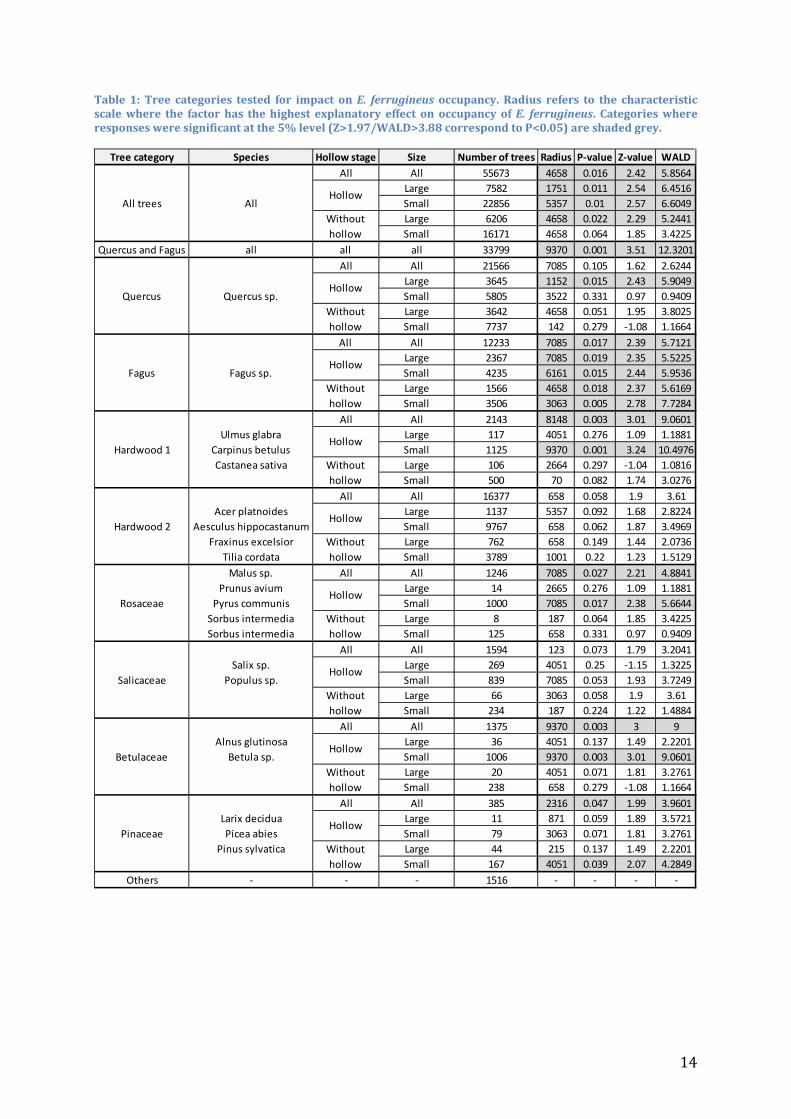
Table 1: Tree categories tested for impact on E. ferrugineus occupancy. Radius refers to the characteristic scale where the factor has the highest explanatory effect on occupancy of E. ferrugineus. Categories where responses were significant at the 5% level (Z>1.97/WALD>3.88 correspond to P<0.05) are shaded grey.
Tree category Species Hollow stage Size Number of trees Radius P-value Z-value WALDAll All 55673 4658 0.016 2.42 5.8564
Large 7582 1751 0.011 2.54 6.4516Small 22856 5357 0.01 2.57 6.6049Large 6206 4658 0.022 2.29 5.2441Small 16171 4658 0.064 1.85 3.4225
Quercus and Fagus all all all 33799 9370 0.001 3.51 12.3201All All 21566 7085 0.105 1.62 2.6244
Large 3645 1152 0.015 2.43 5.9049Small 5805 3522 0.331 0.97 0.9409Large 3642 4658 0.051 1.95 3.8025Small 7737 142 0.279 -1.08 1.1664
All All 12233 7085 0.017 2.39 5.7121Large 2367 7085 0.019 2.35 5.5225Small 4235 6161 0.015 2.44 5.9536Large 1566 4658 0.018 2.37 5.6169Small 3506 3063 0.005 2.78 7.7284
All All 2143 8148 0.003 3.01 9.0601Ulmus glabra Large 117 4051 0.276 1.09 1.1881
Carpinus betulus Small 1125 9370 0.001 3.24 10.4976Castanea sativa Large 106 2664 0.297 -1.04 1.0816
Small 500 70 0.082 1.74 3.0276All All 16377 658 0.058 1.9 3.61
Acer platnoides Large 1137 5357 0.092 1.68 2.8224Aesculus hippocastanum Small 9767 658 0.062 1.87 3.4969
Fraxinus excelsior Large 762 658 0.149 1.44 2.0736Tilia cordata Small 3789 1001 0.22 1.23 1.5129
Malus sp. All All 1246 7085 0.027 2.21 4.8841Prunus avium Large 14 2665 0.276 1.09 1.1881
Pyrus communis Small 1000 7085 0.017 2.38 5.6644Sorbus intermedia Large 8 187 0.064 1.85 3.4225Sorbus intermedia Small 125 658 0.331 0.97 0.9409
All All 1594 123 0.073 1.79 3.2041Salix sp. Large 269 4051 0.25 -1.15 1.3225
Populus sp. Small 839 7085 0.053 1.93 3.7249Large 66 3063 0.058 1.9 3.61Small 234 187 0.224 1.22 1.4884
All All 1375 9370 0.003 3 9Alnus glutinosa Large 36 4051 0.137 1.49 2.2201
Betula sp. Small 1006 9370 0.003 3.01 9.0601Large 20 4051 0.071 1.81 3.2761Small 238 658 0.279 -1.08 1.1664
All All 385 2316 0.047 1.99 3.9601Larix decidua Large 11 871 0.059 1.89 3.5721Picea abies Small 79 3063 0.071 1.81 3.2761
Pinus sylvatica Large 44 215 0.137 1.49 2.2201Small 167 4051 0.039 2.07 4.2849
Others - - - 1516 - - - -
PinaceaeHollow
Without hollow
SalicaceaeHollow
Without hollow
BetulaceaeHollow
Without hollow
Hardwood 2Hollow
Without hollow
RosaceaeHollow
Without hollow
Fagus Fagus sp.Hollow
Without hollow
Hardwood 1Hollow
Without hollow
All trees AllHollow
Without hollow
Quercus Quercus sp.Hollow
Without hollow
15
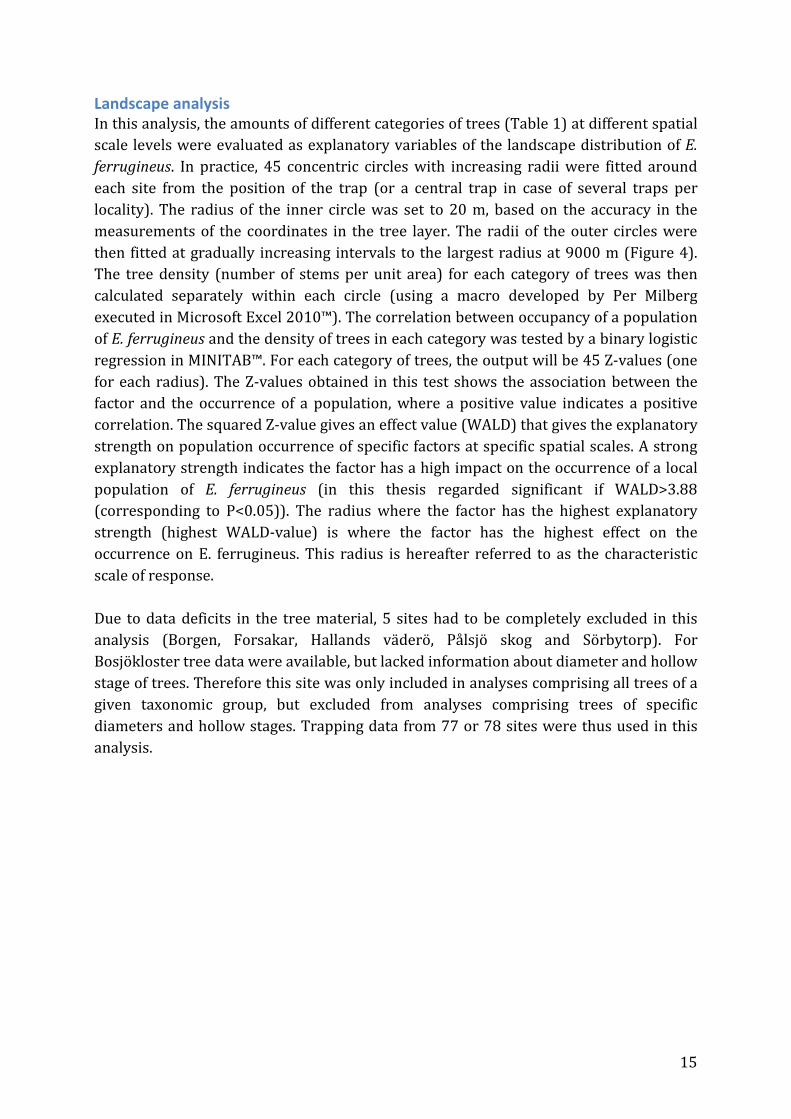
Landscape analysis In this analysis, the amounts of different categories of trees (Table 1) at different spatial scale levels were evaluated as explanatory variables of the landscape distribution of E. ferrugineus. In practice, 45 concentric circles with increasing radii were fitted around each site from the position of the trap (or a central trap in case of several traps per locality). The radius of the inner circle was set to 20 m, based on the accuracy in the measurements of the coordinates in the tree layer. The radii of the outer circles were then fitted at gradually increasing intervals to the largest radius at 9000 m (Figure 4). The tree density (number of stems per unit area) for each category of trees was then calculated separately within each circle (using a macro developed by Per Milberg executed in Microsoft Excel 2010™). The correlation between occupancy of a population of E. ferrugineus and the density of trees in each category was tested by a binary logistic regression in MINITAB™. For each category of trees, the output will be 45 Z-values (one for each radius). The Z-values obtained in this test shows the association between the factor and the occurrence of a population, where a positive value indicates a positive correlation. The squared Z-value gives an effect value (WALD) that gives the explanatory strength on population occurrence of specific factors at specific spatial scales. A strong explanatory strength indicates the factor has a high impact on the occurrence of a local population of E. ferrugineus (in this thesis regarded significant if WALD>3.88 (corresponding to P<0.05)). The radius where the factor has the highest explanatory strength (highest WALD-value) is where the factor has the highest effect on the occurrence on E. ferrugineus. This radius is hereafter referred to as the characteristic scale of response. Due to data deficits in the tree material, 5 sites had to be completely excluded in this analysis (Borgen, Forsakar, Hallands väderö, Pålsjö skog and Sörbytorp). For Bosjökloster tree data were available, but lacked information about diameter and hollow stage of trees. Therefore this site was only included in analyses comprising all trees of a given taxonomic group, but excluded from analyses comprising trees of specific diameters and hollow stages. Trapping data from 77 or 78 sites were thus used in this analysis.
16
Figure 4: The figure shows the circles around and capture data from 11 (of the total 78) localities in southern Scania. Tree densities were calculated within each circle. Only five circles spanning from radii of 100 to 3000 m are shown in this figure, whereas 45 radii from 20 to 9000 m are included in the analysis. Black dots represent a local population, and white dot represent stray captures. 6000 trees from the tree database, shown as small black dots, are also mapped. Note the clustering of giant trees primarily around large estates, which is typical for the Scanian landscape. Maps reproduced with permission: ©Lantmäteriet i Gävle 2010. Permission 2010/0055
©Lantmäteriet i Gävle 2010 Permission: 2010/0055
17
Result
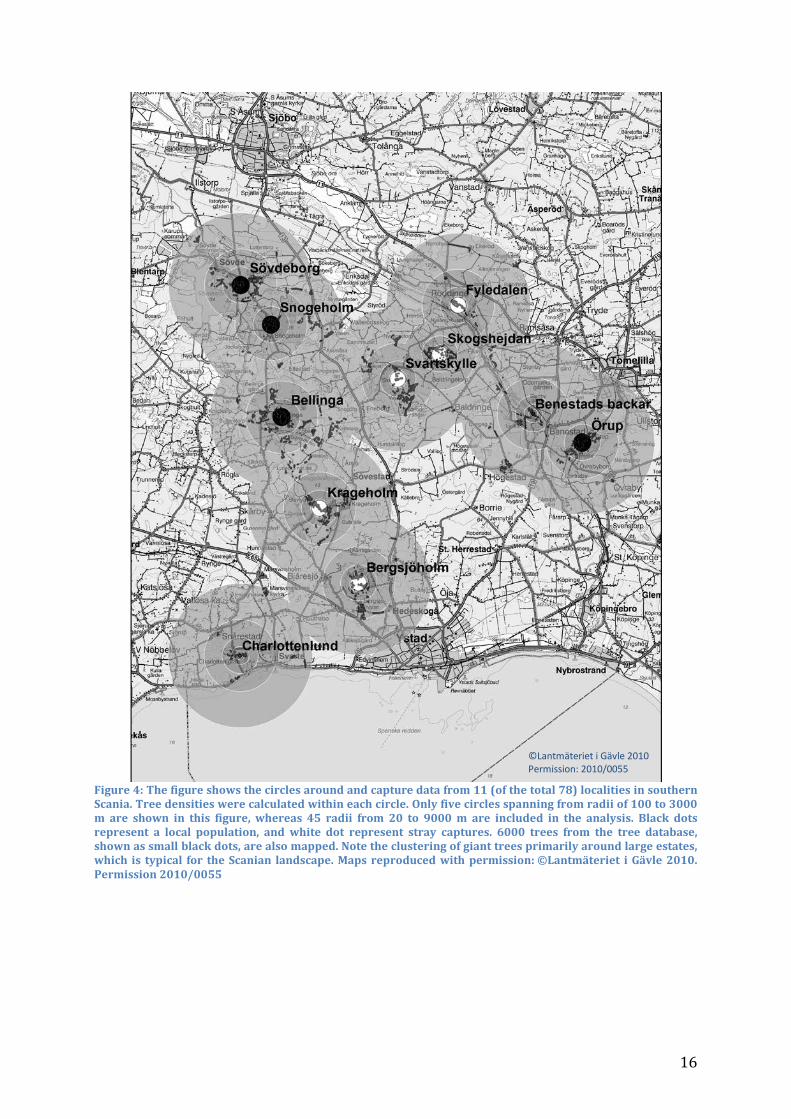
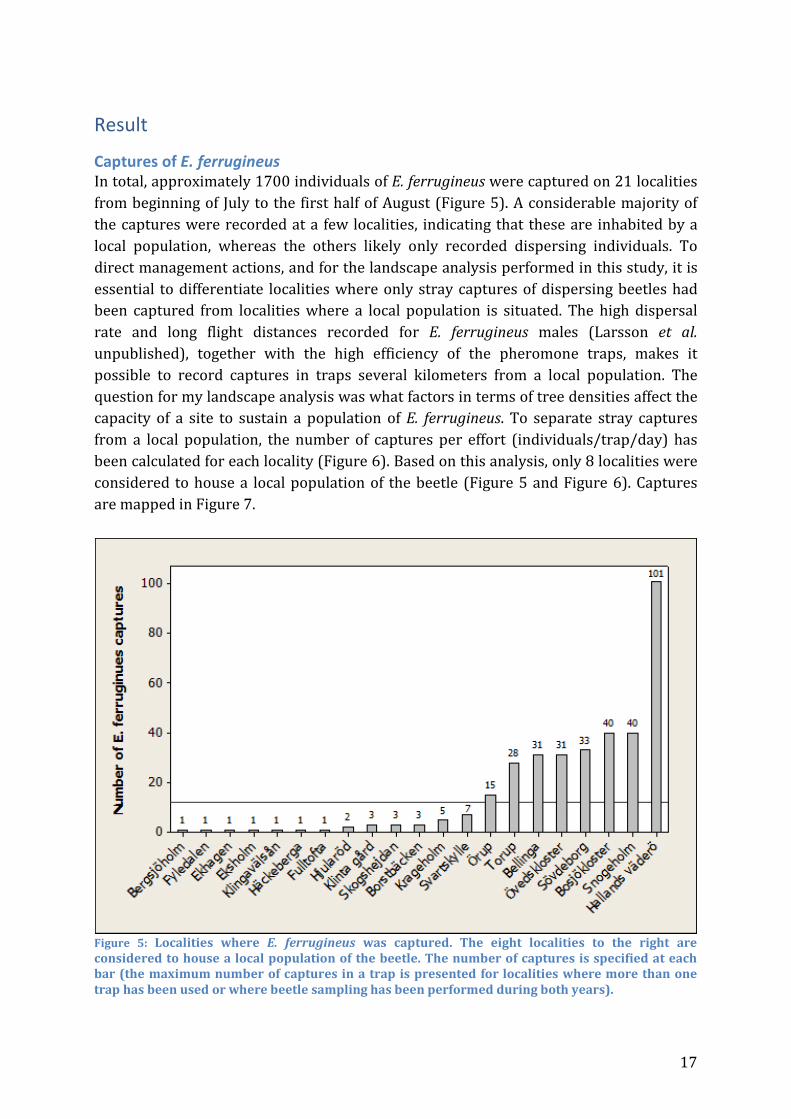
Captures of E. ferrugineus In total, approximately 1700 individuals of E. ferrugineus were captured on 21 localities from beginning of July to the first half of August (Figure 5). A considerable majority of the captures were recorded at a few localities, indicating that these are inhabited by a local population, whereas the others likely only recorded dispersing individuals. To direct management actions, and for the landscape analysis performed in this study, it is essential to differentiate localities where only stray captures of dispersing beetles had been captured from localities where a local population is situated. The high dispersal rate and long flight distances recorded for E. ferrugineus males (Larsson et al. unpublished), together with the high efficiency of the pheromone traps, makes it possible to record captures in traps several kilometers from a local population. The question for my landscape analysis was what factors in terms of tree densities affect the capacity of a site to sustain a population of E. ferrugineus. To separate stray captures from a local population, the number of captures per effort (individuals/trap/day) has been calculated for each locality (Figure 6). Based on this analysis, only 8 localities were considered to house a local population of the beetle (Figure 5 and Figure 6). Captures are mapped in Figure 7.
Figure 5: Localities where E. ferrugineus was captured. The eight localities to the right are considered to house a local population of the beetle. The number of captures is specified at each bar (the maximum number of captures in a trap is presented for localities where more than one trap has been used or where beetle sampling has been performed during both years).
18
Figure 6: Frequency of E. ferrugineus captures per day in a single trap per locality. Localities where more than 0.8 captures per day were recorded (to the right of the gap in the frequency distribution) are considered to house a local population.
19
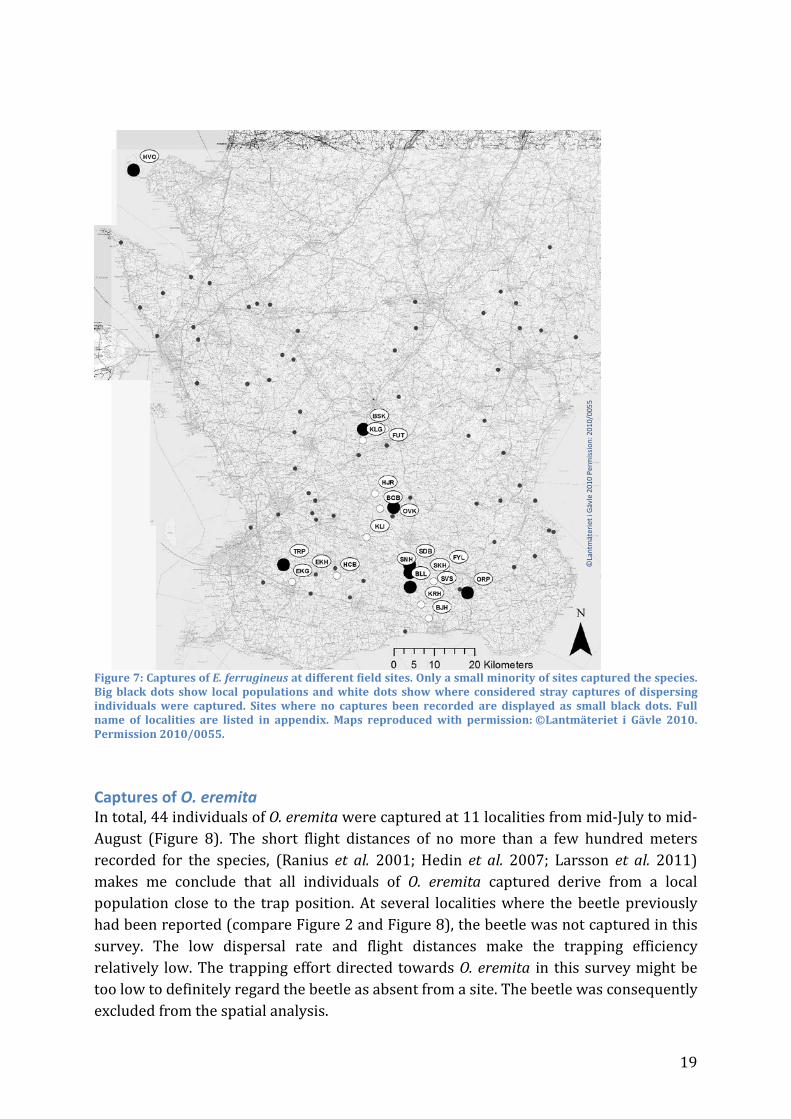
Figure 7: Captures of E. ferrugineus at different field sites. Only a small minority of sites captured the species. Big black dots show local populations and white dots show where considered stray captures of dispersing individuals were captured. Sites where no captures been recorded are displayed as small black dots. Full name of localities are listed in appendix. Maps reproduced with permission: ©Lantmäteriet i Gävle 2010. Permission 2010/0055.
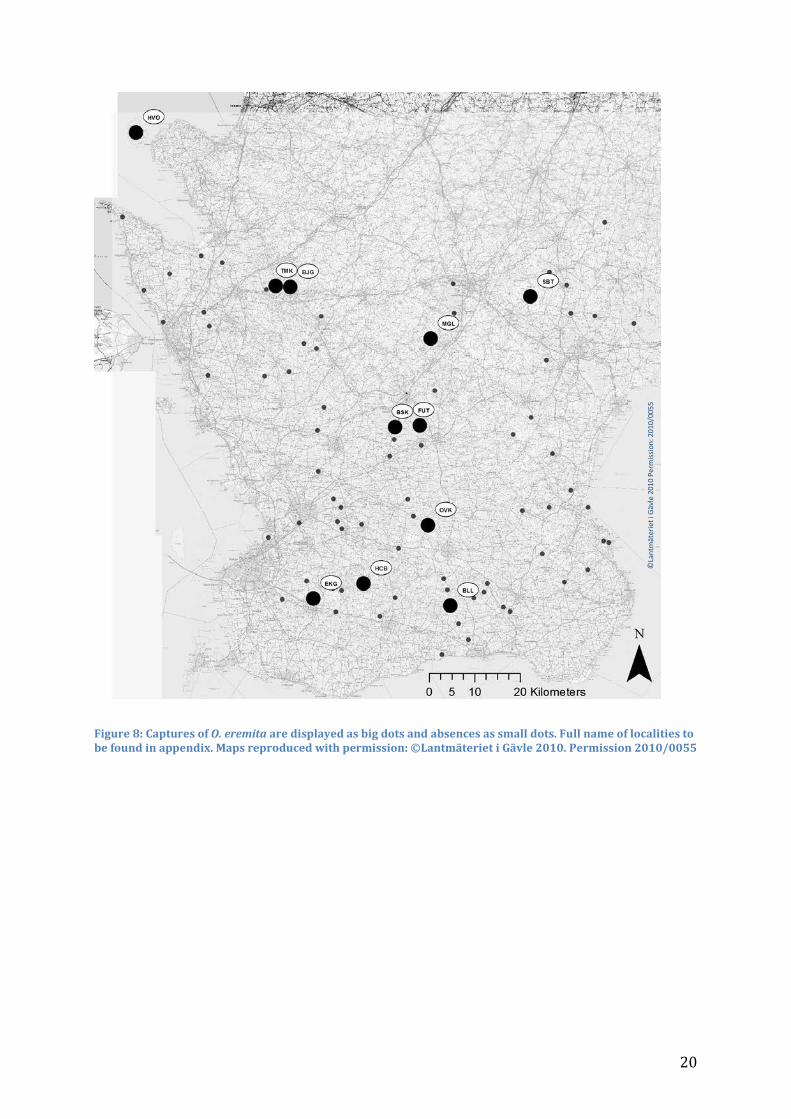
Captures of O. eremita In total, 44 individuals of O. eremita were captured at 11 localities from mid-July to mid- August (Figure 8). The short flight distances of no more than a few hundred meters recorded for the species, (Ranius et al. 2001; Hedin et al. 2007; Larsson et al. 2011) makes me conclude that all individuals of O. eremita captured derive from a local population close to the trap position. At several localities where the beetle previously had been reported (compare Figure 2 and Figure 8), the beetle was not captured in this survey. The low dispersal rate and flight distances make the trapping efficiency relatively low. The trapping effort directed towards O. eremita in this survey might be too low to definitely regard the beetle as absent from a site. The beetle was consequently excluded from the spatial analysis.
©La
ntm
äter
iet i
Gäv
le 2
010
Perm
issi
on: 2
010/
0055
20
Figure 8: Captures of O. eremita are displayed as big dots and absences as small dots. Full name of localities to be found in appendix. Maps reproduced with permission: ©Lantmäteriet i Gävle 2010. Permission 2010/0055
©La
ntm
äter
iet i
Gäv
le 2
010
Perm
issi
on: 2
010/
0055
21
Distribution of E. ferrugineus and O. eremita Except for Hallands väderö, the distribution of E. ferrugineus was limited to a region from the towns Höör in the north, Svedala in the west and Tomelilla as its easternmost distribution limit. The beetle appears to be completely absent from the northern Scanian mainland (Figure 7). Four of the eight localities where E. ferrugineus was considered resident were at previously unknown sites: Bellinga (BLL), Bosjökloster (BSK), Snogeholm (SNH), and Torup (TRP) (Figure 9). Two of the O. eremita captures were previously unknown sites: Bjärsgård (BJG) and Maglö ekar (MGL). The distribution was not restricted to the southern parts, as for E. ferrugineus, but the beetle was captured at several locations in the northern parts of Skåne. The distribution of the beetle appears to be more scattered in the landscape, and captures were recorded even in small isolated localities all over the region. At four localities: Bellinga (BLL), Bosjökloster (BSK) Hallands väderö (HVO) and Övedskloster (OVK), both beetles were found together whereas at most O. eremita localities E. ferrugineus was absent (Figure 8). At the other four localities where E. ferrugineus was found: Snogeholm (SNH), Sövdeborg (SDB), Torup (TRP), and Örup (ORP), E. ferrugineus was found in the absence of O. eremita. Some of these might reflect our failure to detect the latter species, although recent extinctions of O. eremita cannot entirely be ruled out, considering the extensive trap effort at these sites. At 7 sites: Bjärsgård (BJG), Ekhagen (EKG), Fulltofta (FUT), Häckeberga (HCB), Maglö ekar (MGL), Sörbytorp (SBT) and Tomarps kungsgård (TMK), O. eremita was captured but no E. ferrugineus population appears to persist at these sites. O. eremita has previously been reported from 21 localities in Skåne. 9 of these were verified in this project and two previously unknown localities were identified: Maglö ekar (MGL) and Bjersgård (BJG). Pheromone trapping in this project did not record any O. eremita at 8 previously known localities: Hanaskog (HSK), Herrevadskloster (HVK), Mölleröds kungsgård (MLK), Stenshuvud (STH), Torsebro (TSP), Torup (TRP), Vanås (VNS) and Örup (ORP) (Figure 9). The trapping effort in this project is not enough to definitely consider the beetle absent from these sites. Four previously known localities were not surveyed in this project: Fairyhill (FRH) close to Bosjökloster (BSK) and three localities where the beetle latest where recorded during the nineteenth century (see Appendix).

22
Figure 10: Records of E. ferrugineus and O. eremita at different sites in this investigation, compared with records from previous surveys.
4 7 E. ferrugineus O. eremita
4
4 0 4 Pheromone
2010-11 Artportalen
et al
E. ferrugineus
New finds!
2 12 9 Pheromone
2010-11 Antonsson 1996-2003
O. eremita
New finds!
Figure 9: Venn diagram showing population overlap of the species in this investigation. The number of sites where the species were found together are specified in the intersect region (Bellinga, Bosjökloster, Hallands väderö, and Övedskloster). In the four localities where only E. ferrugineus was found, O. eremita might still be present, whereas the absence of E. ferrugineus at 7 localities most likely reflects a true absence of the species.
23
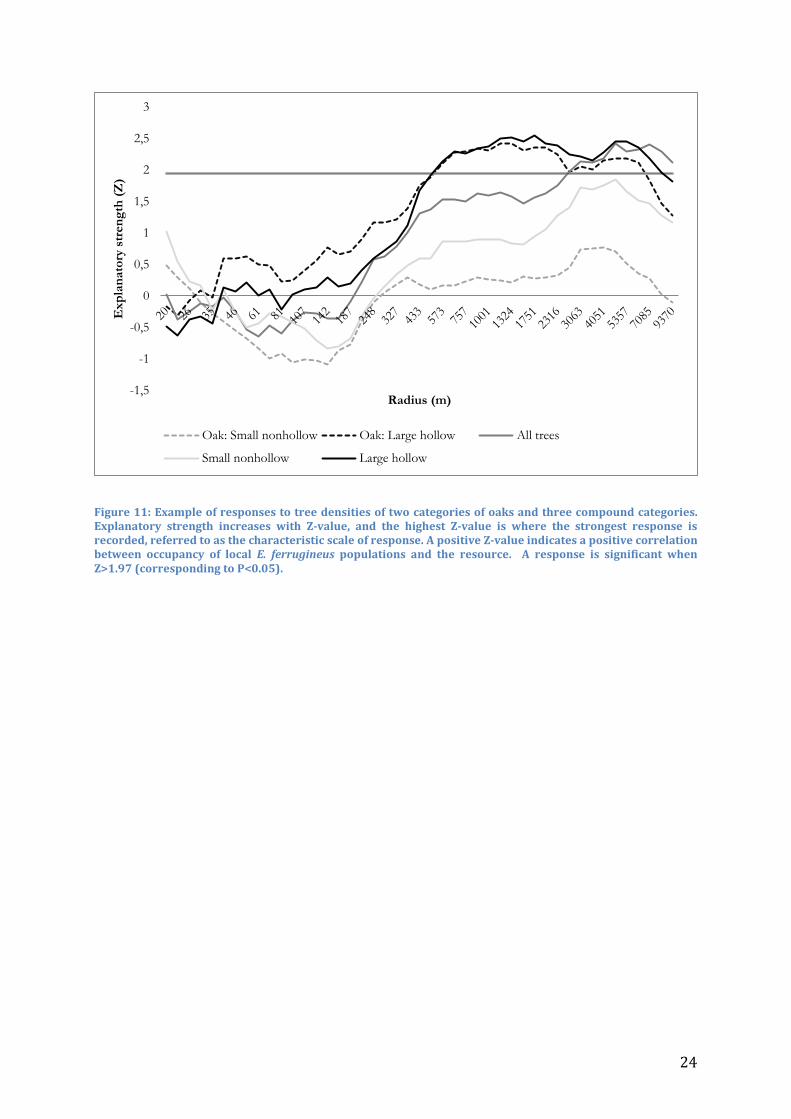
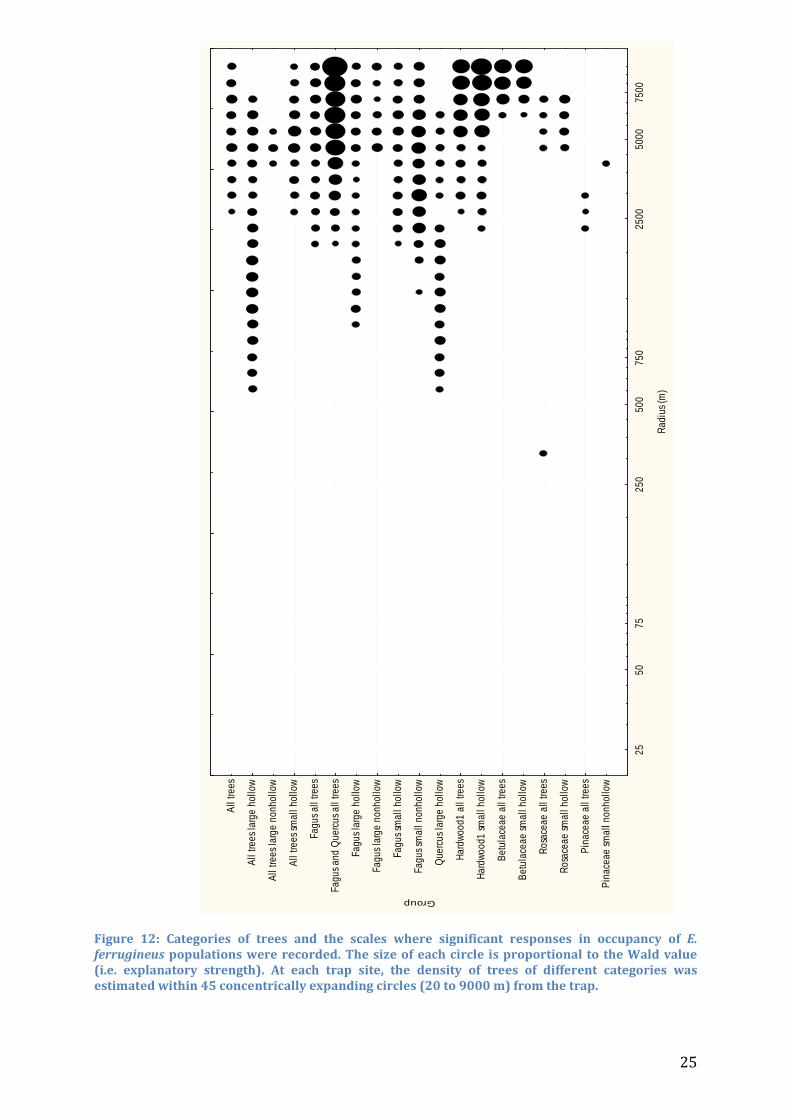
Landscape analysis In the fragmented Scanian woodland, as traps were usually placed within large stands of trees, tree density generally showed a decreasing trend at greater distances from the trap. The average tree density decreased from the smallest radius with 12.39 trees ha-1 to 0.08748 trees ha-1 at the largest radius. At sites where E. ferrugineus was found, the average density at the smallest radius was 12.52 trees ha-1, and 0.1316 trees ha-1 at the largest radius, indicating that the greatest explanatory differences between sites were found at larger radii. The landscape analysis with gradually expanding radii showed that E. ferrugineus responded significantly to tree densities at specific scales. Many categories of trees showed a slight negative, but non-significant (Z>-1.97) correlation to tree densities at the smallest radii, especially for small and non-hollow trees (Figure 11). However, the absence of significant negative responses indicates that none of the tested categories have a negative impact on occupancy of E. ferrugineus (Table 1). The explanatory strength tended to increase with increasing radii, but remained in most cases insignificant out to 1000 m (Figure 11 and Figure 12). Significant explanatory strength (Z>1.97/WALD>3.88) was recorded in 19 out of 47 categories, and overall at very large spatial scales. Only 4 categories were significant at <1000 m (large hollow Quercus, large hollow beeches, all large hollow trees and all rosales) and 11 groups were significant at the largest radii. Groups based on tree characteristics, regardless of tree species, showed a significant response in all cases except for small nonhollow trees. The characteristic scale of response varied between 1751 to 4658 m from large hollow to large nonhollow trees. Significant response for oak density was only recorded with large hollow trees. Response was recorded already at 560 m for this category, and was significant out to 6000 m. Characteristic scale of response for this group was 1152 m. A sum of densities of all beeches and oaks resulted in significance from 2000 m, with increasing WALD-values all the way out to the largest radius. In Hardwood1, dominated by Ulmus glabra and Carpinus betulus, significant responses were recorded from 2000 m to all trees and small hollow trees. The scale of response extended to the largest radii with an increasing explanatory power. For Hardwood2, mostly constituted by Tilia cordata and Fraxinus excelsior, no significant response was recorded, even though the groups were large. A counter-intuitive significant response to conifers was recorded. In two cases, small nonhollow and all conifers, E. ferrugineus responded positively and significantly to tree densities at a spatial scale between 2000 and 4000 m.
24
Figure 11: Example of responses to tree densities of two categories of oaks and three compound categories. Explanatory strength increases with Z-value, and the highest Z-value is where the strongest response is recorded, referred to as the characteristic scale of response. A positive Z-value indicates a positive correlation between occupancy of local E. ferrugineus populations and the resource. A response is significant when Z>1.97 (corresponding to P<0.05).
-1,5
-1
-0,5
0
0,5
1
1,5
2
2,5
3E
xpla
nato
ry s
tren
gth
(Z)
Radius (m)
Oak: Small nonhollow Oak: Large hollow All trees
Small nonhollow Large hollow
25
2550
7525
050
075
025
0050
0075
00
Radi
us (m
)
Pina
ceae
smal
l non
hollo
w
Pina
ceae
all
trees
Rosa
ceae
smal
l hol
low
Rosa
ceae
all
trees
Betu
lace
ae sm
all h
ollo
w
Betu
lace
ae a
ll tre
es
Hard
wood
1 sm
all h
ollo
w
Hard
wood
1 al
l tre
es
Quer
cus l
arge
hol
low
Fagu
s sm
all n
onho
llow
Fagu
s sm
all h
ollo
w
Fagu
s lar
ge n
onho
llow
Fagu
s lar
ge h
ollo
w
Fagu
s and
Que
rcus a
ll tre
es
Fagu
s all
trees
All t
rees
smal
l hol
low
All t
rees
larg
e no
nhol
low
All t
rees
larg
e ho
llow
All t
rees
Group
Figure 12: Categories of trees and the scales where significant responses in occupancy of E. ferrugineus populations were recorded. The size of each circle is proportional to the Wald value (i.e. explanatory strength). At each trap site, the density of trees of different categories was estimated within 45 concentrically expanding circles (20 to 9000 m) from the trap.
26
Discussion
General In this thesis, four novel localities for E. ferrugineus have been identified, which doubles the number of known localities for the beetle in Skåne. In addition, the continued presence of the species at Örup (ORP) has been confirmed, which was considered uncertain after the destruction of the local elm forest by Dutch elm disease a few decades ago. The sites surveyed in this project cover virtually all Scanian localities with a potential to house E. ferrugineus populations. The high number of new localities identified in this project stresses the efficiency of pheromone trapping compared to conventional trapping methods. By the use of pheromone trapping it has been possible to screen large areas with very low effort. The region of Skåne, covering 11’000 square km2, would be entirely possible for one person to survey with regards to all potential sites for E. ferrugineus within one or two field seasons. Previous surveys and amateur collection of O. eremita have already revealed many relatively recent localities; nevertheless, the use of pheromone trapping in the present project has contributed with two novel localities for the species. Pheromone trapping of O. eremita is not in itself efficient enough to consider the beetle as absent (Svensson et al. 2009; Larsson et al. 2011). Furthermore, the distribution of the beetle, scattered all over the landscape and found even in small isolated stands of hollow trees, strongly suggests that more localities might be found. At three localities (Snogeholm, Sövdeborg and Örup) where E. ferrugineus has been found in the absence of O. eremita, the trapping effort for the latter species has not been as extensive. At these localities, thorough trapping efforts should be directed towards the beetle to determine its occurrence. In Örup, however, it is quite possible that O. eremita actually is absent as the locality has undergone a severe change since the elm disease struck the forest. In Örup, several captures of the saproxylic scarab Gnorimus nobilis were recorded in this project, suggesting these beetles constitute an alternative prey for E. ferrugineus, as a substitute to the O. eremita larvae.
27
Landscape analysis interpretation E. ferrugineus responded to tree densities at very large spatial scale. Tree densities at radii below 500 m had very low explanatory strength, which indicates that no resources at small spatial scale are sufficient to support a population. The beetle was absent from every isolated site with limited area and connectivity to adjacent sites; even from sites with very high local densities of large trees, which suggests that no amount of local resources can sustain a resident population, and explains why resources near potential sites had no explanatory value. E. ferrugineus was mostly found at a few adjacent sites in areas with high overall densities of large trees, which suggests that a high overall tree density is necessary to sustain local populations. In comparison with current studies (Musa et al. unpublished) in the county of Östergötland, the Scanian E. ferrugineus respond to tree densities at a greater scale. Tree factors appear to have an impact already at a significantly smaller scale in Östergötland than in Skåne, where only modest impact of tree resources could be detected within several kilometers from resident populations, and where the greatest effects were identified at the furthest distances away from traps. A reasonable explanation for this extreme result for Skåne is the high degree of isolation of most sites in the landscape. The Scanian presence of O. eremita appears very different from E. ferrugineus, as local stands of trees seem perfectly able to sustain a resident population at least for a limited time. Bergman et al. (2012) assessed the scales at which O. eremita responds to oak densities in the county of Östergötland. The authors found that O. eremita responds to oak densities already from 70 m all the way out to the largest scale in their analysis (6000 m). This indicates that persistence of this beetle is facilitated by substrate on the local scale, as well as all the way up to landscape level. The sedentary lifestyle of O. eremita, with low population fluctuations (Ranius 2001; Hedin et al. 2007), its reluctance to leave the tree (Ranius et al. 2001) and its short flight distances (Ranius et al. 2001; Svensson et al. 2011b) makes it viable in a small stand for an extended time period. Ranius et al. (2001) suggested at least 10 hollow trees and a good regeneration is a minimum to sustain a healthy O. eremita population in the long run. However, all requirements necessary to sustain a population in the long run may not be met. These factors might act on a larger temporal scale and the loss of essential habitat factors might not yet have had an impact. Due to this, many O. eremita populations found in this project might be suppressed under a temporal extinction debt. As demonstrated by Bergman et al. (2012), different species have entirely different spatial demands for resources in fragmented landscapes. This might be the explanation for the high number of Scanian localities for O. eremita.
28
Defining local populations A population can be defined as “a group of individuals of the same species living in a certain defined area” (Lawrence 2008). In traditional surveys of saproxylic beetles, individuals are often found in their natal tree. The formidable efficiency of the E. ferrugineus pheromone in combination with the high dispersal ability of the males makes it possible to capture beetles several kilometers from their natal area. The area from where the beetles derive will be hard to define. In theory, the further away from a locality with a resident population a trap is put up, the fewer beetles will be captured. In the spatial analysis, including stray captures at sites close to local populations would lead to multiple sampling from the same population, e.g. Krageholm (KRH) and Bergsjöholm (BJH) south from Bellinga (BLL), Ekhagen (EKG) south from Torup (TRP), and several sites around Bosjökloster (BSK). In this thesis, captures of E. ferrugineus were detected at 21 out of 83 sites. Of these 21, eight sites captured a much higher number of E. ferrugineus than the rest. Comparing captures in a single trap per day yielded a bimodal distribution of captures, which were interpreted as stray captures and resident populations, respectively (Figure 5 and Figure 6). This analysis provided an unambiguous classification of most sites into either a resident population or stray captures (Figure 7). Localities where beetle trapping was considered to consist entirely of stray captures generally captured 3 beetles or less when situated close to a known local population where high captures have been recorded. Two potential exceptions are represented by Svartskylle (SVS) and Krageholm (KRH). Svartskylle (7 captures) lies centered between four large resident populations of E. ferrugineus, and therefore the relatively high number of stray captures does not seem unlikely. Krageholm (5 captures) lies due south of several resident populations, and here E. ferrugineus was captured only in 2010 and not in 2011. In all cases of presumed stray catches where trapping was performed during both years: Krageholm (KRH), Borstbäcken (BOB), Bergsjöholm (BJH) and Häckeberga (HCB), individuals were captured only during one of these years. In cases where many traps are put up at each locality, competition between traps likely leads to smaller average capture frequencies. This bias cannot be adjusted for by using a capture per trap effort, or even by choosing the trap with the highest number of captures, as in the present study. Due to this competition, the differences between captures of residents and non-residents at localities where many traps have been used are underestimated in the present study. To get comparable capture data from several traps where the trapping period might vary, the number of captures in the present study was normalized as captures per day. By using a capture per effort measure (Figure 6) it was possible to make a reasonable comparison of captures between sites. To do this, the time period that each trap has had a possibility to capture beetles has to be calculated. The true flight period of the beetle has to be taken into consideration, since a trap is often put up before and not taken down until after the flight period has ended. For E. ferrugineus, the first captures were recorded from 1 July and the last in 10 August.
29
The use of the giant tree dataset Another important parameter to take into consideration in the landscape analysis is potential spatial correlations between different types of trees. Many different types of trees in the data material appeared to have explanatory value in predicting the presence of E. ferrugineus at larger radii. Stands of trees included in this study are seldom homogeneous in terms of ages and tree species. In many cases, densities of different trees are likely to correlate. Preliminary investigations suggest that this is the case, although the extent of co-variance has not been explored here (unpublished data, outside the scope of this thesis). If there is a correlation between many groups of trees, it will not be possible to determine from which specific group of trees a response derives. This might be the explanation of the unexpected positive response to conifers. At localities where E. ferrugineus has been found, also other sorts of trees, including conifers, have had a possibility to grow old. Note that the tree material used in this analysis originates from surveys specifically directed towards giant trees and does not reflect the composition nor constitute a comprehensive image of all trees in the region. Forested land and areas of active forestry have not been covered in the giant tree survey, and smaller trees have been ignored across the board. However, none of these groups are likely to house the right habitat for these beetles, and would most likely have given a negative response if included in the analysis. The division between large and small trees was set to 1 m based on assumed suitability for saproxylic fauna. A larger tree is older and is more likely to contain hollows filled with wood mould. The definition of a large tree as one with a trunk diameter exceeding 1 m in diameter is, however, arbitrary and should in ideal cases have been species specific.
For the multiscale analysis, only present day resource distributions in the giant tree material have been taken into account. For example, lack of continuity might have led certain populations to local extinction, and even if the forest is regenerated it will not easily regain its former biodiversity (Speight 1989). This effect will give a false negative response to tree densities if included in the spatial analysis.
For a factor to give any effect in the binary logistic regression, it has to be differentiating between presence and absence. Small nonhollow trees are abundant at most localities and play an important role as replacement trees at a much greater temporal scale, but since they are abundant at all localities they will yield no prominent responses. The choice of trap placement is essential also for the density calculations at the smallest and largest radii. The amount of large trees in the closest proximity will have a large impact on tree densities at the smallest radii. At increasing radii, density differences between localities start to level off.
30
Statistics The resources evaluated in the spatial analysis derive from the same dataset. All 46 groups were selected from the same tree dataset and may for various reasons not be statistically independent. Multiple comparisons at the same dataset might lead certain groups to be significant as a matter of chance. A few groups, as Rosaceae and conifers scarcely reached significance and could be explained by this, and correlation (previously discussed) between groups. As a result, significance thresholds might be considered too generous and should perhaps be lowered. On the other hand, the main variable considered in the analysis has been comparisons of effect sizes in the form of Wald values, rather than an arbitrary threshold for significance. When tree densities were calculated, all trees from the position of the trap out to the specific radius where included. Due to this, tree densities at large radii are not statistically independent from densities at smaller radii. A very dense forest close to the trap could give a false raise in tree densities at the larger radius. Because of this, responses observed at large radii could be the result of very dense stands close to the centroid. The problem could have been solved by calculating tree densities within certain radius interval. Another intrinsic problem in this analysis is overlap of circles of adjacent localities in the tree density calculations. Circles of the closest situated localities will start to overlap already from a radius of 1000 m, and as the radius increases the tree densities of these localities will start to become more uniform. Successively, as the overlap of circles and the interference between adjacent localities increases, WALD-values might be influenced. However, the impact of this issue has been considered beyond the scope of the present thesis.
31
Indicator species O. eremita has been evaluated as an indicator for species richness in tree hollows (Ranius 2002b; Jansson et al. 2009a). In these studies, a strong correlation between O. eremita and species richness has been shown. However, they also concluded that O. eremita is not the most demanding species in that habitat, and some species might be lost if O. eremita is the only beetle taken into consideration. A species at higher trophic levels is presumably more sensitive to habitat fragmentation and decreasing resources (Holt 2002). As E. ferrugineus lives as a predator, inter alia of O. eremita, E. ferrugineus can be considered a more demanding species. In this project, E. ferrugineus was absent at several localities where O. eremita was found, suggesting that these habitats are insufficient to house E. ferrugineus. By this, E. ferrugineus can be considered higher up in a hierarchy of extinction dynamics, where O. eremita is less sensitive to habitat destruction. Since the pheromone of E. ferrugineus has been accessible for nature preservation purposes, the possibilities to survey the beetle has radically increased, which is reflected by the 100% increase in known Scanian localities as a result of this project. The high detectability in combination with its high habitat requirements could make E. ferrugineus a good indicator species. However, its correlation to biodiversity has not been assessed. In this project, only half of the localities where E. ferrugineus was found, O. eremita were found as well. As the presence of O. eremita has been shown to correlate with high biodiversity (Ranius 2002b), localities where E. ferrugineus been found in the absence of O. eremita might be less valuable in terms of biodiversity. However, the lack of finds of O. eremita at these sites can be explained by the low pheromone trapping efficiency for O. eremita. If the beetle actually is absent at these localities, a break in the continuity and a bottleneck effect where the most demanding saproxylic fauna gone extinct can be an explanation. The reason for why we find E. ferrugineus at these sites could be a result of better recolonization abilities compared to O. eremita. The differences in biology between O. eremita and E. ferrugineus make them complement each other well as indicators. In a parallel analysis, the differences can be advantageous. O. eremita is likely detected close to its natal tree, and it is correlated to a high biodiversity. On the other hand, it appears to respond slowly to environmental changes and it is not the most demanding species. E. ferrugineus is a more demanding species, considerably higher up in an extinction hierarchy which makes it a broad umbrella species. Its mobile lifestyle makes it hard to determine where the beetle comes from and its supreme habitat requirements make it extremely rare. Only few localities would be worth saving if E. ferrugineus was the only species in consideration. The use of both species in parallel analyses will give a management hierarchy, where localities with both species should be considered the most prioritized to protect.
32
Implications for conservation The large-scale responses of E. ferrugineus to tree densities reveal its demands for large unfragmented areas with high densities of giant trees. Judging from its present landscape distribution, E. ferrugineus appears to be very sensitive to a range of interconnected factors, including habitat fragmentation and isolation in too small tree stands without sufficient resources to sustain a population. As E. ferrugineus appears to be a more demanding species than O. eremita, localities where the former been found should be considered the most valuable, and should immediately be assigned the highest priority and the highest level of protection available. E. ferrugineus requires conservation on very large spatial scales to safeguard its survival, with strategic replacement trees designated already today in order to ensure a continuous resource supply. This is necessary as the regeneration dynamics of its habitat extend over centuries, whereas improper management could reduce the amount of available resources below sustainable levels within a few decades. The scale at which E. ferrugineus responds to tree densities and its distribution in the landscape leads me to conclude that there are five main populations of the beetle. Hallands väderö (HVO), an isolated island in the north and a region around Ringsjöarna (BSK, FUT, KLG) appears to be isolated populations. Övedskloster (OVK) at the east side of Vombsjön constitute a population more or less isolated from a large region in the south where the beetle been found at numerous sites. This region stretches from Torup (TRP) in the west to Örup (ORP) in the east, with a prominent population between Sjöbo and Ystad. Five sites: Torup (TRP), Sövdeborg (SDB), Snogeholm (SNH), Bellinga (BLL) and Örup (ORP) in this region have been classified to hold a local population and in between these, stray captures have been recorded at seven sites: Ekhagen (EKG), Eksholms naturreservat (EKH), Häckeberga (HCB), Fyledalen (FYL), Skogshejdan (SKH), Svartskylle (SVS), Krageholm (KRH) and Bjersjöholm (BJH). This indicates that there could be a metapopulation structure with varying exchange between localities, and a possibility for colonization of new habitats in between to occur. It should be noted that the long dispersal distances recorded for male E. ferrugineus does not seem to translate to high colonization ability. Studies over many areas of southern Sweden suggests female dispersal being much more limited (Larsson et al. unpublished). Immediate action should be taken to regenerate suitable habitats in between localities and to increase the connectivity between them in order to secure the survival of E. ferrugineus and other demanding species in this region. In regions as in the south of Skåne, where beetles are found at many sites, there is a possibility to connect resident populations to facilitate genetic exchange. Mapping of next generation of trees and preservation of these will increase contact between areas. Management efforts directed to recreate habitats for saproxylic fauna will be rewarding in this region as the chances for recolonization are high. Localities where O. eremita has been found alone are of great importance to solve regeneration problems and constitute strategic points from which to increase the amount of dead wood in the landscape. As proposed by Ranius (2002b) stands where O. eremita has been found have a potential to already sustain a rich saproxylic fauna, but could also constitute an even better habitat suitable for the most demanding species
33
within a reasonable time with the right management efforts. To increase the connectivity, a densification of patches or continuous corridors could be formed. The use of artificial wood mould in wooden boxes has been evaluated as a good way to create habitable patches and increase the connectivity (Jansson et al. 2009b).
Acknowledgements Mattias Larsson, supervisor, for conceptual idea and support during the work. Per Milberg, supervisor and especially for support in statistics and improvement of manuscript. Joseph Burman, for steady assistance in field and during analyses. Per Levenskog at the county administrative board in Skåne for providing me with, - and initial editing of the giant tree dataset. Annika Tuvesson, Inis Winde, Henrik Nguyen and Franklin Nyabuga for practical support and field assistance. Najihah Musa for helpful insights during the project and for sharing corresponding data for Östergötland. Glenn Svensson for support during 2010. Erik Hedenström, Palle Breistein, and Joakim Bång at Mid Sweden University for pheromone synthesis. Financial support for this study has been provided by Marie-Claire Cronstedts Stiftelse and Skogssällskapet.
34
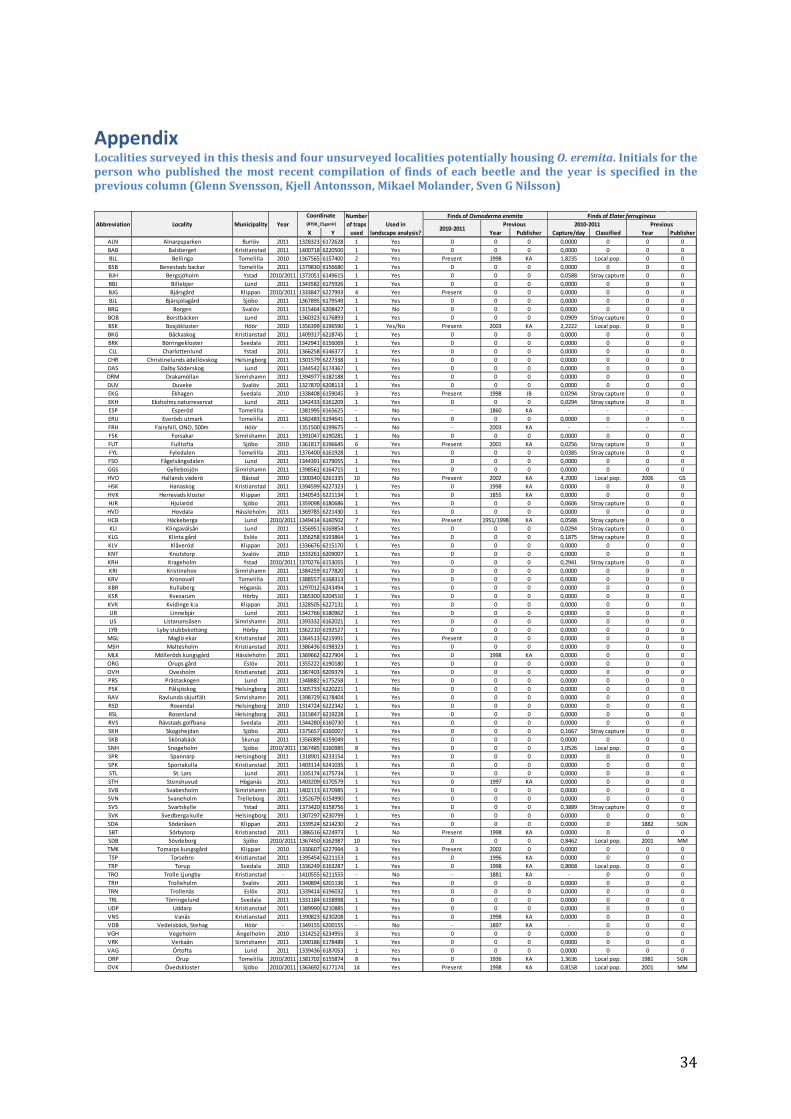
Appendix Localities surveyed in this thesis and four unsurveyed localities potentially housing O. eremita. Initials for the person who published the most recent compilation of finds of each beetle and the year is specified in the previous column (Glenn Svensson, Kjell Antonsson, Mikael Molander, Sven G Nilsson)
Numberof traps
X Y used landscape analysis? Year Publisher Capture/day Classified Year PublisherALN Alnarpsparken Burlöv 2011 1328323 6172628 1 Yes 0 0 0 0,0000 0 0 0BAB Balsberget Kristianstad 2011 1400718 6220500 1 Yes 0 0 0 0,0000 0 0 0BLL Bellinga Tomelilla 2010 1367565 6157400 2 Yes Present 1998 KA 1,8235 Local pop. 0 0BSB Benestads backar Tomelilla 2011 1379830 6156680 1 Yes 0 0 0 0,0000 0 0 0BJH Bergsjöholm Ystad 2010/2011 1372051 6149615 1 Yes 0 0 0 0,0588 Stray capture 0 0BBJ Billebjer Lund 2011 1343582 6175926 1 Yes 0 0 0 0,0000 0 0 0BJG Bjärsgård Klippan 2010/2011 1333847 6227993 4 Yes Present 0 0 0,0000 0 0 0BJL Bjärsjölagård Sjöbo 2011 1367895 6179549 1 Yes 0 0 0 0,0000 0 0 0BRG Borgen Svalöv 2011 1315464 6208427 1 No 0 0 0 0,0000 0 0 0BOB Borstbäcken Lund 2011 1360323 6176893 1 Yes 0 0 0 0,0909 Stray capture 0 0BSK Bosjökloster Höör 2010 1356399 6196590 1 Yes/No Present 2003 KA 2,2222 Local pop. 0 0BKG Bäckaskog Kristianstad 2011 1409317 6218745 1 Yes 0 0 0 0,0000 0 0 0BRK Börringekloster Svedala 2011 1342941 6156069 1 Yes 0 0 0 0,0000 0 0 0CLL Charlottenlund Ystad 2011 1366258 6146377 1 Yes 0 0 0 0,0000 0 0 0CHR Christinelunds ädellövskog Helsingborg 2011 1301579 6227338 1 Yes 0 0 0 0,0000 0 0 0DAS Dalby Söderskog Lund 2011 1344542 6174367 1 Yes 0 0 0 0,0000 0 0 0DRM Drakamöllan Simrishamn 2011 1394977 6182188 1 Yes 0 0 0 0,0000 0 0 0DUV Duveke Svalöv 2011 1327870 6208113 1 Yes 0 0 0 0,0000 0 0 0EKG Ekhagen Svedala 2010 1338408 6159045 3 Yes Present 1998 JB 0,0294 Stray capture 0 0EKH Eksholms naturreservat Lund 2011 1342433 6161209 1 Yes 0 0 0 0,0294 Stray capture 0 0ESP Esperöd Tomelilla - 1381995 6165625 - No - 1860 KA - - - -ERU Everöds utmark Tomelilla 2011 1382483 6194641 1 Yes 0 0 0 0,0000 0 0 0FRH Fairyhill, ONO, 500m Höör - 1351500 6199675 - No - 2003 KA - - - -FSK Forsakar Simrishamn 2011 1391047 6190281 1 No 0 0 0 0,0000 0 0 0FUT Fulltofta Sjöbo 2010 1361817 6196645 6 Yes Present 2001 KA 0,0256 Stray capture 0 0FYL Fyledalen Tomelilla 2011 1376400 6161928 1 Yes 0 0 0 0,0385 Stray capture 0 0FSD Fågelsångsdalen Lund 2011 1344391 6179055 1 Yes 0 0 0 0,0000 0 0 0GGS Gyllebosjön Simrishamn 2011 1398561 6164715 1 Yes 0 0 0 0,0000 0 0 0HVO Hallands väderö Båstad 2010 1300340 6261335 10 No Present 2002 KA 4,2000 Local pop. 2006 GSHSK Hanaskog Kristianstad 2011 1394599 6227323 1 Yes 0 1998 KA 0,0000 0 0 0HVK Herrevads kloster Klippan 2011 1340543 6221134 1 Yes 0 1855 KA 0,0000 0 0 0HJR Hjularöd Sjöbo 2011 1359098 6180686 1 Yes 0 0 0 0,0606 Stray capture 0 0HVD Hovdala Hässleholm 2011 1369785 6221430 1 Yes 0 0 0 0,0000 0 0 0HCB Häckeberga Lund 2010/2011 1349414 6160502 7 Yes Present 1951/1998 KA 0,0588 Stray capture 0 0KLI Klingavälsån Lund 2011 1356951 6169854 1 Yes 0 0 0 0,0294 Stray capture 0 0KLG Klinta gård Eslöv 2011 1356258 6193864 1 Yes 0 0 0 0,1875 Stray capture 0 0KLV Klåveröd Klippan 2011 1336676 6215170 1 Yes 0 0 0 0,0000 0 0 0KNT Knutstorp Svalöv 2010 1333261 6209007 1 Yes 0 0 0 0,0000 0 0 0KRH Krageholm Ystad 2010/2011 1370276 6153055 1 Yes 0 0 0 0,2941 Stray capture 0 0KRI Kristinehov Simrishamn 2011 1384259 6177820 1 Yes 0 0 0 0,0000 0 0 0KRV Kronovall Tomelilla 2011 1388557 6168313 1 Yes 0 0 0 0,0000 0 0 0KBR Kullaberg Höganäs 2011 1297012 6243494 1 Yes 0 0 0 0,0000 0 0 0KSR Kvesarum Hörby 2011 1365300 6204510 1 Yes 0 0 0 0,0000 0 0 0KVK Kvidinge k:a Klippan 2011 1328505 6227131 1 Yes 0 0 0 0,0000 0 0 0LIB Linnebjär Lund 2011 1342766 6180962 1 Yes 0 0 0 0,0000 0 0 0LIS Listarumsåsen Simrishamn 2011 1393332 6162021 1 Yes 0 0 0 0,0000 0 0 0LYB Lyby stubbskottäng Hörby 2011 1362210 6192527 1 Yes 0 0 0 0,0000 0 0 0MGL Maglö ekar Kristianstad 2011 1364513 6215991 1 Yes Present 0 0 0,0000 0 0 0MSH Maltesholm Kristianstad 2011 1386436 6198323 1 Yes 0 0 0 0,0000 0 0 0MLK Mölleröds kungsgård Hässleholm 2011 1369662 6227904 1 Yes 0 1998 KA 0,0000 0 0 0ORG Orups gård Eslöv 2011 1355222 6190180 1 Yes 0 0 0 0,0000 0 0 0OVH Ovesholm Kristianstad 2011 1387403 6209379 1 Yes 0 0 0 0,0000 0 0 0PRS Prästaskogen Lund 2011 1348882 6175258 1 Yes 0 0 0 0,0000 0 0 0PSK Pålsjöskog Helsingborg 2011 1305733 6220221 1 No 0 0 0 0,0000 0 0 0RAV Ravlunda skjutfält Simrishamn 2011 1398729 6178404 1 Yes 0 0 0 0,0000 0 0 0RSD Rosendal Helsingborg 2010 1314724 6222342 1 Yes 0 0 0 0,0000 0 0 0RSL Rosenlund Helsingborg 2011 1315847 6219228 1 Yes 0 0 0 0,0000 0 0 0RVS Rävstads golfbana Svedala 2011 1344280 6160730 1 Yes 0 0 0 0,0000 0 0 0SKH Skogshejdan Sjöbo 2011 1375657 6160007 1 Yes 0 0 0 0,1667 Stray capture 0 0SKB Skönabäck Skurup 2011 1356089 6159049 1 Yes 0 0 0 0,0000 0 0 0SNH Snogeholm Sjöbo 2010/2011 1367485 6160985 8 Yes 0 0 0 1,0526 Local pop. 0 0SPR Spannarp Helsingborg 2011 1318901 6233154 1 Yes 0 0 0 0,0000 0 0 0SPK Sporrakulla Kristianstad 2011 1403114 6241035 1 Yes 0 0 0 0,0000 0 0 0STL St. Lars Lund 2011 1335174 6175734 1 Yes 0 0 0 0,0000 0 0 0STH Stenshuvud Höganäs 2011 1403209 6170579 1 Yes 0 1997 KA 0,0000 0 0 0SVB Svabesholm Simrishamn 2011 1402113 6170985 1 Yes 0 0 0 0,0000 0 0 0SVN Svaneholm Trelleborg 2011 1352679 6154990 1 Yes 0 0 0 0,0000 0 0 0SVS Svartskylle Ystad 2011 1373420 6158756 1 Yes 0 0 0 0,3889 Stray capture 0 0SVK Svedberga kulle Helsingborg 2011 1307297 6230799 1 Yes 0 0 0 0,0000 0 0 0SDA Söderåsen Klippan 2011 1339524 6214230 2 Yes 0 0 0 0,0000 0 1882 SGNSBT Sörbytorp Kristianstad 2011 1386516 6224973 1 No Present 1998 KA 0,0000 0 0 0SDB Sövdeborg Sjöbo 2010/2011 1367450 6162987 10 Yes 0 0 0 0,8462 Local pop. 2001 MMTMK Tomarps kungsgård Klippan 2010 1330607 6227994 3 Yes Present 2002 0 0,0000 0 0 0TSP Torsebro Kristianstad 2011 1395454 6221153 1 Yes 0 1996 KA 0,0000 0 0 0TRP Torup Svedala 2010 1336249 6163287 1 Yes 0 1998 KA 0,8068 Local pop. 0 0TRO Trolle Ljungby Kristianstad - 1410555 6211555 - No - 1881 KA - 0 0 0TRH Trolleholm Svalöv 2011 1340894 6201136 1 Yes 0 0 0 0,0000 0 0 0TRN Trollenäs Eslöv 2011 1339414 6196032 1 Yes 0 0 0 0,0000 0 0 0TRL Törringelund Svedala 2011 1331184 6158998 1 Yes 0 0 0 0,0000 0 0 0UDP Uddarp Kristianstad 2011 1389990 6210885 1 Yes 0 0 0 0,0000 0 0 0VNS Vanås Kristianstad 2011 1390823 6230208 1 Yes 0 1998 KA 0,0000 0 0 0VDB Vedelsbäck, Stehag Höör - 1349155 6200155 - No - 1897 KA - 0 0 0VGH Vegeholm Ängelholm 2010 1314252 6234955 3 Yes 0 0 0 0,0000 0 0 0VRK Verkaån Simrishamn 2011 1390186 6178489 1 Yes 0 0 0 0,0000 0 0 0VAG Örtofta Lund 2011 1339436 6187053 1 Yes 0 0 0 0,0000 0 0 0ORP Örup Tomelilla 2010/2011 1381702 6155874 8 Yes 0 1936 KA 1,3636 Local pop. 1981 SGNOVK Övedskloster Sjöbo 2010/2011 1363692 6177174 14 Yes Present 1998 KA 0,8158 Local pop. 2001 MM
Coordinate(RT90_25gonV)Abbreviation Locality Municipality Year Previous
Finds of Elater ferrugineusFinds of Osmoderma eremita
2010-2011Used in 2010-2011Previous
35
References Anonymous (1992). Directive 92/43 of the Council of the European comunity on the
Conservation of habitats and wild fauna and flora Antonsson, K. (2001a). Läderbaggen (Osmoderma eremita) i Sverige 2001 – status och
utbredning Antonsson, K. (2001b). "Åtgärdsprogram för bevarande av läderbagge (Osmoderma
eremita)." Naturvårdsverket. Antonsson, K., J. Hedin, N. Jansson, S. Nilsson and T. Ranius (2003). "Occurrence of the
hermit beetle (Osmoderma eremita), in Sweden." Entomologisk Tidskrift 124(4): 225-240.
Bergman, K. O., N. Jansson, K. Claesson, M. W. Palmer and P. Milberg (2012). "How much and at what scale? Multiscale analyses as decision support for conservation of saproxylic oak beetles." Forest Ecology and Management 265: 133-141.
Blackshaw, R. P. and S. R. Vernon (2006). "Spatiotemporal stability of two beetle populations in non-farmed habitats in an agricultural landscape." Journal of Applied Ecology 43(4): 680-689.
Brunet, J. (2005). "Skånes skogar - historia, mångfald och skydd." Länsstyrelsen i Skåne län.
Dahlberg, A. and J. N. Stokland (2004). Vedlevande arters krav på substrat - sammanställning och analys av 3 600 arter
Eliasson, P. and S. G. Nilsson (1999). "Rättat efter skogens aftagande - en miljöhistorisk undersökning av den svenska eken under 1700- och 1800-talen." Bebyggelsehistorisk tidskrift 37, 33-64.
Graf, R. F., K. Bollmann, W. Suter and H. Bugmann (2005). "The importance of spatial scale in habitat models: capercaillie in the Swiss Alps." Landscape Ecology 20: 703–717.
Gärdenfors (2010). Rödlistade arter i Sverige 2010. Hannah, L., Carr, J.L. and Lankerani, A (1995). "Human disturbance and natural habitat: a
biome level analysis of a global data set." Biodivers. Conserv 2, 128-55. Hansen, V. (1966). "Biller XXIII, Smældere og Pragtbiller." Danmarks fauna(. C. E. Gads
Forlag, København): pp 36–37. Hedin, J., T. Ranius, S. G. Nilsson and H. G. Smith (2007). "Restricted dispersal in a flying
beetle assessed by telemetry." Biodiversity and Conservation 17(3): 675-684. Holt, R. D. (2002). "Food webs in space: On the interplay of dynamic instability and spatial processes." Ecological Research 17, 261–273. Jansson, N., K.-O. Bergman, M. Jonsell and P. Milberg (2009a). "An indicator system for
identification of sites of high conservation value for saproxylic oak (Quercus spp.) beetles in southern Sweden." Journal of Insect Conservation 13(4): 399-412.
Jansson, N., T. Ranius, A. Larsson and P. Milberg (2009b). "Boxes mimicking tree hollows can help conservation of saproxylic beetles." Biodiversity and Conservation 18(14): 3891-3908.
Johnson, D. M., A. M. Liebhold, P. C. Tobin and O. N. Bjornstad (2006). "Allee effects and pulsed invasion by the gypsy moth." Nature 444(7117): 361-363.
Larsson, M., B. Forsmark and G. Svensson (unpublished).
36
Larsson, M., G. Svensson and N. Ryrholm (2009). "Monitoring rare and threatened insects with pheromone attractants." In: Samways MJ, New T, McGeoch M (eds) Insect Conservation: A Handbook of Approaches and Methods. Oxford University Press, Oxford, UK, pp 114-116
Larsson, M. C. and G. P. Svensson (2011). "Monitoring spatiotemporal variation in abundance and dispersal by a pheromone-kairomone system in the threatened saproxylic beetles Osmoderma eremita and Elater ferrugineus." Journal of Insect Conservation 15(6): 891-902.
Lawrence, E. (2008). Henderson´s dictionary of biology. Levin, S. A. (1992). "The Problem of Pattern and Scale in Ecology: The Robert H.
MacArthur Award Lecture." Ecology 73(6): 1943-1967. Molander, M. (2006). "Uppdatering av hålträdsknäpparnas (Col. Elateridae) lokaler i
Skåne." Fazett 19:2. Musa, N., P. Milberg and K. Bergman (unpublished). "Master thesis in prep. Linköping
university." Nieto, A. and K. N. A. Alexander (2010). "European red list of Saproxylic beetles."
Luxembourg: Publications Office of the European Union. Niklasson, M. N. S. (2005). Skogsdynamik och arters bevarande. Nilsson, S. G. and R. Baranowski (1994). "Indicators of megatree continuity – Swedish
distribution of click beetles (Coleoptera, E. ferrugineusidae) dependent on hollow trees.". Entomologisk Tidskrift 115: 81–97.
Palm, T. (1955). "Bidrag till kännedom om svenska skalbaggars biologi och systematik." Entomogisk tidskrift 76: 143-144
Ranius, T. (2000). "Minimum viable metapopulation size of a beetle, Osmoderma eremita , living in tree hollows." Animal Conservation 3(1): 37-43.
Ranius, T. (2001). "Constancy and asynchrony of Osmoderma eremita populations in tree hollows." Oecologia 126(2): 208-215.
Ranius, T. (2002a). "Influence of stand size and quality of tree hollows on saproxylic beetles in Sweden." Biological Conservation 103(1): 85-91.
Ranius, T. (2002b). "Osmoderma eremita as an indicator of species richness of beetles in tree hollows." Biodiversity & Conservation 11(5): 931-941.
Ranius, T., L. O. Aguado, K. Antonsson, P. Audisio, A. Ballerio, G. M. Carpaneto, K. Chobot, B. Gjurasin, O. Hanssen, H. Huijbregts, F. Lakatos, O. Martin, Z. Neculiseanu, N. B. Nikitsky, W. Paill, A. Pirnat, V. Rizun, A. Ruicanescu, J. Stegner, I. Süda, P. Szwalko, V. Tamutis, D. Telnov, V. Tsinkevich, V. Vignon, V. Versteirt, M. Vögeli and P. Zach (2005). "Osmoderma eremita (Coleoptera, Scarabaeidae, Cetoniinae) in Europe." Animal Biodiversity and Conservation 28(1): 1-44.
Ranius, T. and J. Hedin (2001). "The dispersal rate of a beetle, Osmoderma eremita , living in tree hollows." Oecologia 126(3): 363-370.
Ranius, T. and N. Jansson (2000). "The influence of forest regrowth, original canopy cover and tree size on saproxylic beetles associated with old oaks." Biological Conservation 95(1): 85-94.
Ranius, T. and N. Jansson (2002). "A comparison of three methods to survey saproxylic beetles in hollow oaks." Biodiversity & Conservation 11(10): 1759-1771.
Ranius, T., V. Johansson and L. Fahrig (2011). "Predicting spatial occurrence of beetles and pseudoscorpions in hollow oaks in southeastern Sweden." Biodiversity and Conservation 20(9): 2027-2040.
37
Ranius, T., M. Niklasson and N. Berg (2009). "Development of tree hollows in pedunculate oak (Quercus robur)." Forest Ecology and Management 257(1): 303-310.
Ranius, T. and S. G. Nilsson (1997). "Habitat of Osmoderma eremita Scop. (Coleoptera: Scarabaeidae), a beetle living in hollow trees." Journal of Insect Conservation 1(4): 193-204.
Speight, M. (1989). "Saproxylic invertebrates and their conservation." Council of Europe, Publications and Documents Division, Strasbourg. Nature Environ Series 42:1-79.
Svensson, G. P. and M. C. Larsson (2008). "Enantiomeric specificity in a pheromone-kairomone system of two threatened saproxylic beetles, Osmoderma eremita and Elater ferrugineus." Journal of Chemical Ecology 34(2): 189-197.
Svensson, G. P., M. C. Larsson and J. Hedin (2003). "Air sampling of its pheromone to monitor the occurrence of Osmoderma eremita, a threatened beetle inhabiting hollow trees." Journal of Insect Conservation 7(4): 189-198.
Svensson, G. P., M. C. Larsson and J. Hedin (2004). "Attraction of the Larval Predator Elater ferrugineus to the Sex Pheromone of Its Prey, Osmoderma eremita, and Its Implication for Conservation Biology." Journal of Chemical Ecology 30(2): 353-363.
Svensson, G. P., C. Liedtke, E. Hedenström, P. Breistein, J. Bång and M. C. Larsson (2011a). "Chemical ecology and insect conservation: optimising pheromone-based monitoring of the threatened saproxylic click beetle Elater ferrugineus." Journal of Insect Conservation.
Svensson, G. P., A. Oleksa, R. Gawronski, J.-M. Lassance and M. C. Larsson (2009). "Enantiomeric conservation of the male-produced sex pheromone facilitates monitoring of threatened European hermit beetles (Osmoderma spp.)." Entomologia Experimentalis et Applicata 133(3): 276-282.
Svensson, G. P., U. Sahlin, B. Brage and M. C. Larsson (2011b). "Should I stay or should I go? Modelling dispersal strategies in saproxylic insects based on pheromone capture and radio telemetry: a case study on the threatened hermit beetle Osmoderma eremita." Biodiversity and Conservation 20(13): 2883-2902.
Thomas, J. A., M. G. Telfer, D. B. Roy, C. D. Preston, J. J. D. Greenwood, J. Asher, R. Fox, R. T. Clarke and J. H. Lawton (2004). "Comparative Losses of British Butterflies, Birds, and Plants and the Global Extinction Crisis." Science 303(5665): 1879-1881.
Tolasch, T., M. Fragstein and J. L. M. Steidle (2007). "Sex pheromone of Elater ferrugineus L. (Coleoptera: Elateridae)." Journal of Chemical Ecology 33(11): 2156-2166.
Witzgall, P., P. Kirsch and A. Cork (2010). "Sex Pheromones and Their Impact on Pest Management." Journal of Chemical Ecology 36(1): 80-100.
Åberg, J., G. Jansson, J. E. Swenson and P. Angelstam (1995). "The Effect of Matrix on the Occurrence of Hazel Grouse (Bonasa bonasia) in Isolated Habitat Fragments." Oecologia 103(3): 265-269.