el futurode la eólicamarina flotanteenespaña the iberian
TRANSCRIPT
The Iberian region as a hub for technology development and industrial leadership in the field of floating offshore wind
Javier Sanz. December 22nd, 2020. AEE Webinar
El futuro de la eólica marina flotante en España
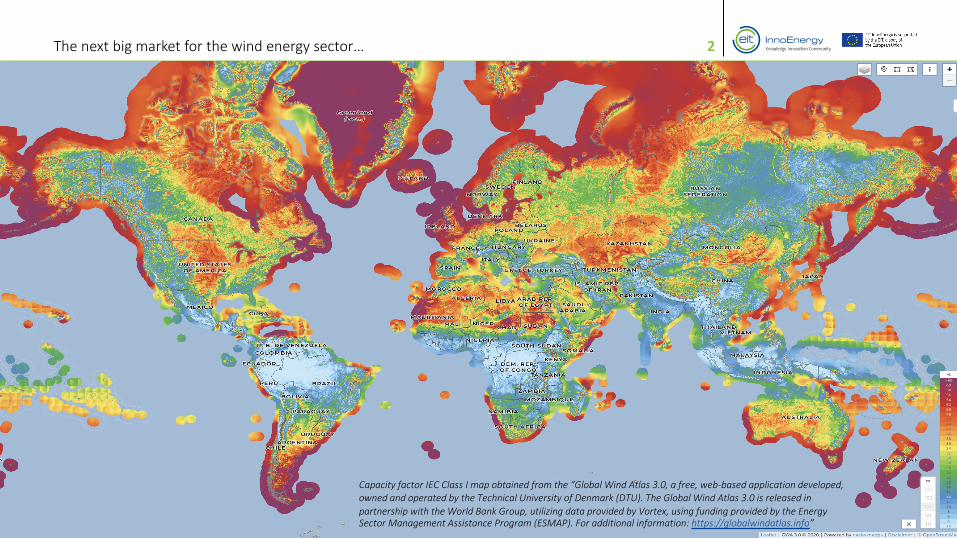
2The next big market for the wind energy sector…
Capacity factor IEC Class I map obtained from the “Global Wind Atlas 3.0, a free, web-based application developed, owned and operated by the Technical University of Denmark (DTU). The Global Wind Atlas 3.0 is released in partnership with the World Bank Group, utilizing data provided by Vortex, using funding provided by the EnergySector Management Assistance Program (ESMAP). For additional information: https://globalwindatlas.info”
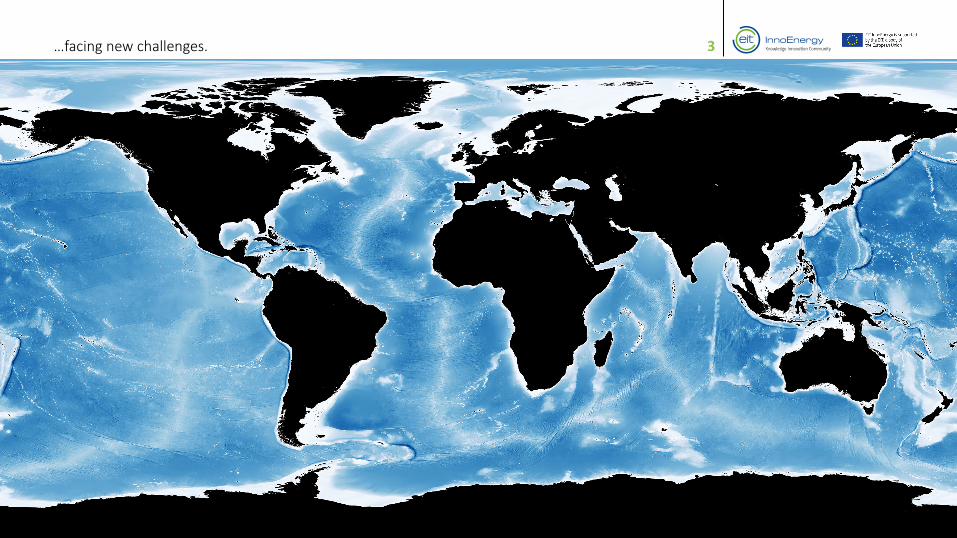
3…facing new challenges.
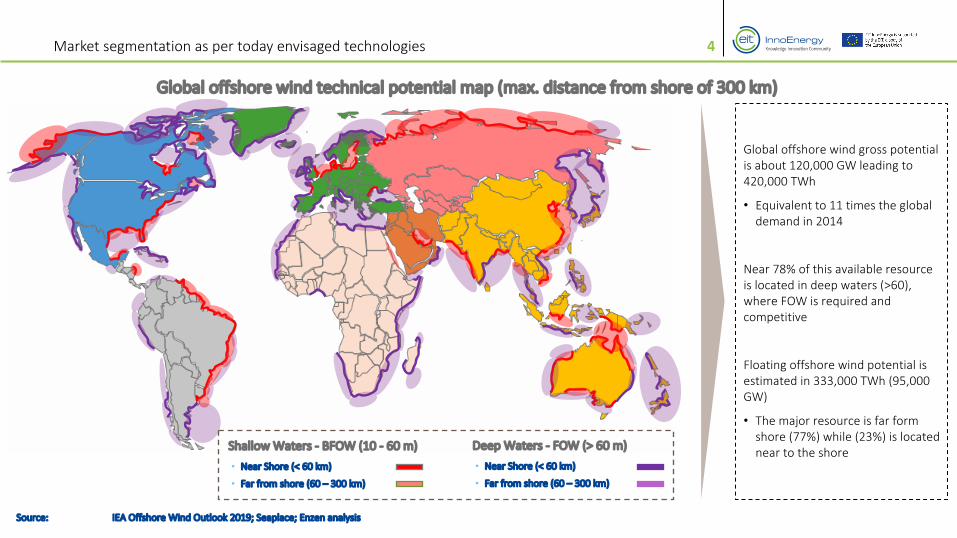
4Market segmentation as per today envisaged technologies
Global offshore wind technical potential map (max. distance from shore of 300 km)
Shallow Waters - BFOW (10 - 60 m)
• Near Shore (< 60 km)
• Far from shore (60 – 300 km)
Deep Waters - FOW (> 60 m)
• Near Shore (< 60 km)
• Far from shore (60 – 300 km)
Global offshore wind gross potential is about 120,000 GW leading to 420,000 TWh
• Equivalent to 11 times the global demand in 2014
Near 78% of this available resource is located in deep waters (>60), where FOW is required and competitive
Floating offshore wind potential is estimated in 333,000 TWh (95,000 GW)
• The major resource is far form shore (77%) while (23%) is located near to the shore
Source: IEA Offshore Wind Outlook 2019; Seaplace; Enzen analysis
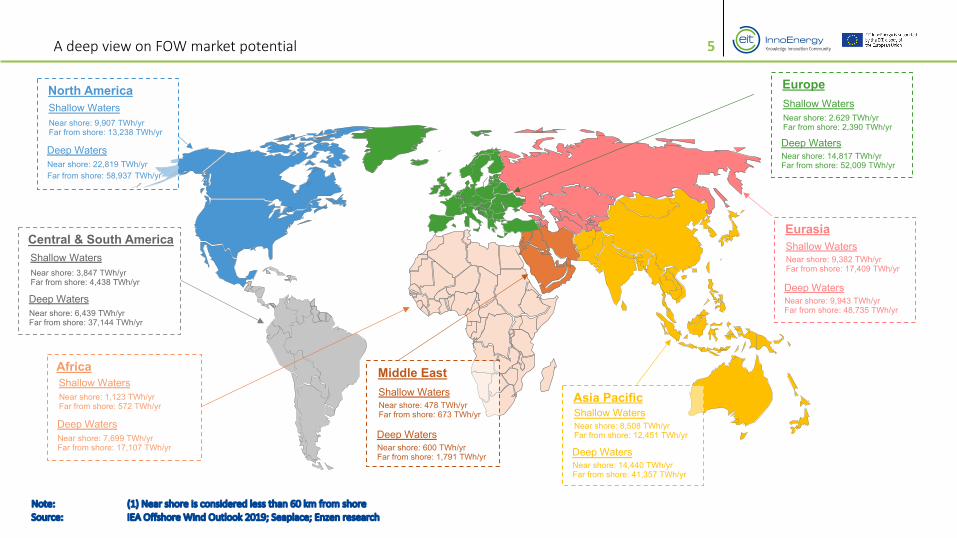
5A deep view on FOW market potential
Note: (1) Near shore is considered less than 60 km from shoreSource: IEA Offshore Wind Outlook 2019; Seaplace; Enzen research
North AmericaShallow WatersNear shore: 9,907 TWh/yrFar from shore: 13,238 TWh/yr
Deep WatersNear shore: 22,819 TWh/yrFar from shore: 58,937 TWh/yr
Central & South AmericaShallow WatersNear shore: 3,847 TWh/yrFar from shore: 4,438 TWh/yr
Deep WatersNear shore: 6,439 TWh/yrFar from shore: 37,144 TWh/yr
Near shore: 14,817 TWh/yrFar from shore: 52,009 TWh/yr
Deep Waters
EuropeShallow WatersNear shore: 2.629 TWh/yrFar from shore: 2,390 TWh/yr
EurasiaShallow WatersNear shore: 9,382 TWh/yrFar from shore: 17,409 TWh/yr
Deep WatersNear shore: 9,943 TWh/yrFar from shore: 48,735 TWh/yr
AfricaShallow WatersNear shore: 1,123 TWh/yrFar from shore: 572 TWh/yr
Deep WatersNear shore: 7,699 TWh/yrFar from shore: 17,107 TWh/yr
Shallow Waters
Deep Waters
Middle East
Near shore: 478 TWh/yrFar from shore: 673 TWh/yr
Near shore: 600 TWh/yrFar from shore: 1,791 TWh/yr
Asia PacificShallow WatersNear shore: 8,508 TWh/yrFar from shore: 12,451 TWh/yr
Deep WatersNear shore: 14,440 TWh/yrFar from shore: 41,357 TWh/yr

6Market as per today: From what has already been deployed…
Source: Seaplace; Enzen analysis
Geographical distribution of projects full-scale demonstrators and pre-commercial stage projects
Windfloat Atlantic, 25 MW (2020)Tech.: Windfloat
Hywind Scotland, 30 MW (2017)Tech.: Hywind
Floatgen, 2 MW (2018)Tech.: Damping pool
Kincardine, 50 MW (2020)Tech.: Windfloat Stiesdal, 3.6 MW (2020)
Tech.: Tetraspar
GICON Demo, 2.3 MW (2017)Tech.: GICON-SOF
Hibiki, 3 MW (2019)Tech.: Damping Pool
Goto Sakiyama, 2 MW (2016)Tech.: TODA Spar
Fukushima FORWARD II, 12 MW (2015)Tech.: Advanced Spar (5 MW)
Tech.: V-shape semi-sub (7 MW)
Fukushima FORWARD I, 2 MW (2013)Tech.: Compact semi-sub
Already commissioned projects
Projects to be commissioned in the near future (2020)
Nezzy, 6 MW (2020)Tech.: SCDnezzy2
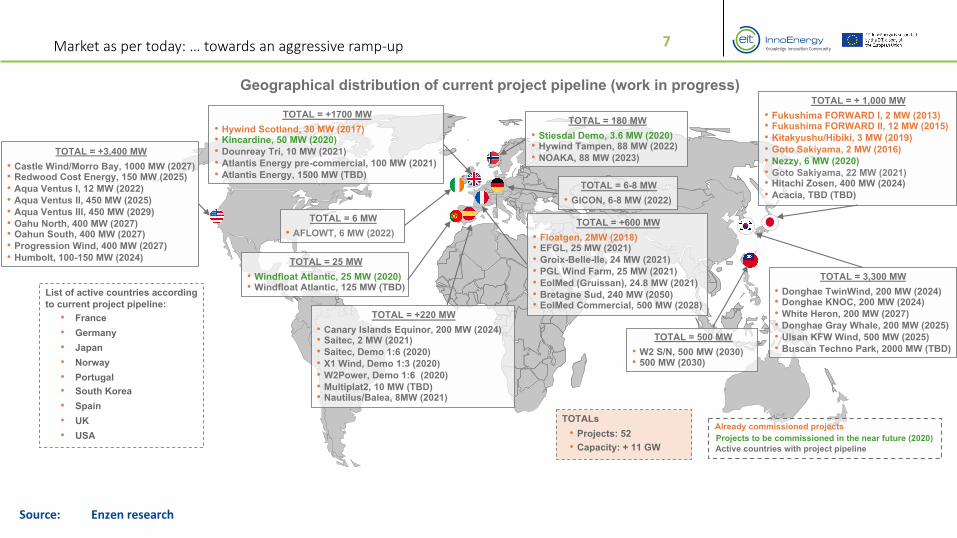
7Market as per today: … towards an aggressive ramp-up
Source: Enzen research
TOTAL = 25 MW• Windfloat Atlantic, 25 MW (2020)• Windfloat Atlantic, 125 MW (TBD)
Geographical distribution of current project pipeline (work in progress)
TOTAL = +3,400 MW• Castle Wind/Morro Bay, 1000 MW (2027)• Redwood Cost Energy, 150 MW (2025)• Aqua Ventus I, 12 MW (2022)• Aqua Ventus II, 450 MW (2025)• Aqua Ventus III, 450 MW (2029)• Oahu North, 400 MW (2027)• Oahun South, 400 MW (2027)• Progression Wind, 400 MW (2027)• Humbolt, 100-150 MW (2024)
TOTAL = 3,300 MW• Donghae TwinWind, 200 MW (2024)• Donghae KNOC, 200 MW (2024)• White Heron, 200 MW (2027)• Donghae Gray Whale, 200 MW (2025)• Ulsan KFW Wind, 500 MW (2025)• Buscan Techno Park, 2000 MW (TBD)
TOTAL = + 1,000 MW• Fukushima FORWARD I, 2 MW (2013)• Fukushima FORWARD II, 12 MW (2015)• Kitakyushu/Hibiki, 3 MW (2019)• Goto Sakiyama, 2 MW (2016)• Nezzy, 6 MW (2020)• Goto Sakiyama, 22 MW (2021)• Hitachi Zosen, 400 MW (2024)• Acacia, TBD (TBD)
List of active countries according to current project pipeline:• France• Germany• Japan• Norway• Portugal• South Korea• Spain• UK• USA
TOTAL = +1700 MW• Hywind Scotland, 30 MW (2017)• Kincardine, 50 MW (2020)• Dounreay Tri, 10 MW (2021)• Atlantis Energy pre-commercial, 100 MW (2021)• Atlantis Energy, 1500 MW (TBD)
Already commissioned projects
Active countries with project pipelineProjects to be commissioned in the near future (2020)
TOTAL = +600 MW• Floatgen, 2MW (2018)• EFGL, 25 MW (2021)• Groix-Belle-Ile, 24 MW (2021)• PGL Wind Farm, 25 MW (2021)• EolMed (Gruissan), 24.8 MW (2021)• Bretagne Sud, 240 MW (2050)• EolMed Commercial, 500 MW (2028)
TOTAL = +220 MW• Canary Islands Equinor, 200 MW (2024)• Saitec, 2 MW (2021)• Saitec, Demo 1:6 (2020)• X1 Wind, Demo 1:3 (2020)• W2Power, Demo 1:6 (2020)• Multiplat2, 10 MW (TBD)• Nautilus/Balea, 8MW (2021)
TOTAL = 6-8 MW• GICON, 6-8 MW (2022)
TOTAL = 180 MW• Stiesdal Demo, 3.6 MW (2020)• Hywind Tampen, 88 MW (2022)• NOAKA, 88 MW (2023)
TOTALs• Projects: 52• Capacity: + 11 GW
TOTAL = 6 MW• AFLOWT, 6 MW (2022)
TOTAL = 500 MW• W2 S/N, 500 MW (2030)• 500 MW (2030)

8Potential market in the Iberian region
Source: WindEurope; Enzen analysis
0
5
10
15
20
25
2020 2025 2030 2035 2040 2045 2050
GW
CAGR2020-2030
CAGR2030-2050
High scenario
61.4% 10.5%
Low scenario
44.6% 12.7%
WindEurope estimates that the Iberian region could install up to 22 GW of FOW by 2050, 13 GW in Spain and 9 GW in Portugal; accounting for 10% of the expected global market

9Broad technology classification
Note: TLP stands for tension leg platformSource: WindEurope; Seaplace; Enzen research
Spar buoy Semisubmersible TLP1
Barges Hybrids Game changers
Dev
elop
ed c
once
pts
(inhe
rited
fr
om o
il an
d ga
s in
dust
ry)
Classification of main FOW technologies
Nov
el c
once
pts
TRL and MRL levels for FOW technologies
1 2 3 4 5 6 7 8 9
SemiSpar
Barge
9
8
7
6
5
4
3
2
1
0
Commercial wind farm (> 200 MW farm)
Commercial wind farm(< 200 MW farm)
Pre-commercial array(several turbines; < 50 MW array)
Full-scale demonstrator(in operational environment)
Big-scale demonstrator(in relevant environment)
Small-scale demonstrator(in relevant environment)
Laboratory and tank testing
Technology readiness level (TRL) – European Commission
Mar
ket r
eadi
ness
leve
l (M
RL) –
Win
dEur
ope
Technology research, design and development to prove
feasibility
Pre-
com
mer
cial
syst
em
Full-
scal
e de
mon
stra
tor
(in o
pera
tiona
l env
ironm
ent)
Smal
l-sca
le d
emon
stra
tor
(in re
leva
nt e
nviro
nmen
t)
Smal
l-sca
le p
roto
type
(tan
k te
stin
g)
Com
mer
cial
sys
tem
Labo
rato
ry te
stin
g
TLPHybrid
Game c.
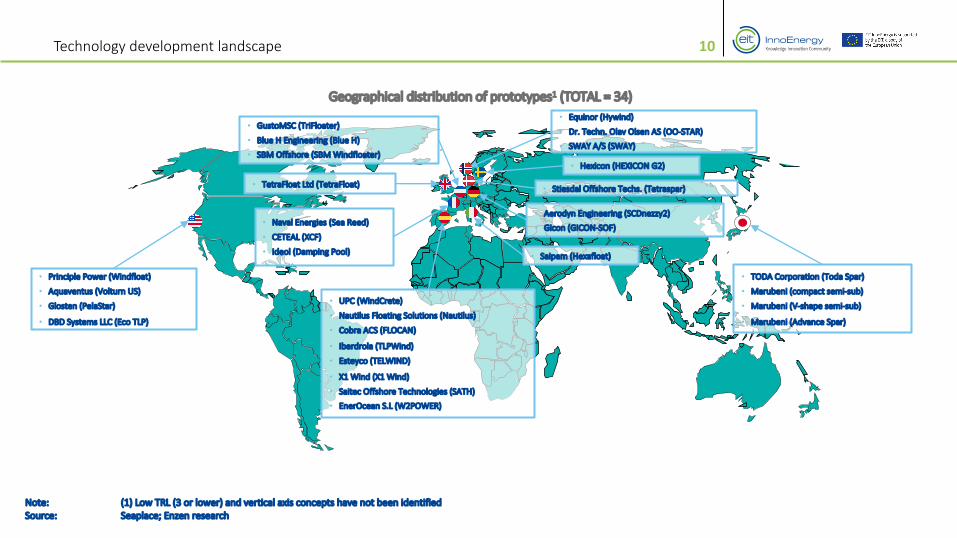
10Technology development landscape
Geographical distribution of prototypes1 (TOTAL = 34)
• UPC (WindCrete)
• Nautilus Floating Solutions (Nautilus)
• Cobra ACS (FLOCAN)
• Iberdrola (TLPWind)
• Esteyco (TELWIND)
• X1 Wind (X1 Wind)
• Saitec Offshore Technologies (SATH)
• EnerOcean S.L (W2POWER)
• Equinor (Hywind)
• Dr. Techn. Olav Olsen AS (OO-STAR)
• SWAY A/S (SWAY)
• TODA Corporation (Toda Spar)
• Marubeni (compact semi-sub)
• Marubeni (V-shape semi-sub)
• Marubeni (Advance Spar)
• Principle Power (Windfloat)
• Aquaventus (Volturn US)
• Glosten (PelaStar)
• DBD Systems LLC (Eco TLP)
• GustoMSC (TriFloater)
• Blue H Engineering (Blue H)
• SBM Offshore (SBM Windfloater)
• Stiesdal Offshore Techs. (Tetraspar)
• Naval Energies (Sea Reed)
• CETEAL (XCF)
• Ideol (Damping Pool)
• Aerodyn Engineering (SCDnezzy2)
• Gicon (GICON-SOF)
• Saipem (Hexafloat)
• TetraFloat Ltd (TetraFloat)
• Hexicon (HEXICON G2)
Note: (1) Low TRL (3 or lower) and vertical axis concepts have not been identifiedSource: Seaplace; Enzen research

11Technology development landscape
Note: (1) Low TRL (3 or lower) and vertical axis concepts have not been identified; (2) Underlined concepts indicate those at full-scale demonstration or pre-commercial array stagesSource: Seaplace; Enzen research
Spar buoy (SP) Semi-submers. TLP Novel conceptsDeveloped concepts
• Hywind
• Advanced Spar
• SWAY
• Windfloat
• Nautilus
• Fuk. Mirai
• Fuk. Shimpuu
• Sea Reed
• Tri-Floater
• TLPWind
• PelaStar
• Blue H
• GICON-SOF
• SBM windfloater
• Damping Pool
• Tetraspar
• X1Wind
• TetraFloat
• W2Power
• Hexicon G2
• Hexafloat
• Hywind Tampen
• Toda Spar
• Windcrete
• FLOCAN
• OO-STAR
• Sea Reed
• VolturnUS
• XCF
• ECO TLP
• Damping Pool
• TelWind
• SATH
• SCDnezzy2
Classification of FOW concepts1 according to the construction material (TOTAL = 34)
Advantages Disadvantages
Conc
rete
• Higher local content
• Lower cost of raw material per tonne
• Longer service life
• Increases mass and size of substructure
• Requires larger investment in quayside facilities for manufacturing
• Subject to environmental sensitives during manufacturing (e.g., frost, heavy rain)
• Curing time requirements
Stee
l
• Proven technology (longer history of being used offshore in BFOW and oil and gas industry)
• Easier to recycle
• Subject to corrosion
• Higher cost of raw material per tonne
• Subject to price volatility
Ʃ = 6
Ʃ = 11
Ʃ = 6
Ʃ = 11
Ʃ =
13Ʃ
= 21
Main advantages and disadvantages of construction materials for floating structures
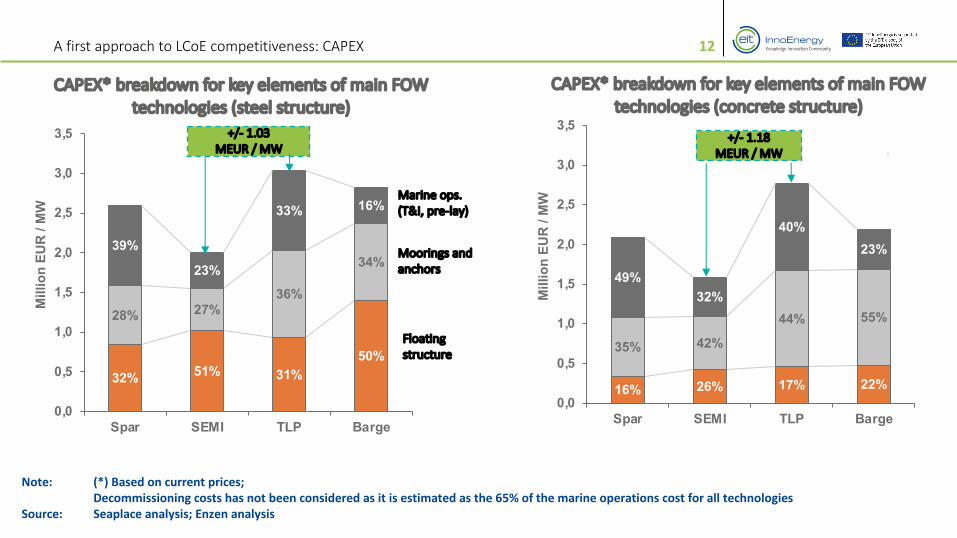
12A first approach to LCoE competitiveness: CAPEX
CAPEX* breakdown for key elements of main FOW technologies (steel structure)
Note: (*) Based on current prices; Decommissioning costs has not been considered as it is estimated as the 65% of the marine operations cost for all technologies
Source: Seaplace analysis; Enzen analysis
32% 51% 31%50%
28% 27%36%
34%39%
23%
33% 16%
0,0
0,5
1,0
1,5
2,0
2,5
3,0
3,5
Spar SEMI TLP Barge
Mill
ion
EUR
/ M
W
16% 26% 17% 22%
35% 42%
44% 55%
49%32%
40%23%
0,0
0,5
1,0
1,5
2,0
2,5
3,0
3,5
Spar SEMI TLP Barge
Mill
ion
EUR
/ M
W
CAPEX* breakdown for key elements of main FOW technologies (concrete structure)
Moorings and anchors
Floating structure
Marine ops.(T&I, pre-lay)
+/- 1.03 MEUR / MW
+/- 1.18 MEUR / MW

13A first approach to LCoE competitiveness: Where we stand
Note: (1) Based on current prices; (2) Expected target strike prices for a 250 MW project in Brittany (120 EUR/MWh) and a 250 MW project in the Mediterranean (110 EUR/MWh); LCOE values do not take into account development costs, therefore they are comparable to the LCOE figures from public tenders in France
Source: Beiter, P., Musial, W., et al. (2016), A Spatial-Economic Cost-Reduction Pathway Analysis for US Offshore Wind Energy Development from 2015–2030; Myhr A., Bjerkseter C., Ågotnes A. and Nygaard T. (2014), Levelised cost of energy for offshore floating wind turbines in a life cycle perspective; Seaplace analysis; Enzen analysis
LCOE comparison for FOW technologies1
142 135
193177
120 115
171147
0
50
100
150
200
250
300
Spar SEMI TLP BargeEU
R /
MW
h
Max.276
Min.86
Additional assumptions for LCOE calc.:
WACC: 4.0% (real; after-tax)
Capital recovery factor (CRF): 7.4%
Fixed charge rate (FCR): 8.2%
Net average annual energy production (AEPnet)
• Depends on the capacity factor for each technology
Range calculation
• Upper case: + 43% from base case
• Lower case: - 25% from base case
Conc
rete
Stee
l
Expected tenders in France (2021-2022)2
Conc
rete
Conc
rete
Conc
rete
Stee
l
Stee
l
Stee
l
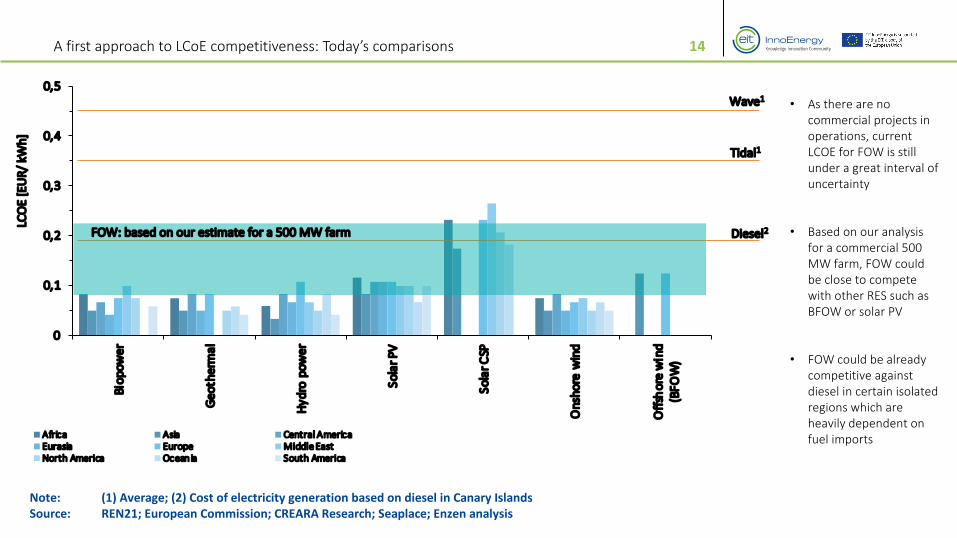
14A first approach to LCoE competitiveness: Today’s comparisons
Note: (1) Average; (2) Cost of electricity generation based on diesel in Canary IslandsSource: REN21; European Commission; CREARA Research; Seaplace; Enzen analysis
0
0,1
0,2
0,3
0,4
0,5
Biop
ower
Geo
ther
mal
Hyd
ro p
ower
Sola
r PV
Sola
r CSP
Ons
hore
win
d
Off
shor
e w
ind
(BFO
W)
LCO
E [E
UR/
kW
h]
Africa Asia Central AmericaEurasia Europe Middle EastNorth America Oceania South America
Tidal1
Wave1
Diesel2FOW: based on our estimate for a 500 MW farm
• As there are no commercial projects in operations, current LCOE for FOW is still under a great interval of uncertainty
• Based on our analysis for a commercial 500 MW farm, FOW could be close to compete with other RES such as BFOW or solar PV
• FOW could be already competitive against diesel in certain isolated regions which are heavily dependent on fuel imports
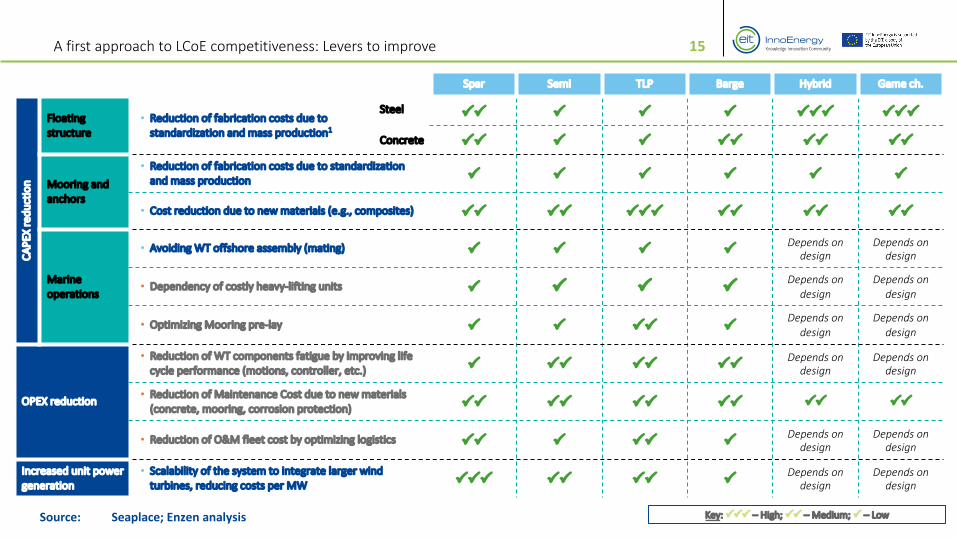
15A first approach to LCoE competitiveness: Levers to improve
Spar Semi TLP Barge Hybrid Game ch.
CAPE
X re
duct
ion
Floating structure
• Reduction of fabrication costs due to standardization and mass production1
PP P P P PPP PPP
PP P P PP PP PP
Mooring and anchors
• Reduction of fabrication costs due to standardization and mass production P P P P P P
• Cost reduction due to new materials (e.g., composites) PP PP PPP PP PP PP
Marine operations
• Avoiding WT offshore assembly (mating) P P P PDepends on
designDepends on
design
• Dependency of costly heavy-lifting units P P P PDepends on
designDepends on
design
• Optimizing Mooring pre-lay P P PP PDepends on
designDepends on
design
OPEX reduction
• Reduction of WT components fatigue by improving life cycle performance (motions, controller, etc.) P PP PP PP
Depends on design
Depends on design
• Reduction of Maintenance Cost due to new materials (concrete, mooring, corrosion protection) PP PP PP PP PP PP
• Reduction of O&M fleet cost by optimizing logistics PP P PP PDepends on
designDepends on
design
Increased unit power generation
• Scalability of the system to integrate larger wind turbines, reducing costs per MW PPP PP PP P
Depends on design
Depends on design
Key: PPP – High; PP – Medium; P – LowSource: Seaplace; Enzen analysis
Steel
Concrete
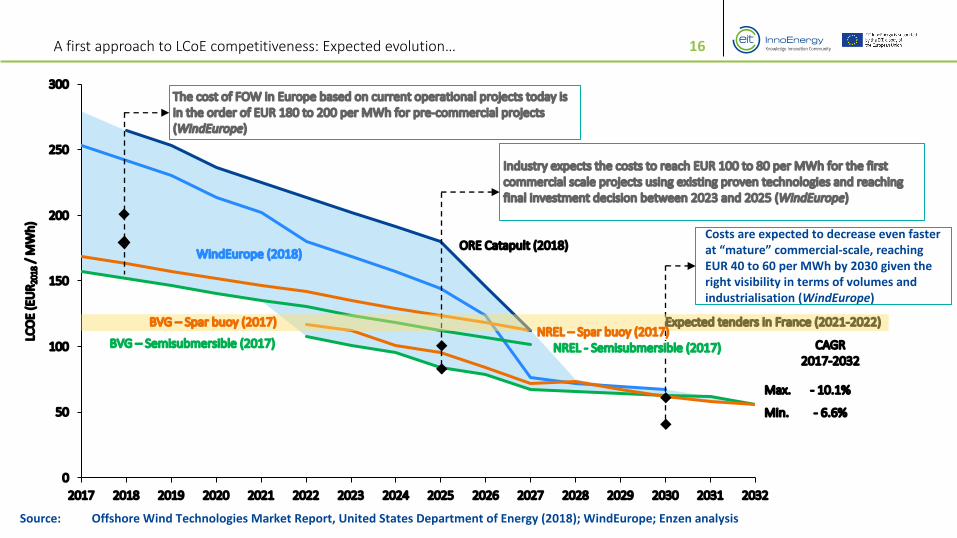
16A first approach to LCoE competitiveness: Expected evolution…
0
50
100
150
200
250
300
2017 2018 2019 2020 2021 2022 2023 2024 2025 2026 2027 2028 2029 2030 2031 2032
LCO
E (E
UR 2
018
/ MW
h)
Source: Offshore Wind Technologies Market Report, United States Department of Energy (2018); WindEurope; Enzen analysis
WindEurope (2018)ORE Catapult (2018)
CAGR2017-2032
Max. - 10.1%
Min. - 6.6%
Costs are expected to decrease even faster at “mature” commercial-scale, reaching EUR 40 to 60 per MWh by 2030 given the right visibility in terms of volumes and industrialisation (WindEurope)
Industry expects the costs to reach EUR 100 to 80 per MWh for the first commercial scale projects using existing proven technologies and reaching final investment decision between 2023 and 2025 (WindEurope)
The cost of FOW in Europe based on current operational projects today is in the order of EUR 180 to 200 per MWh for pre-commercial projects (WindEurope)
Expected tenders in France (2021-2022)BVG – Spar buoy (2017)
BVG – Semisubmersible (2017) NREL - Semisubmersible (2017)NREL – Spar buoy (2017)
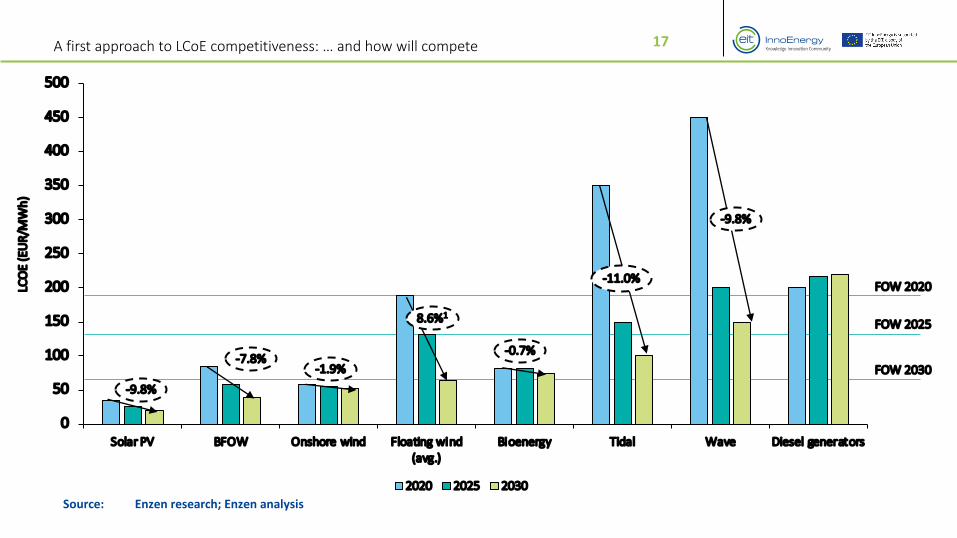
17A first approach to LCoE competitiveness: … and how will compete
Source: Enzen research; Enzen analysis
0
50
100
150
200
250
300
350
400
450
500
Solar PV BFOW Onshore wind Floating wind(avg.)
Bioenergy Tidal Wave Diesel generators
2020 2025 2030
LCO
E (E
UR/
MW
h)
-7.8%-1.9%
-9.8%
-0.7%
8.6%1
-9.8%
-11.0%FOW 2020
FOW 2025
FOW 2030
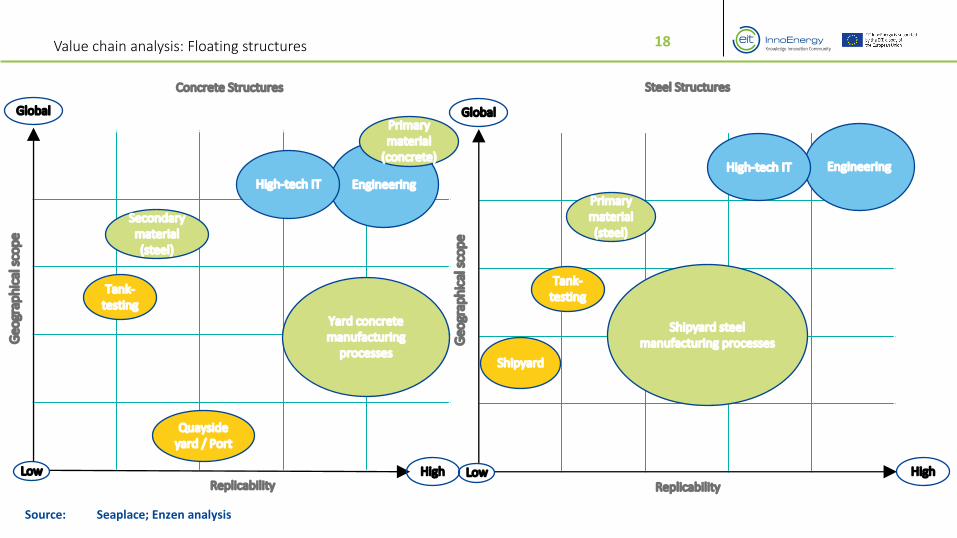
18Value chain analysis: Floating structures
Source: Seaplace; Enzen analysis
Shipyard steel manufacturing processes
Replicability
Geo
grap
hica
l sco
pe
Global
HighLow
Tank-testing
Engineering
Primary material (steel)
High-tech IT
Shipyard
Replicability
Geo
grap
hica
l sco
pe
Global
HighLow
Tank-testing
Engineering
Secondary material (steel)
High-tech IT
Quayside yard / Port
Yard concrete manufacturing
processes
Primary material
(concrete)
Concrete Structures Steel Structures

19Value chain analysis: WTG, Mooring Lines and Anchors
Source: Seaplace; Enzen analysis
Replicability
Geo
grap
hica
l sco
pe
Global
HighLow
Tank-testing
Engineering
Primary material (synthetic fibres)
High-tech IT
Anchor manufacturing
facilities
Primary material (steel)
Shipyard storage facilities
Synthetic ropes manufacturing
facilities
Steel chain manufacturing
facilities
Replicability
Geo
grap
hica
l sco
pe
Global
HighLow
Offshore WT
Research centres
TowerMechanical
parts
Blades
Power generator
Nacelleassembly
Direct-drive generator1
Gearbox
Power electronics
Mooring Lines & Anchors
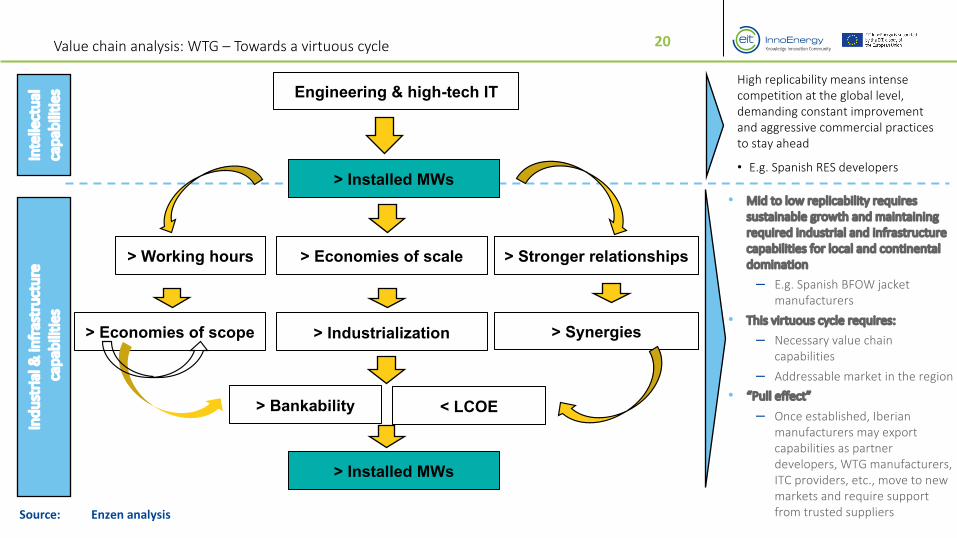
20Value chain analysis: WTG – Towards a virtuous cycle
Source: Enzen analysis
> Installed MWs
> Stronger relationships
> Economies of scope
> Economies of scale> Working hours
> Industrialization > Synergies
> Bankability < LCOE
Engineering & high-tech ITHigh replicability means intense competition at the global level, demanding constant improvement and aggressive commercial practices to stay ahead
• E.g. Spanish RES developers
• Mid to low replicability requires sustainable growth and maintaining required industrial and infrastructure capabilities for local and continental domination
‒ E.g. Spanish BFOW jacket manufacturers
• This virtuous cycle requires:
‒ Necessary value chain capabilities
‒ Addressable market in the region• “Pull effect”
‒ Once established, Iberian manufacturers may export capabilities as partner developers, WTG manufacturers, ITC providers, etc., move to new markets and require support from trusted suppliers
Indu
stria
l & in
fras
truc
ture
capa
bilit
ies
Inte
llect
ual
capa
bilit
ies
> Installed MWs

21Value chain analysis: Iberian region – RTO active players
Source: AEE, Seaplace, Enzen research
WTG designand testing
Software / IT / Big Data
Control systemsand operation
New materials for wind power
Mechanical components and other structural elements
Offshore wind
AICIA X X
AIMEN X X
AIMPLAS X
CARTIF X
CENER X X X
CIEMAT X X
CIRCE X
CTC X X X
CTME X
EURECAT X X
IK4-Research Alliance X X X X
ITC X X X
ITE X
ITER X
TECNALIA X X X X X
WAVEC X X X
There are other centres with activities connected to wind as well as private companies with R&D centres such as Vestas (Portugal), Gamesa (Spain), or Arteche (Spain).
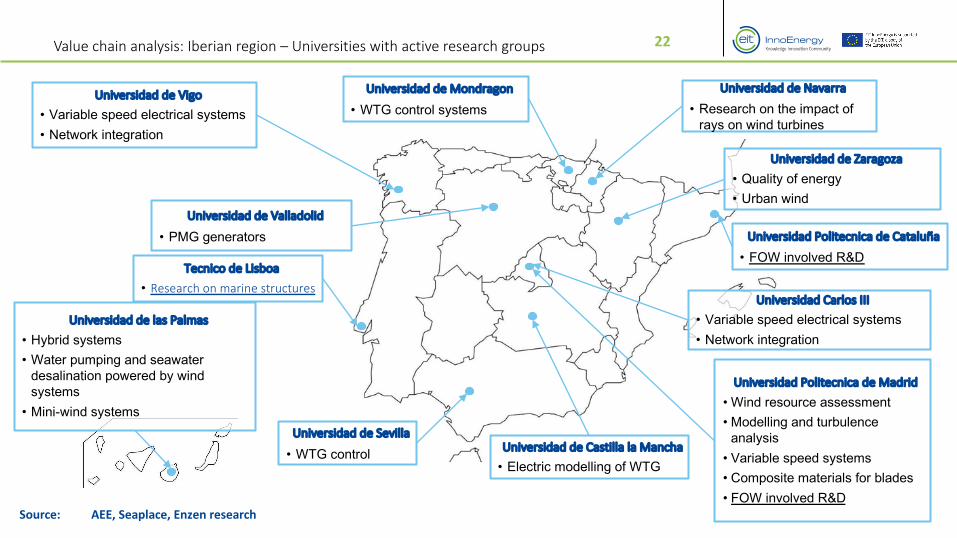
22Value chain analysis: Iberian region – Universities with active research groups
Source: AEE, Seaplace, Enzen research
Universidad de Sevilla
• WTG control
Universidad de Zaragoza
• Quality of energy• Urban wind
Universidad de las Palmas
• Hybrid systems• Water pumping and seawater
desalination powered by wind systems
• Mini-wind systems
Universidad de Valladolid
• PMG generators
Universidad de Castilla la Mancha
• Electric modelling of WTG
Universidad Carlos III
• Variable speed electrical systems• Network integration
Universidad Politecnica de Madrid
• Wind resource assessment• Modelling and turbulence
analysis • Variable speed systems• Composite materials for blades• FOW involved R&D
Universidad Politecnica de Cataluña
• FOW involved R&D
Universidad de Vigo
• Variable speed electrical systems• Network integration
Universidad de Navarra
• Research on the impact of rays on wind turbines
Universidad de Mondragon
• WTG control systems
Tecnico de Lisboa
• Research on marine structures
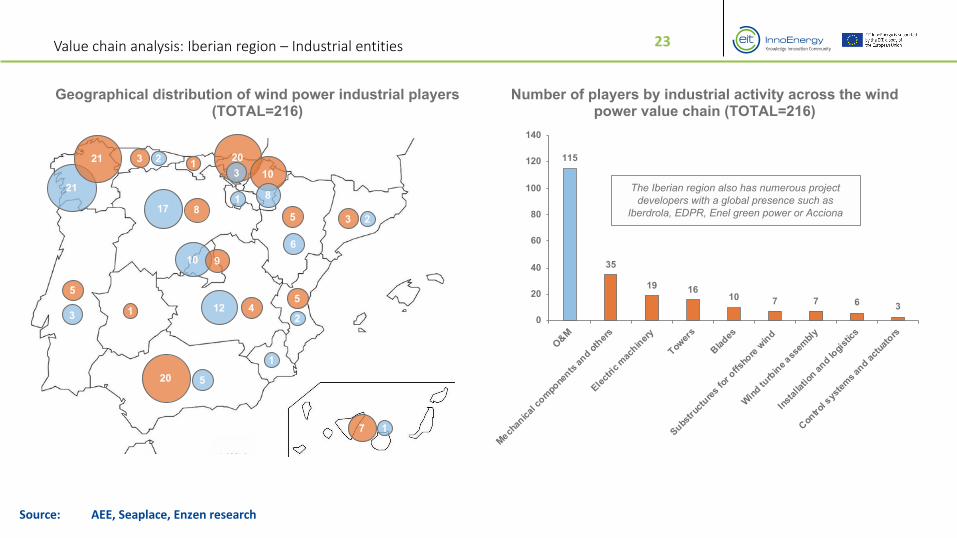
23Value chain analysis: Iberian region – Industrial entities
Source: AEE, Seaplace, Enzen research
115
35
19 1610 7 7 6 3
0
20
40
60
80
100
120
140
O&M
Mechan
ical c
ompo
nents
and
other
s
Elect
ric m
achin
ery
Tower
s
Blades
Substru
cture
s fo
r offs
hore
win
d
Win
d turb
ine a
ssem
bly
Inst
allat
ion an
d lo
gist
ics
Contro
l sys
tem
s and
actu
ators
Geographical distribution of wind power industrial players (TOTAL=216)
Number of players by industrial activity across the wind power value chain (TOTAL=216)
The Iberian region also has numerous project developers with a global presence such as
Iberdrola, EDPR, Enel green power or Acciona
1
1
1
13
7
20
17
11
12
1
1
1
1
2
3 2
5
2
5
3
1
5
6
4
10
8
9
3
20 5
8
21
21
10

24Value chain analysis: Iberian region vs other EU regions
Source: Seaplace, Enzen analysis
Iberia France Denmark Norway Germany
Offshore wind turbines
Nacelle Back of the race Leading pack Leader Back of the race Leading pack
Blades Leading pack Chaser Leader Back of the race Leading pack
Tower Leading pack Chaser Leader Back of the race Leading pack
Floating structures
Steel Leader Leading pack Chaser Leading pack Chaser
Concrete Leading pack Leading pack Chaser Leader Back of the race
Mooring systems
Steel chains Leader Chaser Chaser Leading pack Leading pack
Synthetic ropes Leading pack Leading pack Chaser Chaser Chaser
Marine electrical field
Offshore cables Back of the race Leading pack Leading pack Chaser Leading pack
Substations Leading pack Leader Chaser Chaser Leading pack
Clear leaders in offshore nacelles will make it very difficult for the Iberian region to position as leader
Even though Iberia is not a leader, it has full capabilities for both elements and it is a relevant manufacturer; therefore, increasing demand may drive additional manufacturing capabilities leading to a better positioning
Iberia already holds a leading position that needs to be securedThe region has strong capabilities and experience from other sectors that can be leveraged for gaining a leading position
Iberia already holds a leading position that needs to be secured by increasing manufacturing capacityThe Iberian region currently a strong player in this field that may drive additional development leading to a better posit.Existing capacities are rather limited and would require much strengthening to achieve a better positioning
The region has strong capabilities and experience from BFOW that can be leveraged for gaining a leading position

25Value chain analysis: Iberian region poitioning
Source: Seaplace, Enzen analysis
O – None P – Low PP – Medium PPP – High
Capability strength in the Iberian region
Rep
licab
ility
of c
apab
ilitie
s
Hig
hM
ediu
mLo
w
Offshore cables
WTG - Nacelle
Moorings(synthetic ropes)
Bla
des
and
tow
ers
Floating structuresMoorings (steel chains)
Substations
The overlapping strength in floating structures, moorings and substations provides a basis for the Iberian region to build upon to become a technology and industrial hub of FOW
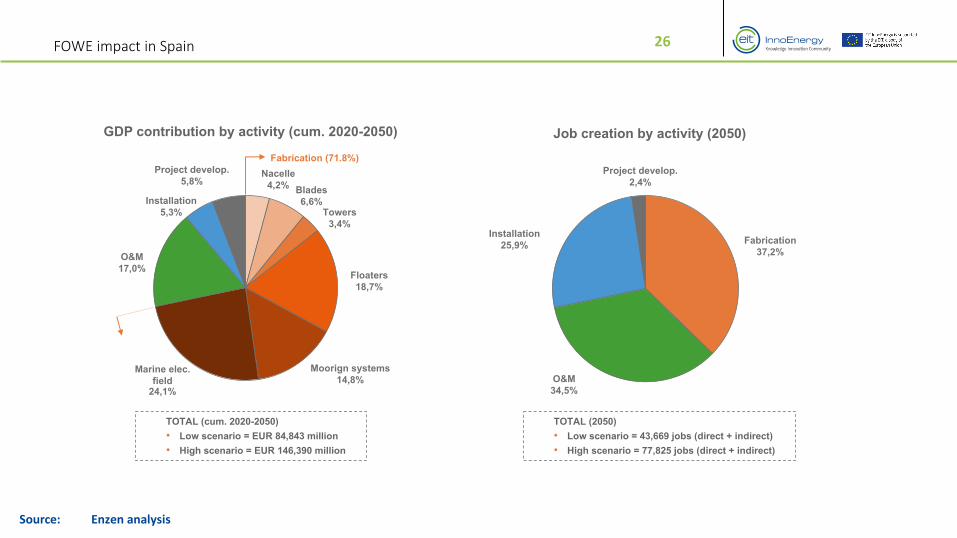
26FOWE impact in Spain
Source: Enzen analysis
GDP contribution by activity (cum. 2020-2050) Job creation by activity (2050)
Nacelle4,2% Blades
6,6%Towers
3,4%
Floaters18,7%
Moorign systems14,8%
Marine elec. field
24,1%
O&M17,0%
Installation5,3%
Project develop.5,8%
Fabrication37,2%
O&M34,5%
Installation25,9%
Project develop.2,4%
TOTAL (cum. 2020-2050)
• Low scenario = EUR 84,843 million
• High scenario = EUR 146,390 million
TOTAL (2050)
• Low scenario = 43,669 jobs (direct + indirect)
• High scenario = 77,825 jobs (direct + indirect)
Fabrication (71.8%)

27EU Framework
Source: EU Comission, Enzen research
EC targets to comply with the Paris Agreement
2020 2030 2050
Cut in GHG emissions vs 1990 levels
20% 40%
Carbonneutral
EU energy from renewables
20% 32%
Improvements in energy efficiency
20% 33%
EC mechanisms to meet the renewable energy goals
Paris Agreement
Holding the increase in the global average temperature to well below 2°C above pre-industrial levels and pursuing efforts to limit
the temperature increase to 1.5°C
2020Climate & energy
package
2030Climate & energy
framework
2050Long-term strategy
EC
me
ch
an
ism
s
• European Green Deal. Package of measures to reduce greenhouse gases and invest in R&D.
• EU Emission trading system (ETS). Key tool for cutting greenhouse gas emissions vs 2005 levels
Proposal for the first European Climate Law. Aims to write into law the goal set by the European
Green Deal – for Europe’s economy and
society to become climate-neutral by 2050.
21% 43%
• Non-ETS. Objective of reducing greenhouse gas emissions through effort sharing legislation
10%'Effort sharing decision'
30%'Effort sharing regulation'
• Renewable Energy Directive. Binding national targets for raising share of renewables. ‘Clean Energy for all Europeans package’
20% 32%
• Energy efficiency plan
• NECP (2021-2030)
• Energy efficiency directive
• National long-term strategies
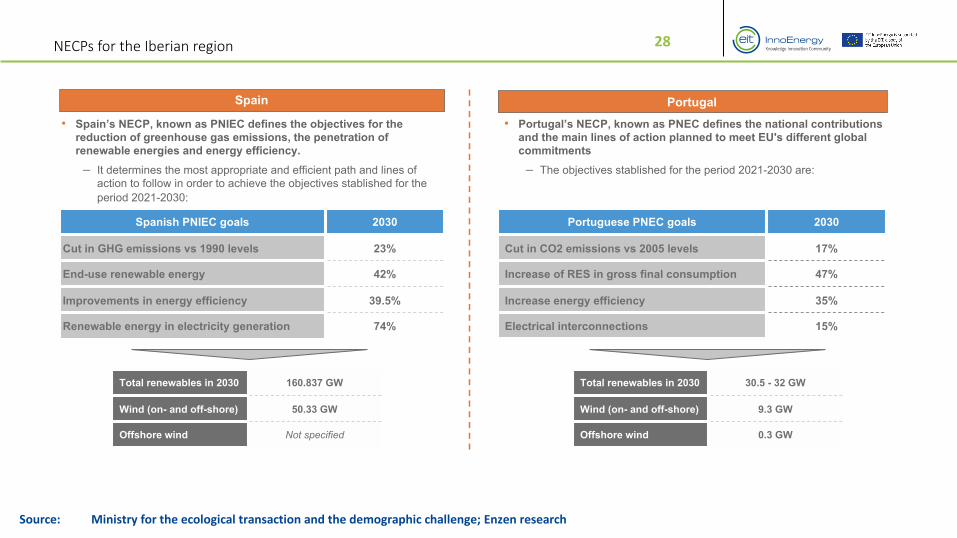
28NECPs for the Iberian region
Source: Ministry for the ecological transaction and the demographic challenge; Enzen research
Spanish PNIEC goals 2030
Cut in GHG emissions vs 1990 levels 23%
End-use renewable energy 42%
Improvements in energy efficiency 39.5%
Renewable energy in electricity generation 74%
Total renewables in 2030 160.837 GW
Wind (on- and off-shore) 50.33 GW
Offshore wind Not specified
Spain Portugal• Spain’s NECP, known as PNIEC defines the objectives for the
reduction of greenhouse gas emissions, the penetration of renewable energies and energy efficiency. ‒ It determines the most appropriate and efficient path and lines of
action to follow in order to achieve the objectives stablished for the period 2021-2030:
Portuguese PNEC goals 2030
Cut in CO2 emissions vs 2005 levels 17%
Increase of RES in gross final consumption 47%
Increase energy efficiency 35%
Electrical interconnections 15%
• Portugal’s NECP, known as PNEC defines the national contributions and the main lines of action planned to meet EU's different global commitments‒ The objectives stablished for the period 2021-2030 are:
Total renewables in 2030 30.5 - 32 GW
Wind (on- and off-shore) 9.3 GW
Offshore wind 0.3 GW
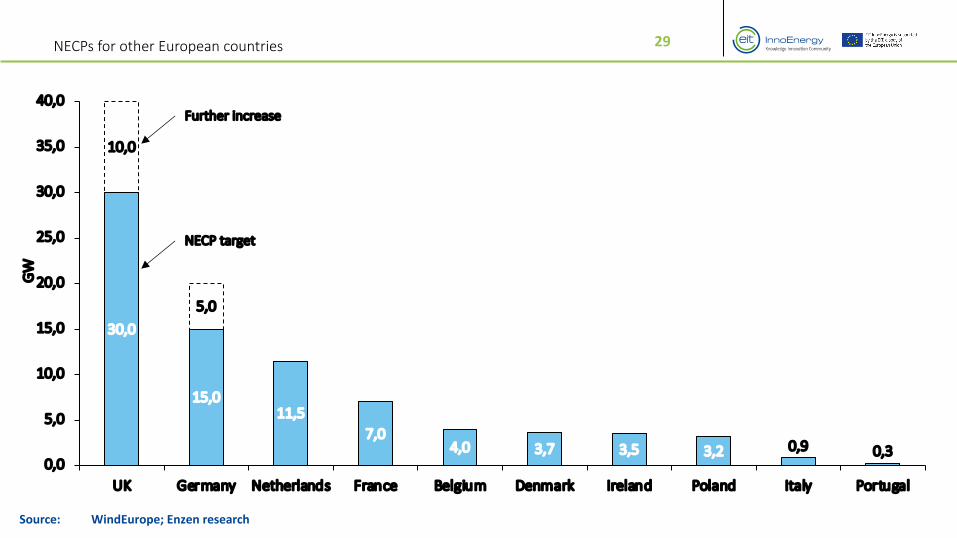
29NECPs for other European countries
Source: WindEurope; Enzen research
30,0
15,011,5
7,04,0 3,7 3,5 3,2 0,9 0,3
10,0
5,0
0,0
5,0
10,0
15,0
20,0
25,0
30,0
35,0
40,0
UK Germany Netherlands France Belgium Denmark Ireland Poland Italy Portugal
GW
NECP target
Further increase

30Spanish regulation
Source: IDAE; Enzen analysis
Regu
latio
n
Law 41/2010 . • Marine environment protectionRD 363/2017 • Maritime space planning
framework RD 79/2019• Compatibility with the marine
strategyCoastal Law 22/1988 & RD 876/2014 • General coastal regulation
Law 21/2013• defines the basis for an
Environmental Impact Assessment (EIA)
Royal Decree 584/1972• Air easements
Law 30/1992• On the Legal System for Public
Administrations and Administrative Procedure.
RD 1028/2007• Establishing the administrative
procedure for processing applications for authorisation of electricity generation facilities in the territorial sea
RD 1955/2000• Authorisation procedure for
electricity generation ₋ Request for Administrative
Authorisation (AA)₋ Project Execution Approval (AEP)₋ Exploitation Authorisation (EA)
Electricity sector Law 24/2013• Defines the framework for an
economic, efficient and sustainable electricity supply system. It defines the right of access to the network by electricity producers and their obligations
₋ It also defines the possibility of self-consumption (RD 244/2019) and the possibility of PPAs
₋ Regulation of the financial framework of renewables RD 413/2014
Future regulation and supporting mechanisms (e.g., feed-in tariffs, CfDs, auctions, etc.) will apply
Project site consenting Financial Close Operation
MITECO - GD Energy Policies and Mines
FOMENTO - AESA (State Agency for Air Safety)
MITECO - GD Biodiversity Environmental Quality
MITECO - GD Sustainability Coasts & Sea
Competent administration
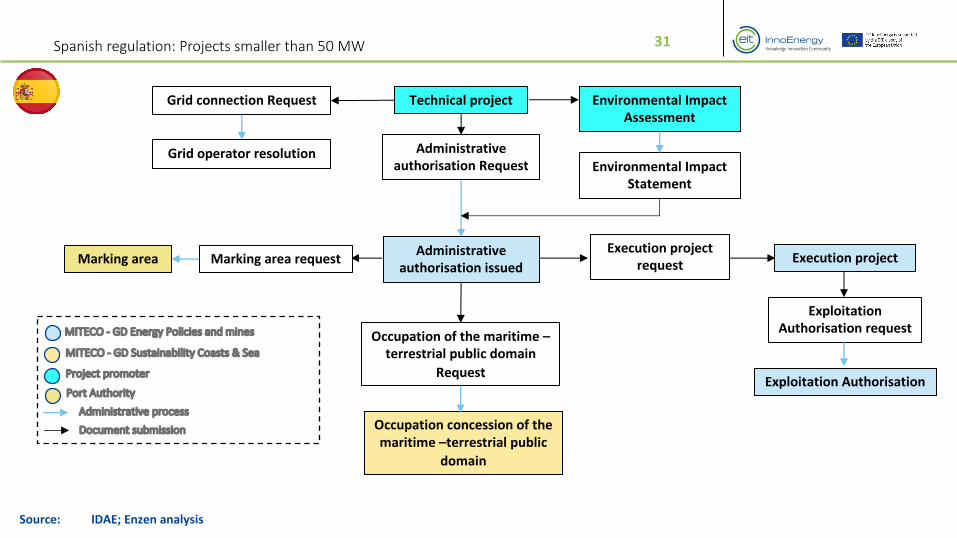
31Spanish regulation: Projects smaller than 50 MW
Source: IDAE; Enzen analysis
Technical project
Environmental Impact Statement
Administrative authorisation Request
Grid connection Request
Grid operator resolution
Administrative authorisation issued
Environmental Impact Assessment
Occupation of the maritime –terrestrial public domain
Request
Occupation concession of the maritime –terrestrial public
domain
Marking area request Marking areaExecution project
request Execution project
Exploitation Authorisation request
Exploitation Authorisation
MITECO - GD Energy Policies and mines
MITECO - GD Sustainability Coasts & Sea
Administrative process
Document submission
Project promoter
Port Authority
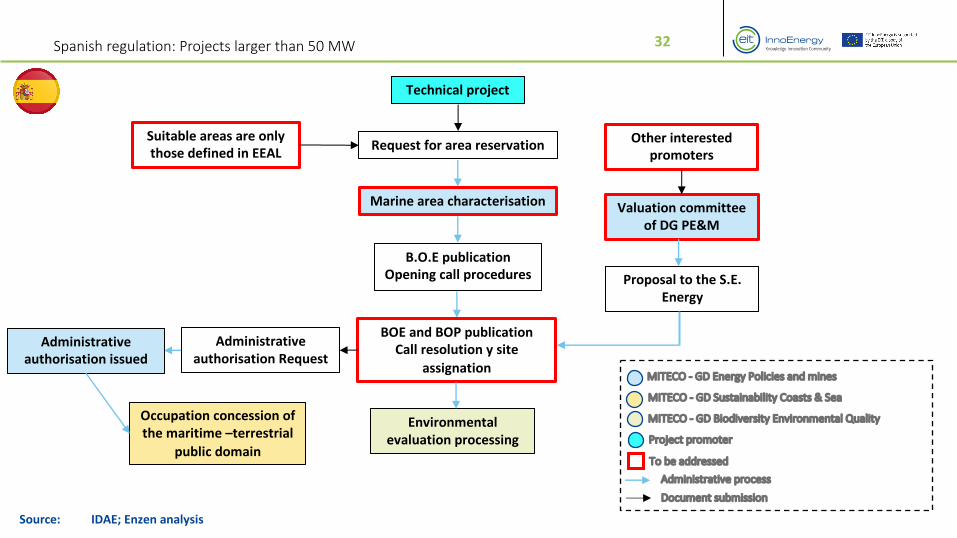
32Spanish regulation: Projects larger than 50 MW
Source: IDAE; Enzen analysis
Request for area reservation
Marine area characterisation
B.O.E publicationOpening call procedures
BOE and BOP publicationCall resolution y site
assignation
Proposal to the S.E. Energy
Occupation concession of the maritime –terrestrial
public domain
Valuation committee of DG PE&M
Other interested promoters
Suitable areas are only those defined in EEAL
Environmental evaluation processing
MITECO - GD Energy Policies and mines
MITECO - GD Sustainability Coasts & Sea
MITECO - GD Biodiversity Environmental Quality
Administrative process
Document submission
Project promoter
To be addressed
Technical project
Administrative authorisation Request
Administrative authorisation issued

33Spanish regulation: Projects larger than 50 MW
Source: AEE, IDAE; Enzen analysis
Outdated aspects of marine administrative processing for projects > 50 MW
Marine area characterisation• Procedures that overlap with the access and connection regulation
– The possibility of making the reservation of the available evacuation capacity, as it is done in the marine area characterisation, does not exist in the access and connexion regulation.
BOE and BOP publication forcall resolution and site
assignation
• Contradictory procedures– Art.17 states that the resolution of the reserved area initiates the environmental impact evaluation; however,
this is contradictory to art 25.1.b) which states that the EIA is presented much later and that’s when the authorisation procedures start
Valuation committee of the General Directorate for
Energy Policies and Mines (MITECO)
• Evaluation criteria is not available– In particular, the economic criteria based on the premium offer (EUR/kWh) is an outdated concept and
against current regulations
Suitable areas are only those defined in EEAL
• Outdated EEAL (environmental assessment of the littoral)– At the time the study was written, floating technology had not yet been developed and it does not take into
account the specific features of this technology versus bottom-fixed technologies, which have a higher impact– Since its approval in 2009 the environmental impact of offshore wind farms has reduced considerably
Other interested promoters • Reference to repealed RDs– Interested promoters have to request a prime based on the repealed RD 661/07

34Spanish regulation: Projects larger than 50 MW
Source: Image credits: Statoil; Enzen analysis
• Local law applies as if it was any other infrastructure project (e.g., environmental protection, civil works permission, etc.)‒ Protected areas/natural reserves e.g. Lanzarote is biosphere reserve
‒ Regions can choose to promote or block certain economic activities
Local legislation
National legislation
• National legislation applies to on-shore electrical infrastructure (e.g., In Spain this is regulated by the RD 1955/2000)

35Portuguese regulation
Source: Enzen analysis
Project site consenting Financial Close Operation
Regu
latio
n
Law nº 17/2014• Basis for national maritime spatial
planning and management policy
Ordinance nº 239/2018• Minimum conditions to be met by
the mandatory social responsibility insurance of private maritime use certificate holders
Ordinance nº 128/2018• Sets the base charge value for the
private use of national maritime space and its calculation formula
Ordinance nº 125/2018• Regime and amount of the deposit
for maintenance of marine environment at the time of the private use termination
DL nº 139/2015• Bases for National Maritime Space
Planning and Management PolicyDL nº 38/2015• Develops Law 17/2014 Ordinance nº 11494/2015• National maritime space situation
plan
DL 152-B/2017• Legal regime for the evaluation of
the environmental impact of projects with effects on the environment
DL nº29/2006• Establishes the general framework
for the organisation and functioning of the Portuguese electricity system
• Amended by Law nº 42/2016
DL nº172/2006 • Regulates the legal regime
applicable for pursuing the activities of generation, transmission, distribution and supply of electricity and for the organisation of electricity markets
• Amended by Decree Law nº 76/2019
Ministry of finance National assembly
Ministry of agriculture
Ministry of sea
Issuing authority:
Ministry of environment and energy transition
Ministry of economy
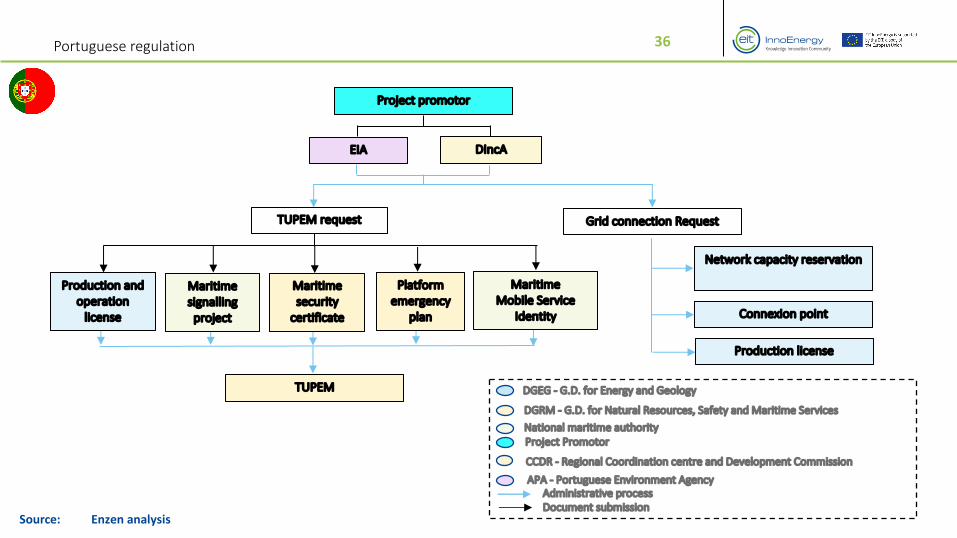
36Portuguese regulation
Source: Enzen analysis
TUPEM
Project promotor
DIncAEIA
DGEG - G.D. for Energy and Geology
DGRM - G.D. for Natural Resources, Safety and Maritime ServicesNational maritime authority
Administrative processDocument submission
Project Promotor
CCDR - Regional Coordination centre and Development Commission
APA - Portuguese Environment Agency
Grid connection Request
Network capacity reservation
Connexion point
Production license
TUPEM request
Production and operation
license
Maritime signalling project
Maritime security
certificate
Platform emergency
plan
Maritime Mobile Service
Identity
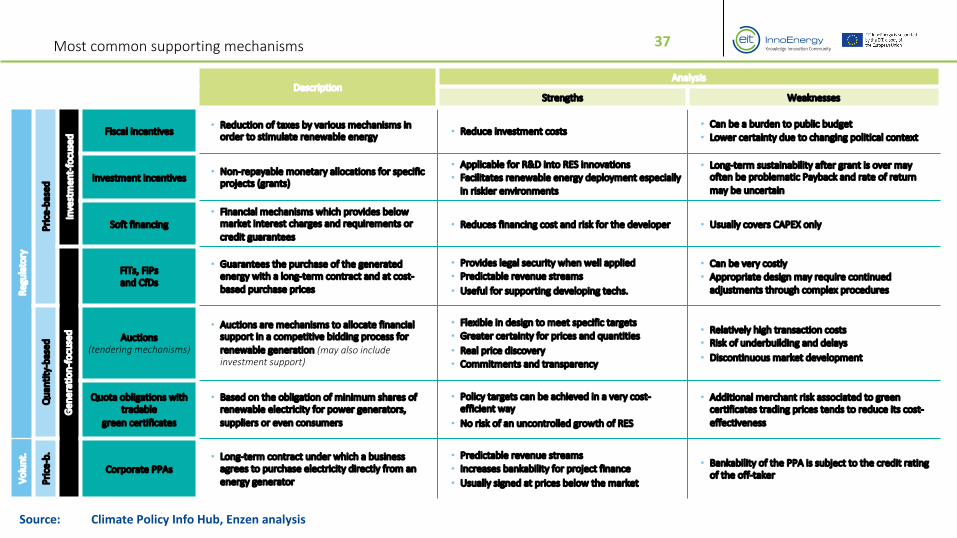
37Most common supporting mechanisms
Source: Climate Policy Info Hub, Enzen analysis
DescriptionAnalysis
Strengths Weaknesses
Regu
lato
ry
Pric
e-ba
sed
Inve
stm
ent-
focu
sed Fiscal incentives • Reduction of taxes by various mechanisms in
order to stimulate renewable energy • Reduce investment costs• Can be a burden to public budget• Lower certainty due to changing political context
Investment incentives • Non-repayable monetary allocations for specific projects (grants)
• Applicable for R&D into RES innovations• Facilitates renewable energy deployment especially
in riskier environments
• Long-term sustainability after grant is over may often be problematic Payback and rate of return may be uncertain
Soft financing• Financial mechanisms which provides below
market interest charges and requirements or credit guarantees
• Reduces financing cost and risk for the developer • Usually covers CAPEX only
Gen
erat
ion-
focu
sed
FiTs, FiPsand CfDs
• Guarantees the purchase of the generated energy with a long-term contract and at cost-based purchase prices
• Provides legal security when well applied• Predictable revenue streams• Useful for supporting developing techs.
• Can be very costly• Appropriate design may require continued
adjustments through complex procedures
Qua
ntity
-bas
ed
Auctions(tendering mechanisms)
• Auctions are mechanisms to allocate financial support in a competitive bidding process for renewable generation (may also include investment support)
• Flexible in design to meet specific targets• Greater certainty for prices and quantities• Real price discovery• Commitments and transparency
• Relatively high transaction costs• Risk of underbuilding and delays• Discontinuous market development
Quota obligations with tradable
green certificates
• Based on the obligation of minimum shares of renewable electricity for power generators, suppliers or even consumers
• Policy targets can be achieved in a very cost-efficient way
• No risk of an uncontrolled growth of RES
• Additional merchant risk associated to green certificates trading prices tends to reduce its cost-effectiveness
Volu
nt.
Pric
e-b.
Corporate PPAs• Long-term contract under which a business
agrees to purchase electricity directly from an energy generator
• Predictable revenue streams• Increases bankability for project finance• Usually signed at prices below the market
• Bankability of the PPA is subject to the credit rating of the off-taker
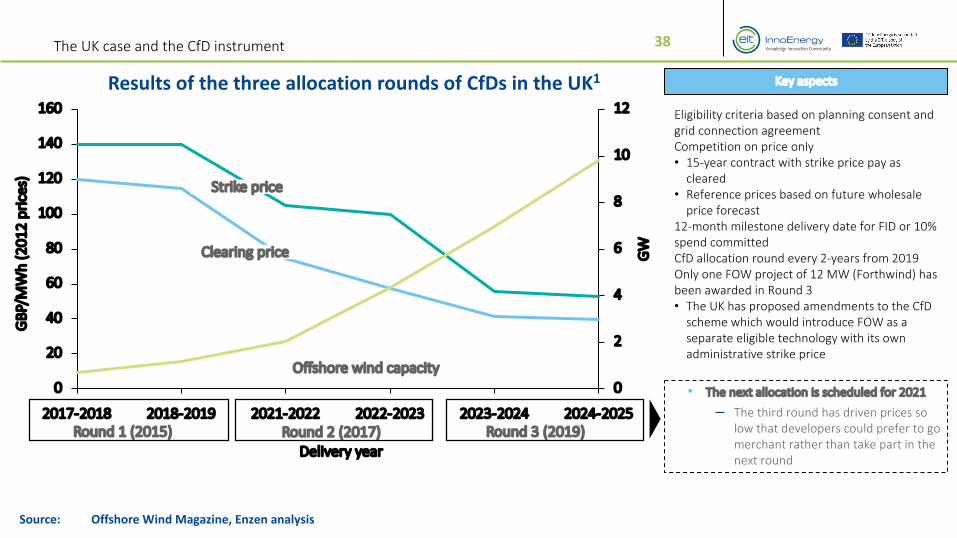
38The UK case and the CfD instrument
Source: Offshore Wind Magazine, Enzen analysis
Results of the three allocation rounds of CfDs in the UK1
0
2
4
6
8
10
12
0
20
40
60
80
100
120
140
160
2017-2018 2018-2019 2021-2022 2022-2023 2023-2024 2024-2025
GW
GBP
/MW
h (2
012
pric
es)
Delivery year
Offshore wind capacity
Clearing price
Strike price
Eligibility criteria based on planning consent and grid connection agreementCompetition on price only• 15-year contract with strike price pay as
cleared• Reference prices based on future wholesale
price forecast12-month milestone delivery date for FID or 10% spend committedCfD allocation round every 2-years from 2019Only one FOW project of 12 MW (Forthwind) has been awarded in Round 3• The UK has proposed amendments to the CfD
scheme which would introduce FOW as a separate eligible technology with its own administrative strike price
Round 1 (2015) Round 2 (2017) Round 3 (2019)
• The next allocation is scheduled for 2021
‒ The third round has driven prices so low that developers could prefer to go merchant rather than take part in the next round
Key aspects

39Replication of UK CfD scheme for Iberian market development
Source: Enzen analysis
-1.000
0
1.000
2.000
3.000
4.000
5.000
6.000
7.000
8.000
2020 2025 2030 2035 2040 2045 2050
Mill
ion
EUR
/ yea
r
-1.000
0
1.000
2.000
3.000
4.000
5.000
6.000
7.000
8.000
2020 2025 2030 2035 2040 2045 2050
Mill
ion
EUR
/ yea
r
Cost for the governments vs GDP contribution of FOW in Iberia (low scenario)
Cost for the governments vs GDP contribution of FOW in Iberia (high scenario)
CfD cost
Net GDPTotal GDP contr.
CfD cost
Net GDPTotal GDP contr.
40Positioning and Purpose
The summary report can be found in the link:
https://info.innoenergy.com/eit-innoenergy-iberian-floating-offshore-wind-report
With the support and work from:
For their inputs and dissemination contribution:

Innoenergy.com
EIT InnoEnergyKennispoort 6th floorJohn F. Kennedylaan 25612 AB EindhovenThe [email protected]
Javier Sanz
+34 678 730 111