egypt household heal th expenditure and utilization … · 2014-06-06 · egypt household health...
TRANSCRIPT
November 2011
This publication was produced for review by the United States Agency for International Development. It was prepared by Nadwa Rafeh, Julie Williams and Nagwan Hassan, for Health Systems 20/20 Project.
EGYPT HOUSEHOLD HEALTH
EXPENDITURE AND UTILIZATION
SURVEY 2009/2010


DISCLAIMER
The author’s views expressed in this publication do not necessarily reflect the views of the United States
Agency for International Development (USAID) or the United States Government.
EGYPT HOUSEHOLD HEALTH
EXPENDITURE AND UTILIZATION
SURVEY 2009/2010

Mission
The Health Systems 20/20 cooperative agreement, funded by the U.S. Agency for International
Development (USAID) for the period 2006-2011, helps USAID-supported countries address health system
barriers to the use of life-saving priority health services. Health Systems 20/20 works to strengthen health
systems through integrated approaches to improving financing, governance, and operations, and building
sustainable capacity of local institutions.
November 2011
For additional copies of this report, please email [email protected] or visit our website at
www.healthsystems2020.org
Cooperative Agreement No.: GHS-A-00-06-00010-00
Submitted to: Bob Emrey, CTO
Health Systems Division
Office of Health, Infectious Disease and Nutrition
Bureau for Global Health
United States Agency for International Development\
Recommended Citation: Rafeh, Nadwa, Julie Williams, and Nagwan Hassan. November 2011. Egypt
Household Health Expenditure and Utilization Survey 2010.. Bethesda, MD: Health Systems 20/20 project, Abt
Associates Inc.
Abt Associates Inc. I 4550 Montgomery Avenue I Suite 800 North I Bethesda, Maryland 20814 I P: 301.347.5000 I F: 301.913.9061 I www.healthsystems2020.org I www.abtassociates.com
In collaboration with:
I Aga Khan Foundation I Bitrán y Asociados I BRAC University I Broad Branch Associates I Deloitte Consulting, LLP I Forum One Communications I RTI International I Training Resources Group I Tulane University School of Public Health and Tropical Medicine

V
CONTENTS
Contents ................................................................................................................ v
Acronyms .............................................................................................................ix
Acknowledgments ...............................................................................................xi
Executive Summary ..........................................................................................xiii
Policy Recommendations ............................................................................... xvii
1. Introduction and Survey Methodology ................................................. 1
1.1 Introduction 3 1.2 Objectives of the Survey .......................................................................... 3 1.3 Survey Methodology ................................................................................ 3
1.3.1 Design and Sampling ........................................................................................ 3
1.3.2 Sample Selection ................................................................................................ 5
1.3.3 Sample Coverage and Response Rates ................................................... 8
1.4 Wealth Index Construction ...................................................................... 9
2. Socioeconomic Characteristics of Households and Individuals .... 11
2.1 Population Distribution According to Socioeconomic Indicators ............. 13 2.2 Urban-Rural Distribution by Key Socioeconomic Indicators ................... 15
2.2.1 Age, Sex, and Residence Distribution ...................................................... 15
2.2.2 Educational Attainment .................................................................................. 16
2.2.3 Wealth Distribution ........................................................................................... 17
2.3 Housing Characteristics ......................................................................... 18 2.3.1 Housing Types and Sizes.............................................................................. 18
2.3.2 Access to Clean Water and Sanitation .................................................... 18
2.3.3 Household Possessions ................................................................................. 20
3. Health Status And Service Utiliztaion Profile ........................... 21
3.1 Episodes of Acute, Chronic, and Dental Illnesses .................................. 23 3.2 Visits to Treat Acute and Chronic Illnesses ............................................ 27 3.3 Reasons for Making Inpatient and Preventive Care Visits .................... 31 3.4 Impact of Acute and Chronic Illnesses on Productivity........................... 32
4. Health Care Expenditures .................................................................... 23
4.1 Annual Per Capita Health Spending ...................................................... 37 4.1.1 Expenditures by Sex ....................................................................................... 38
4.1.2 Expenditures by Residence .......................................................................... 38
4.1.3 Expenditures by Insurance Status ............................................................. 39
4.1.4 Expenditures by Age ....................................................................................... 39
4.1.5 Expenditures by Education Level and Income/Wealth ...................... 41
4.2 Expenditures by Type of Facility ............................................................ 44 4.3 Components of Health Care Spending by Type of Service .................... 45
4.3.1 Outpatient Services.......................................................................................... 45
4.3.2 Inpatient Services ............................................................................................. 53

VI
5. Patterns of Curative Health Services Utilization in Egypt ................ 55
5.1 Annual Per Capita Utilization Rate for Outpatient and Inpatient Visits ... 57 5.2 Reasons for Not Using Care .................................................................. 61
5.2.1 Outpatient Services.......................................................................................... 61
5.2.2 Inpatient Services ............................................................................................. 68
5.3 Gap Analysis: Acute, Chronic, Dental, Preventive, and Inpatient Visits . 69
6. Health Insurance Coverage in Egypt .................................................. 71
6.1 Insurance Coverage .............................................................................. 73 6.2 Types of Insurance Coverage ................................................................ 75
7. Type of Facility and Choice of Provider in Egypt ............................ 79
7.1 Type of Facility and Choice of Provider: Outpatient Care ...................... 81 7.1.1 Type of Facility and Choice of Provider: Acute Illness ...................... 81
7.1.2 Type of Facility and Choice of Provider: Chronic Illness .................. 84
7.1.3 Type of Facility and Choice of Provider: Dental Diseases ............... 87
7.1.4 Type of Facility and Choice of Provider: Preventive Services ........ 89
7.2 Type of Hospital: Inpatient Visits ........................................................... 93
8. Quality of Care ....................................................................................... 95
8.1 Satisfaction with Service Delivery .......................................................... 97
9. Summary of Key Findings .................................................................... 99
9.1 Summary of Overall Findings .............................................................. 101 9.2 Key Findings: Gender ........................................................................ 101 9.3 Key Findings: Place of Residence .................................................... 101 9.4 Key Findings: Income ........................................................................ 102 9.5 Key Findings: Insurance .................................................................... 102 9.6 Key Findings: Chronic Conditions ..................................................... 102
Annex A: Questionnaire forms ...................................................................... 163
1- Household Qestionnaire ...................................................................... 105 2- Non-Chronic Diseases questionnaire .................................................. 131 3- Chronic Diseases questionnaire .......................................................... 147 4- Dental Diseases questionnaire ............................................................ 163 5- Hospital Admission Questionnaire ....................................................... 177 6- Treatment Abroad Questionnaire ........................................................ 197 7- Preventive Consultations Questionnaire .............................................. 211

VII
LIST OF TABLES
Table 1.1: Segments / Primary Sampling Unit Distribution by Urban and Rural Governorate .................................................................................... 6
Table 1.2: Distribution of Sample by Governorate and Survey Phase ............... 7 Table 1.3: Response Rate of Individuals Sampled ............................................ 8 Table 2.1: Population Distribution by Background Characteristics................... 14 Table 2.2: Survey Population by Age, Sex, and Sex, and Place of Residence 15 Table 2.3: Estimated Population Distribution by Place of Residence, Education
Level, and Sex ............................................................................... 16 Table 2.4: Estimated Household Distribution According To Wealth Index ....... 17 Table 2.5: Estimated Household Distribution by House Type .......................... 18 Table 2.6: Estimated Household Distribution by Number of Rooms ................ 18 Table 2.7: Estimated Household Distribution by Housing Characteristics ........ 19 Table 2.8: Estimated Household by Household Possessions .......................... 20 Table 3.1: Occurrences of Acute Illnesses ...................................................... 24 Table 3.2: Occurrences of Chronic Illnesses ................................................... 24 Table 3.3: Occurrences of Dental Illnesses ..................................................... 25 Table 3.4: Occurrences of Acute and Chronic Illness in the Four Weeks Prior to
Survey Administration, By Background Characteristics ................. 26 Table 3.5: Visit Rate For Acute Illnesses......................................................... 27 Table 3.6: Visit Rate For Chronic Illnesses ..................................................... 28 Table 3.7: Visit Rate for Acute Illness by Background Characteristic .............. 29 Table 3.8: Visit Rate for Chronic Illness by Background Characteristic ........... 30 Table 3.9: Reasons for Making Inpatient Care Visits ....................................... 31 Table 3.10:Reasons for Making Preventive Care Visits ................................... 31 Table 3.11:Productivity Losses Due to Acute and Chronic Illnesses, By
Background Characteristics ........................................................... 33 Table 4.1: Annual Per Capita (LE) Health Spending (Adjusted) ...................... 37 Table 4.2: Annual Per Capita Health Spending (LE) (Adjusted) by Type of
Service and Sex ............................................................................ 38 Table 4.3: Annual Per Capita Health Spending (LE) (Adjusted) by Type of
Service and Residence .................................................................. 38 Table 4.4: Annual Per Capita Health Spending (LE) (Adjusted) by Type of
Service and Insurance Status ........................................................ 39 Table 4.5: Annual Per Capita Health Spending (LE) (Adjusted) by Type of
Service and Age ............................................................................ 39 Table 4.6: Annual Per Capita Health Spending (LE) (Adjusted) by Type of
Service and Education Level, Wealth, and Income ........................ 41 Table 4.7: Annual Per Capita Spending (LE) (Adjusted) by Type of Facility and
Type of Service ............................................................................. 44 Table 4.8: Percent Spending (Adjusted) on Different Components of Care:
Acute Care .................................................................................... 46 Table 4.9: Percent Spending (Adjusted) on Different Components of Care:
Chronic Care ................................................................................. 48 Table 4.10:Percent Spending (Adjusted) on Different Components of Care:
Dental Care ................................................................................... 50 Table 4.11:Percent Spending (Adjusted) on Different Components of Care:
Preventive Care ............................................................................. 52 Table 4.12:Percent Spending (Adjusted) on Different Components of Care:
Inpatient Services .......................................................................... 53 Table 5.1: Annual Per Capita Utilization Rate: Outpatient Visits ...................... 58

VIII
Table 5.2: Annual Admissions Per Capita: Inpatient Visits .............................. 60 Table 5.3: Reasons For Not Seeking Care: Acute Illness ................................ 62 Table 5.4: Reasons For Not Seeking Care: Chronic Illness............................. 64 Table 5.5: Reasons For Not Seeking Care: Dental Illness .............................. 65 Table 5.6: Reasons For Not Seeking Preventive Care at Another Provider
Nearer to Home (if there was one) ................................................. 67 Table 5.7: Reasons For Not Seeking Inpatient Care at Another Provider Nearer
to Home (if there was one) ............................................................ 68 Table 5.8: Percentage of Individuals Who Do Not Receive Care Who Report
Being Ill ......................................................................................... 69 Table 6.1: Health Insurance Coverage ............................................................ 74 Table 6.2: Percent Distribution of Insurance Coverage by Population
Characteristics ............................................................................... 76 Table 6.3: Percent Reporting Full or Partial Coverage Of Services, by Type of
Health Insurance Coverage and Background Characteristic .......... 77 Table 7.1: Percent of Visits by Facility: All Outpatient Visits ............................ 81 Table 7.2: Percent of Visits by Facility: Acute Illness ...................................... 82 Table 7.3: Percent of Visits by Provider: Acute Illness .................................... 83 Table 7.4: Percent of Visits by Facility: Chronic Illness ................................... 85 Table 7.5: Percent of Visits by Provider: Chronic Illness ................................. 86 Table 7.6: Percent of Visits by Facility: Dental Diseases ................................. 88 Table 7.7: Percent of Visits by Facility: Preventive Services ........................... 90 Table 7.8: Percent of Visits by Provider: Preventive Services ......................... 92 Table 7.9: Percent of Visits by Hospital Type: Inpatient Visits ......................... 94
LIST OF FIGURES
Figure 2.1: Household Population by Age, Sex, and Place of Residence ........ 15 Figure 3.1: Frequency of Reported Days Off for Acute Illness ......................... 34 Figure 3.2: Frequency of Reported Days Off For Chronic Illness .................... 34 Figure 4.1: Annual Per Capita Expenditures (LE) by Age ................................ 40 Figure 4.2: Annual Per Capita Expe nditures (LE) by Education Level ........... 42 Figure 4.3: Annual Per Capita Expenditures (LE) by Wealth Index ................. 42 Figure 4.4: Annual Per Capita Expenditures (LE) by Income Quintiles ............ 42 Figure 4.5: Percent of Household Income Going to Health, by Income Quintile
...................................................................................................... 43

IX
ACRONYMS
CAPMAS Central Agency for Public Mobilization and Statistics
CCO Curative Care Organization
HHEUS Household Health Services Expenditure and Utilization Survey
HIO Health Insurance Organization
HS High School
LE Egyptian Pound
MCH Maternal and Child Health
MOHP Ministry of Health and Population
NGO Nongovernmental Organization
NHA National Health Accounts
USAID United States Agency for International Development


XI
ACKNOWLEDGMENTS
Health Systems 20/20 Project (HS 20/20) acknowledges the full cooperation of Central Agency for Public Mobilization and Statistics (CAPMAS) team who administered the conduction of the Household Survey. Headed by General Abou bakr, the team formed of a pool of professional surveyors, data processors and analysts exerted remarkable efforts to produce such a comprehensive survey. Special thanks to Mr. Mohamed Morsi, Mr. Abdel Hamid Sharaf Eldin, Ms. Doria Abbas, Ms. Amal Fouad, Mr. Eid Abdel Ghani, Mr. Khaled Maher and Ms. Hoda Fathy for their valuable inputs in the survey. We are grateful for the support of the Ministry of Health and Population (MOHP) Department of Planning in initiating the survey in response the to the Ministry's needs for accurate information on the households health care services expenditure and utilization.
Our deep appreciation to Prof. A. K. Nandakumar, Brandies University, for providing invaluable technical support in conducting this survey.


XIII
EXECUTIVE SUMMARY
This report summarizes the results from the Egypt Household Health Services Expenditure and Utilization Survey (HHEUS) 2009/2010, which looks at health care use, out-of-pocket expenditures on health, health insurance coverage, and sources of health care for the Egyptian population. This survey was conducted for the Ministry of Health and Population (MOHP) as part of the USAID-funded, Abt-led Health Systems 20/20 project. The Central Agency for Public Mobilization and Statistics (CAPMAS) in Egypt was contracted to administer the survey and collect the data.
Survey Methodology
Seven questionnaires were administered as part of this survey. The questionnaires were designed to include comprehensive questions covering household socio-demographic characteristics, health service utilization, and cost. The data were collected through interviews with the heads of households.
The sampling strategy was designed to provide nationally representative estimates (excluding the border governorates) of all survey items, and representative estimates for rural and urban populations, and for the five geographic regions in Egypt (main urban governorates, rural Lower Egypt, urban Lower Egypt, rural Upper Egypt, and urban Upper Egypt). The sample included 12,002 households, covering 56,305 individuals. The survey was conducted in February and July 2010 to capture the seasonal effects on health and patterns of disease; different households were surveyed during the two rounds of data collection (for a total of 12,002 households).
Due to the sampling strategy, all data presented in this report are national estimates, and should be interpreted as such.
Socioeconomic Characteristics of Households and Individuals
Although focused on health and health care usage, the survey also gathered some background demographic and socioeconomic information from which we can provide a broad overview of the Egyptian population. As presented in Chapter 2, results from the HHEUS 2009/2010 illustrate vast differences between urban and rural households in terms of wealth, education level, and sanitation. About 60 percent of households in Egypt are rural. Although urban and rural households report similar age and sex distributions, rural households consistently report worse living conditions (e.g., an estimated 74 percent of rural residents have no bathroom available to them while 74 percent of urbanites have a private bathroom), lower education levels (e.g., an estimated 9 percent of rural residents have attained university-level education versus 27 percent of urbanites), higher illiteracy rates (e.g., an estimated 45 percent of rural residents are illiterate versus 23 percent of urban residents), and lower wealth (e.g., an estimated 57 percent of rural households fall into the two lowest wealth indices, while 64 percent of urban households fall into the two highest). We also find differences between males and females in Egypt in terms of educational attainment and literacy rates, with females reporting worse educational outcomes. Additionally, the survey results confirm a demographic trending toward a more youthful population (35 percent of individuals are age 15 years or younger), which will place increasingly greater strain upon Egypt‟s social programs and resources in years to come.

XIV
Health Status and Service Utilization Profile
The HHEUS 2009/2010 provides us with a health status, service utilization, and productivity loss profile of the population, as presented in Chapter 3. Acute illnesses are more common than either dental or chronic illnesses, with about 51 percent of the population reporting at least one acute illness episode in the four weeks prior to taking the survey. The illness with the largest prevalence in the general population is the common cold (an estimated 27 percent of Egyptians had a common cold in the month preceding the survey), followed by “other” dental illnesses (12 percent), “other” acute illnesses (11 percent), dental caries (8 percent), “other” chronic illnesses (7 percent), and hypertension (6 percent).
The survey also gathered data on visits made to treat illnesses. Almost half (43 percent) of all inpatient visits are for acute illnesses, while 70 percent of preventive care visits are for vaccinations followed by ante-natal care visits (12 percent). Seventy-seven percent of all acute illness episodes result in a health care visit, while 72 percent of chronic illness episodes result in a health care visit.
An analysis of productivity loss due to acute and chronic illnesses shows that acute illnesses create higher losses than chronic illnesses in terms of the estimated percent of the population who lose at least one day of normal activity. On average, the under 5 age group is impacted the most by acute illnesses, with 34 percent of this population losing at least one day of normal activity. For chronic illnesses, the three populations affected the most are those under age 5, those in urban Upper Egypt, and those in rural Upper Egypt, with an estimated 20 percent of each population group losing at least one day of normal activity.
Health Care Expenditures
Data on patterns of health care expenditures in Egypt are presented in Chapter 4. Average annual per capita spending for all visits is estimated at LE 646 per person, which is about 15 percent of per capita income. However, annual spending varies greatly between different cohorts of people. For instance, females spend about 28 percent more per year on health care than do males, urban households typically spend more than rural households, and those with health insurance consistently spend less on health care than do those without insurance. Also, health care expenditures steadily increase with age starting at age 5. Additionally, wealthy, rich, and educated households have higher health care expenditures than other cohorts of people, which is likely due to higher access to care and higher ability to pay for care, which escalates care-seeking behavior. Finally, although the rich spend more in total on health care, the poor spend a higher proportion of their household income on health care than any other income quintile.
Spending by type of facility visited is also analyzed in Chapter 4. Private clinics incur the most costs among all outpatient visits (394 LE per capita is spent yearly on private clinics for outpatient care), and private hospitals incur the most costs among all inpatient visits (52 LE per capita is spent yearly on private hospitals for inpatient care). Breakdowns of these costs by cost component are also presented in Chapter 4.
XV
Patterns of Curative Health Services Utilization in Egypt
Chapter 5 of this report presents results from the Egyptian HHEUS 2009/2010 related to patterns of curative health service utilization in Egypt. This includes an analysis of the annual per capita utilization rate for outpatient and inpatient visits, where it is found that an average of 9.51 outpatient visits are made per person per year, and an average of 0.07 inpatient visits are made per person per year.
An analysis of why individuals do not seek health care is also presented. For both acute and chronic illnesses, the most frequently cited reason is that the individual used medical treatment without consulting a medical professional (this occurs for an estimated 56 percent of all acute illnesses in the population and for an estimated 46 percent of all chronic illnesses). In the case of acute illnesses, this may be because individuals relied upon advice received previously or may have visited a pharmacy for treatment; in the case of chronic illnesses, this may be because the survey only captures visits made in the prior four weeks while chronic illness care is longer-term, so the survey simply did not capture all chronic care visits.
Finally, we provide a gap analysis that examines the percentage of individuals who report not having visited a medical professional for an illness during the last month. This analysis shows the largest gap in care is for chronic illnesses. Twenty-seven percent of individuals who had a chronic illness during the last month did not seek care. The second largest gap is for acute illnesses (23 percent gap).
Health Insurance Coverage in Egypt
In terms of health insurance coverage, an estimated 51 percent of Egyptians have health insurance, although coverage rates vary greatly depending on one‟s background characteristics, as presented in chapter six. Insurance coverage is highest for men, individuals in urban areas, individuals in urban Lower Egypt, those aged 5-15 years, those with less than a high school degree, and those in highest wealth index. Some of these variances can be explained by Egypt‟s various health insurance laws, which are intended to ensure that vulnerable populations are covered through the government-run Health Insurance Organization (HIO). HIO covers about 89 percent of the insured population and tends to cover underserved populations like women, rural individuals, and poorer populations. However, the results also indicate that there is room for improvement in health insurance coverage rates among many cohorts of people, whether by HIO or some other plan. Individuals report that, among all insurance providers, HIO provides the highest rate of full coverage (86 percent of all services were covered by the health insurance) while syndicates provide the lowest rate of full coverage (57 percent of all services were covered).
Type of Facility and Choice of Provider in Egypt
Chapter 7 presents results related to the type of facility and provider chosen for different health services. Over three-quarters of outpatient visits are made to private facilities, whereas over half of inpatient visits are made to public facilities. Within outpatient service types, the choice of facility and of provider is similar for acute and chronic illnesses, with private facilities (private clinic or pharmacy) used to treat about three-quarters of acute and chronic illnesses, and specialists/consultants visited for about 63 to 68 percent of acute and chronic illnesses. Private clinics are also frequently used to treat dental diseases. In contrast, the majority of preventive health care visits are made either at an MOHP facility or another kind of facility not listed in the survey. Also for preventive services, nurses provide the care for half of these visits, and specialists/consultants provide the care for a quarter of the visits.

XVI
Quality of Care
The last chapter of this report (Chapter 8) summarizes results related to patient satisfaction with service delivery. In general, patients who make health visits seem to be very satisfied with the health services received across all types of facilities. One-day surgery hospitals received the highest levels of satisfaction, with about 86 percent of users reporting that they were “completely satisfied” with the services. Both of the most frequently used facilities (private clinics and pharmacies) had about three-quarters of patients reporting that they were “completely satisfied” with service delivery. The main factors that contribute to patient satisfaction are good quality of care, close or easy- to-reach facilities, reasonable costs, and good communication skills by treatment providers and facility staff.

XVII
POLICY RECOMMENDATIONS
Following a review of the analytic results presented in this report, we can synthesize the findings to provide some policy recommendations aimed at improving health service utilization in Egypt.
One recommendation is to expand HIO coverage, especially to more vulnerable populations. While HIO covers 89 percent of people with health insurance, only half of the general population has any health insurance coverage. By providing coverage to more people, health care costs to the individual will decline while health care utilization will increase (the uninsured spend 42 percent more per year on health costs than the insured; and, for both acute and chronic illnesses, about twice as many uninsured report not seeking care due to cost than insured). The Egyptian government has written various health insurance laws to ensure coverage to certain populations, such as infants, students, pensioners, and widows. This mandated coverage should be expanded to others, especially to more vulnerable groups such as females (only about 44 percent of females have health insurance), the elderly (only about 31 percent of those over the age of 60 have insurance), and those in the lowest wealth index (only 40 percent have insurance).
This survey also reveals that only about three-quarters of individuals seek care for chronic or acute illnesses. When asked why, over half of these individuals cited “using medical treatment without consulting a professional” as the main reason for not visiting a health care facility. Although more research is needed to disentangle exactly why individuals use treatment without consulting a professional, it could be that these individuals do not realize the benefit of consulting a medical professional each time one is sick. To address this, the government or other advocacy groups could work to better educate the citizenry on the benefits of obtaining proper medical care and advice. If individuals are encouraged to visit medical professionals, then perhaps general illness rates will decline (less transfer of disease) and productivity losses will lessen (fewer days lost due to obtaining sound medical treatment).
We also find through this survey that the poorest groups (in terms of both income and wealth) have much lower chronic care utilization rates than wealthier groups. The poorer groups also report fewer episodes of chronic illnesses. However, given the nature of chronic illnesses, it is possible that these poor groups are undiagnosed, as opposed to actually having fewer incidences (although more research is needed to confirm this hypothesis). Given the levels of spending on chronic services among the wealthiest groups (wealthy groups spend more on chronic services over every other type of health care service, including acute care, even though the wealthy report almost half as many chronic illnesses than acute illnesses), one could conclude that the cost of these services is prohibitive and that the poor groups are choosing not to visit chronic care providers. To address this gap, chronic care services should be expanded to poorer individuals through cost-reducing initiatives.
While reviewing the above recommendations and the survey results, it is important to note that while this survey provides us with knowledge of some gaps in health care in Egypt, more research is needed to discover how best to address many of these gaps. For instance, we know that rural households spend less on health care than their urban counterparts, and that females spend more than males. However, the survey was not designed to capture why this is the case. Additionally, we know that higher percentages of poor individuals than wealthy individuals lose at least one day of normal activity due to acute or chronic illnesses, but we do not know precisely why. It could be that service providers are farther away, so it takes longer to obtain treatment, or it could be that these

XVIII
individuals choose to forgo treatment due to cost or distance or some other factor. The results from this survey should provide guidance to future research efforts so that we can discover why disparities exist, and then work to address them

1. INTRODUCTION AND SURVEY
METHODOLOGY


3
1.1 INTRODUCTION
The Ministry of Health and Population (MOHP), in collaboration with the USAID-funded project Health Systems 20/20, is currently conducting the National Health Accounts (NHA) 2008/2009. NHA estimation tracks the flow of funds through the health sector from their sources, through financing agents, to health care providers and end users. It does so in a comprehensive manner attempting to capture public, private, out-of-pocket, and donor contributions.
For this purpose, USAID through its project Health Systems 20/20 funded a comprehensive Egypt Household Health Services Expenditure and Utilization Survey 2009/2010 (HHEUS) to be conducted by the Egyptian statistics organization Central Agency for Public Mobilization and Statistics (CAPMAS).
This report seeks to identify variation in use of health care, out-of-pocket expenditures, and health insurance coverage across Egypt. Household out-of-pocket health expenditure includes direct medical expenditure for services like consultations, treatment, and preventive fees. In addition, households may incur direct non-medical expenditure on activities related to the health care-seeking process, like transportation to and from the health care facility.
1.2 OBJECTIVES OF THE SURVEY
The main objective of HHEUS 2009/10 is to provide policymakers, donors, and researchers with comprehensive information on the type and frequency of health services used. It also provides information about the level and distribution of out-of-pocket spending on health care, factors that influence the use of health care services, and health care spending. Within the remits of these objectives, the survey will:
Estimate the level of household out-of-pocket spending on health care.
Estimate the proportion of population covered by different health insurance plans.
Determine the pattern of health care services use.
Identify the different mechanisms of households to fund health care expenditures.
Identify the choice of providers of different health care services according to socioeconomic and demographic variables.
1.3 SURVEY METHODOLOGY
1.3.1 DESIGN AND SAMPLING
The household survey is community based and was conducted at the national level in 22 governorates (excluding the border governorates). The survey was conducted in February and July 2010 to capture the seasonal effects on health and patterns of disease.
1.3.1.1 QUESTIONNAIRE DESIGN:
The questionnaires were designed to include comprehensive questions covering household socio-demographic characteristics, health service utilization, and cost. The data for the Household Survey (HHS) were collected through interviews with the heads of households using seven structured questionnaires covering the following:

4
HOUSEHOLD QUESTIONNAIRE:
Identification of the household.
Demographic and socioeconomic characteristics of household members, including gender, age, educational level, and marital and economic status.
Health insurance coverage of household members, type of coverage, monthly premiums, use of health insurance services during the 12 months preceding the survey.
Household income from different members involved in economic activity, characteristics of household‟s dwelling, etc.
Household expenditure on items other than health.
Household assets to determine the social status and to triangulate the responses.
Mechanisms adopted by the households to cope with the out-of-pocket expenditure on health care.
CHRONIC DISEASES QUESTIONNAIRE:
Presence of chronic diseases among household members.
Frequency and type of health care used for chronic diseases.
Expenditures incurred during the four weeks preceding the survey.
NON-CHRONIC / ACUTE DISEASES QUESTIONNAIRE:
Episodes of acute diseases during the four weeks preceding the survey for each household member.
Frequency and type of health care use for acute diseases.
Expenditures incurred during the four weeks preceding the survey.
HOSPITAL ADMISSION QUESTIONNAIRE:
Frequency of hospital admission by each household member during the 12 months preceding the survey.
Out-of-pocket expenditure incurred during a hospital stay.
OUT-OF-COUNTRY HEALTH CARE QUESTIONNAIRE:
Frequency of health care used outside the country during the 24 months preceding the survey.
Out-of-pocket expenditure on out of country health care services.
DENTAL DISEASES QUESTIONNAIRE:
Episodes of dental conditions requiring medical attention during the 12 months preceding the survey (not including routine dental check-ups).
Frequency and type of curative dental care use.
Out-of-pocket expenditure incurred.
PREVENTIVE HEALTH CARE QUESTIONNAIRE:
Use of preventive health services (vaccinations, growth monitoring, antenatal care, pregnancy follow up, family planning, routine check up for dental care, pap smear, mammography, pre-marriage consultation, pre-employment/traveling check up, and other) by household members during the 12 months preceding the survey.
Out-of-pocket expenditure on these services.

5
1.3.2 SAMPLE SELECTION
The target survey sample comprised 12,000 households representing the urban and rural parts of Egypt, covering 22 governorates (border governorates were excluded). The survey was conducted in two phases, each covering 6,000 families (different families/households were surveyed in the two phases) to capture the seasonal effects on health and patterns of diseases.
The sampling methodology was designed to provide national estimates (excluding the border governorates) of all variables as well as estimates for place of residence (rural/urban) and for the five geographic regions: main urban governorates, rural Lower Egypt, urban Lower Egypt, rural Upper Egypt, and urban Upper Egypt.
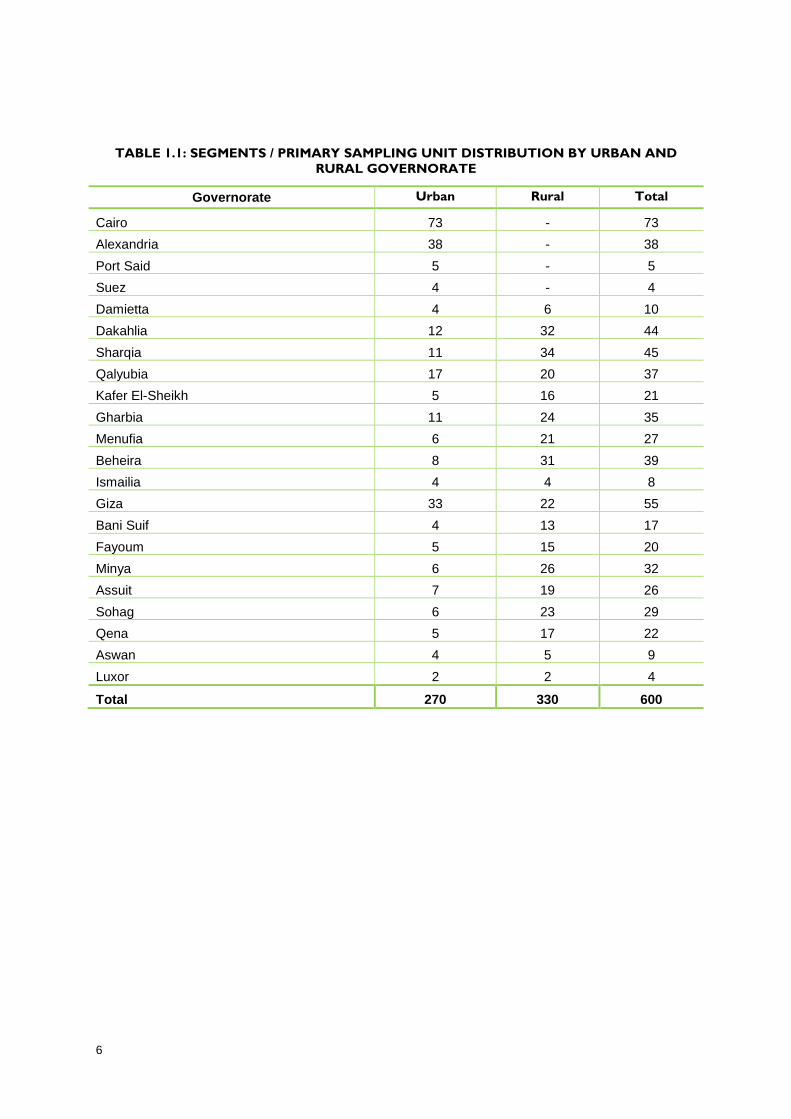
The sampling frame used was the same as that of the 2008/2009 Health Income and Expenditure Consumption Survey, which CAPMAS routinely conducts. The frame consisted of 2,526 segments / Primary Sampling Units, each comprising 200 households, covering all urban and rural Egypt (excluding border governorates). Out of this a self-weighted sample of 600 segments (270 urban and 330 rural) was selected for the survey using the a stratified clusters sampling methodology. Table 1.1 clarifies the distribution of these segments across Egypt excluding border governorates.
6
TABLE 1.1: SEGMENTS / PRIMARY SAMPLING UNIT DISTRIBUTION BY URBAN AND
RURAL GOVERNORATE
Governorate Urban Rural Total
Cairo 73 - 73
Alexandria 38 - 38
Port Said 5 - 5
Suez 4 - 4
Damietta 4 6 10
Dakahlia 12 32 44
Sharqia 11 34 45
Qalyubia 17 20 37
Kafer El-Sheikh 5 16 21
Gharbia 11 24 35
Menufia 6 21 27
Beheira 8 31 39
Ismailia 4 4 8
Giza 33 22 55
Bani Suif 4 13 17
Fayoum 5 15 20
Minya 6 26 32
Assuit 7 19 26
Sohag 6 23 29
Qena 5 17 22
Aswan 4 5 9
Luxor 2 2 4
Total 270 330 600

7
A complete listing of all households in the selected segments was made and a systematic sample of 22 households was selected from each segment. The targeted sample size of 12,000 household was increased to 13,200 (10 percent increase) to cover any gap caused by closed and „relocated‟ households.
The survey covered 56,305 individuals. The first phase (winter) covered 28,167 individuals while the second phase (summer) covered 28,138 individuals distributed as shown in table 1.2. The individuals surveyed in each phase did not overlap; that is, the two survey phases covered completely different households/individuals.
TABLE 1.2: DISTRIBUTION OF SAMPLE BY GOVERNORATE AND SURVEY PHASE
Governorate
Survey Phases Total
First Phase Second Phase
No. of
Individuals
% of
Sample
No. of
Individuals
% of
Sample
No. of
Individuals
% of
Sample
Cairo 2,427 8.6 2,576 9.2 5,003 8.9
Alexandria 1,574 5.6 1,633 5.8 3,207 5.7
Port Said 260 0.9 169 0.6 429 0.8
Suez 178 0.6 145 0.5 323 0.6
Helwan 720 2.6 626 2.2 1,346 2.4
6th of October 1,425 5.1 1,154 4.1 2,579 4.6
Damietta 386 1.4 391 1.4 777 1.4
Dakahlia 1,823 6.5 1,851 6.6 3,674 6.5
Sharqia 2,110 7.5 2,035 7.2 4,145 7.4
Qalyubia 1,822 6.5 1,660 5.9 3,482 6.2
KaferEl-Sheikh 1,048 3.7 976 3.5 2,024 3.6
Gharbia 1,441 5.1 1,474 5.2 2,915 5.2
Monufia 1,177 4.2 1,160 4.1 2,337 4.2
Beheira 1,698 6 1,656 5.9 3,354 6
Ismailia 416 1.5 363 1.3 779 1.4
Giza 962 3.4 1,173 4.2 2,135 3.8
Bani Suif 977 3.5 982 3.5 1,959 3.5
Fayoum 1,284 4.6 1,215 4.3 2,499 4.4
Minya 1,707 6.1 1,588 5.6 3,295 5.9
Assuit 1,403 5 1,543 5.5 2,946 5.2
Sohag 1,581 5.6 1,712 6.1 3,293 5.8
Qena 1,156 4.1 1,386 4.9 2,542 4.5
Aswan 399 1.4 473 1.7 872 1.5
Luxor 193 0.7 197 0.7 390 0.7
Total 28,167 100 28,138 100 56,305 100

8
1.3.3 SAMPLE COVERAGE AND RESPONSE RATES
Table 1.3 shows the sample coverage and individual response rates. A total of 12,002 households were surveyed with a response rate of 100 percent.1 There were 56,305 individuals living in the interviewed households. Some of the household members were qualified for more than one questionnaire. Thus 68,410 questionnaires were administered. Of these, 68,406 questionnaires were actually completed which is a response rate of 99.9 percent.
TABLE 1.3: RESPONSE RATE OF INDIVIDUALS SAMPLED
Governorate Individuals Qualified for the
Survey
Individuals
Completed the
Survey
Response Rate
Cairo 6,264 6,264 100.0%
Alexandria 4,252 4,252 100.0%
Port Said 593 593 100.0%
Suez 386 386 100.0%
Helwan 1,421 1,421 100.0%
6th of October 2,329 2,329 100.0%
Damietta 1,012 1,012 100.0%
Dakahlia 5,460 5,460 100.0%
Sharqia 6,281 6,281 100.0%
Qalyubia 4,346 4,346 100.0%
Kafer El-Sheikh 3,465 3,465 100.0%
Gharbia 4,571 4,571 100.0%
Monufia 3,056 3,056 100.0%
Beheira 3,944 3,942 99.95%
Ismailia 785 785 100.0%
Giza 3,069 3,069 100.0%
Bani Suif 2,544 2,544 100.0%
Fayoum 3,771 3,770 99.97%
Minya 2,778 2,778 100.0%
Assuit 3,255 3,255 100.0%
Sohag 2,110 2,109 99.95%
Qena 2,160 2,160 100.0%
Aswan 374 374 100.0%
Luxor 184 184 100.0%
Total 68,410 68,406 99.99%
1 Although 13,200 households were selected to be surveyed, the target number of households to be
surveyed was 12,000. The extra 1,200 households were included only to cover for closed or relocated households (i.e., households no longer in existence). Therefore, the response rate is 100 percent because 12,002 households completed the survey out of a desired 12,000.

9
1.4 WEALTH INDEX CONSTRUCTION
The wealth index is intended to measure the non-cash household possessions. The wealth index was created based upon survey responses, and each household is assigned to one of five wealth indices: lowest, lower middle, middle, upper middle, or highest. The wealth index is a relative measure of household wealth compared with other households in the population.
Each household‟s wealth index assignment is based upon a weighted average of 41 variables. Each variable falls into one of four categories:
Household possessions/goods;
Possession of agricultural land;
Numbers of five types of farm animals.
The wealth index is the first principal component of the 41 variables. Principal components are weighted averages of the variables used to construct them. Among all weighted averages, the first principal component is the one that has the greatest ability to predict the individual variables that make it up, where prediction is measured by the variance of the index. This calculation is based on that used in analyses of the Demographic and Health Surveys.2
For the tables presented here, households are divided into equally sized fifths. Because some households have more members than others, the number of people in each quintile may not be exactly one-fifth of the total number of persons. Note that 47 individuals are missing from the wealth index.
2 http://www.measuredhs.com/pubs/pdf/CR6/CR6.pdf


2. SOCIOECONOMIC
CHARACTERISTICS OF
HOUSEHOLDS AND
INDIVIDUALS
3.


13
Results from the HHEUS 2009/10 illustrate vast differences between urban and rural households. Although urban and rural households report similar age and sex distributions, rural households consistently report worse living conditions, lower educational levels, higher illiteracy rates, and lower wealth than do urban households. About 60 percent of households in Egypt are rural. The data discussed in this chapter also reveal differences between males and females in terms of educational attainment and literacy rates. We also find below that roughly half of the population has health insurance, and that there is a current demographic trend toward a more youthful population, which will place increasingly greater strain upon Egypt‟s social programs in years to come.
2.1 POPULATION DISTRIBUTION ACCORDING TO
SOCIOECONOMIC INDICATORS
Table 2.1 presents the estimated distribution of the Egyptian population (excluding the border governorates) according to select socioeconomic characteristics that are presented repeatedly throughout this report. The national percentage estimates are calculated based upon the number of individuals or households surveyed for HHEUS 2009/2010. Recall that the sample was selected to self-weight to the national level. Because this survey was not a census, these statistics are only estimates and may differ from those found in other sources.
The national population is estimated to be about equally half male and half female. Sixty percent of households are rural households; 58 percent of these rural households are in Lower Egypt (34.5 percent of all households) and the remaining 42 percent are in Upper Egypt (25.0 percent of all households). Sixteen percent of households live in major cities, 14.2 percent live in urban Lower Egypt, and 10.4 percent live in urban Upper Egypt.
A little over one-third (35.2 percent) of individuals are 15 years of age or younger, and 26.5 percent are ages 16 to 29; this demonstrates a clear trend toward a more youthful population. An estimated 42.6 percent of the population is illiterate or under age 10, the age by which one should have finished the obligatory primary education thus allowing literacy to be assessed; this breaks down into about 21 percent of the population over age 10 being illiterate. A further discussion of the educational level of the population is presented below. Roughly half of the population has health insurance.
As described above, the households in the sample were assigned to a wealth index, which was evenly distributed among households in the sample. Because households have different numbers of individuals, the wealth index distributions presented below are not exactly 20 percent each. The sample was also divided into equal-sized income quintiles, which are based on household income per capita calculations.

14
TABLE 2.1: POPULATION DISTRIBUTION BY BACKGROUND CHARACTERISTICS
Background Characteristic Sub-Population Sample
Number
Estimated Percent of the
Population
Gender
Male 28,316 50.3
Female 27,989 49.7
Urban/Rural
Urban 22,790 40.5
Rural 33,515 59.5
Region
Major Cities 8,962 15.9
Urban Lower Egypt 7,979 14.2
Urban Upper Egypt 5,849 10.4
Rural Lower Egypt 19,433 34.5
Rural Upper Egypt 14,082 25.0
Insured
Yes 28,717 51.0
No 27,588 49.0
Age
<5 6,263 11.1
5-15 13,545 24.1
16-29 14,941 26.5
30-39 6,850 12.2
40-49 5,749 10.2
50-59 4,524 8.0
>60 4,433 7.9
Education
<10 and/or Illiterate 24,013 42.6
Less than HS 16,549 29.4
High School 10,342 18.4
University Degree 5,401 9.6
Wealth Index*
Lowest 11,669 20.7
Lower Middle 11,884 21.1
Middle 11,759 20.9
Upper Middle 10,928 19.4
Highest 10,018 17.8
Income Quintiles*
Lowest 11,279 20.0
Second 11,248 20.0
Third 11,263 20.0
Fourth 11,277 20.0
Highest 11,238 20.0
*Recall that 47 individuals are missing from the wealth analysis. Income quintiles are based on household
income per capita calculations.
15
2.2 URBAN-RURAL DISTRIBUTION BY KEY
SOCIOECONOMIC INDICATORS
2.2.1 AGE, SEX, AND RESIDENCE DISTRIBUTION
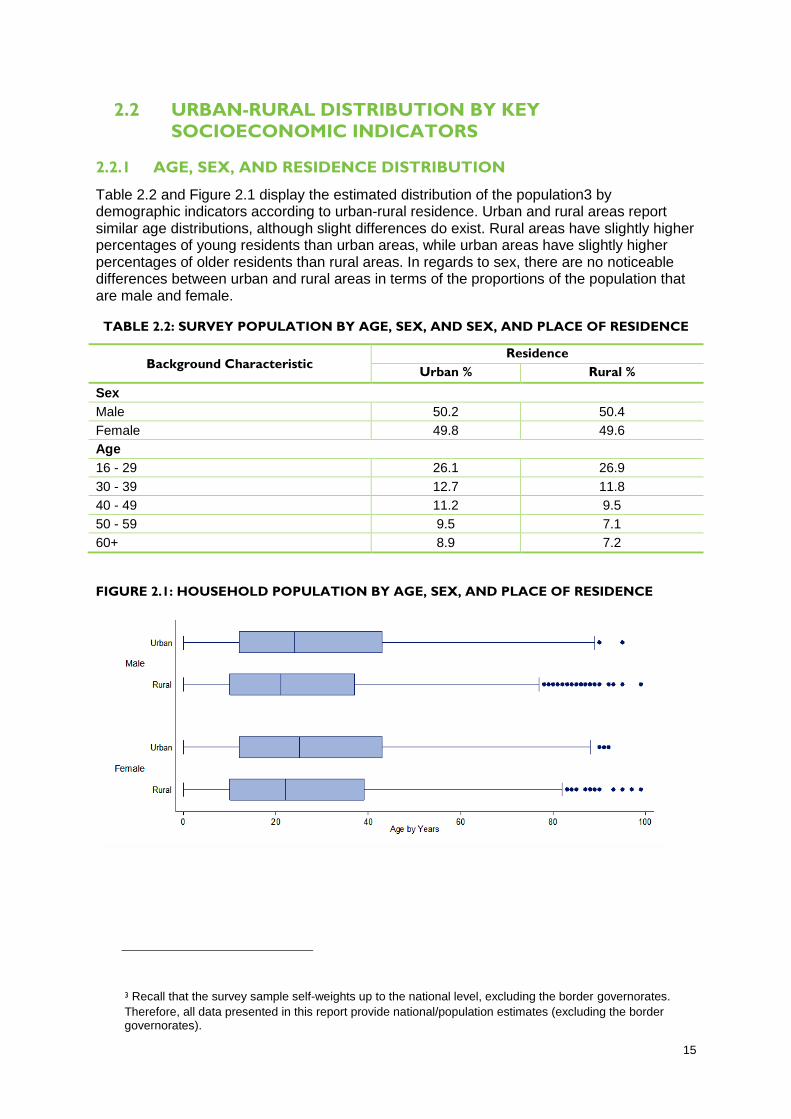
Table 2.2 and Figure 2.1 display the estimated distribution of the population3 by demographic indicators according to urban-rural residence. Urban and rural areas report similar age distributions, although slight differences do exist. Rural areas have slightly higher percentages of young residents than urban areas, while urban areas have slightly higher percentages of older residents than rural areas. In regards to sex, there are no noticeable differences between urban and rural areas in terms of the proportions of the population that are male and female.
TABLE 2.2: SURVEY POPULATION BY AGE, SEX, AND SEX, AND PLACE OF RESIDENCE
Background Characteristic Residence
Urban % Rural %
Sex
Male 50.2 50.4
Female 49.8 49.6
Age
16 - 29 26.1 26.9
30 - 39 12.7 11.8
40 - 49 11.2 9.5
50 - 59 9.5 7.1
60+ 8.9 7.2
FIGURE 2.1: HOUSEHOLD POPULATION BY AGE, SEX, AND PLACE OF RESIDENCE
3 Recall that the survey sample self-weights up to the national level, excluding the border governorates.
Therefore, all data presented in this report provide national/population estimates (excluding the border governorates).

16
2.2.2 EDUCATIONAL ATTAINMENT
Survey results show that there are variations in educational levels between urban and rural areas in Egypt, especially at both ends of the educational-level spectrum. As Table 2.3 shows, rural populations have much higher illiteracy rates (44.5 percent) than those in urban areas (23.3 percent), with far less university level education (8.5 percent) than urban populations (26.5 percent). However, there is no major difference in the distribution of other educational levels between urban and rural residents.
HHEUS results also show that there are significant differences in educational attainment between males and females in Egypt. In general, females have a much higher illiteracy rate than males in both urban and rural areas. In urban areas, the female illiteracy rate is 12.8 percentage points higher than it is for males. This gap is even wider in rural areas where the female illiteracy rate is 26.5 percentage points higher for females than males, and where more than half (57.5 percent) of the female population is illiterate. Also, about 10 percent fewer females than males report having ever gone to school (as seen in the “less than high school” education category) in both urban and rural areas. Females also have lower rates of higher education, a difference which is most prevalent in rural areas.
Table 2.3 is based on household members who are 10 years old or above and are no longer in school (i.e., they have completed or stopped their education).
TABLE 2.3: ESTIMATED POPULATION DISTRIBUTION BY PLACE OF RESIDENCE,
EDUCATION LEVEL, AND SEX
Education Level through the surveying
year (10 Years & Above)
Sex
Total %
Male % Female %
Urban Residents
Illiterate 16.8 29.6 23.3
Less than High School 27.7 19.9 23.7
High School or Tech 26.7 26.2 26.5
AA (Associates of Arts) / University Degree 28.8 24.3 26.5
Rural Residents
Illiterate 31.0 57.5 44.5
Less than High School 26.9 16.0 21.3
High School or Tech 30.8 20.8 25.7
AA / University Degree 11.3 5.8 8.5
17
2.2.3 WEALTH DISTRIBUTION
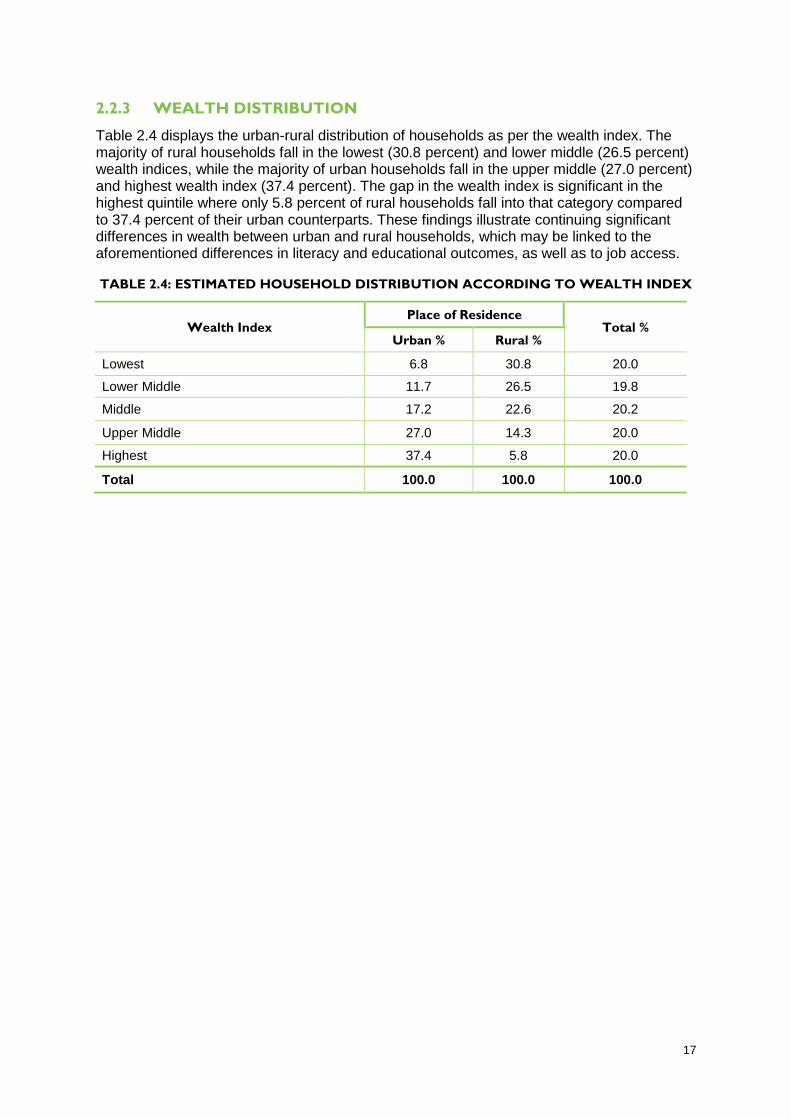
Table 2.4 displays the urban-rural distribution of households as per the wealth index. The majority of rural households fall in the lowest (30.8 percent) and lower middle (26.5 percent) wealth indices, while the majority of urban households fall in the upper middle (27.0 percent) and highest wealth index (37.4 percent). The gap in the wealth index is significant in the highest quintile where only 5.8 percent of rural households fall into that category compared to 37.4 percent of their urban counterparts. These findings illustrate continuing significant differences in wealth between urban and rural households, which may be linked to the aforementioned differences in literacy and educational outcomes, as well as to job access.
TABLE 2.4: ESTIMATED HOUSEHOLD DISTRIBUTION ACCORDING TO WEALTH INDEX
Wealth Index Place of Residence
Total % Urban % Rural %
Lowest 6.8 30.8 20.0
Lower Middle 11.7 26.5 19.8
Middle 17.2 22.6 20.2
Upper Middle 27.0 14.3 20.0
Highest 37.4 5.8 20.0
Total 100.0 100.0 100.0
18
2.3 HOUSING CHARACTERISTICS
The survey also collected data on several housing characteristics in order to better describe the housing profile in Egypt. This includes the type of housing, number of rooms in the household, sources of water, access to bathrooms and waste disposal, and the possession of various household amenities.
2.3.1 HOUSING TYPES AND SIZES
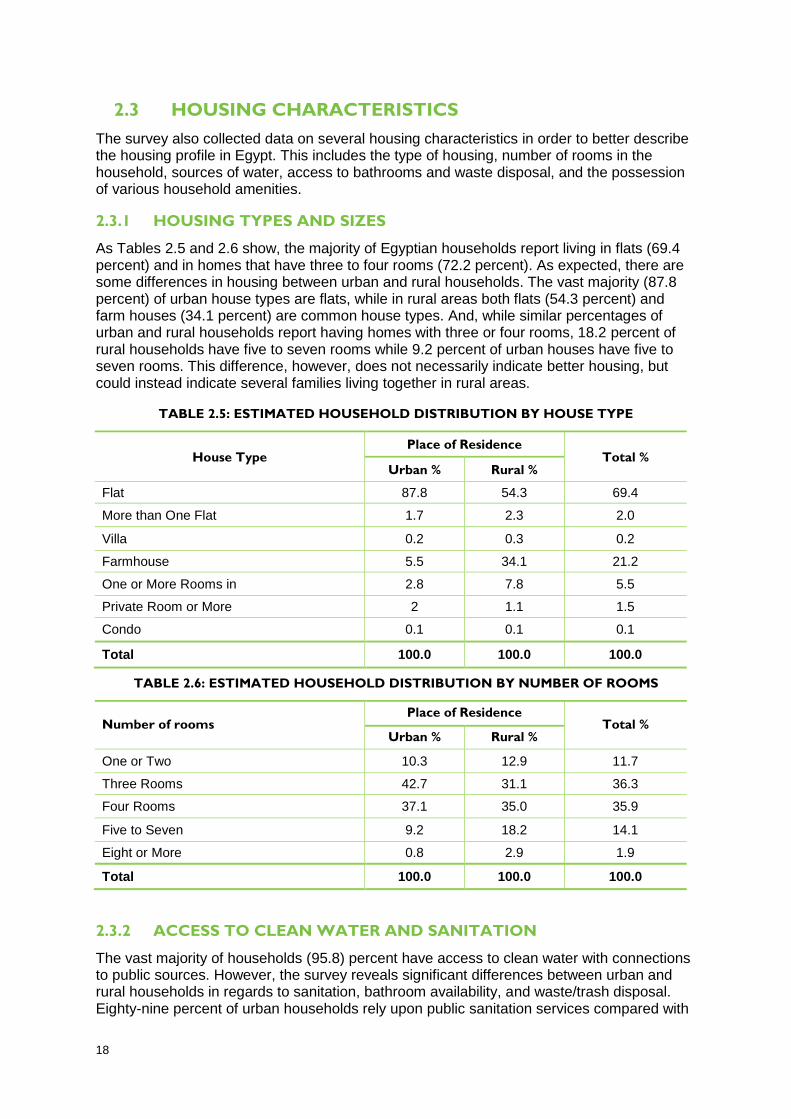
As Tables 2.5 and 2.6 show, the majority of Egyptian households report living in flats (69.4 percent) and in homes that have three to four rooms (72.2 percent). As expected, there are some differences in housing between urban and rural households. The vast majority (87.8 percent) of urban house types are flats, while in rural areas both flats (54.3 percent) and farm houses (34.1 percent) are common house types. And, while similar percentages of urban and rural households report having homes with three or four rooms, 18.2 percent of rural households have five to seven rooms while 9.2 percent of urban houses have five to seven rooms. This difference, however, does not necessarily indicate better housing, but could instead indicate several families living together in rural areas.
TABLE 2.5: ESTIMATED HOUSEHOLD DISTRIBUTION BY HOUSE TYPE
House Type Place of Residence
Total % Urban % Rural %
Flat 87.8 54.3 69.4
More than One Flat 1.7 2.3 2.0
Villa 0.2 0.3 0.2
Farmhouse 5.5 34.1 21.2
One or More Rooms in 2.8 7.8 5.5
Private Room or More 2 1.1 1.5
Condo 0.1 0.1 0.1
Total 100.0 100.0 100.0
TABLE 2.6: ESTIMATED HOUSEHOLD DISTRIBUTION BY NUMBER OF ROOMS
Number of rooms Place of Residence
Total % Urban % Rural %
One or Two 10.3 12.9 11.7
Three Rooms 42.7 31.1 36.3
Four Rooms 37.1 35.0 35.9
Five to Seven 9.2 18.2 14.1
Eight or More 0.8 2.9 1.9
Total 100.0 100.0 100.0
2.3.2 ACCESS TO CLEAN WATER AND SANITATION
The vast majority of households (95.8) percent have access to clean water with connections to public sources. However, the survey reveals significant differences between urban and rural households in regards to sanitation, bathroom availability, and waste/trash disposal. Eighty-nine percent of urban households rely upon public sanitation services compared with

19
23.6 percent of rural households, where 56.8 percent rely upon reservoir sanitation. Additionally, 74.0 percent of urban households have access to private bathrooms, but only 25.0 percent of the rural population has this access. The methods of trash disposal also vary greatly between urban and rural areas; for instance, 45.1 percent of urban households use communal trash bins as the main source of disposal compared to 5.2 percent of rural households.
TABLE 2.7: ESTIMATED HOUSEHOLD DISTRIBUTION BY HOUSING CHARACTERISTICS
Housing Characteristics Place of Residence
Urban % Rural % Total %
Source of Water
Public 99.2 93.1 95.8
Pump 0.6 5.5 3.3
Well 0.0 0.2 0.1
Other 0.1 1.2 0.7
Sanitation
Public 89.0 23.6 53.0
Private 1.5 16.6 9.8
Reservoir 9.4 56.8 35.5
Other 0.0 2.3 1.3
None 0.1 0.8 0.4
Bathroom Availability
Private 74.0 25.0 47.1
Joint 0.7 0.6 0.7
None 25.2 74.4 52.3
Waste/ Trash Disposal
Scavenger 25.2 10.0 16.8
Company 14.1 17.6 16.0
Communal Trash Bins 45.1 5.2 23.1
Throw into the Street 7.1 13.4 10.6
Other 8.5 53.8 33.4
Number of Households 5,396 6,606 12,002

20
2.3.3 HOUSEHOLD POSSESSIONS
TABLE 2.8: ESTIMATED HOUSEHOLD BY HOUSEHOLD POSSESSIONS
Household Possessions Place of Residence
Total %
Urban % Rural %
Air Conditioning 13.6 1.5 6.9
Automatic Washing Machine 10.3 7.6 8.8
Bicycle 9.5 17.9 14.2
Camera 5.2 1.1 3.0
Cell Phone 86.9 77.5 81.8
Chopper/Mixer 91.9 81.5 86.2
Color TV 93.7 82.3 87.4
Deep Fridge 13.1 4.0 8.1
Digital Camera 3.0 0.3 1.5
Dish Washer Machine 3.6 0.5 1.9
Electric Iron 77.4 58.6 67.0
Fan 91.4 86.7 88.8
Fridge 95.6 85.5 90.0
Heater (Electric, Gas, Kerosene) 7.8 3.1 5.2
Internet/Router 15.9 3.3 9.0
Kitchen Machine 3.5 0.3 1.8
Land Phone 61.6 36.1 47.5
Microwave/Grill 6.4 1.9 3.9
Motorcycle 3.5 6.7 5.3
MP 3,4,5 2.8 0.6 1.6
PC/Laptop 35.7 10.7 21.8
Private Automobile 14.1 2.5 7.7
Recorder 51.0 37.2 43.4
Receiver Satellite 79.4 67.0 72.6
Semi Automatic Washing Machine 38.0 4.9 19.8
Sewing Machine 7.2 3.4 5.1
Stove (Gas, Electric) 97.3 95.8 96.5
Vacuum Cleaner 33.5 6.7 18.7
Video/DVD 8.0 1.5 4.4
W/B/TV 4.4 10.3 7.7
Washing Machine 53.8 80.4 68.4
Water Filter 4.7 0.7 2.5
Water Heater (Electric, Gas) 64.2 21.0 40.4

3. HEALTH STATUS AND
SERVICE UTILIZTAION
PROFILE


23
The tables in this section summarize results from the HHEUS 2009/2010 related to the health status, service utilization, and productivity loss profile of the population. As reported below, acute illnesses are more common than either dental or chronic illnesses, with about 51 percent of the population reporting at least one acute illness episode in the four weeks prior to taking the survey. The illness with the largest prevalence in the general population is the common cold. We also find some differences in illness prevalence by background characteristic, as reported below. It is interesting to note that although the health profile in Egypt is transitioning from infectious diseases to chronic/non-communicable diseases, acute illnesses are still the most commonly reported type of illness, with chronic illnesses being reported by only 22 percent of the population.
This chapter also presents data on visits made to any sort of health care providers to treat illnesses. Visits were made for 77.1 percent of all acute illness episodes, and for 72.8 percent of all chronic illness episodes. An analysis of visit rates by background characteristics is also presented, wherein we find no pattern in visit rates for chronic illnesses, but patterns in the visit rates for acute illnesses that indicate that less-educated Egyptians and Egyptians in rural areas are more inclined to make visits, and that acute illness visits are more often made for vulnerable populations. Lastly, this chapter analyses productivity losses due to illness. The patterns of productivity loss within each background characteristic category are roughly similar for acute and chronic illnesses. However, acute illnesses create higher losses than chronic illnesses in terms of the estimated percentage of the population who lose at least one day of normal activity.
3.1 EPISODES OF ACUTE, CHRONIC, AND DENTAL
ILLNESSES
Each respondent in the HHEUS 2009/2010 who had an acute or chronic illnesses in the four weeks prior to taking the survey,4 and/or who had a dental disease in the 12 months prior to taking the survey, was asked to give further details on up to three illnesses or episodes5 within each disease type (acute, chronic, and dental). Using these reported illness episodes, the estimated commonness of each illness in the population is calculated. Acute illnesses were the most commonly reported illness type (50.6 percent), followed by dental illnesses (24.2 percent), and then by chronic illnesses (21.9 percent). The most commonly reported illness was the common cold (26.9 percent of the total sample had this illness in the prior four weeks), followed by “other” dental problems (11.7 percent), “other” acute illnesses (11.3 percent), and dental caries (8.1 percent).
Table 3.1 shows the occurrences of different acute illnesses. The number of total episodes reported in the sample is largest for the common cold (15,161 episodes), followed by “other” acute illnesses (6,351 episodes), bone disease (2,026 episodes), and gastroenteritis (1,644 episodes). The last column of Table 3.1 shows the estimated prevalence of the illness in Egypt (excluding the border governorates). The acute illness with the largest prevalence is the common cold (26.9 percent) followed by “other” acute illnesses (11.3 percent), orthopedic disease (3.6 percent), gastroenteritis (2.9 percent), and eye problems (2.6 percent).
4 Recall that the survey was conducted in February and July 2010 to capture the seasonal effects on health
and patterns of disease. 5 Respondents could have reported more than one episode of the same illness, or three different illnesses,
or some combination thereof (e.g., a respondent could have reported two instances of fever and one instance of respiratory disease; or three instances of fever; or one instance of fever, one instance of respiratory disease, and one instance of typhoid). The results reported here do not differentiate between multiple episodes of the same illness in one person versus one episode in many people. Note that the common cold and orthopaedic diseases (acute illnesses) could only be reported once by each individual – multiple episodes within the prior four weeks were not recorded.

24
TABLE 3.1: OCCURRENCES OF ACUTE ILLNESSES
Acute Illness Total Episodes Reported in
the Sample
Estimated Percent of
Population with the Illness*
Gastroenteritis 1,644 2.9
Fever 710 1.3
Hepatitis 185 0.3
Typhoid 17 0.0
Respiratory Disease 667 1.2
Measles/Rubella 5 0.0
Abscesses (minor surgeries) 105 0.2
Contusions 194 0.3
Eye Problems 1,447 2.6
Orthopedic Disease 2,026 3.6
Common Cold 15,161 26.9
Others 6,351 11.3
Total 28,512 50.6
*These percentages are calculated assuming that each reported episode represents a new individual; instances
of one person reporting multiple episodes are not accounted for.
Table 3.2 shows a similar occurrence of disease analysis for chronic illness episodes
reported over the four weeks prior to survey administration. The number of total episodes reported by the sample is largest for “other” chronic illnesses (3,997 episodes), followed by hypertension (3,373 episodes), hyperglycemia (2,131 episodes), cardiac disease (886 episodes), and rheumatic diseases (814 episodes). The most prevalent illness in the population (as reported in last column of Table 3.2) is “other” chronic illnesses (7.1 percent) followed by hypertension (6.0 percent), hyperglycemia (3.8 percent), and cardiac disease (1.6 percent), and rheumatic diseases (1.4 percent). In total, chronic illness has a prevalence of 21.9 percent in the entire population compared to the 50.6 percent prevalence for acute illness.
TABLE 3.2: OCCURRENCES OF CHRONIC ILLNESSES
Chronic Illness Total Episodes Reported in
the Sample
Estimated Percent of
Population with the Illness*
Hypertension 3,373 6.0
Hyperglycemia 2,131 3.8
Rheumatic Diseases 814 1.4
Renal Diseases 266 0.5
Cardiac Disease 886 1.6
TB 3 0.0
Asthma 397 0.7
Cancer 70 0.1
Mental Disease 178 0.3
Malnutrition 228 0.4
Others 3,997 7.1
Total 12,343 21.9
*These percentages are calculated assuming that each reported episode represents a new individual; instances
of one person reporting multiple episodes are not accounted for.
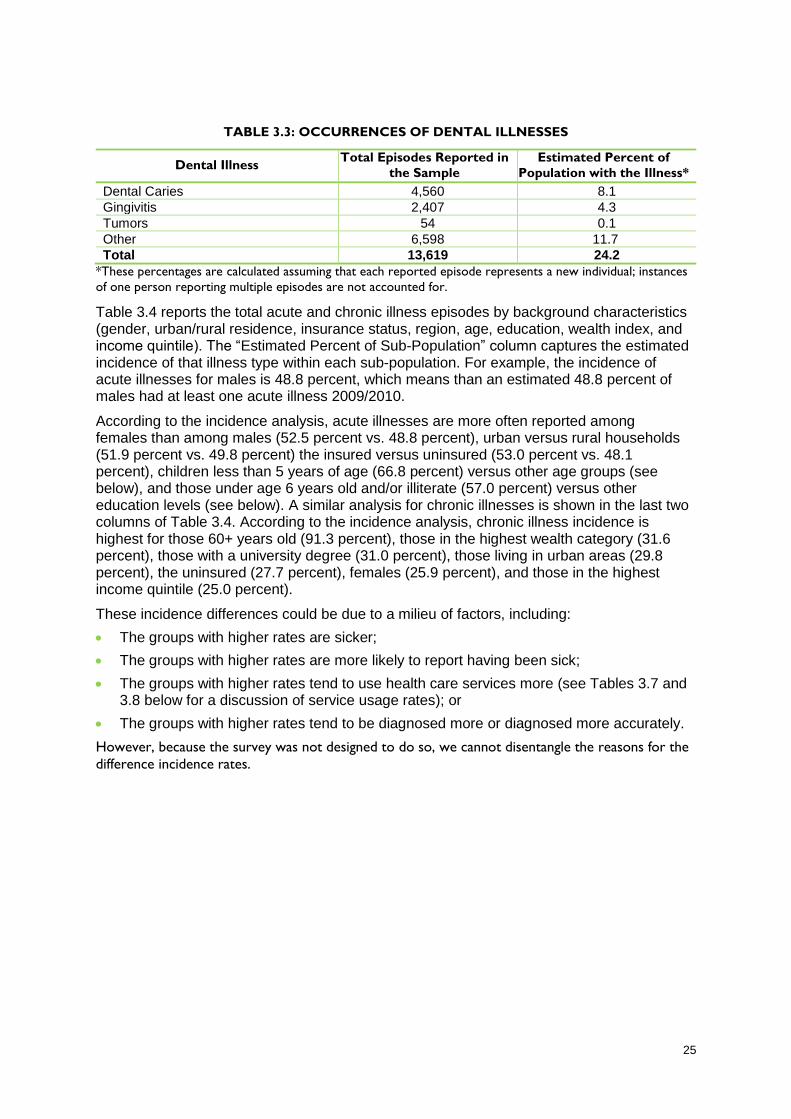
Table 3.3 shows the occurrences of dental illness episodes reported over the 12 months prior to the survey. The number of total episodes is largest for “other” dental illnesses (6,598 episodes), followed by dental caries (4,560 episodes), gingivitis (2,407 episodes), and tumors (54 episodes). As an estimated percentage of the population, “other” dental illness is also the largest at 11.7 percent.
25
TABLE 3.3: OCCURRENCES OF DENTAL ILLNESSES
Dental Illness Total Episodes Reported in
the Sample
Estimated Percent of
Population with the Illness*
Dental Caries 4,560 8.1
Gingivitis 2,407 4.3
Tumors 54 0.1
Other 6,598 11.7
Total 13,619 24.2
*These percentages are calculated assuming that each reported episode represents a new individual; instances
of one person reporting multiple episodes are not accounted for.
Table 3.4 reports the total acute and chronic illness episodes by background characteristics (gender, urban/rural residence, insurance status, region, age, education, wealth index, and income quintile). The “Estimated Percent of Sub-Population” column captures the estimated incidence of that illness type within each sub-population. For example, the incidence of acute illnesses for males is 48.8 percent, which means than an estimated 48.8 percent of males had at least one acute illness 2009/2010.
According to the incidence analysis, acute illnesses are more often reported among females than among males (52.5 percent vs. 48.8 percent), urban versus rural households (51.9 percent vs. 49.8 percent) the insured versus uninsured (53.0 percent vs. 48.1 percent), children less than 5 years of age (66.8 percent) versus other age groups (see below), and those under age 6 years old and/or illiterate (57.0 percent) versus other education levels (see below). A similar analysis for chronic illnesses is shown in the last two columns of Table 3.4. According to the incidence analysis, chronic illness incidence is highest for those 60+ years old (91.3 percent), those in the highest wealth category (31.6 percent), those with a university degree (31.0 percent), those living in urban areas (29.8 percent), the uninsured (27.7 percent), females (25.9 percent), and those in the highest income quintile (25.0 percent).
These incidence differences could be due to a milieu of factors, including:
The groups with higher rates are sicker;
The groups with higher rates are more likely to report having been sick;
The groups with higher rates tend to use health care services more (see Tables 3.7 and 3.8 below for a discussion of service usage rates); or
The groups with higher rates tend to be diagnosed more or diagnosed more accurately.
However, because the survey was not designed to do so, we cannot disentangle the reasons for the
difference incidence rates.

26
TABLE 3.4: OCCURRENCES OF ACUTE AND CHRONIC ILLNESS IN THE FOUR WEEKS
PRIOR TO SURVEY ADMINISTRATION, BY BACKGROUND CHARACTERISTICS
Background
Characteristic
Acute Illnesses Chronic Illnesses
Total Episodes
Reported in the
Sample
Estimated
Percent of Sub-
Population*
Total Episodes
Reported in the
Sample
Estimated
Percent of Sub-
Population*
Gender
Male 13,807 48.8 5,090 18.0
Female 14,705 52.5 7,253 25.9
Urban/Rural
Urban 11,833 51.9 6,793 29.8
Rural 16,679 49.8 5,550 16.6
Insured
Yes 15,230 53.0 4,706 16.4
No 13,282 48.1 7,637 27.7
Region
Major Cities 4,576 51.1 3,462 38.6
Urban Lower Egypt 4,394 55.1 2,170 27.2
Urban Upper Egypt 2,863 48.9 1,161 19.8
Rural Lower Egypt 10,509 54.1 4,078 21.0
Rural Upper Egypt 6,170 43.8 1,472 10.5
Age
<5 4,181 66.8 286 4.6
5-15 6,643 49.0 682 5.0
16-29 6,259 41.9 1,026 6.9
30-39 3,168 46.2 1,198 17.5
40-49 2,973 51.7 2,147 37.3
50-59 2,575 56.9 2,956 65.3
>60 2,713 61.2 4,048 91.3
Education
<6 and/or Illiterate 12,408 57.0 5,616 23.4
Less than HS 7,100 47.0 3,141 19.0
High School 4,165 44.2 1,914 18.5
University Degree 2,211 45.6 1,672 31.0
Wealth Index
Lowest 5,776 49.5 1,958 16.8
Lower Middle 5,899 49.6 2,163 18.2
Middle 6,038 51.3 2,440 20.8
Upper Middle 5,638 51.6 2,614 23.9
Highest 5,126 51.2 3,163 31.6
Income Quintiles
Lowest 5,602 49.7 2,266 20.1
Second 5,632 50.1 2,284 20.3
Third 5,711 50.7 2,397 21.3
Fourth 5,718 50.7 2,582 22.9
Highest 5,849 52.0 2,814 25.0
*The data in this table are calculated assuming that each reported episode represents a new individual;
instances of one person reporting multiple episodes are not accounted for.
27
3.2 VISITS TO TREAT ACUTE AND CHRONIC ILLNESSES
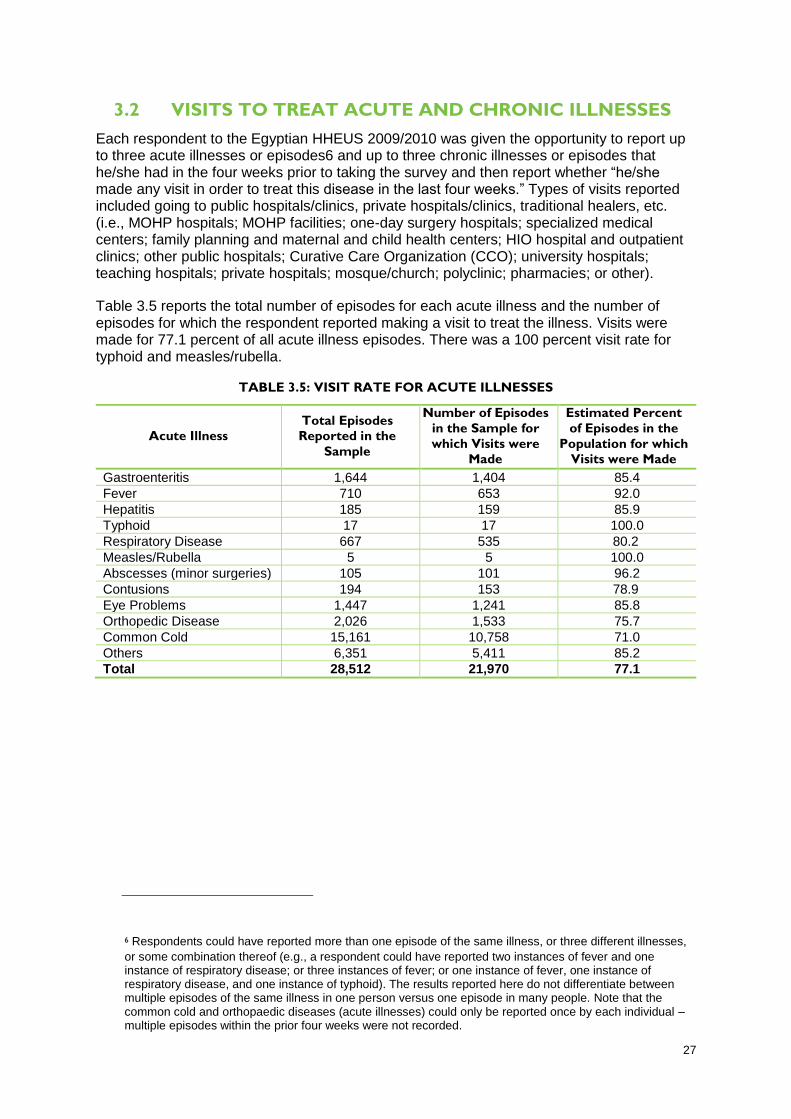
Each respondent to the Egyptian HHEUS 2009/2010 was given the opportunity to report up to three acute illnesses or episodes6 and up to three chronic illnesses or episodes that he/she had in the four weeks prior to taking the survey and then report whether “he/she made any visit in order to treat this disease in the last four weeks.” Types of visits reported included going to public hospitals/clinics, private hospitals/clinics, traditional healers, etc. (i.e., MOHP hospitals; MOHP facilities; one-day surgery hospitals; specialized medical centers; family planning and maternal and child health centers; HIO hospital and outpatient clinics; other public hospitals; Curative Care Organization (CCO); university hospitals; teaching hospitals; private hospitals; mosque/church; polyclinic; pharmacies; or other).
Table 3.5 reports the total number of episodes for each acute illness and the number of episodes for which the respondent reported making a visit to treat the illness. Visits were made for 77.1 percent of all acute illness episodes. There was a 100 percent visit rate for typhoid and measles/rubella.
TABLE 3.5: VISIT RATE FOR ACUTE ILLNESSES
Acute Illness
Total Episodes
Reported in the
Sample
Number of Episodes
in the Sample for
which Visits were
Made
Estimated Percent
of Episodes in the
Population for which
Visits were Made
Gastroenteritis 1,644 1,404 85.4
Fever 710 653 92.0
Hepatitis 185 159 85.9
Typhoid 17 17 100.0
Respiratory Disease 667 535 80.2
Measles/Rubella 5 5 100.0
Abscesses (minor surgeries) 105 101 96.2
Contusions 194 153 78.9
Eye Problems 1,447 1,241 85.8
Orthopedic Disease 2,026 1,533 75.7
Common Cold 15,161 10,758 71.0
Others 6,351 5,411 85.2
Total 28,512 21,970 77.1
6 Respondents could have reported more than one episode of the same illness, or three different illnesses,
or some combination thereof (e.g., a respondent could have reported two instances of fever and one instance of respiratory disease; or three instances of fever; or one instance of fever, one instance of respiratory disease, and one instance of typhoid). The results reported here do not differentiate between multiple episodes of the same illness in one person versus one episode in many people. Note that the common cold and orthopaedic diseases (acute illnesses) could only be reported once by each individual – multiple episodes within the prior four weeks were not recorded.
28
Table 3.6 reports the total number of episodes for each chronic illness and the number of episodes7 for which the respondent reported making a visit to treat the illness. Visits were made for 72.8 percent of all chronic illness episodes, which is slightly lower than the visit rate for acute illnesses. The highest visit rates were for cancer (81.4 percent), renal disease (81.2 percent), and asthma (80.4 percent). When considering chronic illness visit rates, one should consider that only visits within the four weeks prior to taking the survey were reported; for chronic illnesses, an individual may see a doctor at more lengthy intervals and the visits would not be recorded in this survey. Therefore, based on this data, one cannot say that only 81.4 percent individuals make visits for cancer – one can only say that 81.4 percent of individuals made visits for cancer in the four weeks prior to taking the survey.
TABLE 3.6: VISIT RATE FOR CHRONIC ILLNESSES
Chronic Illness Total Episodes
Number of
Episodes in the
Sample for which
Visits were Made
Estimated Percent
of Episodes in the
Population for
which Visits were
Made
Hypertension 3,373 2,432 72.1
Hyperglycemia 2,131 1,650 77.4
Rheumatic Diseases 814 595 73.1
Renal Diseases 266 216 81.2
Cardiac Disease 886 689 77.8
TB 3 2 66.7
Asthma 397 319 80.4
Cancer 70 57 81.4
Mental Disease 178 116 65.2
Malnutrition 228 144 63.2
Others 3,997 2,769 69.3
Total 12,343 8,989 72.8
Table 3.7 reports the estimated visit rate of the population by background characteristics for all acute illnesses combined. In general, the cohorts with the highest visit rates are those living in rural areas and those in rural Upper Egypt, the insured, those under 15 years of age or 60 years and above, and those under age 6 years and/or illiterate. There are no clear patterns between gender, wealth, or income and visit rate.
The differences in acute illness visit rates seem to indicate that less-educated Egyptians and Egyptians in rural areas are more inclined to make visits for acute illnesses, and that visits are more often made for vulnerable populations (young and old age groups).
7 Respondents could have reported more than one episode of the same illness, or three different illnesses,
or some combination thereof. The results reported here do not differentiate between multiple episodes of the same illness in one person versus one episode in many people.

29
TABLE 3.7: VISIT RATE FOR ACUTE ILLNESS BY BACKGROUND CHARACTERISTIC
Background Characteristic Visit Rate (%)*
Gender
Male 77.8
Female 76.3
Urban/Rural
Urban 73.4
Rural 79.6
Insured
Yes 79.5
No 74.2
Region
Major Cities 76.1
Urban Lower Egypt 72.6
Urban Upper Egypt 70.3
Rural Lower Egypt 75.1
Rural Upper Egypt 87.4
Age
<5 86.7
5-15 78.5
16-29 73.4
30-39 74.3
40-49 74.8
50-59 74.9
>60 80.0
Education
<6 and/or Illiterate 80.2
Less than HS 75.5
High School 73.9
University Degree 70.1
Wealth Index
Lowest 79.9
Lower Middle 77.7
Middle 78.8
Upper Middle 77.0
Highest 71.3
Income Quintiles
Lowest 75.3
Second 79.0
Third 79.0
Fourth 76.4
Highest 75.6 * The results reported here do not differentiate between multiple episodes of the same illness in one person versus one
episode per person.
30
Table 3.8 reports the estimated visit rate of the population by background characteristics for all chronic illnesses combined. In general, the cohorts with the highest visit rates are the insured, those living in rural Upper Egypt, those under 5 years old, and those in the highest income quintile. There are no clear patterns between gender, urban/rural residence, education, or wealth and visit rate. It is interesting to note that for both chronic and acute illnesses, visit rates are much higher for those living in rural Upper Egypt than those in the other four regions. The patterns of differences in visit rates are less clear for the chronic illnesses than they were for the acute illnesses.
TABLE 3.8: VISIT RATE FOR CHRONIC ILLNESS BY BACKGROUND CHARACTERISTIC
Background Characteristic Visit Rate (%)
Gender
Male 72.8
Female 72.9
Urban/Rural
Urban 72.6
Rural 73.1
Insured
Yes 74.4
No 71.9
Region
Major Cities 73.1
Urban Lower Egypt 69.7
Urban Upper Egypt 76.4
Rural Lower Egypt 69.1
Rural Upper Egypt 84.4
Age
<5 79.7
5-15 67.9
16-29 69.9
30-39 71.2
40-49 73.0
50-59 74.2
>60 73.3
Education
<6 and/or Illiterate 73.1
Less than HS 72.0
High School 72.7
University Degree 73.7
Wealth Index
Lowest 74.3
Lower Middle 69.8
Middle 74.6
Upper Middle 73.8
Highest 71.7
Income Quintiles
Lowest 69.9
Second 71.7
Third 70.4
Fourth 71.2
Highest 77.6 * The results reported here do not differentiate between multiple episodes of the same illness in one person versus one
episode per person.

31
3.3 REASONS FOR MAKING INPATIENT AND PREVENTIVE
CARE VISITS
Table 3.9 shows the reasons for which patients made inpatient health visits (i.e., hospital admission) in the 12 months prior to the survey. Inpatient visits were most frequently made for acute illnesses (an estimated 43.3 percent of all inpatient visits in Egypt were made for this reason), followed by chronic illnesses (19.3 percent). It is estimated that about 7 percent of the population made inpatient visits for any reason.
TABLE 3.9: REASONS FOR MAKING INPATIENT CARE VISITS
Reason Total Visits
(Number Reported)*
Percent of Total
Inpatient Visits
Acute Illness 1,672 43.3
Chronic Illness 743 19.3
Labor/Delivery 387 10.0
Cesarean 351 9.1
Neonatal Care 30 0.8
Accident 178 4.6
Other 498 12.9
Total 3,859 100.0 * The results reported here do not differentiate between multiple episodes of the same illness in one person versus one
episode per person.
Table 3.10 shows the reasons for which patients made preventive health care visits in the 12
months prior to the survey. Preventive care visits were most frequently made for vaccinations (an
estimated 69.8 percent of all preventive visits in Egypt were made for this reason), followed by
antenatal care (11.8 percent) and family planning (10.9 percent). It is estimated that about 45
percent of the population made preventive care visits for any reason.
TABLE 3.10: REASONS FOR MAKING PREVENTIVE CARE VISITS
Reason Total Visits
(Number Reported)*
Percent of Total
Preventive Visits
Vaccination 17,763 69.8
Growth Monitoring 175 0.7
Antenatal Care 3,004 11.8
Pregnancy Follow-up 195 0.8
Family Planning 2,774 10.9
Routine Check-up for Dental Care 179 0.7
Pap Smear 59 0.2
Mammography 30 0.1
Pre-marriage Consultation 73 0.3
Pre-employment/travel Check-up 35 0.1
Other 1,149 4.5
Total 25,436 100.0 * The results reported here do not differentiate between multiple episodes of the same illness in one person versus one
episode per person.

32
3.4 IMPACT OF ACUTE AND CHRONIC ILLNESSES ON
PRODUCTIVITY
Table 3.11 reports the estimated percentage of the population that lost at least one day of normal activity in the four weeks prior to survey administration, and the average number of normal activity days lost in the four weeks prior to survey administration, due to the first acute and chronic illnesses reported. The patterns of productivity loss within each background characteristic category are roughly similar for acute and chronic illnesses. However, acute illnesses create higher losses than chronic illnesses in terms of the estimated percentage of the population that loses at least one day of normal activity.
The results show that the under 5 age group is impacted the most by acute illnesses, with 33.9 percent of this population losing at least one day of normal activity; this age group is also one of the three groups with the high percentages of individuals losing at least one day due to chronic illness. For chronic illnesses, the three populations affected the most are those under age 5 (with an estimated 20.1 percent of this population losing at least one day of normal activity), those in urban Upper Egypt (20.2 percent losing at least one day), and those in rural Upper Egypt (20.1 percent losing at least one day).
The largest number of normal activity days lost for acute illness is for the population 60 years old and above, who report losing, on average, 1.6 days. Other populations with higher numbers of average days lost due to acute illness are those living in rural Upper Egypt (1.5 days), those under age 5 (1.4 days), and those in the lowest income quintile (1.4 days). Those in the lowest wealth index and those in rural Upper Egypt report the largest numbers of normal activity days lost due to chronic illness (both lose 1.7 days of normal activity, on average). Also, those in urban Upper Egypt and those 60 years old and above lose 1.6 days, on average.

33
TABLE 3.11: PRODUCTIVITY LOSSES DUE TO ACUTE AND CHRONIC ILLNESSES, BY
BACKGROUND CHARACTERISTICS
Background
Characteristic
Loss Due to an Acute Illness Loss Due to a Chronic Illness
% of Individuals
Who Lost at
Least One Day
of Normal
Activity
Average
Number of Days
Lost
% of Individuals
Who Lost at
Least One Day
of Normal
Activity
Average
Number of Days
Lost
Gender
Male 25.4 1.1 15.9 1.3
Female 25.4 1.1 15.6 1.1
Urban/Rural
Urban 22.0 0.9 14.2 1.0
Rural 27.7 1.2 17.5 1.4
Insured
Yes 26.3 1.1 13.5 1.0
No 24.1 1.1 17.1 1.4
Region
Major Cities 14.6 0.7 10.4 0.8
Urban Lower Egypt 24.4 1.0 16.3 1.1
Urban Upper Egypt 29.8 1.2 20.2 1.6
Rural Lower Egypt 24.4 1.1 16.4 1.3
Rural Upper Egypt 33.1 1.5 20.1 1.7
Age
<5 33.9 1.4 20.1 1.4
5-15 28.0 1.0 15.1 0.9
16-29 21.9 0.9 14.6 1.1
30-39 21.7 1.0 14.9 1.0
40-49 21.0 1.0 14.8 1.0
50-59 21.8 1.0 14.6 1.1
>60 24.5 1.6 17.6 1.6
Education
<6 and/or Illiterate 29.1 1.3 18.4 1.5
Less than HS 23.9 1.0 15.3 1.1
High School 20.7 0.9 12.8 0.8
University Degree 17.5 0.7 10.8 0.8
Wealth Index
Lowest 27.5 1.2 19.1 1.7
Lower Middle 26.6 1.2 17.4 1.5
Middle 24.9 1.1 16.3 1.1
Upper Middle 25.6 1.1 14.0 1.1
Highest 21.6 0.9 13.2 0.8
Income Quintiles
Lowest 29.3 1.4 18.4 1.5
Second 26.3 1.2 16.1 1.2
Third 25.4 1.1 15.6 1.2
Fourth 24.6 1.0 15.3 1.2
Highest 21.0 0.9 13.2 1.1
Figures 3.1 and 3.2 show the frequency of reported days off for chronic and acute illnesses. The majority report no days off. For acute illness, the highest number of days off is 28 days, reported by 72 people. The highest number of days off for chronic illness is 28 days, reported by 142 people.

34
FIGURE 3.1: FREQUENCY OF REPORTED DAYS OFF FOR ACUTE ILLNESS
FIGURE 3.2: FREQUENCY OF REPORTED DAYS OFF FOR CHRONIC ILLNESS
0
2,000
4,000
6,000
8,000
10,000
12,000
14,000
16,000
18,000
20,000
0 1 2 3 4 5 6 7 8 9 10 11 12 13 14 15 17 20 21 22 23 25 27 28
Fre
qu
en
cy
Days Off
0
2,000
4,000
6,000
8,000
10,000
12,000
14,000
16,000
18,000
20,000
0 1 2 3 4 5 6 7 8 9 10 11 12 13 14 15 17 20 21 22 23 25 27 28
Fre
qu
en
cy
Days Off

4. HEALTH CARE EXPENDITURES


37
The tables in this chapter summarize the results from the HHEUS 2009/2010 related to patterns of health care expenditures in Egypt. Average annual per capita spending for all visits is estimated at LE 646 per person. However, annual spending varies greatly between different cohorts of people. For instance, females spend about 28 percent more per year on health care than do males, urban households typically spend more than do rural households, and those with health insurance consistently spend less on health care than do those without insurance. Also, health care expenditures steadily increase with age starting at age 5. We also find that wealthy, rich, and educated households have higher health care expenditures than other cohorts of people, but that the rich spend a lower proportion of their income on health: households in the lowest income quintile spend 21.0 percent of their income on health while those in the highest income quintile spend about 13.5 percent of their income on health. This chapter also reports on spending by type of facility visited. Private clinics incur the most costs among outpatient visits, and private hospitals incur the most costs among inpatient visits. Lastly, this chapter reports on the components of health visit spending, the results of which can be found below.
4.1 ANNUAL PER CAPITA HEALTH SPENDING
Table 4.1 details the annual per capita spending by service types. Types of services are categorized as outpatient (acute, chronic, dental, and prevention services) or inpatient. Average annual per capita spending for all visits (a sum of inpatient and outpatient spending) is estimated at LE 646 per person, which is about 15 percent of per capita income (LE 4,338). This average spending varies greatly between different cohorts of people, as discussed below. Based on the results by type of service, annual per capita spending is highest for acute services (LE 305), followed by chronic (LE 232), inpatient (LE 79), dental (LE 21) and preventive (LE 9) services. Note that routine dental check-ups are included in the preventive services category; the dental service category refers to dental problems (see Table 3.3 for a list). Further delineations of health care expenditures by household categorizations are presented below.
TABLE 4.1: ANNUAL PER CAPITA (LE) HEALTH SPENDING (ADJUSTED)
Spending on Type of Service (LE)
Acute (Outpatient)
Chronic (Outpatient)
Dental (Outpatient)
Preventive (Outpatient)
Total Outpatient
Total Inpatient
Total
Total
Spending 305 232 21 9 567 79 646
*Calculations include missing data

38
4.1.1 EXPENDITURES BY SEX
Across all expenditure types, females spend more on health care than males (Table 4.2). Females spend an estimated 23 percent more on total outpatient services than males (LE 626 spent by females versus LE 509 spent by males), and 28 percent more on all types of services than males (LE 725 spent by females versus LE 567 spent by males). These spending differences could be due to costlier services for females, or to more visits made by females (which thus makes females incur more costs). See Chapter 3 for a discussion of male versus female illness rates and possible reasons for females‟ higher illness rates; those reasons may also explain females‟ higher health spending costs.
TABLE 4.2: ANNUAL PER CAPITA HEALTH SPENDING (LE) (ADJUSTED) BY TYPE OF
SERVICE AND SEX
Sex
Spending on Type of Service (LE)
Acute
(Outpatient)
Chronic
(Outpatient)
Dental
(Outpatient)
Preventive
(Outpatient)
Total
Outpatient
Total
Inpatient Total
Male 290 198 18 3 509 58 567
Female 321 266 23 16 626 99 725
*Calculations include missing data
4.1.2 EXPENDITURES BY RESIDENCE
Table 4.3 presents expenditure differences by urban/rural residence and region. Urban households typically spend more on health care than their rural counterparts. Spending on all visits for urban households is LE 770 compared to LE 561 for rural households, a 37 percent difference in spending. Table 4.3 also displays estimated spending differences by region, which align with the rural/urban differences. On average, those in major cities spend more than those in the other four regions. Additionally, within Lower Egypt and within Upper Egypt, the urban population spends more on all visits than do their rural counterparts (e.g., urban Lower Egypt residents spend LE 720 and rural Lower Egypt residents spend LE 620). These differences in expenditures between urban and rural households could be due to issues of access for rural households, as well as issues of ability to pay for, and desire to seek, care among rural households.
TABLE 4.3: ANNUAL PER CAPITA HEALTH SPENDING (LE) (ADJUSTED) BY TYPE OF
SERVICE AND RESIDENCE
Residence
Spending on Type of Service (LE)
Acute (Outpatient)
Chronic (Outpatient)
Dental (Outpatient)
Preventive (Outpatient)
Total Outpatient
Total Inpatient
Total
Urban/Rural
Urban 301 326 32 11 670 99 770
Rural 308 168 13 8 497 65 561
Region
Major Cities 327 453 41 13 834 124 958
Urban Lower Egypt
306 289 30 10 635 85 720
Rural Lower Egypt
331 194 15 8 548 72 620
Urban Upper Egypt
255 184 21 10 470 78 548
Rural Upper Egypt
276 132 9 8 425 55 480
*Calculations include missing data
39
4.1.3 EXPENDITURES BY INSURANCE STATUS
Results from the HHEUS also demonstrate expenditure differences between the insured and the uninsured in Egypt. As shown in Table 4.4, those with health insurance consistently spend less on health care than do those without insurance. This is true across all types of care.
TABLE 4.4: ANNUAL PER CAPITA HEALTH SPENDING (LE) (ADJUSTED) BY TYPE OF
SERVICE AND INSURANCE STATUS
Insured
Spending on Type of Service (LE)
Acute
(Outpatient)
Chronic
(Outpatient)
Dental
(Outpatient)
Preventive
(Outpatient)
Total
Outpatient
Total
Inpatient Total
Yes 300 166 19 4 489 47 536
No 310 301 22 15 648 111 759
*Calculations include missing data
4.1.4 EXPENDITURES BY AGE
The HHEUS results also provide data on health care expenditures by age (see Table 4.5 and Figure 4.1). For both inpatient and outpatient care, it is estimated that the highest expenditures are for Egyptians over the age of 60, and among that group, the highest level of spending is on chronic illness care (LE 921). Starting at age 5, health expenditures steadily increase with age, with expenditures on all visits increasing by an estimated average of 40 percent with each increasing age group. The under 5 age group is the exception to this steady increase; this group has higher expenditures on all visits than those in the 5-15 age group and those in the 16-29 age group. This is likely due to increased need for health care among infants and toddlers; after reaching age 5, the cost health care visits decreases by about half because fewer services are needed.
TABLE 4.5: ANNUAL PER CAPITA HEALTH SPENDING (LE) (ADJUSTED) BY TYPE OF
SERVICE AND AGE
Age
Spending on Type of Service (LE)
Acute
(Outpatient)
Chronic
(Outpatient)
Dental
(Outpatient)
Preventive
(Outpatient)
Total
Outpatient
Total
Inpatient Total
<5 415 57 1 3 476 20 495
5-15 220 42 9 1 272 18 290
16-29
237 87 19 17 360 71 431
30-39
278 202 30 20 530 125 655
40-49
350 395 34 7 786 89 876
50-59
437 684 43 7 1171 133 1303
>60 490 921 32 7 1450 232 1682
*Calculations include missing data

40
FIGURE 4.1: ANNUAL PER CAPITA EXPENDITURES (LE) BY AGE
476
20
495
272
18
290 360
71
431 530
125
655
786
89
876
1171
133
1303
1450
232
1682
0
200
400
600
800
1000
1200
1400
1600
1800
Total Outpatient Total Inpatient All Visits
LE
<5 5-15 16-29 30-39 40-49 50-59 >60

41
4.1.5 EXPENDITURES BY EDUCATION LEVEL AND INCOME/WEALTH
Table 4.6 and Figures 4.2 through 4.4 display health expenditures by education level, wealth, and income. Those with university degrees consistently spend the most on health care across all types of care compared to households classified in the other three education categories. Additionally, those in the highest wealth index spend more on care than those in the lower four indices – those in the highest index spend about twice as much on both inpatient and outpatient care as those in the lowest index. And, those in the highest income quintile spend more than those in the four lower quintiles – the highest income quintile spends about four-and-a-half times as much on all visits than those in the lowest quintile. These three findings demonstrate that wealthy, rich, and educated households have higher health care expenditures than other cohorts of people. This is likely due to higher access to care and higher ability to pay for care, which escalates care-seeking behavior.
TABLE 4.6: ANNUAL PER CAPITA HEALTH SPENDING (LE) (ADJUSTED) BY TYPE OF
SERVICE AND EDUCATION LEVEL, WEALTH, AND INCOME
Background
Characteristic
Spending on Type of Service (LE)
Acute (Outpatient)
Chronic (Outpatient)
Dental (Outpatient)
Preventive (Outpatient)
Total Outpatient
Total Inpatient
Total
Education Level
<6 and/or Illiterate
345 220 10 6 581 62 643
Less than HS
252 177 15 5 449 55 504
High School 287 226 29 18 560 93 653
University Degree
324 465 69 21 879 197 107
5
Wealth Index
Lowest 281 155 7 5 448 49 496
Lower Middle
266 167 10 7 450 54 504
Middle 299 190 13 9 511 53 564
Upper Middle
322 251 20 11 604 102 706
Highest 368 429 58 15 870 148 101
8
Income Quintiles
Lowest 190 80 6 5 281 20 301
Second 232 112 8 6 358 30 389
Third 288 157 11 7 175 40 503
Fourth 351 217 19 10 597 91 689
Highest 465 594 58 18 1135 213 134
8
*Calculations include missing data

42
FIGURE 4.2: ANNUAL PER CAPITA EXPE NDITURES (LE) BY EDUCATION LEVEL
FIGURE 4.3: ANNUAL PER CAPITA EXPENDITURES (LE) BY WEALTH INDEX
FIGURE 4.4: ANNUAL PER CAPITA EXPENDITURES (LE) BY INCOME QUINTILES
581
62
643
449
55
504 560
93
653
879
197
1075
0
200
400
600
800
1000
1200
Total Outpatient Total Inpatient All Visits
LE
<6 and/or Illiterate Less than HS High School University Degree
448
49
496 450
54
504 511
53
564 604
102
706
870
148
1018
0
200
400
600
800
1000
1200
Total Outpatient Total Inpatient All Visits
LE
Lowest Lower Middle Middle Upper Middle Highest
281
20
301 358
30
389
175 40
503 597
91
689
1135
213
1348
0
200
400
600
800
1000
1200
1400
1600
Total Outpatient Total Inpatient All Visits
LE
Lowest Second Third Fourth Highest
43
Table 4.6 and Figures 4.3 and 4.4 show that the rich spend more on health care than do the poor. However, as shown in Figure 4.5 below, the poor spend a higher proportion of their household income on health care. While those in the highest income quintile spend about 13.5 percent of their income on health, those in the lowest income quintile spend about 21 percent of their household income on health. These findings demonstrate that health care costs place a heavier burden on the poor than they do on the rich.
FIGURE 4.5: PERCENT OF HOUSEHOLD INCOME GOING TO HEALTH, BY INCOME
QUINTILE
21.0 19.8 19.2
17.1
13.5
0
5
10
15
20
25
30
Lowest Second Third Fourth Highest
Pe
rce
nt
of
Ho
use
ho
ld In
com
e
Income Quintile

44
4.2 EXPENDITURES BY TYPE OF FACILITY
The HHEUS 2009/2010 itemizes health care expenditures not only by type of service, but also by the type of facility that administered that service (Table 4.7). The highest total outpatient annual per capita spending was in private clinics. In fact, the population spent an estimated average of almost six times more LE annually on private clinic visits for outpatient services than the second highest annual per capita facility spending (pharmacies). For inpatient care, the highest spending was in private hospitals.
TABLE 4.7: ANNUAL PER CAPITA SPENDING (LE) (ADJUSTED) BY TYPE OF FACILITY
AND TYPE OF SERVICE
Type of
Facility
Spending on Type of Service (LE)
Acute
(Outpatient)
Chronic
(Outpatient)
Dental
(Outpatient)
Preventive
(Outpatient)
Total
Outpatient
Total
Inpatient Total
CCO 0.5 0.7 0.1 0.0 1.3 0.6 1.8
Charitable Hospital
0.0 0.0 0.0 0.0 0.0 0.8 0.8
Family Planning and MCH
0.1 0.0 0.0 0.1 0.2 0.0 0.2
HIO Hospitals & Outpatient Clinics
2.2 4.1 0.1 0.0 6.5 1.3 7.8
MOHP Facilities
6.0 1.3 0.2 0.4 7.9 0.0 7.9
MOHP Hospitals
13.2 11.7 0.8 0.5 26.1 11.1 37.6
Mosque/Church 5.8 2.7 1.3 0.2 10.1 0.3 10.5
One-day Surgery Facilities
0.4 0.1 0.0 0.0 0.5 0.4 0.8
Other 3.6 4.6 0.2 0.5 8.8 4.1 12.9
Other Gov‟t Hospitals
1.2 2.3 0.1 0.0 3.7 1.9 5.7
Pharmacies 32.9 35.3 0.2 0.1 68.5 0.0 68.5
Polyclinic 1.1 0.5 0.1 0.0 1.8 0.0 1.8
Private Clinics 221.4 150.2 16.5 6.3 394.4 0.0 394.7
Private Hospitals
10.9 13.0 0.4 0.5 24.8 51.8 76.6
Specialized Medical Centers
3.3 2.9 0.3 0.4 6.9 0.0 6.9
Teaching Hospitals
0.6 0.6 0.1 0.0 1.3 5.2 6.5
University Hospitals
1.5 2.0 0.1 0.1 3.7 1.2 4.9
Total 305 232 21 9 567 79 646
*Calculations include missing data

45
4.3 COMPONENTS OF HEALTH CARE SPENDING BY TYPE
OF SERVICE
This section reports on the components of health visit spending and which components comprise the largest percentage of patient costs. Percentages are presented both in total and by background characteristics. Although slight variations within each background characteristic group do exist (as seen in the tables below), the general pattern of spending (i.e., the percentage of spending that each component comprises) remains the same no matter the background characteristic breakdown.
4.3.1 OUTPATIENT SERVICES
Tables 4.8 through 4.11 below report the components of spending across the four outpatient service areas: acute care, chronic care, dental care, and preventive services.
Table 4.8 reports the breakdown of costs for health care visits to treat acute illnesses by background characteristics and in total. More than half (59 percent on average) of all spending on acute care visits is on medicines, both in total and across all background characteristic categories. Doctor visits are the next largest component of spending, averaging about 22 percent of the total cost. X-rays, labs, transportation, and other costs are not large components of the overall cost of acute illness care.

46
TABLE 4.8: PERCENT SPENDING (ADJUSTED) ON DIFFERENT COMPONENTS OF CARE:
ACUTE CARE
Background
Characteristic
Percent of Spending on Acute Care Component
Medicines Doctor
Visits X-rays Labs Transport Other
Gender
Male 57 22 7 3 5 6
Female 55 21 5 5 5 9
Urban/Rural
Urban 56 22 7 4 3 8
Rural 56 21 6 4 6 7
Insured
Yes 67 26 4 3 5 7
No 63 23 7 5 5 8
Region
Major Cities 56 22 5 4 3 10
Urban Lower Egypt
61 21 6 4 3 5
Urban Upper Egypt
56 23 6 4 4 7
Rural Lower Egypt
60 21 4 4 4 6
Rural Upper Egypt
57 23 5 3 7 6
Age
<5 65 27 1 1 4 1
5-15 61 22 2 3 5 7
16-29 57 22 5 4 4 8
30-39 57 19 5 6 4 10
40-49 55 20 7 4 4 9
50-59 56 21 7 4 5 8
>60 55 20 10 4 5 6
Education
<6 and/or Illiterate
60 23 4 3 5 5
Less than HS 58 21 5 4 4 8
High School 55 20 7 5 4 9
University Degree
54 22 5 5 3 11
Wealth Index
Lowest 58 22 6 3 6 5
Lower Middle 59 23 4 4 5 5
Middle 59 21 6 4 5 5
Upper Middle 58 21 5 4 4 8
Highest 57 23 4 4 3 10
Income Quintiles
Lowest 61 23 5 2 5 4
Second 61 22 4 4 5 5
Third 60 22 5 3 5 6
Fourth 58 22 5 3 4 6
Highest 55 21 6 5 3 10
Total 59 22 5 4 4 7 *These numbers are not imputed and are based on reported spending. Calculations include missing data.

47
Table 4.9 reports the breakdown of costs for health care visits to treat chronic illnesses by background characteristics and in total. Across all background characteristic breakdowns and in total, the largest percentage of spending for chronic visits is on medicines (57 percent on average). Doctor visits tend to make up about one-fifth of the cost of care, with x-rays, labs, transportation, and other components comprising the rest of the cost of the chronic care visit.

48
TABLE 4.9: PERCENT SPENDING (ADJUSTED) ON DIFFERENT COMPONENTS OF CARE:
CHRONIC CARE
Household or
Household
Member
Categorization
Percent of Spending on Chronic Care Component
Medicines Doctor
Visits X-rays Labs Transport Other
Gender
Male 55 19 8 7 5 5
Female 58 17 9 7 6 3
Urban/Rural
Urban 58 17 9 8 4 4
Rural 55 19 8 7 8 4
Insured
Yes 57 20 7 8 6 2
No 57 17 9 7 5 5
Region
Major Cities 56 16 9 8 3 7
Urban Lower Egypt
62 18 8 7 4 1
Urban Upper Egypt
57 18 10 8 5 2
Rural Lower Egypt
56 22 6 7 7 2
Rural Upper Egypt
54 14 10 6 9 7
Age
<5 49 22 13 4 8 3
5-15 53 20 8 9 8 3
16-29 53 18 9 8 5 7
30-39 47 17 13 7 5 11
40-49 60 16 10 8 5 1
50-59 57 18 7 8 5 5
>60 61 19 6 6 6 2
Education
<6 and/or Illiterate
58 17 8 6 7 3
Less than HS 54 21 10 7 5 2
High School 58 16 9 9 5 5
University Degree
58 17 7 7 3 8
Wealth Index
Lowest 55 17 7 6 7 7
Lower Middle 57 16 10 7 8 1
Middle 60 17 8 7 7 1
Upper Middle 55 21 9 7 5 3
Highest 57 17 8 8 3 7
Income Quintiles
Lowest 56 18 12 6 7 1
Second 53 22 7 6 6 7
Third 57 19 8 8 7 2
Fourth 55 15 11 8 5 7
Highest 61 18 6 7 4 4
Total 57 18 8 7 5 4 *These numbers are not imputed and are based on reported spending. Calculations include missing data.
Table 4.10 reports the percentage of total spending by the different components of dental health care, excluding routine dental check-ups (which are part of the preventive services).

49
The largest percentage of spending for dental visits is on other services (50 percent on average), followed by the doctor visit (26 percent) and medicines (20 percent). The other services include spending on traditional medicines, minor operations, orthodontics, and other spending.

50
TABLE 4.10:PERCENT SPENDING (ADJUSTED) ON DIFFERENT COMPONENTS OF CARE:
DENTAL CARE
Background
Characteristic
Percent of Spending on Dental Care Component
Medicines Doctor
Visits X-rays Labs Transport Other
Gender
Male 21 27 1 1 4 48
Female 19 26 1 1 4 51
Urban/Rural
Urban 15 23 1 1 2 59
Rural 29 32 1 1 7 32
Insured
Yes 18 22 1 1 3 56
No 21 30 1 1 4 43
Region
Major Cities 9 18 1 1 1 71
Urban Lower Egypt
21 30 1 1 2 45
Urban Upper Egypt
19 24 1 1 3 52
Rural Lower Egypt
29 33 1 1 5 31
Rural Upper Egypt
26 31 1 1 9 33
Age
<5 46 32 0 1 6 15
5-15 22 25 1 1 5 46
16-29 18 21 1 1 3 56
30-39 20 26 1 1 4 49
40-49 23 31 1 1 4 41
50-59 17 30 1 1 3 49
>60 18 25 1 1 4 53
Education
<6 and/or Illiterate
29 31 1 1 7 32
Less than HS 20 29 1 0 4 44
High School 19 26 1 1 4 50
University Degree
14 21 1 0 2 63
Wealth Index
Lowest 35 35 1 1 9 21
Lower Middle 30 30 1 1 7 33
Middle 28 31 1 1 5 34
Upper Middle 21 30 1 1 4 44
Highest 13 22 1 1 2 63
Income Quintiles
Lowest 31 32 1 1 7 29
Second 31 34 1 1 6 28
Third 27 29 1 0 5 38
Fourth 23 27 1 1 4 45
Highest 12 22 1 0 2 62
Total 20 26 1 1 4 50 *These numbers are not imputed and are based on reported spending. Calculations include missing data.
51
Table 4.11 reports the percent of total spending by the different components of preventive services, which include vaccinations; growth monitoring; antenatal care; pregnancy follow up; family planning; routine check-up for dental care; Pap smear; mammography; pre-marriage consultation; pre-employment/travel check-up; and other. The largest percentage of spending for preventive services is on medicines (38 percent on average) and the doctor visit (21 percent on average).

52
TABLE 4.11:PERCENT SPENDING (ADJUSTED) ON DIFFERENT COMPONENTS OF CARE:
PREVENTIVE CARE
Background
Characteristic
Percent of Spending on Preventive Care Component
Medicines Doctor
Visits X-rays Labs Transport Other
Gender
Male 24 11 16 30 8 10
Female 40 23 10 8 7 12
Urban/Rural
Urban 36 19 15 15 5 12
Rural 39 24 7 9 9 12
Insured
Yes 28 17 18 16 9 13
No 40 22 9 11 6 11
Region
Major Cities 29 17 22 16 4 13
Urban Lower Egypt
42 22 11 14 5 5
Urban Upper Egypt
40 18 7 13 6 16
Rural Lower Egypt
38 23 9 12 8 10
Rural Upper Egypt
42 24 5 5 10 15
Age
<5 19 9 6 3 22 41
5-15 21 9 18 35 10 7
16-29 41 26 7 9 6 11
30-39 42 21 9 9 6 14
40-49 38 20 15 13 5 9
50-59 21 9 30 31 7 2
>60 19 10 33 25 8 5
Education
<6 and/or Illiterate
38 20 11 9 10 12
Less than HS 34 19 12 15 7 14
High School 43 21 9 9 6 12
University Degree
32 25 14 17 4 9
Wealth Index
Lowest 49 23 8 6 10 3
Lower Middle 43 23 7 8 9 9
Middle 39 22 10 9 8 12
Upper Middle 34 20 10 13 6 17
Highest 32 20 16 17 5 11
Income Quintiles
Lowest 41 24 9 5 9 12
Second 42 23 7 6 8 13
Third 45 26 8 8 8 5
Fourth 39 24 8 9 7 13
Highest 33 18 14 17 5 12
Total 38 21 11 12 7 12 *These numbers are not imputed and are based on reported spending. Calculations include missing data.

53
4.3.2 INPATIENT SERVICES
Table 4.12 reports the percentage of total spending by the different components of the inpatient visit. On average, other services make up over 60 percent of the cost of the visit. These other services include spending on traditional medicines, fees for admission and accommodation, and other spending. Medicines and doctor visits are the next two largest components of care in terms of spending, averaging at 16 percent and 10 percent, respectively.
TABLE 4.12:PERCENT SPENDING (ADJUSTED) ON DIFFERENT COMPONENTS OF CARE:
INPATIENT SERVICES
Background
Characteristic
Percent of Spending on Inpatient Care Component
Medicines Doctor
Visits X-rays Labs Surgery Transport Other
Gender
Male 16 9 6 3 1 3 62
Female 16 11 3 3 1 2 64
Urban/Rural
Urban 13 8 3 2 1 2 72
Rural 20 13 6 3 1 4 53
Insured
Yes 16 9 4 3 1 3 64
No 16 11 5 2 1 2 63
Region
Major Cities 6 7 2 1 1 1 82
Urban Lower Egypt
24 14 4 4 1 3 51
Urban Upper Egypt
17 3 3 2 1 2 71
Rural Lower Egypt 21 16 7 4 1 4 49
Rural Upper Egypt 19 10 6 3 1 4 58
Age
<5 28 6 3 3 1 4 55
5-15 24 14 5 4 2 6 44
16-29 14 12 2 2 1 3 66
30-39 15 12 3 2 1 2 66
40-49 21 8 6 4 1 3 59
50-59 13 8 6 4 1 2 67
>60 16 9 5 2 1 2 65
Education
<6 and/or Illiterate 20 10 7 3 1 3 56
Less than HS 19 9 4 3 0 3 61
High School 13 14 2 1 1 2 65
University Degree 8 8 2 2 1 1 79
Wealth Index
Lowest 23 9 7 3 1 4 53
Lower Middle 22 11 7 3 1 3 53
Middle 18 16 3 3 2 4 55
Upper Middle 19 10 6 3 0 3 60
Highest 8 8 2 2 1 1 79
Income Quintiles
Lowest 24 8 2 2 1 5 57
Second 22 13 8 3 1 4 50
Third 22 14 4 3 1 4 53
Fourth 16 10 4 3 1 3 63
Highest 12 9 4 2 1 2 71
Total 16 10 4 3 1 3 64
*These numbers are not imputed and are based on reported spending. Calculations include missing data.


5. PATTERNS OF CURATIVE
HEALTH SERVICES
UTILIZATION IN EGYPT


57
The tables in this chapter summarize the results from the Egyptian HHEUS 2009/2010 related to patterns of curative health service utilization in Egypt. This includes an analysis of the annual per capita utilization rate for outpatient and inpatient visits, where it is found that an average of 9.51 outpatient visits are made per person per year, and an average of 0.07 inpatient visits are made per person per year.
This chapter also includes analyses of why individuals do not seek health care. For both acute and chronic illnesses, the most frequently cited reason is that the individual used medical treatment without consulting a medical professional. In the case of acute illnesses, this is likely because individuals may have relied upon advice received previously or may have visited a pharmacy for treatment; in the case of chronic illnesses, this is likely because the survey only captures visits made in the prior four weeks while chronic illness care is longer-term and the survey simply did not capture the chronic care visits. As detailed below, reasons for not seeking care are also presented by background characteristics. Lastly, this chapter presents a gap analysis showing the percentage of individuals who reported being ill but did not receive care, the results of which are provided below.
5.1 ANNUAL PER CAPITA UTILIZATION RATE FOR
OUTPATIENT AND INPATIENT VISITS
Table 5.1 reports the per capita utilization rate for outpatient visits. The results show that the highest per capita utilization rate is for acute illnesses, with an estimated average of 6.16 visits per person per year. The annual per capita acute visit rate is highest for females (6.32 visits per year), those in rural areas (6.38 visits per year), those without insurance (6.70 visits per year), those living in rural Lower Egypt (6.60 visits per year), those under 5 years old (9.86 visits per year), those under 6 years old and/or illiterate (7.42 visits per year), those in the middle wealth index (6.45 visits per year), and those in the second to highest income quintile (6.92 visits per year). The highest total outpatient visit rate (including acute, chronic, dental and preventive) is for those greater than 60 years old (18.24 total outpatient visits per year) mostly due to chronic care visits. It is interesting that acute visit rates are in general highest for females, rural, and those without insurance as this is contrary to usual trends.

58
TABLE 5.1: ANNUAL PER CAPITA UTILIZATION RATE: OUTPATIENT VISITS
Background
Characteristic
Per Capita Utilization Rate by Type of Outpatient Visit
Acute Chronic Dental Preventive Total
Outpatient
Gender
Male 6.00 2.11 0.29 0.33 8.72
Female 6.32 3.07 0.34 0.57 10.31
Urban/Rural
Urban 5.83 3.42 0.36 0.38 9.99
Rural 6.38 2.02 0.28 0.50 9.19
Insured
Yes 5.59 3.24 0.36 0.28 9.47
No 6.70 1.96 0.27 0.62 9.55
Region
Major Cities 5.80 4.39 0.40 0.31 10.90
Urban Lower Egypt 6.23 3.14 0.38 0.48 10.23
Urban Upper Egypt 5.32 2.31 0.28 0.35 8.27
Rural Lower Egypt 6.60 2.44 0.34 0.54 9.92
Rural Upper Egypt 6.09 1.44 0.21 0.44 8.17
Age
<5 9.86 0.71 0.04 1.47 12.07
5-15 6.00 0.58 0.23 0.56 7.37
16-29 4.71 0.81 0.26 0.33 6.11
30-39 5.30 2.05 0.49 0.36 8.20
40-49 6.09 4.35 0.53 0.14 11.11
50-59 6.64 7.81 0.53 0.06 15.04
>60 7.21 10.55 0.41 0.07 18.24
Education
<6 and/or Illiterate 7.42 2.82 0.25 0.66 11.15
Less than HS 5.45 2.19 0.28 0.33 8.25
High School 5.06 2.18 0.40 0.28 7.91
University Degree 4.80 3.55 0.54 0.23 9.13
Wealth Index
Lowest 6.23 2.06 0.22 0.41 8.92
Lower Middle 6.10 2.06 0.27 0.47 8.90
Middle 6.45 2.60 0.29 0.50 9.83
Upper Middle 6.33 2.85 0.36 0.47 10.02
Highest 5.60 3.52 0.46 0.42 10.00
Income Quintiles
Lowest 4.79 1.21 0.17 0.43 6.61
Second 6.01 1.72 0.24 0.52 8.50
Third 6.39 2.04 0.29 0.50 9.22
Fourth 6.92 2.84 0.37 0.46 10.60
Highest 6.68 5.12 0.50 0.34 12.64
Total 6.16 2.59 0.32 0.45 9.51
59
Table 5.2 reports the annual per capita utilization rate for inpatient visits. For all types of individuals, the number of annual inpatient visits is lower than outpatient visits. There is not a considerable amount of variation in inpatient admissions per capita across different background characteristics. The average number of annual inpatient visits is 0.07 visits per capita, or, 7 out of every 100 individuals had an inpatient admission. Females have a slightly larger annual admission rate per capita mostly likely because of labor and delivery and cesarean sections, which comprise an estimated 22 percent of all inpatient visits in the population. The highest admission rate per capita is for those greater than 60 years old, reporting 0.12 annual admissions per capita.

60
TABLE 5.2:ANNUAL ADMISSIONS PER CAPITA: INPATIENT VISITS
Background Characteristic Inpatient Visit Utilization Rate
Gender
Male 0.06
Female 0.08
Urban/Rural
Urban 0.08
Rural 0.06
Insured
Yes 0.06
No 0.08
Region
Major Cities 0.08
Urban Lower Egypt 0.08
Urban Upper Egypt 0.08
Rural Lower Egypt 0.06
Rural Upper Egypt 0.06
Age
<5 0.05
5-15 0.04
16-29 0.07
30-39 0.08
40-49 0.07
50-59 0.10
>60 0.12
Education
<6 and/or Illiterate 0.07
Less than HS 0.06
High School 0.08
University Degree 0.08
Wealth Index
Lowest 0.06
Lower Middle 0.07
Middle 0.07
Upper Middle 0.08
Highest 0.07
Income Quintiles
Lowest 0.05
Second 0.06
Third 0.06
Fourth 0.08
Highest 0.09
Total 0.07

61
5.2 REASONS FOR NOT USING CARE
5.2.1 OUTPATIENT SERVICES
Tables 5.3 through 5.7 below report the main reasons that individuals did not seek care across the four outpatient service areas: acute care, chronic care, dental care, and preventive services. Recall that each individual could report on up to three illnesses or episodes within each disease type. Thus, the percentages presented in the tables below are per illness reported, not per person.
Table 5.3 presents the reasons that individuals report for not seeking care for acute illnesses and the frequency of the reasons for not seeking care by background characteristics. For acute illnesses, the most frequent reason that individuals report for not seeking care is because they use medical treatment without consulting a medical professional (this occurs for an estimated 55.9 percent of all acute illnesses in the population). Although the survey did not capture how the individual had access to or knowledge of the treatment in these cases, it could be that individuals may have relied upon advice received previously, or may have visited a pharmacy for treatment. The next most frequent reason for not seeking care is because traditional treatment was used without consulting a medical professional (16.3 percent of acute illnesses), followed by reporting that the problem was simple (11.6 percent). There is little difference among the different background characteristics listed in Table 5.3 regarding the reasons for not seeking care.

62
TABLE 5.3:REASONS FOR NOT SEEKING CARE: ACUTE ILLNESS
Backgro
un
d
Ch
ara
cte
rist
ic
Percent of Acute Illnesses
Pro
ble
m is
Sim
ple
To
o C
ost
ly
To
o F
ar
Lo
w Q
uality
Ph
ysi
cal
Co
nst
rain
t
Lo
ng W
ait
at
Pre
vio
us
Vis
it
Fam
ily
Resp
on
sib
ilit
ies
Tra
dit
ion
al T
x
wit
ho
ut
Co
nsu
lt
Med
ical T
x
wit
ho
ut
Co
nsu
lt
Oth
er
Gender
Male 12.4 7.5 0.3 0.2 0.3 0.0 1.4 15.0 57.7 5.3
Female 10.8 7.9 0.2 0.1 0.6 0.0 1.9 17.4 54.5 6.6
Urban/Rural
Urban 9.9 5.1 0.0 0.2 0.4 0.0 1.9 18.0 60.2 4.4
Rural 13.1 10.2 0.5 0.1 0.4 0.1 1.4 14.7 52.0 7.5
Insured
Yes 11.2 4.7 0.2 0.1 0.3 0.0 0.6 14.6 62.4 5.9
No 11.9 10.5 0.3 0.1 0.6 0.0 2.7 17.8 50.0 6.1
Region
Major Cities 8.7 3.0 0.0 0.1 0.4 0.0 1.6 26.1 57.7 2.4
Urban Lower Egypt
11.9 4.0 0.0 0.2 0.3 0.0 1.4 12.6 63.0 6.6
Urban Upper Egypt
8.6 9.2 0.0 0.1 0.7 0.0 3.1 15.2 59.3 3.9
Rural Lower Egypt
14.0 8.3 0.1 0.0 0.3 0.0 1.2 14.4 54.3 7.3
Rural Upper Egypt
10.3 16.7 1.9 0.4 0.8 0.3 2.2 15.5 44.1 7.9
Age
<5 8.1 3.6 0.0 0.0 0.4 0.0 0.4 9.7 70.3 7.7
5-15 10.8 6.2 0.3 0.1 0.1 0.1 0.4 13.6 62.7 5.7
16-29 14.7 6.5 0.4 0.1 0.1 0.0 1.4 18.6 53.7 4.6
30-39 10.8 9.0 0.1 0.2 0.5 0.0 3.3 19.5 52.0 4.5
40-49 10.3 9.3 0.3 0.1 0.0 0.1 3.3 18.4 51.5 6.7
50-59 12.8 13.0 0.2 0.2 0.6 0.0 2.5 15.2 48.5 7.1
>60 9.6 9.0 0.1 0.3 2.5 0.0 1.5 16.4 51.9 8.6
Education
<6 and/or Illiterate
9.9 11.3 0.3 0.0 0.9 0.0 1.9 15.1 53.7 6.8
Less than HS 12.5 6.9 0.4 0.3 0.2 0.1 0.8 17.4 55.5 6.0
High School 13.0 4.8 0.1 0.1 0.1 0.0 2.6 18.3 56.4 4.7
University Degree
13.0 1.6 0.0 0.1 0.0 0.0 1.5 14.2 64.5 5.0
Wealth Index
Lowest 13.9 15.5 1.0 0.3 0.9 0.1 1.6 14.4 45.0 7.3
Lower Middle 11.0 12.4 0.2 0.4 0.4 0.0 2.0 15.0 52.4 6.1
Middle 12.5 7.0 0.2 0.0 0.2 0.1 1.9 18.0 54.0 6.1
Upper Middle 10.7 4.8 0.0 0.0 0.5 0.0 1.6 17.6 58.6 6.2
Highest 10.3 0.7 0.0 0.1 0.3 0.0 1.2 15.8 67.0 4.7
Income Quintiles
Lowest 11.6 14.2 0.7 0.2 0.6 0.0 1.4 12.6 53.5 5.1
Second 11.1 10.0 0.3 0.2 0.6 0.1 1.1 16.5 54.1 6.1
Third 12.2 7.2 0.2 0.0 0.3 0.1 2.2 17.1 54.3 6.2
Fourth 12.6 3.9 0.1 0.3 0.6 0.0 2.3 17.4 56.7 6.1
Highest 10.5 3.6 0.0 0.0 0.1 0.0 1.3 17.8 60.3 6.5
Total 11.6 7.7 0.3 0.1 0.4 0.0 1.7 16.3 55.9 6.0

63
Table 5.4 reports the frequency of the different reasons for why individuals do not seek care for chronic illnesses. As with acute illnesses, the most frequent reason that individuals do not seek care for chronic illness is because they use medical treatment without consulting a medical professional (this occurs for an estimated 46.4 percent of all chronic illnesses in the population). However, the details of this answer are probably different than with acute illnesses. Again, although the survey did not capture the reasoning behind this, it is important to recall that the survey only captures visits made within the prior four weeks; in the case of chronic illnesses, it is not surprising that individuals would not have made a visit in the prior four weeks, nor is it surprising that they cited their reason for not seeking care as using treatment without consulting a professional. These individuals likely already have knowledge of their treatment/care routine. The second most frequent reason for not seeking care is “other reasons” (31.8 percent of chronic illnesses), which is followed by too costly (11.2 percent). This indicates a serious unmet need in the case of treatment of chronic illnesses in Egypt. Not surprisingly, higher percentages of rural, younger, undereducated, and less wealthy, and lower-income people report this as their reason for not seeking care. In general, the results by background characteristics follow similar frequency patterns as the overall/total patterns.

64
TABLE 5.4: REASONS FOR NOT SEEKING CARE: CHRONIC ILLNESS
Background
Characteristic
Percent of Chronic Illnesses
Pro
ble
m is
Sim
ple
To
o C
ost
ly
To
o F
ar
Lo
w Q
uality
Ph
ysi
cal
Co
nst
rain
t
Lo
ng W
ait
at
Pre
vio
us
Vis
it
Fam
ily
Resp
on
sib
ilit
ies
Tra
dit
ion
al T
x
wit
ho
ut
Co
nsu
lt
Med
ical T
x
wit
ho
ut
Co
nsu
lt
Oth
er
Gender
Male 3.9 11.5 0.4 0.1 0.6 0.1 2.5 2.5 45.8 32.6
Female 3.9 11.0 0.2 0.2 1.3 0.1 2.8 2.5 46.8 31.2
Urban/Rural
Urban 4.1 8.2 0.3 0.2 1.3 0.1 2.8 2.3 55.2 25.7
Rural 3.7 15.0 0.3 0.1 0.6 0.1 2.5 2.7 35.3 39.5
Insured
Yes 4.6 7.6 0.3 0.2 0.7 0.2 1.2 2.3 52.0 30.7
No 3.5 13.2 0.3 0.1 1.2 0.0 3.5 2.6 43.2 32.4
Region
Major Cities 5.3 7.1 0.3 0.2 1.9 0.1 2.6 2.9 70.0 9.6
Urban Lower Egypt
3.6 9.1 0.2 0.2 0.8 0.2 2.1 1.8 40.1 41.9
Urban Upper Egypt
1.1 9.5 0.4 0.0 0.4 0.0 5.1 1.1 41.2 41.2
Rural Lower Egypt
4.0 15.8 0.3 0.2 0.6 0.1 2.9 2.4 38.4 35.3
Rural Upper Egypt
1.7 10.5 0.4 0.0 0.9 0.0 0.4 4.8 18.3 62.9
Age
<5 3.4 19.0 0.0 0.0 0.0 0.0 3.4 0.0 25.9 48.3
5-15 10.5
23.3 0.5 0.0 1.4 0.0 1.8 1.8 28.3 32.4
16-29 9.4 23.3 0.3 0.3 0.3 0.0 4.5 2.6 31.1 28.2
30-39 6.1 17.1 0.0 0.0 0.6 0.0 6.1 5.8 33.3 31.0
40-49 3.6 13.0 0.3 0.2 0.2 0.0 3.4 3.4 45.2 33.4
50-59 2.0 8.6 0.1 0.0 0.5 0.3 2.1 2.9 52.0 31.5
>60 1.9 5.4 0.5 0.3 2.0 0.1 1.2 0.8 56.4 31.4
Education
<6 and/or Illiterate
2.7 14.0 0.3 0.2 1.9 0.1 2.6 1.7 41.6 35.0
Less than HS 4.5 12.8 0.2 0.0 0.5 0.0 2.2 3.1 46.8 29.9
High School 5.7 7.1 0.6 0.2 0.2 0.0 4.6 3.4 48.8 29.4
University Degree
4.5 3.2 0.2 0.2 0.0 0.5 1.8 2.7 59.3 27.5
Wealth Index
Lowest 3.2 18.1 0.4 0.0 1.4 0.0 1.2 3.2 29.4 43.1
Lower Middle 3.7 18.8 0.3 0.2 0.8 0.0 3.1 3.1 36.0 34.2
Middle 5.3 11.8 0.2 0.2 1.8 0.2 3.4 2.4 45.0 29.8
Upper Middle 3.5 7.9 0.6 0.4 0.6 0.1 3.9 2.0 55.0 25.9
Highest 3.8 3.9 0.1 0.0 0.7 0.1 1.8 2.0 57.9 29.6
Income Quintiles
Lowest 2.5 21.3 0.4 0.1 1.5 0.0 2.2 1.8 36.0 34.1
Second 5.3 14.0 0.5 0.0 1.1 0.0 2.7 3.5 39.1 33.8
Third 3.8 10.4 0.1 0.3 0.8 0.0 3.8 3.2 48.7 28.8
Fourth 4.2 5.9 0.3 0.3 1.1 0.2 3.2 2.6 46.3 36.0
Highest 3.7 4.1 0.2 0.0 0.5 0.3 1.4 0.2 62.2 26.4
Total 3.9 11.2 0.3 0.1 1.0 0.1 2.7 2.5 46.4 31.8

65
Table 5.5 displays the reasons that individuals report for not seeking care for dental illnesses. The most frequent reason that individuals do not seek care is because the dental problem/illness is too simple (this occurs for an estimated 29.9 percent of dental illnesses). The second most frequent reason for not seeking care is because they use medical treatment without a consultation (24.2 percent of dental illnesses) followed by too costly (15.3 percent). The results by background characteristics follow a similar frequency pattern.
TABLE 5.5: REASONS FOR NOT SEEKING CARE: DENTAL ILLNESS
Background
Characteristic
Percent of Dental Illnesses
Pro
ble
m is
Sim
ple
To
o C
ost
ly
To
o F
ar
Lo
w Q
uality
Ph
ysi
cal
Co
nst
rain
t
Lo
ng W
ait
at
Pre
vio
us
Vis
it
Fam
ily
Resp
on
sib
ilit
ies
Tra
dit
ion
al T
x
wit
ho
ut
Co
nsu
lts
Med
ical T
x
wit
ho
ut
Co
nsu
lts
Oth
er
Gender
Male 31.7 13.7 0.0 0.0 0.2 0.3 6.4 7.2 25.0 15.3
Female 28.4 16.6 0.6 0.4 1.4 0.0 6.1 7.0 23.5 16.1
Urban/Rural
Urban 25.9 16.0 0.1 0.4 1.1 0.2 10.3 6.2 29.2 10.5
Rural 32.8 14.8 0.4 0.1 0.7 0.1 3.2 7.7 20.6 19.6
Insured
Yes 33.0 12.8 0.4 0.0 0.2 0.1 4.9 5.4 20.2 23.0
No 27.0 17.7 0.2 0.4 1.5 0.2 7.4 8.7 27.9 8.9
Region
Major Cities 25.8 13.5 0.0 0.6 0.6 1.3 12.9 5.8 31.6 7.7
Urban Lower Egypt
24.9 16.5 0.0 0.3 1.8 0.0 6.9 7.2 26.3 16.2
Urban Upper Egypt
27.2 16.6 0.3 0.3 0.6 0.0 12.8 5.4 31.0 5.8
Rural Lower Egypt
34.1 16.9 0.2 0.1 0.9 0.0 3.7 7.6 19.0 17.5
Rural Upper Egypt
27.3 6.0 1.4 0.0 0.0 0.5 1.4 8.3 26.9 28.2
Age
<5 46.4 14.3 0.0 0.0 0.0 0.0 3.6 3.6 17.9 14.3
5-15 32.6 13.1 0.6 0.0 0.0 0.0 2.3 5.1 15.4 30.9
16-29 37.5 15.0 0.5 0.0 0.5 0.2 4.3 8.1 25.4 8.6
30-39 24.7 19.9 0.0 0.4 0.7 0.7 11.2 6.4 30.7 5.2
40-49 23.2 13.5 0.0 0.0 0.8 0.0 10.5 8.9 32.5 10.5
50-59 24.4 17.6 0.0 0.9 0.5 0.0 9.0 8.1 27.6 11.8
>60 22.5 15.5 0.5 0.5 5.3 0.0 6.4 9.1 24.1 16.0
Education
<6 and/or Illiterate
27.3 17.6 0.5 0.1 1.2 0.0 4.5 7.2 21.3 20.1
Less than HS 33.5 14.2 0.0 0.3 0.7 0.0 5.6 6.3 24.1 15.3
High School 32.1 14.8 0.3 0.3 0.9 0.3 7.5 8.2 26.7 8.8
University Degree
25.6 9.1 0.6 0.0 0.0 1.1 13.6 7.4 33.0 9.7
Wealth Index
Lowest 28.1 20.8 0. 0.3 2.0 0.0 2.8 8.1 18.8 18.5
Lower Middle 26.2 18.7 0.7 0.2 0.5 0.2 5.1 8.4 23.1 16.8
Middle 34.5 11.3 0.0 0.0 0.9 0.0 7.7 6.8 23.9 14.8
Upper Middle 29.0 18.5 0.0 0.0 0.3 0.0 8.2 5.9 23.4 14.7
Highest 32.1 5.4 0.3 0.6 1.0 0. 7.0 6.0 33.0 14.0
Income Quintiles
Lowest 24.7 20.9 0.2 0.2 1.3 0.0 4.5 6.8 23.9 17.5
Second 32.6 14.7 0.7 0.0 0.7 0.0 4.4 8.4 24.4 14.2
Third 33.3 13.2 0.0 0.0 0.5 0.3 8.0 5.7 23.0 16.0
Fourth 28.0 14.7 0.3 0.3 0.8 0.0 8.6 8.3 22.7 16.3
Highest 32.3 10.4 0.4 0.7 1.1 0.7 6.3 5.9 27.9 14.1
Total 29.9 15.3 0.3 0.2 0.9 0.2 6.2 7.1 24.2 15.8

66
The information presented below in Tables 5.6 and 5.7 regarding preventive and inpatients visits presents slightly different information than that presented above for acute, chronic, and dental illnesses. In regards to preventive services and inpatient admissions, respondents were surveyed as to the reasons that they did not visit a service provider closer to their home than the one they did visit, if there was a provider closer to home. Individuals who did not seek any preventive services were not questioned as to why that was the case, likewise for those who did not report any inpatient visits. One should be careful not to extrapolate from this information why individuals do not seek preventive care at all or do not have any inpatient visits; this is a different question than the one asked (i.e., why did you not visit a provider that was closer to your home, if there was one).
Table 5.6 presents the reasons that individuals report for not seeking preventive care at a provider closer to home (if there was one), and the frequency of these reasons by background characteristics. “Other” is the most frequently reported reason (given for 54.6 percent of preventive visits where there was a closer provider not visited) followed by preference for a certain gender of provider (18.8 percent) and low quality (18.2 percent). Examining the results for low quality of care, it is worth noting that females, those in rural areas, and the uninsured are more likely to perceive low quality. There is also a clear trend for preference for a different gender of the provider among females, those living in rural Upper Egypt, the illiterate and the lower wealth groups.

67
TABLE 5.6: REASONS FOR NOT SEEKING PREVENTIVE CARE AT ANOTHER PROVIDER
NEARER TO HOME (IF THERE WAS ONE)
Background
Characteristic
Percent of Preventive Visits (where there was a closer provider)
Too
Costly
Low
Quality
Long
waiting
Inappropriate
consult days
Dirty
Place
Different
Gender
of
Provider
Other
Gender
Male 2.4 9.6 1.3 1.1 1.8 16.1 67.6
Female 3.2 23.3 3.2 1.6 1.5 20.4 46.9
Urban/Rural
Urban 4.2 13.9 4.7 3.0 2.1 12.3 59.7
Rural 2.2 20.6 1.3 0.5 1.4 22.4 51.7
Insured
Yes 2.0 9.9 1.5 1.5 1.6 16.3 67.1
No 4.6 34.4 4.3 1.1 1.7 23.8 30.1
Region
Major Cities 9.6 19.6 4.7 9.5 2.7 24.8 29.0
Urban Lower Egypt
2.6 9.4 3.5 0.4 0.2 1.7 82.1
Urban Upper Egypt
2.8 20.8 8.4 3.3 7.3 30.1 27.3
Rural Lower Egypt
2.6 20.4 1.2 0.6 0.8 3.0 71.4
Rural Upper Egypt
1.7 20.8 1.4 0.4 2.1 49.0 24.7
Age
<5 2.7 8.8 2.5 0.6 3.5 21.7 60.2
5-15 1.2 7.9 0.7 1.5 0.7 14.3 73.7
16-29 3.6 32.7 4.1 1.7 1.3 24.0 32.7
30-39 5.7 38.2 5.5 0.8 2.7 17.0 30.3
40-49 7.0 30.1 2.3 3.8 1.1 23.9 31.8
50-59 8.4 21.1 5.3 2.2 0.0 27.8 35.2
>60 7.5 25.1 5.0 0.0 5.0 20.5 36.8
Education
<6 and/or Illiterate
2.7 14.3 1.8 1.0 1.9 22.0 56.4
Less than HS
2.2 14.0 1.0 1.6 0.7 18.2 62.4
High School 4.6 35.5 6.2 1.1 1.7 14.4 36.5
University Degree
4.7 32.2 7.5 4.4 3.9 6.9 40.4
Wealth Index
Lowest 2.2 20.3 1.1 0.6 1.7 33.2 40.9
Lower Middle
2.0 21.2 1.3 1.4 1.4 20.8 51.8
Middle 2.9 17.9 1.9 1.1 1.5 21.0 53.6
Upper Middle
4.1 15.2 1.8 1.9 1.7 14.8 60.5
Highest 3.1 17.0 6.3 1.9 1.8 5.2 64.7
Income Quintiles
Lowest 2.5 14.3 1.1 0.5 1.0 32.2 48.3
Second 2.3 15.2 2.2 1.8 3.3 25.9 49.3
Third 2.7 21.0 1.9 0.2 1.5 15.4 57.3
Fourth 3.4 18.4 3.1 0.9 0.4 11.5 62.4
Highest 3.7 22.4 4.1 3.2 1.8 8.8 56.1
Total 2.9 18.2 2.5 1.4 1.6 18.8 54.6

68
5.2.2 INPATIENT SERVICES
Table 5.7 presents the reasons that individuals report for not going to a hospital closer to home (if there was one), and the frequency of these reasons by background characteristics. For inpatient services, the most frequent reason that individuals did not seek care closer to home was low quality (38.3 percent) followed another reason not provided (27.4 percent) and gender preference for the provider (18.7 percent). The results by background characteristics follow a similar frequency pattern.
TABLE 5.7: REASONS FOR NOT SEEKING INPATIENT CARE AT ANOTHER PROVIDER
NEARER TO HOME (IF THERE WAS ONE)
Background
Characteristic
Percent of Inpatient Visits (where there was a closer provider)
Too Costly Low
Quality
Long
waiting
Inappropriate
consult days
Dirty
Place
Different
Gender of
Provider
Other
Gender
Male 9.1 37.5 2.9 0.8 1.9 18.0 29.8
Female 7.7 38.8 5.3 0.7 2.6 19.2 25.7
Urban/Rural
Urban 13.5 32.5 7.4 1.7 2.8 13.5 28.8
Rural 4.7 42.2 2.1 0.1 2.0 22.2 26.5
Insured
Yes 10.8 34.5 4.0 0.9 1.6 15.5 32.7
No 6.7 40.7 4.4 0.7 2.8 20.7 24.1
Region
Major Cities 20.8 28.5 6.3 4.0 2.4 22.2 15.8
Urban Lower Egypt
12.2 34.7 6.2 1.0 3.7 8.0 34.1
Urban Upper Egypt
7.3 33.8 10.1 0.0 1.8 11.4 35.6
Rural Lower Egypt
8.0 49.6 2.4 0.0 2.7 10.4 27.0
Rural Upper Egypt
1.4 34.5 1.8 0.3 1.4 34.5 26.1
Age
<5 6.9 41.8 3.2 1.0 1.2 18.4 27.5
5-15 10.1 38.7 3.3 0.7 2.5 21.4 23.3
16-29 6.4 40.0 3.8 0.3 3.4 19.2 26.9
30-39 7.2 39.3 4.4 0.5 2.0 15.3 31.4
40-49 7.9 35.5 3.9 2.5 2.0 21.9 26.3
50-59 10.5 30.7 5.6 0.7 1.7 21.6 29.2
>60 11.4 39.7 5.6 0.7 1.7 13.8 27.0
Education
<6 and/or Illiterate
7.7 38.9 3.9 0.8 1.4 20.9 26.4
Less than HS 10.6 34.1 4.5 0.7 2.0 18.7 29.4
High School 6.6 40.8 4.3 0.4 2.9 20.1 24.9
University Degree
8.2 40.7 4.9 1.5 5.5 7.5 31.7
Wealth Index
Lowest 4.9 41.4 1.5 0.0 0.5 26.8 24.8
Lower Middle 6.3 40.7 4.0 0.8 1.5 23.3 23.3
Middle 8.4 34.2 3.1 0.7 2.5 20.0 31.2
Upper Middle 10.9 36.6 4.5 0.4 3.9 12.5 31.2
Highest 10.9 39.9 8.9 2.0 3.0 10.0 25.2
Income Quintile
Lowest 6.6. 35.1 2.5 0.4 1.6 36.0 17.7
Second 7.5 38.4 1.0 0.4 2.5 22.4 27.7
Third 8.4 37.1 6.3 0.4 3.3 12.8 31.7
Fourth 9.1 39.2 5.8 2.0 1.0 12.9 30.1
Highest 9.8 41.6 5.3 0.4 3.2 10.6 29.1
Total 8.3 38.3 4.2 0.8 2.3 18.7 27.4
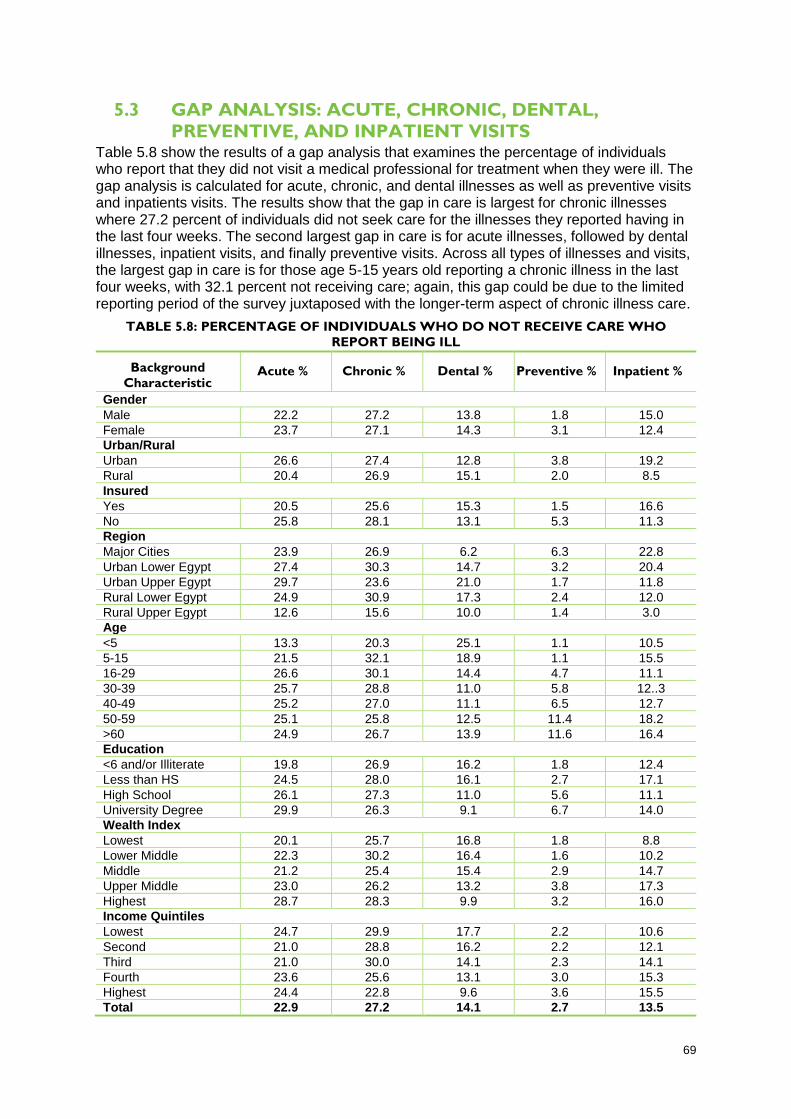
69
5.3 GAP ANALYSIS: ACUTE, CHRONIC, DENTAL,
PREVENTIVE, AND INPATIENT VISITS Table 5.8 show the results of a gap analysis that examines the percentage of individuals who report that they did not visit a medical professional for treatment when they were ill. The gap analysis is calculated for acute, chronic, and dental illnesses as well as preventive visits and inpatients visits. The results show that the gap in care is largest for chronic illnesses where 27.2 percent of individuals did not seek care for the illnesses they reported having in the last four weeks. The second largest gap in care is for acute illnesses, followed by dental illnesses, inpatient visits, and finally preventive visits. Across all types of illnesses and visits, the largest gap in care is for those age 5-15 years old reporting a chronic illness in the last four weeks, with 32.1 percent not receiving care; again, this gap could be due to the limited reporting period of the survey juxtaposed with the longer-term aspect of chronic illness care.
TABLE 5.8: PERCENTAGE OF INDIVIDUALS WHO DO NOT RECEIVE CARE WHO
REPORT BEING ILL
Background
Characteristic Acute % Chronic % Dental % Preventive % Inpatient %
Gender
Male 22.2 27.2 13.8 1.8 15.0
Female 23.7 27.1 14.3 3.1 12.4
Urban/Rural
Urban 26.6 27.4 12.8 3.8 19.2
Rural 20.4 26.9 15.1 2.0 8.5
Insured
Yes 20.5 25.6 15.3 1.5 16.6
No 25.8 28.1 13.1 5.3 11.3
Region
Major Cities 23.9 26.9 6.2 6.3 22.8
Urban Lower Egypt 27.4 30.3 14.7 3.2 20.4
Urban Upper Egypt 29.7 23.6 21.0 1.7 11.8
Rural Lower Egypt 24.9 30.9 17.3 2.4 12.0
Rural Upper Egypt 12.6 15.6 10.0 1.4 3.0
Age
<5 13.3 20.3 25.1 1.1 10.5
5-15 21.5 32.1 18.9 1.1 15.5
16-29 26.6 30.1 14.4 4.7 11.1
30-39 25.7 28.8 11.0 5.8 12..3
40-49 25.2 27.0 11.1 6.5 12.7
50-59 25.1 25.8 12.5 11.4 18.2
>60 24.9 26.7 13.9 11.6 16.4
Education
<6 and/or Illiterate 19.8 26.9 16.2 1.8 12.4
Less than HS 24.5 28.0 16.1 2.7 17.1
High School 26.1 27.3 11.0 5.6 11.1
University Degree 29.9 26.3 9.1 6.7 14.0
Wealth Index
Lowest 20.1 25.7 16.8 1.8 8.8
Lower Middle 22.3 30.2 16.4 1.6 10.2
Middle 21.2 25.4 15.4 2.9 14.7
Upper Middle 23.0 26.2 13.2 3.8 17.3
Highest 28.7 28.3 9.9 3.2 16.0
Income Quintiles
Lowest 24.7 29.9 17.7 2.2 10.6
Second 21.0 28.8 16.2 2.2 12.1
Third 21.0 30.0 14.1 2.3 14.1
Fourth 23.6 25.6 13.1 3.0 15.3
Highest 24.4 22.8 9.6 3.6 15.5
Total 22.9 27.2 14.1 2.7 13.5


6. HEALTH INSURANCE
COVERAGE IN EGYPT


73
The following chapter summarize the results from the Egyptian HHEUS 2009/2010 related to patterns of health insurance coverage in Egypt and the use of this coverage. About half of the population has some type of health insurance, with coverage rates varying greatly by background characteristic. Some of this variance can be explained by Egypt‟s various health insurance laws, which are intended to ensure that vulnerable populations are covered through HIO. HIO is the plan used by most Egyptians with health insurance. The results presented below indicate that HIO is covering services for some of the most vulnerable populations (especially for youth), but the results also indicate that there is vast room for improvement in health insurance coverage rates among many cohorts of people.
6.1 INSURANCE COVERAGE
Table 6.1 reports health insurance coverage by various background characteristics. The results show that an estimated 51.0 percent of the population has some type of health insurance. The groups with the highest coverage rates are those aged 5-15 years old (93.5 percent), those in the highest wealth index (66.8 percent), those with less than a high school degree (63.7 percent), males (57.7 percent), those living the urban Lower Egypt (56.4 percent), and those in urban areas (54.4 percent). Some of these trends in health insurance coverage can be explained. For example, the increased coverage for males over females may be due to higher level of employment for males versus females. The higher coverage for the under 5 and 5-15 years old age groups is likely due to the social health insurance system (HIO) newborn and school health programs. The high insurance coverage for the highest wealth index as well as the urban areas is most likely due to higher levels of employment and greater ability to pay for private insurance. The higher insurance coverage for those with less than a high school degree is not fully understood, especially considering the high coverage rate among those in the highest wealth index. It could be that this group also consists of workers, who are covered by HIO according to health insurance Laws 32 and 79, or that this group consists of youth under age 15 who also have high coverage rates.
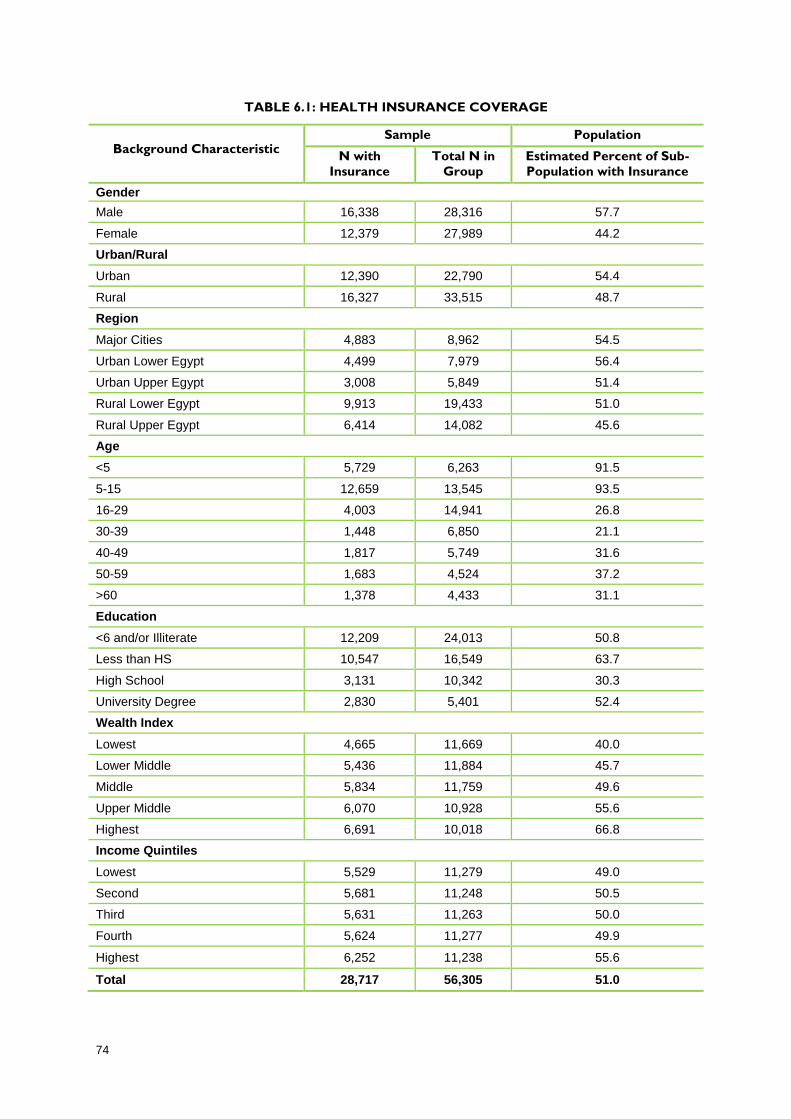
74
TABLE 6.1: HEALTH INSURANCE COVERAGE
Background Characteristic Sample Population
N with
Insurance
Total N in
Group
Estimated Percent of Sub-
Population with Insurance
Gender
Male 16,338 28,316 57.7
Female 12,379 27,989 44.2
Urban/Rural
Urban 12,390 22,790 54.4
Rural 16,327 33,515 48.7
Region
Major Cities 4,883 8,962 54.5
Urban Lower Egypt 4,499 7,979 56.4
Urban Upper Egypt 3,008 5,849 51.4
Rural Lower Egypt 9,913 19,433 51.0
Rural Upper Egypt 6,414 14,082 45.6
Age
<5 5,729 6,263 91.5
5-15 12,659 13,545 93.5
16-29 4,003 14,941 26.8
30-39 1,448 6,850 21.1
40-49 1,817 5,749 31.6
50-59 1,683 4,524 37.2
>60 1,378 4,433 31.1
Education
<6 and/or Illiterate 12,209 24,013 50.8
Less than HS 10,547 16,549 63.7
High School 3,131 10,342 30.3
University Degree 2,830 5,401 52.4
Wealth Index
Lowest 4,665 11,669 40.0
Lower Middle 5,436 11,884 45.7
Middle 5,834 11,759 49.6
Upper Middle 6,070 10,928 55.6
Highest 6,691 10,018 66.8
Income Quintiles
Lowest 5,529 11,279 49.0
Second 5,681 11,248 50.5
Third 5,631 11,263 50.0
Fourth 5,624 11,277 49.9
Highest 6,252 11,238 55.6
Total 28,717 56,305 51.0
75
6.2 TYPES OF INSURANCE COVERAGE
Table 6.2 provides additional detail on the types of health insurance held among those with health insurance. Note that some respondents reported having up to three different types of health insurance. The most frequently held health insurance is that of the HIO, which is used by an estimated 89 percent of the population that has health insurance. The other types of health insurance used in Egypt are government insurance other than HIO (5 percent), public insurance (1 percent), private insurance (2 percent), syndicates (1 percent), and other (1 percent). HIO is the main source of insurance for those under age 6 years and/or illiterate, as well as females, young children (under 15 years of age), and those in the lowest wealth index. These HIO coverage rates are likely due to Egypt‟s various health insurance laws. For instance, Law 99 covers students, Decree 380 covers infants, and Laws 32 and 79 cover pensioners and widows. The other insurance plans, which constitute a smaller part of the market, are available mostly for males, those living in urban areas and major cities, those with more education, and the wealthiest. The results in Table 6.2 clearly show that HIO is covering services for some of the most underserved populations (females, children, poorer populations), as intended by the various health insurance laws. Increasing HIO coverage will only improve the percentage of the population in these underserved groups that have insurance.

76
TABLE 6.2: PERCENT DISTRIBUTION OF INSURANCE COVERAGE BY POPULATION
CHARACTERISTICS
Background
Characteristic
Percent with Health Insurance Type
HIO Gov. other
than HIO
Public
Sector Private Syndicate Other
Gender
Male 87 5 2 3 1 1
Female 92 4 1 1 1 1
Urban/Rural
Urban 85 6 2 3 2 1
Rural 92 4 1 1 0 1
Region
Major Cities 83 6 2 4 4 1
Urban Lower Egypt 87 5 2 3 1 2
Urban Upper Egypt 88 5 1 3 2 1
Rural Lower Egypt 89 6 1 2 1 1
Rural Upper Egypt 97 1 0 0 0 0
Age
<5 97 1 0 0 0 0
5-15 98 1 0 0 0 0
16-29 74 11 2 5 2 7
30-39 62 14 6 13 5 0
40-49 75 9 5 7 3 1
50-59 75 11 6 5 3 1
>60 83 9 2 1 3 1
Education
<6 and/or Illiterate 97 2 0 1 0 0
Less than HS 94 3 1 1 0 0
High School 66 13 4 7 2 8
University Degree 67 12 4 9 8 1
Wealth Index
Lowest 96 2 0 0 0 0
Lower Middle 94 3 1 2 0 1
Middle 92 4 1 2 0 1
Upper Middle 89 5 2 3 1 1
Highest 79 8 3 4 4 2
Income Quintile
Lowest 96 2 0 1 0 0
Second 94 3 1 1 0 1
Third 92 4 1 2 0 1
Fourth 88 5 2 3 1 1
Highest 78 8 3 4 4 2
Total 89 5 1 2 1 1
Table 6.3 shows the percentages reporting that their health insurance covers their needed services fully or partially, by type of insurance, among those who have health insurance. The full and partial coverage is in reference to the different health insurance plans held by each individual, including up to three different insurance plans for each individual.8 The
8 The results do not differentiate which of multiple insurance plans each individual has is primary,
secondary, or tertiary.

77
results show that HIO provides the highest full coverage of services, with 86 percent of HIO insurees reporting that the services are covered partially or in full. The lowest coverage of services is through syndicates, which only provide full coverage of services 57 percent of the time. Trends in coverage are similar for the different background characteristics analyzed.
TABLE 6.3: PERCENT REPORTING FULL OR PARTIAL COVERAGE OF SERVICES, BY TYPE
OF HEALTH INSURANCE COVERAGE AND BACKGROUND CHARACTERISTIC
Background
Characteristic
Percent with Needs Covered Fully or Partially by Health Insurance Type
HIO Gov. other
than HIO Public Private Syndicate Other
Gender
Male 86 83 81 66 61 86
Female 86 78 69 67 52 81
Urban/Rural
Urban 85 80 74 66 54 83
Rural 87 83 84 65 75 85
Region
Major Cities 87 79 68 76 54 84
Urban Lower Egypt 88 88 82 70 65 85
Urban Upper Egypt 76 71 77 38 42 69
Rural Lower Egypt 90 85 84 62 72 84
Rural Upper Egypt 82 71 92 88 89 87
Age
<5 89 80 70 80 75 67
5-15 86 86 96 88 79 82
16-29 83 86 62 65 42 90
30-39 84 79 76 57 66 20
40-49 83 74 87 72 48 45
50-59 84 79 78 62 55 69
>60 84 81 84 95 61 50
Education
<6 and/or Illiterate 87 82 89 78 76 63
Less than HS 86 85 79 69 53 90
High School 81 82 78 63 43 88
University Degree 84 77 74 64 57 59
Wealth Index
Lowest 83 80 86 50 67 83
Lower Middle 89 85 90 73 71 98
Middle 87 83 83 73 57 74
Upper Middle 86 79 81 58 65 80
Highest 85 82 73 67 55 85
Income Quintiles
Lowest 85 79 90 68 55 85
Second 88 81 79 71 75 81
Third 87 79 86 72 64 85
Fourth 86 87 88 65 65 92
Highest 84 81 70 63 63 80
Total 86 82 78 66 57 84


7. TYPE OF FACILITY AND
CHOICE OF PROVIDER IN
EGYPT


81
The following tables summarize the results from the Egyptian HHEUS 2009/2010 related to the type of facility and provider chosen for different health services. Over three-quarters of outpatient visits are made to private facilities, whereas over half (63 percent) of inpatient visits are made to public facilities. In regards to types of outpatient services, the choice of facility and of provider is similar for acute and chronic illnesses, with private facilities (private clinic or pharmacy) used to treat about three-quarters of acute and chronic illnesses, and specialists/consultants visited for about 63 to 68 percent of acute and chronic illnesses. Private clinics are also frequently used to treat dental diseases. In contrast, the majority of preventive health care visits are made either at an MOHP facility or another kind of facility not listed in the survey. Also for preventive services, nurses provide the care for half of these visits, and specialists/consultants provide the care for a quarter of the visits. Across all types of illnesses/visits, we see a clear trend between wealth/income and type of facility visited: as wealth/income increases, visits to public facilities decrease (while visits to private providers increase).
7.1 TYPE OF FACILITY AND CHOICE OF PROVIDER:
OUTPATIENT CARE
Table 7.1 reports which facilities were visited for outpatient services (this includes acute, chronic, dental, and preventive visits). The private sector is the primary provider of outpatient services, accounting for 77 percent of all visits. Private clinics and pharmacies are the main private providers, accounting for 44 percent and 29 percent of all outpatient visits, respectively. In regards to use of public providers for outpatient services, about the same percentages of visits take place at MOHP outpatient facilities (6 percent) and MOHP hospitals (7 percent).
TABLE 7.1: PERCENT OF VISITS BY FACILITY: ALL OUTPATIENT VISITS
Percent of Outpatient Visits
MOHP Outpatient
Facility
MOHP Hospital
HIO Facility
Other Gov.
Pharmacy Private Clinic
Other Private
Other
Total 6 7 4 3 29 44 4 3
7.1.1 TYPE OF FACILITY AND CHOICE OF PROVIDER: ACUTE ILLNESS
Table 7.2 reports which facilities were visited to treat acute illnesses. Private clinics are most frequently used, with an estimated 45 percent of acute illnesses treated at such facilities (among cases where individuals made any visit to treat the illness).9 Pharmacies are used in an estimated 32 percent of acute illnesses. In total, 81 percent of acute illness visits are to private providers. The results are similar across the different background characteristics listed in the Table 7.2.
9 Up to three acute illnesses or episodes occurring in the four weeks prior to taking the survey could be
reported. For each illness, up to three health visits could be reported.

82
TABLE 7.2: PERCENT OF VISITS BY FACILITY: ACUTE ILLNESS
Background
Characteristic
Percent of Acute Illness Visits
MOHP
Outpatient
Facility
MOHP
Hospital
HIO
Facility
Other
Gov. Pharmacy
Private
Clinic
Other
Private Other
Gender
Male 5 7 3 3 33 45 4 1
Female 5 8 2 1 32 47 4 1
Urban/ Rural
Urban 2 8 4 3 35 39 7 1
Rural 7 6 2 0 31 50 1 1
Insured
Yes 6 7 4 2 29 46 4 1
No 4 7 0 2 37 46 3 1
Region
Major Cities 2 6 4 6 36 33 11 1
Urban Lower Egypt
2 9 4 2 36 39 5 1
Urban Upper Egypt
1 10 4 2 32 45 4 1
Rural Lower Egypt
6 7 2 1 32 49 1 1
Rural Upper Egypt
9 6 1 0 30 52 1 1
Age
<5 8 7 1 1 17 60 4 1
5-15 9 9 4 1 31 42 4 1
16-29 3 6 1 2 39 43 4 1
30-39 3 7 2 1 40 42 4 1
40-49 3 7 3 2 39 41 4 2
50-59 2 7 3 3 35 45 4 1
>60 3 6 5 2 34 45 2 2
Education
<6 and/or Illiterate
7 8 2 2 27 52 3 1
Less than HS 5 8 4 2 36 38 3 1
High School 2 5 2 2 40 43 4 1
University Degree
1 4 3 2 40 41 6 2
Wealth Index
Lowest 8 8 2 0 31 48 2 1
Lower Middle 7 8 2 1 33 46 2 1
Middle 6 8 3 1 32 46 3 1
Upper Middle 3 7 3 3 33 45 5 1
Highest 1 3 3 2 34 46 8 2
Income Quintiles
Lowest 9 10 3 1 29 44 2 1
Second 7 9 2 1 32 44 3 1
Third 5 7 2 0 33 47 3 1
Fourth 3 7 2 2 32 48 5 1
Highest 2 4 3 3 36 46 6 1
Total 5 7 2 2 32 45 4 1

83
Table 7.3 reports which types of providers are visited to treat acute illnesses, among cases where individuals make a visit to treat the illness.10 Specialists/consultants treat the majority (an estimated 63 percent) of acute illness visits, followed by “other” types of providers not listed in the survey (32 percent). The results are similar for the different background characteristics listed in Table 7.3.
TABLE 7.3: PERCENT OF VISITS BY PROVIDER: ACUTE ILLNESS
Background
Characteristic
Percent of Acute Illness Visits
Specialist /
Consultant
Family
Physician/
General
Practitioner
Assistant
Nurse Nurse
Physiotherapy
Technician
Traditional
Healer Other
Gender
Male 62 5 0 0 0 0 32
Female 63 5 0 0 0 0 31
Urban/Rural
Urban 61 4 0 0 0 0 34
Rural 64 6 0 0 0 0 30
Insured
Yes 65 6 0 0 0 0 28
No 59 4 0 0 0 0 36
Region
Major Cities 59 5 0 0 1 0 5
Urban Lower Egypt 61 3 0 0 0 0 36
Urban Upper Egypt 66 4 0 0 0 0 30
Rural Lower Egypt 65 4 0 0 0 0 31
Rural Upper Egypt 62 9 0 0 0 0 29
Age
<5 76 7 0 0 0 0 16
5-15 62 8 0 0 0 0 30
16-29 57 4 0 0 0 0 38
30-39 57 3 0 0 0 0 39
40-49 58 3 0 0 0 0 38
50-59 61 3 0 0 1 0 35
>60 64 3 0 0 0 0 33
Education
<6 and/or Illiterate 67 6 0 0 0 0 27
Less than HS 59 5 0 0 0 0 35
High School 57 3 0 0 0 0 39
University Degree 58 2 0 0 0 0 39
Wealth Index
Lowest 61 7 0 0 0 0 31
Lower Middle 62 6 0 0 0 0 32
Middle 62 6 0 0 0 0 31
Upper Middle 64 3 0 0 0 0 32
Highest 64 3 0 0 0 0 33
Income Quintiles
Lowest 62 9 0 0 0 0 28
Second 62 6 0 0 0 0 31
Third 63 5 0 0 0 0 32
Fourth 65 3 0 0 0 0 32
Highest 63 2 0 0 0 0 35
Total 63 5 0 0 0 0 32
10 Up to three acute illnesses or episodes occurring in the four weeks prior to taking the survey could be
reported. For each illness, up to three health visits could be reported.
84
7.1.2 TYPE OF FACILITY AND CHOICE OF PROVIDER: CHRONIC
ILLNESS
Table 7.4 reports which facilities are visited to treat chronic illnesses, among those illnesses for which any visit is made.11 Most chronic illness visits are made to either a private clinic (42 percent) or the pharmacy (30 percent). In total, an estimated 76 percent of chronic illness visits are made to private providers. The results are fairly similar for the different background characteristics listed in Table 7.4, with certain segments of the population using HIO hospitals and outpatient clinics slightly more than others (males, those in urban areas, those with insurance, those living in major cities, those aged 5-15 years old and over 60 years old, those with some type of education and those in the higher wealth indices). These groups are also the groups that are mostly insured through HIO through employment in the formal sector or a school-based insurance program.
11 Up to three chronic illnesses or episodes occurring in the four weeks prior to taking the survey could be
reported. For each illness, up to three health visits could be reported.

85
TABLE 7.4:PERCENT OF VISITS BY FACILITY: CHRONIC ILLNESS
Background
Characteristic
Percent of Chronic Illness Visits
MOHP
Outpatient
Facility
MOHP
Hospital
HIO
Facility
Other
Gov. Pharmacy
Private
Clinic
Other
Private Other
Gender
Male 1 8 15 4 27 39 3 1
Female 3 9 5 3 31 43 4 1
Urban/Rural
Urban 1 7 12 5 29 38 6 2
Rural 3 9 6 2 31 46 1 1
Insured
Yes 1 5 23 4 24 38 3 1
No 2 10 0 3 34 45 4 1
Region
Major Cities 1 5 14 5 27 37 8 2
Urban Lower Egypt
1 9 9 3 30 41 4 2
Urban Upper Egypt
2 10 12 3 31 36 5 1
Rural Lower Egypt
3 10 6 2 29 47 1 1
Rural Upper Egypt
3 9 5 2 35 45 1 1
Age
<5 6 9 3 3 12 62 5 1
5-15 2 9 10 5 26 45 4 1
16-29 2 9 1 3 31 46 5 1
30-39 2 8 2 3 34 45 3 1
40-49 2 10 7 2 29 42 5 1
50-59 2 8 11 5 29 39 5 2
>60 2 7 13 3 32 39 2 1
Education
<6 and/or Illiterate
3 10 5 3 31 43 3 1
Less than HS
2 8 11 4 30 39 4 2
High School 1 6 13 4 28 42 4 1
University Degree
0 3 14 5 29 41 6 2
Wealth Index
Lowest 4 11 3 2 32 45 2 1
Lower Middle
3 12 5 2 32 42 3 1
Middle 2 11 9 3 29 42 4 1
Upper Middle
1 6 12 5 29 41 6 1
Highest 1 4 13 6 28 41 6 2
Income Quintiles
Lowest 3 13 6 3 28 42 3 1
Second 3 10 8 3 30 41 3 1
Third 2 9 8 3 30 43 4 1
Fourth 1 7 10 4 32 40 4 2
Highest 1 3 11 4 29 44 5 1
Total 2 8 9 3 30 42 4 1

86
Table 7.5 reports which types of providers are visited to treat chronic illnesses, among cases where individuals make a visit to treat the illness.12 The majority of visits are made to a specialist/ consultant (an estimated 68 percent) or some “other” provider (29 percent). The results are similar for the different background characteristics listed in the Table 7.5.
TABLE 7.5: PERCENT OF VISITS BY PROVIDER: CHRONIC ILLNESS
Background
Characteristic
Percent of Chronic Illness Visits
Specialist /
Consultant
Family
Physician,
General
Practitioner
Assistant
Nurse Nurse
Physiotherapy
Technician
Traditional
Healer Other
Gender
Male 71 2 0 0 0 0 27
Female 66 2 0 0 0 0 31
Urban/Rural
Urban 69 2 0 0 0 0 28
Rural 67 2 0 0 0 0 31
Insured
Yes 74 2 0 0 0 0 23
No 64 2 0 0 0 0 33
Region
Major Cities 70 2 0 0 1 0 27
Urban Lower Egypt 68 2 0 0 0 0 30
Urban Upper Egypt 69 2 0 0 0 0 28
Rural Lower Egypt 69 2 0 0 0 0 29
Rural Upper Egypt 62 4 0 0 0 0 34
Age
<5 83 4 0 1 1 0 12
5-15 72 2 0 0 0 0 25
16-29 68 3 0 0 0 0 30
30-39 64 1 0 0 0 0 33
40-49 69 2 0 0 0 0 29
50-59 69 2 0 0 1 0 28
>60 66 2 0 0 0 0 31
Education
<6 and/or Illiterate 67 2 0 0 0 0 30
Less than HS 68 2 0 0 0 0 29
High School 70 2 0 0 0 0 27
University Degree 70 1 0 0 0 0 28
Wealth Index
Lowest 66 3 0 0 0 0 31
Lower Middle 65 2 0 0 0 0 32
Middle 69 3 0 0 0 0 28
Upper Middle 69 2 0 0 0 0 29
Highest 70 2 0 0 0 0 27
Income Quintile
Lowest 69 3 0 0 0 0 27
Second 66 3 0 1 0 0 30
Third 69 1 0 0 0 0 29
Fourth 67 2 0 0 0 0 31
Highest 69 2 0 0 0 0 29
Total 68 2 0 0 0 0 29
12 Up to three chronic illnesses or episodes occurring in the four weeks prior to taking the survey could be
reported. For each illness, up to three health visits could be reported.

87
7.1.3 TYPE OF FACILITY AND CHOICE OF PROVIDER: DENTAL
DISEASES
Table 7.6 reports which facilities are visited to treat dental diseases.13 Private clinics are most frequently used, with an estimated 62 percent of visits made to this type of facility. The results are similar for the different background characteristics listed in the Table 7.6, although a trend toward richer people using private clinics, and poor people using public facilities, can be seen.
13 Up to three dental diseases or episodes occurring in the 12 months prior to taking the survey could be
reported. For each illness, up to three health visits could be reported. Recall that routine dental check-ups are not included in the dental disease questionnaire/reporting.

88
TABLE 7.6: PERCENT OF VISITS BY FACILITY: DENTAL DISEASES
Background
Characteristic
Percent of Dental Disease Visits
MOHP
Outpatient
Facility
MOHP
Hospital
HIO
Facility
Other
Gov.
Phar-
macy
Private
Clinic
Other
Private Other
Gender
Male 5 9 4 4 6 62 8 2
Female 7 10 2 5 5 61 9 2
Urban/Rural
Urban 2 8 5 8 4 61 12 2
Rural 10 10 1 2 7 63 5 2
Insured
Yes 6 8 6 6 5 60 7 2
No 7 11 0 3 6 63 9 1
Region
Major Cities 3 6 6 11 3 54 16 1
Urban Lower Egypt
2 10 4 4 4 67 7 2
Urban Upper Egypt
2 10 3 4 5 61 13 2
Rural Lower Egypt
10 10 2 2 6 66 3 2
Rural Upper Egypt
10 12 1 0 10 55 9 2
Age
<5 9 10 1 6 11 57 4 1
5-15 12 12 7 6 6 49 6 2
16-29 5 8 1 4 7 66 8 2
30-39 5 7 1 5 5 66 8 2
40-49 5 9 2 5 6 66 7 2
50-59 5 11 4 6 4 62 8 1
>60 7 10 4 4 5 59 9 1
Education
<6 and/or Illiterate
11 14 2 3 7 54 7 1
Less than HS 6 10 5 5 6 56 8 2
High School 4 6 2 3 5 68 9 2
University Degree
1 3 2 4 3 75 10 1
Wealth Index
Lowest 11 16 1 2 10 52 5 2
Lower Middle 9 14 2 3 7 57 7 1
Middle 8 12 3 3 7 58 7 2
Upper Middle 5 7 4 5 5 62 10 1
Highest 1 3 3 6 2 71 10 2
Income Quintiles
Lowest 12 18 3 4 6 49 7 2
Second 9 11 3 3 7 57 8 2
Third 6 10 3 4 7 61 8 1
Fourth 5 7 3 4 5 65 7 2
Highest 2 3 3 5 4 73 9 1
Total 7 9 3 4 6 62 8 2
89
7.1.4 TYPE OF FACILITY AND CHOICE OF PROVIDER: PREVENTIVE
SERVICES
Table 7.7 reports which facilities are visited for preventive services.14 MOHP outpatient facilities (an estimated 40 percent) and “other” facilities (36 percent) are most frequently used. About 14 percent of preventive visits are made to private clinics. The results are similar for the different background characteristics listed in the Table 7.7, although trends exist regarding income/wealth and use of public facilities (as wealth/income increase, the percentage of people visiting public facilities decrease). It is interesting to note that the insured and those under age 15 years rely less on private clinics for preventive services than those without insurance.
14 Up to three preventive consultation types (e.g., vaccinations, growth monitoring, pre-marriage
consultation) occurring in the 12 months prior to taking the survey could be reported. For each consultation type, up to three health visits could be reported.

90
TABLE 7.7: PERCENT OF VISITS BY FACILITY: PREVENTIVE SERVICES
Background
Characteristic
Percent of Preventive Care Visits
MOHP
Outpatient
Facility
MOHP
Hospital
HIO
Facility
Other
Gov. Pharmacy
Private
Clinic
Other
Private Other
Gender
Male 41 3 1 3 0 2 1 50
Female 38 4 0 2 4 20 2 28
Urban/Rural
Urban 35 5 1 5 3 14 4 34
Rural 42 3 0 1 2 13 0 37
Insured
Yes 41 3 1 1 1 3 0 49
No 36 6 0 2 7 39 4 6
Region
Major Cities 37 4 2 6 2 15 7 26
Urban Lower Egypt
28 6 0 3 4 13 2 43
Urban Upper Egypt
43 4 1 5 3 16 1 27
Rural Lower Egypt
34 4 0 1 2 12 0 45
Rural Upper Egypt
56 2 0 0 2 15 0 24
Age
<5 69 4 0 2 0 1 0 23
5-15 15 1 0 1 0 0 0 81
16-29 26 5 0 2 4 44 3 15
30-39 37 7 1 4 10 38 2 2
40-49 38 6 2 4 14 25 6 4
50-59 15 15 4 15 4 27 5 15
>60 7 9 8 19 8 20 11 16
Education
<6 and/or Illiterate
54 4 0 2 1 6 1 33
Less than HS 12 3 0 2 2 10 2 68
High School 26 5 1 3 8 46 3 8
University Degree
14 6 3 5 8 52 6 6
Wealth Index
Lowest 48 2 0 1 1 11 0 36
Lower Middle 44 3 0 1 2 13 1 35
Middle 39 4 0 1 3 14 1 39
Upper Middle 38 5 1 2 2 14 2 35
Income Quintiles
Lowest 55 3 0 1 1 10 0 28
Second 45 4 0 1 2 10 1 37
Third 39 4 0 1 2 12 1 40
Fourth 33 4 0 1 3 15 1 40
Highest 26 5 1 5 3 22 3 35
Total 40 4 0 2 2 14 2 36

91
Table 7.8 reports which types of providers are visited for preventive services.15 It is estimated that half (50 percent) of preventive services are provided by a nurse, followed by a specialist/consultant (25 percent) or an assistant nurse (18 percent). The results are similar for the different background characteristics listed in the Table 7.8. The insured and those under age 15 rely less on specialists and more on nurses.
15 Up to three preventive consultation types (e.g., vaccinations, growth monitoring, pre-marriage
consultation) occurring in the 12 months prior to taking the survey could be reported. For each consultation type, up to three health visits could be reported.

92
TABLE 7.8: PERCENT OF VISITS BY PROVIDER: PREVENTIVE SERVICES
Background
Characteristic
Percent of Preventive Care Visits
Specialist /
Consultant
Family
Physician,
General
Practitioner
Assistant
Nurse Nurse
Physiotherapy
Technician
Traditional
Healer Other
Gender
Male 9 2 24 63 0 0 1
Female 35 4 15 42 0 0 4
Urban/Rural
Urban 33 3 24 37 0 0 3
Rural 22 4 15 57 0 0 3
Insured
Yes 9 2 24 64 0 0 2
No 64 6 5 18 0 0 7
Region
Major Cities 43 3 36 14 1 0 2
Urban Lower Egypt
24 2 20 49 0 0 5
Urban Upper Egypt
34 5 13 45 0 0 3
Rural Lower Egypt
22 2 19 54 0 0 3
Rural Upper Egypt
21 6 9 62 0 0 2
Age
<5 5 3 25 67 1 0 0
5-15 4 2 25 67 0 0 2
16-29 66 6 6 18 0 0 5
30-39 65 5 3 16 0 0 10
40-49 58 7 3 19 0 0 13
50-59 74 8 4 10 1 0 3
>60 72 7 3 5 3 0 9
Education
<6 and/or Illiterate
14 3 22 59 0 0 2
Less than HS 22 3 20 52 0 0 3
High School 70 5 3 13 0 0 8
University Degree
80 3 2 6 0 0 9
Wealth Index
Lowest 18 4 15 60 0 0 3
Lower Middle 22 4 16 55 0 0 3
Middle 25 3 17 52 0 0 3
Upper Middle 28 3 21 44 0 0 4
Highest 35 3 22 36 0 0 4
Income Quintiles
Lowest 19 5 17 58 0 0 2
Second 19 4 19 55 0 0 3
Third 22 3 19 52 0 0 3
Fourth 27 3 17 51 0 0 3
Highest 40 3 19 34 0 0 4
Total 25 3 18 50 0 0 3
93
7.2 TYPE OF HOSPITAL: INPATIENT VISITS
Table 7.9 reports which types of hospitals are visited for inpatient/hospital admissions.16 Sixty-three percent of inpatient visits are made to public providers, and 33 percent are made to private providers (which is inverse of the choice of provider for outpatient care). The usage of public providers appears to mostly be a function of affordability, as the use of private hospitals is positively correlated with income.
Some differences by background characteristics are present in types of hospitals visited for inpatient care. For example, females are more likely than males to visit private hospitals, while males are more likely to visit MOHP hospitals. Additionally, among those living in major cities, only 19 percent of visits were made to MOHP hospitals, whereas in the rest of the country 39 to 48 percent of visits were made to MOHP hospitals. And, those with higher levels of education and the rich tend to visit private hospitals, whereas those with lower levels of education and the poor tend to visit MOHP facilities.
16 Up to three hospital admissions occurring in the 12 months prior to taking the survey could be reported.

94
TABLE 7.9: PERCENT OF VISITS BY HOSPITAL TYPE: INPATIENT VISITS
Background
Characteristic
Percent of Inpatient Care Visits
MO
HP
Ho
spit
al
1 d
ay S
urg
.
Ho
spit
al
HIO
Ho
spit
al &
Ou
tpat.
Clin
ic
Oth
er
Go
v.
Ho
spit
al
CC
O
Un
iv. H
osp
ital
Teach
Ho
spit
al
Pri
vate
Ho
spit
al
Ch
ari
tab
le
Ho
spit
al
Mo
squ
e/
Ch
urc
h
Oth
er
Gender
Male 41 1 14 3 0 2 9 25 1 1 4
Female 37 1 6 2 1 3 6 35 1 1 6 Urban/Rural
Urban 33 1 13 4 1 4 8 32 1 1 3
Rural 44 1 6 2 0 1 7 30 1 1 7 Insured
Yes 35 1 21 4 0 1 7 25 1 1 3
No 42 1 1 2 1 3 8 35 1 1 6 Region
Major Cities 19 1 17 7 1 7 7 36 2 2 2
Urban Lower Egypt
39 0 10 2 1 1 8 32 1 0 5
Urban Upper Egypt
46 2 10 2 1 3 7 24 1 1 3
Rural Lower Egypt
42 1 6 2 0 2 7 29 1 1 9
Rural Upper Egypt
48 0 5 1 0 1 8 31 2 0 4
Age
<5 56 0 8 2 0 3 6 20 2 1 2
5-15 41 1 19 2 0 1 7 22 1 1 4
16-29 32 1 3 3 1 3 7 40 2 1 8
30-39 35 0 5 3 1 3 5 38 1 2 6 40-49 44 1 11 2 1 3 6 27 1 1 2
50-59 37 0 15 4 1 2 9 28 0 1 3
>60 41 2 10 3 0 2 12 24 1 0 4 Education
<6 and/or Illiterate 50 1 6 1 1 2 8 25 1 1 4
Less than HS 37 1 13 4 1 3 8 27 1 1 4
High School 31 1 7 3 0 2 7 39 1 1 8
University Degree 15 1 16 6 1 2 5 48 1 1 3 Wealth Index
Lowest 53 1 4 1 0 2 8 24 1 0 7
Lower Middle 47 1 8 1 1 2 7 26 1 1 6 Middle 43 1 9 3 0 2 7 27 2 1 5
Upper Middle 34 1 11 3 0 4 8 31 2 2 4
Highest 17 1 14 6 1 3 6 48 1 0 3 Income Quintiles
Lowest 51 1 7 3 0 3 7 20 1 1 6
Second 45 0 10 2 0 3 7 24 2 1 6
Third 41 1 9 2 1 3 8 28 1 1 6
Fourth 36 1 10 2 1 2 7 36 1 1 4
Highest 22 1 11 5 1 2 8 46 1 1 3 Total 39 1 9 3 1 3 7 31 1 1 5

8. QUALITY OF CARE

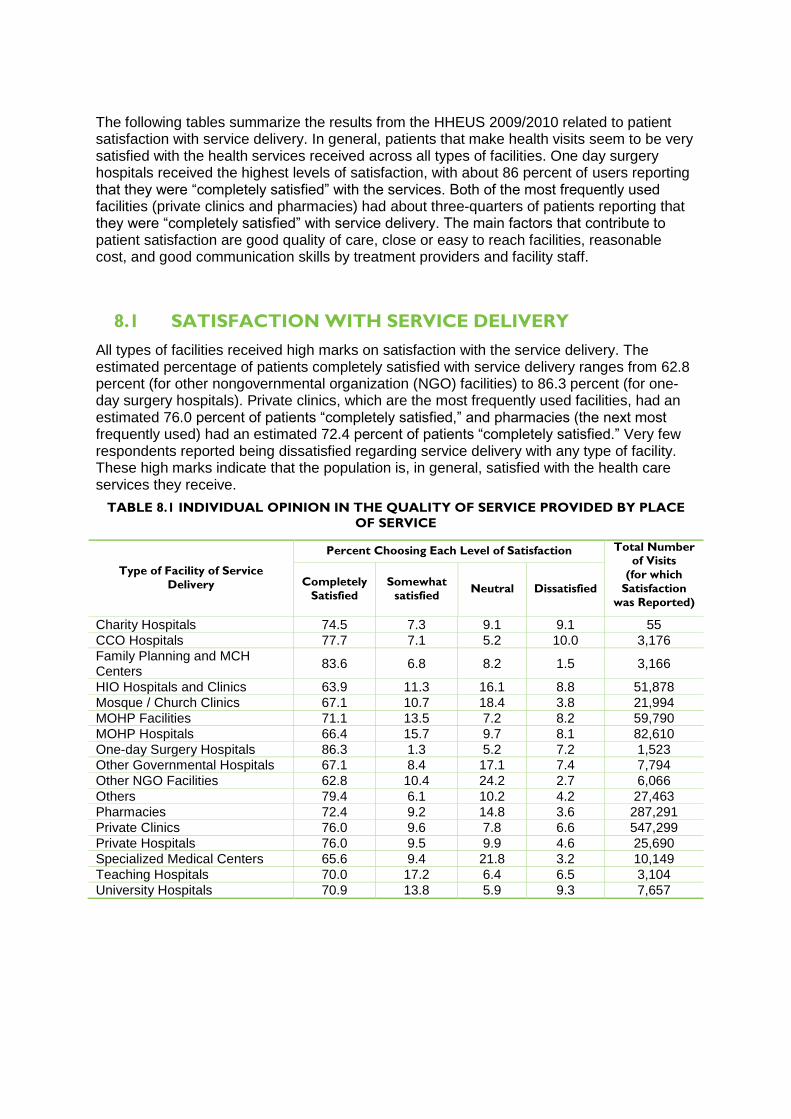
The following tables summarize the results from the HHEUS 2009/2010 related to patient satisfaction with service delivery. In general, patients that make health visits seem to be very satisfied with the health services received across all types of facilities. One day surgery hospitals received the highest levels of satisfaction, with about 86 percent of users reporting that they were “completely satisfied” with the services. Both of the most frequently used facilities (private clinics and pharmacies) had about three-quarters of patients reporting that they were “completely satisfied” with service delivery. The main factors that contribute to patient satisfaction are good quality of care, close or easy to reach facilities, reasonable cost, and good communication skills by treatment providers and facility staff.
8.1 SATISFACTION WITH SERVICE DELIVERY
All types of facilities received high marks on satisfaction with the service delivery. The estimated percentage of patients completely satisfied with service delivery ranges from 62.8 percent (for other nongovernmental organization (NGO) facilities) to 86.3 percent (for one-day surgery hospitals). Private clinics, which are the most frequently used facilities, had an estimated 76.0 percent of patients “completely satisfied,” and pharmacies (the next most frequently used) had an estimated 72.4 percent of patients “completely satisfied.” Very few respondents reported being dissatisfied regarding service delivery with any type of facility. These high marks indicate that the population is, in general, satisfied with the health care services they receive.
TABLE 8.1 INDIVIDUAL OPINION IN THE QUALITY OF SERVICE PROVIDED BY PLACE
OF SERVICE
Type of Facility of Service
Delivery
Percent Choosing Each Level of Satisfaction Total Number of Visits
(for which
Satisfaction
was Reported)
Completely
Satisfied
Somewhat
satisfied Neutral Dissatisfied
Charity Hospitals 74.5 7.3 9.1 9.1 55
CCO Hospitals 77.7 7.1 5.2 10.0 3,176
Family Planning and MCH Centers
83.6 6.8 8.2 1.5 3,166
HIO Hospitals and Clinics 63.9 11.3 16.1 8.8 51,878
Mosque / Church Clinics 67.1 10.7 18.4 3.8 21,994
MOHP Facilities 71.1 13.5 7.2 8.2 59,790
MOHP Hospitals 66.4 15.7 9.7 8.1 82,610
One-day Surgery Hospitals 86.3 1.3 5.2 7.2 1,523 Other Governmental Hospitals 67.1 8.4 17.1 7.4 7,794
Other NGO Facilities 62.8 10.4 24.2 2.7 6,066
Others 79.4 6.1 10.2 4.2 27,463
Pharmacies 72.4 9.2 14.8 3.6 287,291
Private Clinics 76.0 9.6 7.8 6.6 547,299
Private Hospitals 76.0 9.5 9.9 4.6 25,690
Specialized Medical Centers 65.6 9.4 21.8 3.2 10,149
Teaching Hospitals 70.0 17.2 6.4 6.5 3,104
University Hospitals 70.9 13.8 5.9 9.3 7,657

98
Table 8.2 provides a more in-depth look at the elements contributing to patient satisfaction. Across the four reported-on health care services areas, good care quality was the primary element contributing to patient satisfaction. Close or easy-to-reach facilities along with reasonable cost and good communication skills by treatment providers and facility staff were the other three top elements. It is interesting to note that very few individuals reported that having a provider of the same sex, a short wait time, or a clean facility were their primary reason for satisfaction; however, these factors may have been considered when the individual originally chose the service facility, and thus did not incorporate it into their reason for being satisfied (e.g., a woman already chose a woman provider and knew that she was getting this, so it did not factor into her level of satisfaction when evaluating the provider – it was a non-issue because of how she chose the provider).
TABLE 8.2 ELEMENTS CONTRIBUTING TO PATIENT SATISFACTION BY SERVICE TYPE
Reasons for satisfaction
Percent Reporting that Reason for each Service Type
Chronic
Disease
Services
(n=17,851)
Non-Chronic
Disease
Services
(n=47,664)
Dental
Services
(n=26,652)
Inpatient
Health Care
Services
(n=8,291)
Facility nearby / easy to reach 23.5 25.5 22.6 13.8
Reasonable cost 17.6 20.1 19.0 16.9
Same sex 1.1 0.8 0.9 1.9
Good quality 28.1 26.8 28.9 32.6
Short waiting time 4.6 4.2 4.1 3.7
Good communication skills 20.2 18.5 17.6 22.0
Clean places 3.9 3.2 6.5 8.3
Others 0.9 0.8 0.4 0.8
Total 100.0 100.0 100.0 100.0

9. SUMMARY OF KEY
FINDINGS

101
9.1 SUMMARY OF OVERALL FINDINGS
In the HHEUS 2009/2010 Egyptians reported higher use rates for both outpatient and inpatient care than in previous surveys;17 Egyptians used 9.5 outpatient visits per capita per year, and 7 out of every 100 individuals had an inpatient admission in a year. The survey also shows that the private sector remains the primary provider of outpatient services, accounting for 77 percent of all visits; private clinics and pharmacies are the main private providers accounting for a combined total of 71 percent of all outpatient visits. As for inpatient admissions, the MOHP and other public providers account for 63 percent of all inpatient admissions. This appears to mostly be a function of affordability, as the use of private hospitals is positively correlated with income.
The HHEUS 2009/2010 also provides some important results regarding health care expenditures. Egyptians spend an average of LE 646 per year on health, with LE 567 spent on outpatient care and LE 79 spent on inpatient care. There are a number of differentials by background characteristic in per capita spending: urban areas spend more than rural areas; major cities spend the most and rural Upper Egypt the least; females spend more than males; those in the highest income quintile spend nearly 4.5 times as much as those in the lowest income quintile; those in the lowest income quintile spend the highest proportion of household income on health; and the insured spend less than the uninsured.
9.2 KEY FINDINGS: GENDER
The HHEUS results demonstrate that women access health care services more than men; this holds true for all types of outpatient services and inpatient care. Across outpatient care types, females are more likely to use private providers than males and are less likely to use HIO facilities than males. For inpatient care, females are more likely to use private providers than males and are less likely to use MOHP hospitals and HIO facilities than males. Additionally, females spend more on health care than do males across all types of outpatient services and inpatient care: females spend about LE 725 annually per capita and males spend an estimated LE 567 annually per capita.
9.3 KEY FINDINGS: PLACE OF RESIDENCE
The HHEUS also provides interesting information on how choice of provider and expenditures vary by place of residence. In regard to choice of provider, for outpatient care, those in rural areas are more likely to use both private providers and MOHP facilities, and are less likely to use HIO, than those in urban areas. For inpatient care, those in rural areas are more likely to use public providers than those in urban areas.
The survey results show that expenditures on health care differ by place of residence. Those in rural areas spend less on both outpatient and inpatient care as compared with those in urban areas. Also, those in Upper Egypt spend less on both outpatient and inpatient care as compared with the rest of the country.
17 For comparisons with previous surveys, see the “Summary of Key Findings: National Health Accounts
2008/2009” fact sheet produced by Health Systems 20/20 for USAID Egypt.

102
9.4 KEY FINDINGS: INCOME
Inequity remains a major issue, as demonstrated by the survey results. In regard to health care utilization, Egyptians in the highest income quintile report making over twice as many outpatient visits as compared to those in the lowest income quintile; this difference is largest for chronic and dental care, while the difference does not exist for preventive care. Additionally, those in the highest income quintile report nearly twice as many admissions per capita as compared to those in the lowest income quintile.
Choice of provider also varies by income. As expected, the poorest are more likely than others to use public facilities for both outpatient and inpatient care. However, the majority of the visits that the poor make are to either pharmacies or private clinics. Also, the poorest are less likely than others to use HIO facilities, as they are less likely to be insured.
In terms of spending on health care, those in the highest income quintile spend four times more on outpatient care, and over 10 times as much on inpatient care, than do those in the lowest income quintile. However, the poor spend a higher proportion of household income on health as compared to the rich.
9.5 KEY FINDINGS: INSURANCE
In the HHEUS 2009/2010 survey results, insurance status does not explain either outpatient or inpatient service usage. For outpatient care, the insured and uninsured report almost the same number of visits. One would expect the insured to have a higher utilization rate as compared with the uninsured, as financial barriers to access are reduced with insurance. However, for Egypt we hypothesize that insurance is not significant in explaining demand for outpatient care. Additionally, it is interesting to note that the insured tend not to use HIO facilities for acute, dental, or preventive services, but that about one-quarter of the insured make visits to HIO facilities for chronic care and inpatient care when services are needed. The survey results also show that insurance reduces the burden of out-of-pocket spending, as expected.
Overall, 49 percent of the population in Egypt is uninsured. The rate of being uninsured is higher for females, for those living in rural areas, and for those in the lowest income quintile.
9.6 KEY FINDINGS: CHRONIC CONDITIONS
Chronic health conditions are emerging as a major issue in Egypt, be it in terms of utilization, expenditures, or inequity. For example, 27 percent (2.6 out of 9.5) of per capita outpatient visits are for chronic conditions. In the case of females this is 3.1 out of 10.3 visits per capita, and for males it is 2.1 out of 8.7 visits per capita.
The survey results demonstrate significant differentials in terms of use of chronic illness care. Those in urban areas reported 3.4 chronic visits per capita as compared with 2.0 for those living in rural areas. Those living in major cities reported 4.4 chronic visits per capita as compared with 1.5 visits per capita for those living in rural Upper Egypt. And those in the highest income quintile reported 5.1 chronic visits per capita as compared with 1.2 chronic visits per capita for those in the lowest income quintile.
Total spending on chronic visits accounted for about 36 percent of total out-of-pocket spending: LE 232 was spent on chronic care out of LE 646 total spending. However, the survey results show major differentials in expenditures between different groups of people. For instance, those in urban areas spent LE 326 per capita on chronic care as compared with LE 168 for those living in rural areas. Those living in major cities spent LE 453 per capita on chronic care as compared with LE 132 per capita for those in rural Upper Egypt. And, those in the highest income quintile spent LE 594 per capita on chronic care as compared with LE 80 for those in the lowest income quintiles.

ANNEX A: QUESTIONNAIRE FORMS


105
1- HOUSEHOLD QUESTIONNAIRE


Governorate:
Kism / Markaz
Males :
Main PositionWorker NameSerial No.
123456789
District no. / building owner name
Total : Females:
Road name / Block number
Head of Household :
Urban / Rural
Segment no.
to the source Household number within governorate
Household number within shiaka / village
Household number within the frame
Data Entry Editor
Editing Supervisor
( 1 )
Data Entry
Researcher
Field Editor
Field Supervisor
worker's information on the research application in several level
Signature
Coding Editor
Coder
Position on Research
Identification data :
shiakha / City / Village
Household number :
Office Editor
Ministry of Health
Publication or Quotation isProhibited without referring
Arab Republic of Egypt
And StatisticsCentral Agency for Public Mobilization
Household Questionnaire
Household Health Services Utilization And Expenditure Survey
2009/2010

Eligible Completed
1- # of persons of non-chronic; .
2- # of persons of the chronic diseases;
3- # of persons of the dental diseases
4- # of persons who were admitted/ hospitalized;
5- # of persons who received treatment abroad;
6- # of persons who received preventive Consultation
List of the persons who are eligible and questionnaires filled
Peace be upon you We represent ministry of health and CAPMS and we are conducting a national survey on Household Health Services Utilization and Expenditure This interview will extend for almost an hour, you should be sure that your information are top secret. During this time, I would like to talk to household head or someone on behalf of him.

Hou
seho
ld m
embe
r num
ber
name of family’smembers
Sex Relationship with the family’s head Age in Years Education enrollment Education Status (10 Yrs+) Marital Status for family members
( + Yrs 18)
Work status during 1 week before the surveyا( 6yrs +)
Under age Working
Under age Student and working Household Head Age in Years KG Illiterate Housewife & working Husband/Wife Read and write Under age Jobless but was working؛
Male Son/daughter Primary Literacy Certificate ؛ Never married Jobless but never worked Daughter's husband/ Son’s wife write Zero for FM< 1yrs Preparatory Less than Intermediate Engaged Only housewife
Female Father/Mother ؛ Public Secondary Public Secondary ؛Married Only Studying Grand: son/daughter and 99 for FM 100 Yrs or more Technical Secondary Technical Secondary ؛ Divorced Ascetic (no workSister, Brother ؛ More than Intermediate More than Intermediate and Less Than university Widow Totally handicapped ؛ Other relatives University University Partially handicapped No-relationship Post Graduate (Master, Diploma, PhD) More than university (MPH - PHD) Retired
Don’t enrolled . More than 65Y
Others101 102 103 104 105 106 107 108 109
1head
2
3
4
5
6
7
8
9
10- 2 -
Section oneEssential data of the Family
all Family Member
On leave without salary for more than one year ;
1 2
3
4 5 6
7 8
9
1
2
1
2 3 4
7 8
2 3
4 5
8
9
1 2 3 4 5
6
10
6
9 14
5
6 7 8 9
11
12
13
1
15
2
4
1
3
7 10
5 5

Work Statusا
To what extent are you keep working
# of Working
days through the last
week
Average of working
hours/dayOccupation
Main economic
activitySector
Gov Working with wage Permanent Public
Employer and employ others Temporary Private & investment sector; Self employee Seasonal Private Working with the family but without wage Sometimes Multi-sector Working with others but without wage; Cooperative
NGOs Others Outside establish
110 111 112 113 114 115 116 11712345678910
- 3 -
118 119
Hou
seho
ld m
embe
r num
ber
For both (employees and jobless but practiced job in the past) For every family memberFor who has job
Insured in SHI
Practicing any job through the
last year
Yes
No
# of working
days through
one week before
the survey
Cont., Section one
No
Yes
1
2 3
4 5
1
2
4
3 1
2
1 2
6
7
3
5
4
8
9
1
2

Hou
seho
ld m
embe
r num
ber
name of family’smembers
Sex Relationship with the family’s head Age in Years Education enrollment Education Status (10 Yrs+)
Marital Status for family
members (18 Yrs + )
Work status during 1 week before the surveyا( 6yrs +)
Under age Working
Under age Student and working Household Head Age in Years KG Illiterate Housewife & working Husband/Wife Read and write Under age Jobless but was working؛
Male Son/daughter Primary Literacy Certificate ؛ Never married Jobless but never worked Daughter's husband/ Son’s wife write Zero for FM< 1yrs Preparatory Less than Intermediate Engaged Only housewife
Female Father/Mother ؛ Public Secondary Public Secondary ؛Married Only Studying Grand: son/daughter and 99 for FM 100 Yrs or more Technical Secondary Technical Secondary ؛ Divorced Ascetic (no workSister, Brother ؛ More than Intermediate More than Intermediate and Less Than university Widow Totally handicapped ؛ Other relatives University University Partially handicapped No-relationship Post Graduate (Master, Diploma, PhD) More than university (MPH - PHD) Retired
Don’t enrolled . More than 65YOn leave without salary for more than one year ؛
Others101 102 103 104 105 106 107 108 109
1head
2
3
4
5
6
7
8
9
10-4-
Section oneEssential data of the Family
all Family Member
1 2
3
4 5 6
7 8
9
1
2
1
2 3 4
7 8
2 3
4 5
8
9
1 2 3 4 5
6
10
6
9 14
5
6 7 8 9
11
12
13
1
15
2
4
1
3
7 10
5 5

Work Statusا
To what extent are you keep working
# of Working
days through the last
week
Average of working
hours/dayOccupation
Main economic
activitySector
Gov Working with wage Permanent Public
Employer and employ others Temporary Private & investment sector; Self employee Seasonal Private Working with the family but without wage Sometimes Multi-sector Working with others but without wage; Cooperative
NGOs Others Outside establish
110 111 112 113 114 115 116 11712345678910
# of working
days through
one week before
the survey
Cont., Section one
No
Yes
118 119
Hou
seho
ld m
embe
r num
ber
For both (employees and jobless but practiced job in the past) For every family memberFor who has job
Insured in SHI
Practicing any job through the
last year
Yes
No
- 5 -
1
2 3
4 5
1
2
4
3 1
2
1 2
6
7
3
5
4
8
9
1
2

201 203 205 206Estimated Income/month Estimated Annual/ Non Monthly Income (from Q202 ) (from Q204 )
From work: From work ( FROM 203&205) Wages & salaries Wages & salaries Work for himself in the agricultural activities Work for himself in the agricultural activities Work for himself in the non-agricultural activities Work for himself in the non-agricultural activities
From other sources: From other sources Financial assets Financial assets Non-financial assets Non-financial assets
Transferring Transferring None None
Source Source Source Source Source Source Source Source Source Source Source Source 1 2 3 3 2 1 1 2 3 3 2 1
1
2
3
4
5
6
7
8
9
10
Section 2Family’s Income (For all Family Members)
Type of the Source Type of the Source
202source of the monthly Income (regular or irregular)
204Other non-monthly income
Hou
seho
ld m
embe
r num
ber
Source # Source #
Estimated Annual Income for the last 12
months
- 6 -
# #
1
2 3
4 5 6 7
1 2 3
4 5 6 7
4 5 6
7

201 203 205 206Estimated Income/month Estimated Annual/ Non Monthly Income (from Q202 ) (from Q204 )
From work: From work ( FROM 203&205) Wages & salaries Wages & salaries Work for himself in the agricultural activities Work for himself in the agricultural activities Work for himself in the non-agricultural activities Work for himself in the non-agricultural activities
From other sources: From other sources Financial assets Financial assets Non-financial assets Non-financial assets
Transferring Transferring None None
Source Source Source Source Source Source Source Source Source Source Source Source 1 2 3 3 2 1 1 2 3 3 2 1
1
2
3
4
5
6
7
8
9
10
Source #
Estimated Annual Income for the last 12
months
- 7 -
# #
Section 2Family’s Income (For all Family Members)
Type of the Source Type of the Source
202source of the monthly Income (regular or irregular)
204Other non-monthly income
Hou
seho
ld m
embe
r num
ber
Source #
1
2 3
4 5 6 7
1 2 3
4 5 6 7
4 5 6
7

304 305 306 307 308 309 310what is the cause of your participation in health insurance Why you did not use the insurance ( main 2)( main 2 causes ) Did not get sick
( Main 3 providers ) full by My place of work obligatory I don't have time ( main 2 reason )
Partially by my place of work Provide Health care with small fees Sick and did not require me going to the doctor Not applicable HIO Her/himself Provide medication with small fees Sick, but insurance does not cover this service Has no financial ability Gov. Other than HIO Wife/husband To avoid economic crisis Insurance Facility is far away Prefer not to have Public sector Parents For total coverage The services of insurance is low quality Low quality of the insurance service
Private Brother/sister ( L.E ) ( L.E ) fully Yes others Difficult administrative procedures Others Syndicates Family member Partially No 310 (Go to next member ) Non-specialized in some diseases
Yes Others Others Others No 311
1
2
3
4
5
6
7
8
9
10
Do you benefit from health insurance in the last 12
months
Section 3Health Insurance for (all Family Member)
311301 302 303 1ST provider of health insurance
what type services
covered by Health
Insurance it covered
- 8 -
How deduct from your place of work
Write Zero if there is no
deduction
Hou
seho
ld m
embe
r num
ber
How much deducted from your monthly
income to participate in the insurance
Write Zero if there is no
deduction
Are you a beneficiary or joint in the
health insurance or other medical
insurance
provider of health insurance
Who bears the value of health insurance premiums
Why are you not participating in any health insurance scheme
2 2 3
2 3
4
2 1
5
4
1
3 4 5 6 7 8
6
1 2
1 2
5 6
9
5 4
1 2 3
1
5 6
4 5
3
8
1
7
2 2
1 2

304 305 306 307 308 309 what the cause of your participation
in health insurance(main 2 causes )
full by My place of work obligatory
Partially by my place of work Provide Health care
Her/himself with small fees
Wife/husband Provide medication with small fees
Parents To avoid economic crisis
Brother/sister ( L.E ) ( L.E ) fully Yes For total coverage
Family member Partially No 310 others
Others (Go to next member )
1
2
3
4
5
6
7
8
9
10- 9 -
Who bears the value of health insurance premiums
How deduct from your monthly income to participate in the
insurance
Write Zero if there is
no deduction
How deduct from your place of work
Write Zero if there is no
deduction
Section 3
3012nd provider of health insurance
Do you benefit from
health insurance in the last 12
months
Hou
seho
ld m
embe
r num
ber How deduct
from your monthly
income to participate in the insurance
Health Insurance for (all Family Member)
2
3
4
5
6
1 1
5
6
4
3
8
7
2
1
2
2
1
1
2
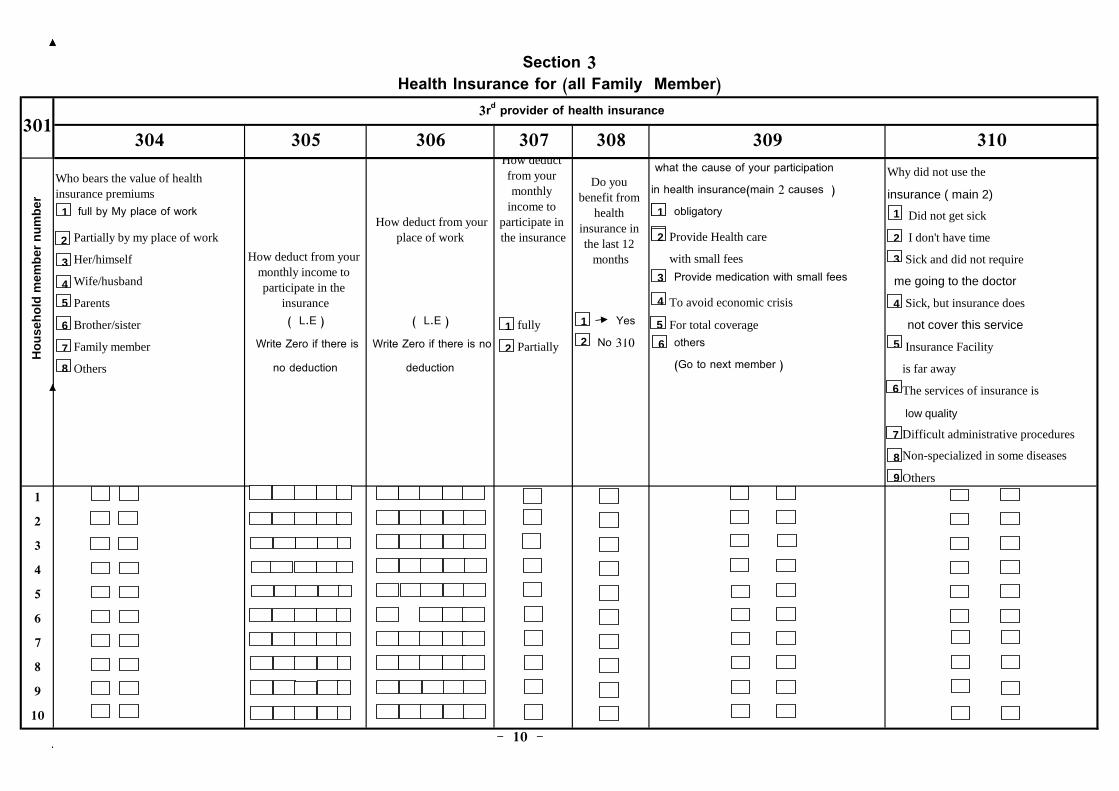
304 305 306 307 308 309 310 what the cause of your participation Why did not use the in health insurance(main 2 causes ) insurance ( main 2)
full by My place of work obligatory Did not get sick
Partially by my place of work Provide Health care I don't have time
Her/himself with small fees Sick and did not require
Wife/husband Provide medication with small fees me going to the doctor
Parents To avoid economic crisis Sick, but insurance does
Brother/sister ( L.E ) ( L.E ) fully Yes For total coverage not cover this service
Family member Partially No 310 others Insurance Facility
Others (Go to next member ) is far away
The services of insurance is
low quality
Difficult administrative procedures
Non-specialized in some diseases
Others1
2
3
4
5
6
7
8
9
10- 10 -
Health Insurance for (all Family Member)Section 3
Who bears the value of health insurance premiums
How deduct from your monthly income to participate in the
insurance
Write Zero if there is
no deduction
How deduct from your place of work
Write Zero if there is no
deduction
How deduct from your monthly
income to participate in the insurance
3013rd provider of health insurance
Do you benefit from
health insurance in the last 12
months
Hou
seho
ld m
embe
r num
ber
2
3
4
1
3
4
6
7
8
5
6
9
1
2
1
6
4 5
3
8
7
2
1
2
2
1
1
2 5

304 305 306 307 308 309 310what the cause of your participation in health insurance Why did not use the insurance ( main 2)( main 2 causes ) Did not get sick
( Main 3 provider ) full by My place of work obligatory I don't have time ( main 2 reason )
Partially by my place of work Provide Health care with small fees Sick and did not require me going to the doctor Not applicable HIO Her/himself Provide medication with small fees Sick, but insurance does not cover this service Has no financial ability Gov. Other than HIO Wife/husband To avoid economic crisis Insurance Facility is far away Prefer not to have Public sector Parents For total coverage The services of insurance is low quality Low quality of the insurance service Private Brother/sister ( L.E ) ( L.E ) fully Yes others Difficult administrative procedures Others Syndicates Family member Partially No 310 (Go to next member ) Non-specialized in some diseases
Yes Others Others Others No 311
11
12
13
14
15
16
17
18
19
20
- 11 -
How deduct from your place of work
Write Zero if there is no
deduction
Hou
seho
ld m
embe
r num
ber
How deduct from your monthly income to participate in the
insurance
Write Zero if there is no
deduction
Are you a beneficiary or a joint in the health
insurance or other
medical insurance
provider of health insurance
Who bears the value of health insurance premiums
Why are you not participating in any health insurance schemeDo you benefit
from health insurance in the last 12
months
Section 3Health Insurance for (all Family Member)
311301 302 303 1ST provider of health insurance
what type services
covered by Health
Insurance it caver
2 2 3
2 3
4
2 1
5
4
1
3 4 5 6 7 8
6
1 2
1 2
5 6
9
5 4
1 2 3
1
5 6
4 5
3
8
1
7
2 2
1 2
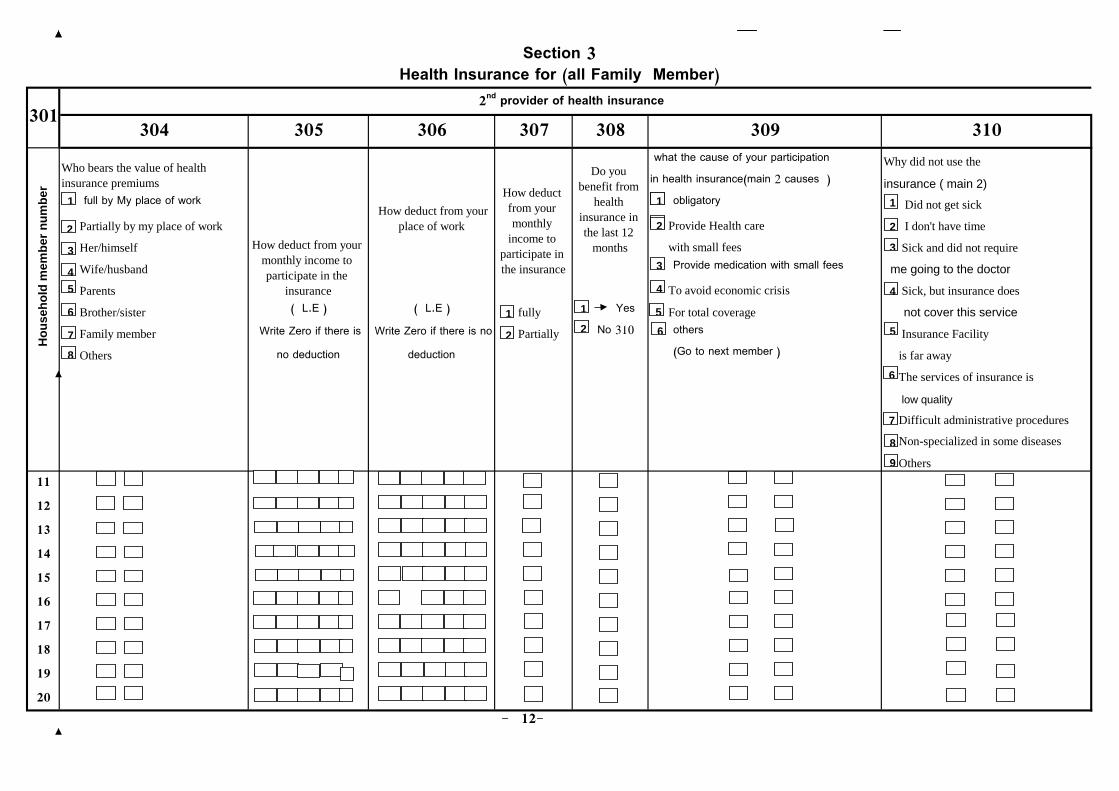
304 305 306 307 308 309 310 what the cause of your participation Why did not use the in health insurance(main 2 causes ) insurance ( main 2)
full by My place of work obligatory Did not get sick
Partially by my place of work Provide Health care I don't have time
Her/himself with small fees Sick and did not require
Wife/husband Provide medication with small fees me going to the doctor
Parents To avoid economic crisis Sick, but insurance does
Brother/sister ( L.E ) ( L.E ) fully Yes For total coverage not cover this service
Family member Partially No 310 others Insurance Facility
Others (Go to next member ) is far away
The services of insurance is
low quality
Difficult administrative procedures
Non-specialized in some diseases
Others11
12
13
14
15
16
17
18
19
20
- 12-
Section 3Health Insurance for (all Family Member)
Who bears the value of health insurance premiums
How deduct from your monthly income to participate in the
insurance
Write Zero if there is
no deduction
How deduct from your place of work
Write Zero if there is no
deduction
3012nd provider of health insurance
Do you benefit from
health insurance in the last 12
months
Hou
seho
ld m
embe
r num
ber How deduct
from your monthly
income to participate in the insurance
2
3
4
1
3
4
6
7
8
5
6
9
1
2
1
5
6
4
3
8
7
2
1
2
2
1
1
2 5

304 305 306 307 308 309 310 what the cause of your participation Why did not use the in health insurance(main 2 causes ) insurance ( main 2)
full by My place of work obligatory Did not get sick
Partially by my place of work Provide Health care I don't have time
Her/himself with small fees Sick and did not require
Wife/husband Provide medication with small fees me going to the doctor
Parents To avoid economic crisis Sick, but insurance does
Brother/sister ( L.E ) ( L.E ) fully Yes For total coverage not cover this service
Family member Partially No 310 others Insurance Facility
Others (Go to next member ) is far away
The services of insurance is
low quality
Difficult administrative procedures
Non-specialized in some diseases
Others11
12
13
14
15
16
17
18
19
20- 13 -
Section 3Health Insurance for (all Family Member)
Who bears the value of health insurance premiums
How deduct from your monthly income to participate in the
insurance
Write Zero if there is
no deduction
How deduct from your place of work
Write Zero if there is no
deduction
How deduct from your monthly
income to participate in the insurance
3013rd provider of health insurance
Do you benefit from
health insurance in the last 12
months
Hou
seho
ld m
embe
r num
ber
2
3
4
1
3
4
6
7
8
5
6
9
1
2
1
6
4 5
3
8
7
2
1
2
2
1
1
2 5

401 402 403 404 405 406 407 408 409 410Hospital AdmissionQuestionnaire
I though it is a simple problem
Where was your treatmenthigh cost in hospital Was not sickfar distance Outpatient cliniclow health services quality ER has no ability to move Inpatient ward Do not have enough moneylong waiting period in a previous visit (fill Hos. Admtn. Questionnaire) Facility is far away
Yes 407 family responsibilities Do not have time No 408 use traditional treatment without consultation others ( mention)
Yes Yes Yes need but use medical treatment without consultation Yes Yes No No No I didn't go 406 others ( mention) No No
1
2
3
4
5
6
7
8
9
10
Section 4 Surveyed Family Members
Non-Chronic
did ( … ) suffer
from non-chronic disease? Through the last 4
weeks
Chronic Questionn
Dental Questionnai
Preventive care
Questionnaire
did ( ….) suffer from a chronic
disease in the last 4
weeks
Is anyone suffer from toothache in the last 12 months
did your health conditions require
going to the hospital in the last 12 months
- 14 -
Hous
ehol
d m
embe
r num
ber
Did you get a
preventive consultatio
n in the last 24 months
Why did not questionnaire apply to you…
Do not know about the preventive consultation
why didn't you go to the hospital though
you need so
Treatment Abroad
Questionnair
Did you get a treatment abroad in the last 24
months
1 2
1 2
1 1 2
3 3
3
1 2
1
2 3 4 5 6 7 8 9 10
4 3
6 5
1 1 2
1 1 2
1 1 2
1 2 1

401 402 403 404 405 406 407 408 409 410Hospital AdmissionQuestionnaire
I though it is a simple problem
Where was your treatmenthigh cost in hospital Was not sickfar distance Outpatient cliniclow health services quality ER has no ability to move Inpatient ward Do not have enough moneylong waiting period in a previous visit (fill Hos. Admtn. Questionnaire) Facility is far away
Yes 407 family responsibilities Do not have time No 408 use traditional treatment without consultation others ( mention)
Yes Yes Yes need but use medical treatment without consultation Yes Yes No No No I didn't go 406 others ( mention) No No
11
12
13
14
15
16
17
18
19
20
- 15 -
Hous
ehol
d m
embe
r num
ber
Did you get a
preventive consultatio
n in the last 24 months
Why did not questionnaire apply to you…
Do not know about the preventive consultation
why didn't you go to the hospital though
you need so
Treatment Abroad
Questionnair
Did you get a treatment abroad in the last 24
months
Section 4 Surveyed Family Members
Non-Chronic
did ( … ) suffer
from non-chronic disease? Through the last 4
weeks
Chronic Questionn
Dental Questionnai
Preventive care
Questionnaire
did ( ….) suffer from a chronic
disease in the last 4
weeks
Is anyone suffer from toothache in the last 12 months
did your health conditions require
going to the hospital in the last 12 months
1 2
1 2
1 1 2
3 3
3
1 2
1
2 3 4 5 6 7 8 9 10
4 3
6 5
1 1 2
1 1 2
1 1 2
1 2 1
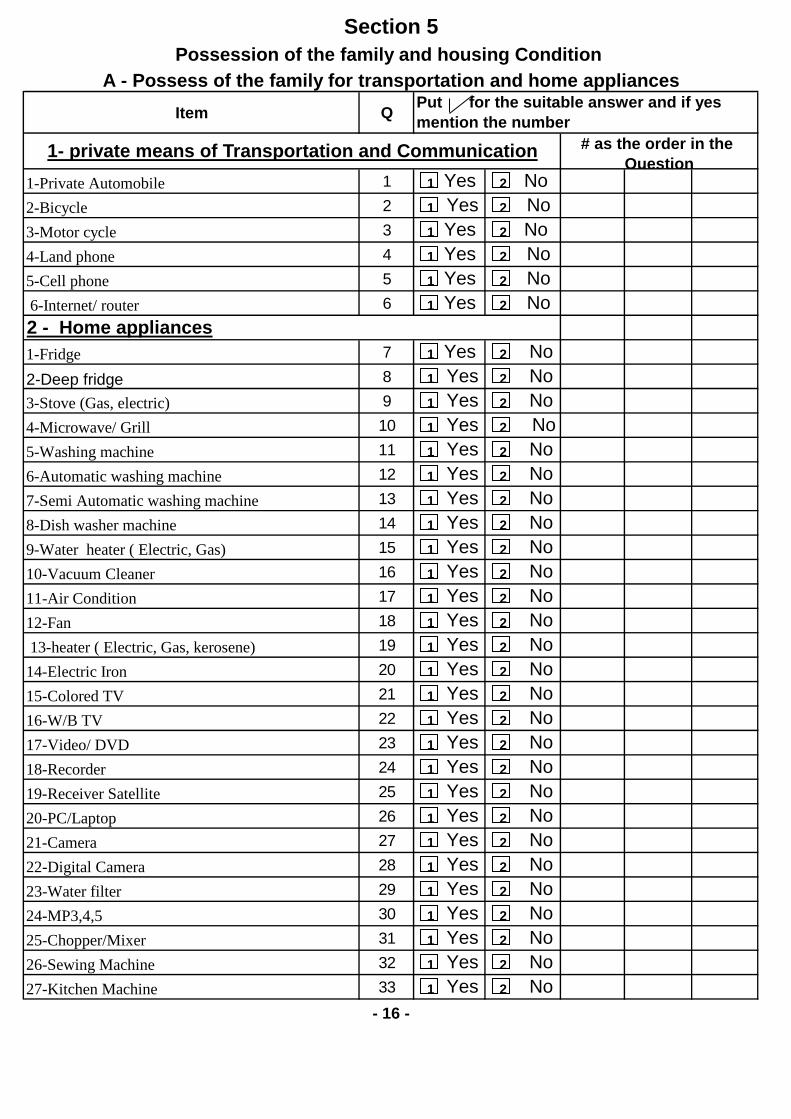
Item Q
1-Private Automobile 1 Yes No2-Bicycle 2 Yes No3-Motor cycle 3 Yes No4-Land phone 4 Yes No5-Cell phone 5 Yes No 6-Internet/ router 6 Yes No
1-Fridge 7 Yes No2-Deep fridge 8 Yes No3-Stove (Gas, electric) 9 Yes No4-Microwave/ Grill 10 Yes No5-Washing machine 11 Yes No6-Automatic washing machine 12 Yes No7-Semi Automatic washing machine 13 Yes No8-Dish washer machine 14 Yes No9-Water heater ( Electric, Gas) 15 Yes No10-Vacuum Cleaner 16 Yes No11-Air Condition 17 Yes No12-Fan 18 Yes No 13-heater ( Electric, Gas, kerosene) 19 Yes No14-Electric Iron 20 Yes No15-Colored TV 21 Yes No16-W/B TV 22 Yes No17-Video/ DVD 23 Yes No18-Recorder 24 Yes No19-Receiver Satellite 25 Yes No20-PC/Laptop 26 Yes No21-Camera 27 Yes No22-Digital Camera 28 Yes No23-Water filter 29 Yes No24-MP3,4,5 30 Yes No25-Chopper/Mixer 31 Yes No26-Sewing Machine 32 Yes No27-Kitchen Machine 33 Yes No
- 16 -
Put for the suitable answer and if yes mention the number
Section 5
# as the order in the Question
Possession of the family and housing Condition A - Possess of the family for transportation and home appliances
1- private means of Transportation and Communication
2 - Home appliances
2 1
2 1
2 1
2 1
2 1
2 1
2 1
2 1
2 1
2 1
2 1
2
2 1 2 1
2 1
2 1
2 1
2 1
2 1
2 1
2 1
2 1
2 1 2 1
2 1
2 1
2 1
2 1
2 1 2 1
2 1
2 1
2 1
2 1
2 1
2 1
2 1
2 1
2 1
2 1
2 1
2 1 2 1 2 1 2 1
2 1 2 1
2 1 2 1
2 1 2 1
2 1 2 1
2 2
2 1 2 1
2 1 2 1
2 1 2 1
2 1 2 1
2 1 2 1
2 1 2 1
2 1 2 1
2 1 2 1
2 1 2 1
2 1 2 1
2 1 2 1
2 1 2 1
2 1 2 1
2 1 2 1
2 1 2 1
2 1 2 1
2 1 2 1
2 1 2 1
2 1 2 1 2 1 2 1 2 1
2 1 2 1 2 1 2 1 2 1
2 1 2 1 2 1 2 1 2 1
2 1 2 1 2 1 2 1 2 1
2 2 2 2
2 1 2 1 2 1 2 1 2 1
2 1 2 1 2 1 2 1 2 1
2 1 2 1 2 1 2 1 2 1
2 1 2 1 2 1 2 1 2 1
2 1 2 1 2 1 2 1 2 1
2 1 2 1 2 1 2 1 2 1
2 1 2 1 2 1 2 1 2 1
2 1 2 1 2 1 2 1 2 1
2 1 2 1 2 1 2 1 2 1
2 1 2 1 2 1 2 1 2 1
2 1 2 1 2 1 2 1 2 1
2 1 2 1 2 1 2 1 2 1
2 1 2 1 2 1 2 1 2 1
2 1 2 1 2 1 2 1 2 1
2 1 2 1 2 1 2 1 2 1
2 1 2 1 2 1 2 1 2 1
2 1 2 1 2 1 2 1 2 1
2 1 2 1 2 1 2 1 2 1
2 1 2 1 2 1 2 1 2 1 2 1 2 1 2 1
2 2 2 2 2 2 2 2
2 2 2 2 2 2 2 2
2 2 2 2 2 2 2 2
2 2 2 2 2 2 2 2
2 2 2 2 2 2 2 2
2 2 2 2 2 2 2 2
2 2 2 2 2 2 2 2
2 2 2 2 2 2 2 2
2 2 2 2 2 2 2 2
2 2 2 2 2 2 2 2
2 2 2 2 2 2 2 2
2 2 2 2 2 2 2 2
2 2 2 2 2 2 2 2
2 2 2 2 2 2 2 2
2 2 2 2 2 2 2 2
2 2 2 2 2 2 2 2
2 2 2 2 2 2 2 2 2 2 2 2 2 2 2
2 2 2 2 2 2 2 2 2 2 2 2 2 2 2
2 2 2 2 2 2 2 2 2 2 2 2 2 2 2
2 2 2 2 2 2 2 2 2 2 2 2 2 2 2
2 2 2 2 2 2 2 2 2 2 2 2 2 2 2
2 2 2 2 2 2 2 2 2 2 2 2 2 2 2
2 2 2 2 2 2 2 2 2 2 2 2 2 2 2
2 2 2 2 2 2 2 2 2 2 2 2 2 2 2
2 2 2 2 2 2 2 2 2 2 2 2 2 2 2
2 2 2 2 2 2 2 2 2 2 2 2 2 2 2
2 2 2 2 2 2 2 2 2 2 2 2 2 2 2
2 2 2 2 2 2 2 2 2 2 2 2 2 2 2
2 2 2 2 2 2 2 2 2 2 2 2 2 2 2
2 2 2 2 2 2 2 2 2 2 2 2 2 2 2
2 2 2 2 2 2 2 2 2 2 2 2 2 2 2
2 2 2 2 2 2 2 2 2 2 2 2 2 2 2
2 2 2 2 2 2 2 2 2 2 2 2 2 2 2
2 2 2 2 2 2 2 2 2 2 2 2 2 2 2
2 2 2 2 2 2 2 2 2 2 2 2 2 2 2
2 2 2 2 2 2 2 2 2 2 2 2 2 2 2
2 2 2 2 2 2 2 2 2 2 2 2 2 2 2
1 1 1 1 1 1 1 1
1 1 1 1 1 1 1 1
1 1 1 1 1 1 1 1
1 1 1 1 1 1 1 1
1 1 1 1 1 1 1 1
1 1 1 1 1 1 1 1
1 1 1 1 1 1 1 1
1 1 1 1 1 1 1 1
1 1 1 1 1 1 1 1
1 1 1 1 1 1 1 1
1 1 1 1 1 1 1 1
1 1 1 1 1 1 1 1
1 1 1 1 1 1 1 1
1 1 1 1 1 1 1 1
1 1 1 1 1 1 1 1
1 1 1 1 1 1 1 1
1 1 1 1 1 1 1 1
1 1 1 1 1 1 1 1
1 1 1 1 1 1 1 1
1 1 1 1 1 1 1 1
1 1 1 1 1 1 1 1

n 501 502 503 504 505 506 507
CawSheep Cattle Horses donkey Camels Poultry
Yes Yes Yes Yes Yes Yes Yes 1 Go to 502 No No No No No No No
What is the area of this land zero zero zero zero zero zero( 1 - 5 ) ( 1- 5 ) ( 1 - 5 ) ( 1 - 3) ( 1 - 3) ( 1 - 10 )
2 ( 6 -20) ( 6 - 20 ) ( 6 - 20 ) More than 4 More than 4 ( 11 - 20 ) ( 21 -50 ) ( 21 -50 ) ( 21 -50 ) I don’t Know I don’t Know ( 21 -50 ) (100-51) (100-51) (100-51) (100-51)
More than 100 More than 100 More than 100 More than 100
I don’t Know I don’t Know I don’t Know I don’t Know
Section 5
- 17 -
B - Possess of the family for Lands, animals and birds
Does the family possess of any the following animals or birds
How many
Do any member of the family possess a land that could be used in agriculture or
pasture or hunting
2
1
2
1
2
1
2
1
2
1
2
1
2
1
3
2
2
4
7
6
3
2
2
4
7
6
3
2
2
4
7
6
3
2
4
3
2
4
3
2
5
4
7
6
1 1 1 1 1 1
2
1
2
1
2
1
2
1
2
1
1 1 1 1 1
6 6 6

Item
Flat More than one flat Villa
2- # of rooms 3- Area of the house
Old Rent New Rent Owned
Sale Gift/ grant Others
5-Source of water Public pump Well Others
7- sanitation public Private reservoir other non
8- Main lighting source Electricity Kerosene Others
Gas Natural Gas Kerosene Electricity
Bricks and Cement Concert Muddy bricks
Wood Metal Flake Others
11- Kitchen Private No kitchen
12-Separate bathroom Private No
With Siphon Private No
Without Siphon Private No
With Siphon Private No
Without Siphon Private No
scavenger Company Throw it into the street
Others
bricks
Possession of the family and housing Condition of the FamilyC - Housing Condition
No connection 6-Connection with the source of water
Gas
By square meter
Condo
1-Type of the house
Joint, not private
10- Walls of the house
14-WC Joint, not private
Tap inside the building
Joint, not private
Joint, not private
Asbestos
Joint, not private
- 18-
Wood Other
Throw it into the trash bin 15-Waste disposal
9-Main foul using for cooking
13-Bathroom with WC
Joint, not private
Section 5
Tap inside the residence
Feature in-kind 4-Possession of the house
Put for the suitable answer
Farm house
Private room or more One or more rooms in a housing unit
Furniture rent
5
1 2 4
6
3
7
5
1 2 4
8
3
1
6 7
2 3 4
1 2
3
1 2 3 5 4
1 2 3 4
1 2 3 5
5
1
6
2
5 6
3 4
7 8
1 2 3
1 2 3
1 2 3
1 2 3
1 2 3
1 2 3
1 2 3 4
5

Last month Last year
What is the value of household expenditure on the following item:
1 Food & Drink
2 Alcohol
3 Cigarettes
4 Clothes, Socks
5Housing and its requirements including the renovation and maintenance
6 Furniture, Equipments and Purchase durable goods and maintenance
7 Services and healthcare
8 Transportation
9 Communication
10 Culture and entertainment including excursions and Resorts
11 Education, including tuition and private lessons
12 Restaurants, cafe and hotels
13Miscellaneous goods and services, including spent on weddings
or funerals
Total Annual Expenditure
14
Section 6General Expenditure Items
- 19 -
Total expenditure (L.E )ItemsSno
Transfer payments (gifts - Dowry - Gold - Traffic Infractions - Payments to non-family members).

Yes No Next Section did any persons died during the last 12months,
701 702 704 705 706 707 708 709 710 711Cause of death
Medical Services Medical Services
in OPD in Inpatient Exam & Lab Medicine Others Total
Days Months Years Chronic disease ward X-Ray …Transportation )
Husband/Wife Non-chronic disease
Son/daughter Accident
Daughter's husband/ Son’s wife
Antenatal and prenatal
Yes
Father/Mother; Destiny No Grand: son/daughter Others Go to
Sister, Brother Next Other relatives
No-relationship L.E L.E L.E L.E L.E L.E
80
Section 7Deaths and spent on health care before death
703Total amount that was paid to ( during last 12 months before death)
- 20 -
Mem
ber line
What is the age of the deceased at deathWhat is the relationship HH
head in Hospital or private
clinic
For persons who died during the last four weeks, Is he receive any health care
start )
from
1 2 3
4 5 6
7
8
1
2 3 4
5 6
1
2
1 2

Yes No
801 802 803 804Who paid the cost
FamilyGovernment
PublicPrivate
HIONGO
Syndicate Friends/ Relative
OthersL.E payer
1st 2nd 3rd1 Sphygmomanometer2 Gluco-meter3 Medical mattress4 Vision equity correction5 Audio correction (ear piece)6 Assistance to breathe7 Assistance to walk8 Assistance to move (Wheel Chair)9 Tools of the hemodialysis10 Orthopedic device11 Others
Total
expenditure
2nd payer
805
Did any of the household member ( including the deaths) obtain any medicaltools or instrument during last 12 months
- 21 -
Section 8The Expenditure on supplies and medical devices
3rd payern
Type of medical device # Total in L.E
1st payer
Go to Section 9
1 2 3 4 5 6 7 8 9
1 2

901 902
Yes
( main 3 sources) No Go to Next
In case of Yes, how did you deal with the problem( main 3 action )
Family I bought a part of the treatments (not complete treatment)Government Worked additional work or increase the period of the additional work
Public Reduced spending on the remaining items Private Used family savings (cash)
HIO I sold some of the family propertiesNGOs The amount borrowed
Syndicate I received a charitable donations or assistance from the Zakat ChamberFriends/ Relative Obtained the assistance of relatives or acquaintances from within or outside Egypt
Others I received a free treatment Others
Section 9
Adaptation strategy with the costs of health care
- 22 -
Was there any burden on the family income due to the health care during the last 12 monthsWhat are the sources of supply for the medical treatment of members
of your family during the last 12 month1
2
1
2
3
4
5
6
7
8
9
1
2
3
4
5
6
7
8
9
10
1
131
2- NON-CHRONIC DISEASES QUESTIONNAIRE


Governorate:
Kism / Markaz
First Visit
Second Visit
Third Visit
Result code
Second : Visit Data
Visit No. Visit dateVisit time
Visit result
Arab Republic of Egypt
And StatisticsCentral Agency for Public Mobilization
Ministry of Health
Publication or Quotation is
Segment no.
to the sourceProhibited without referring
Household number within governorate Household number within shieaka / village
Household number within the frame
Household member number :
District no. / building owner name
First : Identification data :
shiakha / city / village
Road name / Block number
Patient name :
5- Other (mention)……..
Urban / Rural
1- completed
2- Patient wasn't in house
3- Refused.
4-Unable or Ineligible
Non-Chronic Diseases Questionnaire
Household Health Services Utilization And Expenditure Survey
2009/2010
( 2 )

NO. Question
101 Number of diseases suffered during the last No major 3 diseases 1-
4 weeks 2 -
3 -
First Disease :102 Type of the disease : 1- Gastroenteritis ;
2- Fever;
3- Hepatitis;
4- Typhoid;
5- Respiratory diseases;
6- Measles/Rubella;
7- Abscesses (minor surgeries);
8- Contusions;
9- Eye problems(included Zvis);
10-Orthopedic diseases
11- Common Cold
12- Others (mention) …..
103 Was this patient able to do his usual practice
in the presence of the disease ? 1- yes move to (105)
2 - No
104 How many days patient could not exercise his
activity during the last four weeks?
105 Did the patient make any visit in order to treat this 1- yes move to (107)
disease during the last four weeks? 2 - No
106 What is the main reason for not getting treatment 1 - I think that the problem is simple;
of this disease ? 2- High cost;
3- Far Distance;
4 - Low Quality;
5- Has not physical Ability to go;
6 - Long waiting time of the previous visit;
7 - Family Responsibilities;
8 - Use traditional treatments without consultation;
9 - Use medical treatments without consultation;
10- Other (mention) ……...
107 How many visits made by the patient during the
last four weeks for this disease ?
First visit second visit Third visit
108 Where did the patient go for treatment ? 1- MOH Hospitals
2- MOH primary healthcare facilities
3- One day surgery hospitals(MOH)
Answers selections
- 1 -

4- Specialized Medical centers; First visit second visit Third visit
5- Family planning and MCH;
6- HIO Hospitals and outpatient clinics;
7 - Other Governmental Hospitals(Military,
police, Electricity, etc.;
8 - CCO. ;
9 - University Hospitals;
10 - Teaching Hospitals;
11 - Private Hospitals;
12 - Private clinics;
13 - Mosque/Church;
14 - Polyclinic;
15 - Pharmacies;
16 - Others (mention) ………
109 Who provide you with the health service ? 1 - Specialist, Consultant; First visit second visit Third visit
2 - Family Physician, General Practitioner,
3 - Assistant Nurse;
4 - Nurse;
5 - Physiotherapy technician;
6 - Traditional Healer;
7 - Other;(mention) ……
110 How far is the institution from your house? In KM Km Km Km
111 What is the main means of transportation used to move ? 1- Walking;
2 - Private car;
3 - Public vehicle;
4- Taxi;
5 - Bicycle;
6 - Motor cycle;
7- Cart;
8 -Animal;
9 -Ambulance;
10 - Airplane;
11 - Other (mention)….
112 How much time to get to this institution ? In minutesminute minute minute
113 Did you bear any expenses incurred to move or get 1 - yes
health service from your income or family income ? 2 - No. 126
114 Cost of transporting the patient to and from the In L.E
healthcare place ( in L.E. )
- 2 -
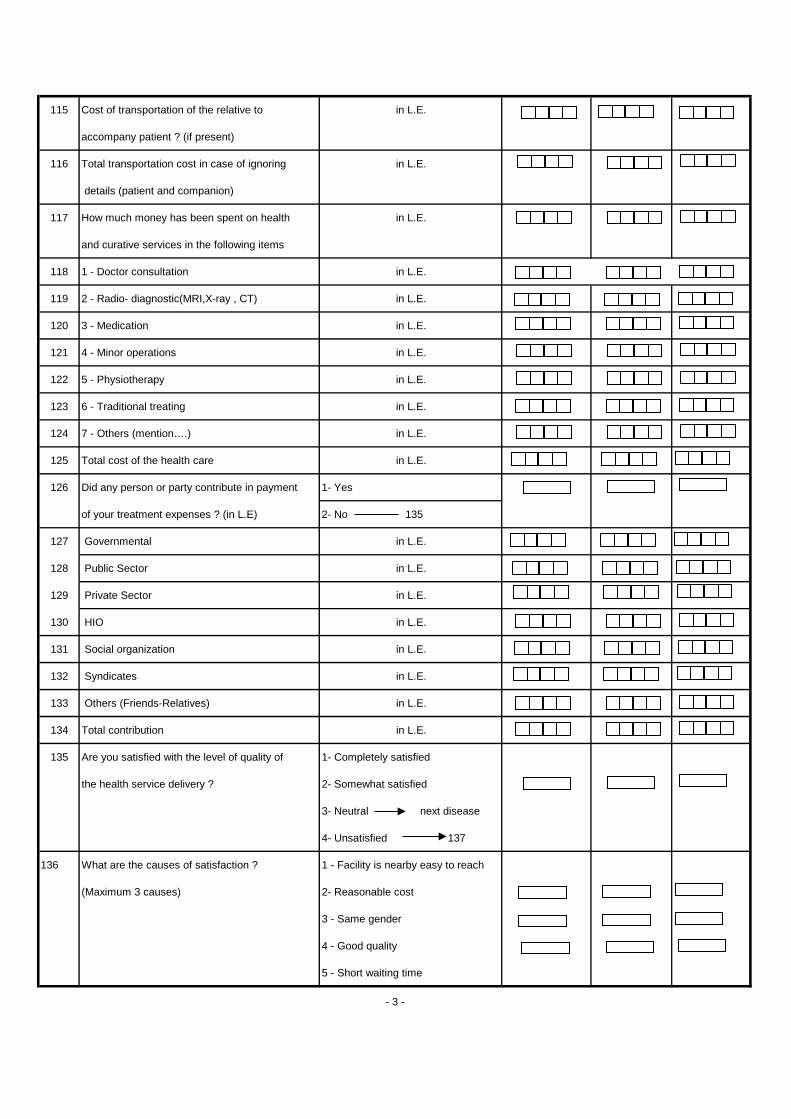
115 Cost of transportation of the relative to in L.E.
accompany patient ? (if present)
116 Total transportation cost in case of ignoring in L.E.
details (patient and companion)
117 How much money has been spent on health in L.E.
and curative services in the following items
118 1 - Doctor consultation in L.E.
119 2 - Radio- diagnostic(MRI,X-ray , CT) in L.E.
120 3 - Medication in L.E.
121 4 - Minor operations in L.E.
122 5 - Physiotherapy in L.E.
123 6 - Traditional treating in L.E.
124 7 - Others (mention….) in L.E.
125 Total cost of the health care in L.E.
126 Did any person or party contribute in payment 1- Yes
of your treatment expenses ? (in L.E) 2- No 135
127 Governmental in L.E.
128 Public Sector in L.E.
129 Private Sector in L.E.
130 HIO in L.E.
131 Social organization in L.E.
132 Syndicates in L.E.
133 Others (Friends-Relatives) in L.E.
134 Total contribution in L.E.
135 Are you satisfied with the level of quality of 1- Completely satisfied
the health service delivery ? 2- Somewhat satisfied
3- Neutral next disease
4- Unsatisfied 137
136 What are the causes of satisfaction ? 1 - Facility is nearby easy to reach
(Maximum 3 causes) 2- Reasonable cost
3 - Same gender
4 - Good quality
5 - Short waiting time
- 3 -

6 - Good communication skills ;
7 - Clean places ;
8- Others (mention) …...
137 What are the causes of dissatisfaction ? 1 - High cost of the consultation fees;
(Maximum 3 causes) 2 - High cost of the medication ;
3 - High cost of the lab. Investigation ;
4 - Difficult administrative process;
5 - Low Quality;
6 - Far away and difficulty to reach;
7 - Long waiting time;
8 - Consultation days is inappropriate ;
9 - Dirty place ;
10 - No providers;
11 - No same gender provider;
12 - Others (mention) ……
- 4 -

NO. Question
Second Disease :138 Type of the disease : 1- Gastroenteritis ;
2- Fever;
3- Hepatitis;
4- Typhoid;
5- Respiratory diseases;
6- Measles/Rubella;
7- Abscesses (minor surgeries);
8- Contusions;
9- Eye problems(included Zvis);
10- Others (mention) …..
139 Did the patient make any visit in order to treat this 1- yes move to (141)
disease during the last four weeks? 2 - No
140 What is the main reason for not getting treatment 1 - I think that the problem is simple;
of this disease ? 2- High cost;
3- Far Distance;
4 - Low Quality;
5- Has not physical Ability to go;
6 - Long waiting time of the previous visit;
7 - Family Responsibilities;
8 - Use traditional treatments without consultation;
9 - Use medical treatments without consultation;
10 - Other (mention) ……...
141 How many visits made by the patient during the
last four weeks for this disease ?
First visit second visit Third visit
142 Where did the patient go for treatment ? 1- MOH Hospitals
2- MOH primary healthcare facilities
3- One day surgery hospitals(MOH)
Answers selections
- 5 -

4- Specialized Medical centers; First visit second visit Third visit
5- Family planning and MCH;
6- HIO Hospitals and outpatient clinics;
7 - Other Governmental Hospitals(Military,
police, Electricity, etc.;
8 - CCO. ;
9 - University Hospitals;
10 - Teaching Hospitals;
11 - Private Hospitals;
12 - Private clinics;
13 - Mosque/Church;
14 - Polyclinic;
15 - Pharmacies;
16 - Others (mention) ………
143 Who provide you with the health service ? 1 - Specialist, Consultant; First visit second visit Third visit
2 - Family Physician, General Practitioner,
3 - Assistant Nurse;
4 - Nurse;
5 - Physiotherapy technician;
6 - Traditional Healer;
7 - Other;(mention) ……
144 How far is the institution from your house? In KM Km Km Km
145 What is the main means of transportation used to move ? 1- Walking;
2 - Private car;
3 - Public vehicle;
4- Taxi;
5 - Bicycle;
6 - Motor cycle;
7- Car;
8 -Animal;
9 -Ambulance;
10 - Airplane;
11 - Other (mention)….
146 How much time to get to this institution ? In minutesminute minute minute
147 Did you bear any expenses incurred to move or get 1 - yes
health service from your income or family income ? 2 - No. 160
148 Cost of transporting the patient to and from the
healthcare place ( in L.E. ) In L.E
- 6 -

149 Cost of transportation of the relative to in L.E.
accompany patient ? (if present)
150 Total transportation cost in case of ignoring in L.E.
details (patient and companion)
151 How much money has been spent on health in L.E.
and curative services in the following items
152 1 - Doctor consultation in L.E.
153 2 - Radio- diagnostic(MRI,X-ray , CT) in L.E.
154 3 - Medication in L.E.
155 4 - Minor operations in L.E.
156 5 - Physiotherapy in L.E.
157 6 - Traditional treating in L.E.
158 7 - Others (mention….) in L.E.
159 Total cost of the healthcare in L.E.
160 Did any person or party contribute in payment 1- Yes
of your treatment expenses ? (in L.E) 2- No 169
161 1 - Governmental in L.E.
162 2 - Public Sector in L.E.
163 3 - Private Sector in L.E.
164 4 - HIO in L.E.
165 6 - Social organization in L.E.
166 7 - Syndicates in L.E.
167 8 - Others (Friends-Relatives) in L.E.
168 Total contribution in L.E.
169 Are you satisfied with the level of quality of 1- Completely satisfied
the health service delivery ? 2- Somewhat satisfied
3- Neutral next disease
4- Unsatisfied 171
170 What are the causes of satisfaction ? 1 - Facility is nearby easy to reach
(Maximum 3 causes) 2- Reasonable cost
3 - Same gender
4 - Good quality
5 - Short waiting time
- 7 -

6 - Good communication skills ;
7 - Clean places ;
8- Others (mention) …...
171 What are the causes of dissatisfaction ? 1 - High cost of the consultation fees;
(Maximum 3 causes) 2 - High cost of the medication ;
3 - High cost of the lab. Investigation ;
4 - Difficult administrative process;
5 - Low Quality;
6 - Far away and difficulty to reach;
7 - Long waiting time;
8 - Consultation days is inappropriate ;
9 - Dirty place ;
10 - No providers;
11 - No same gender provider;
12 - Others (mention) ……
- 8 -

NO. Question
Third Disease :172 Type of third disease : 1- Gastroenteritis ;
2- Fever;
3- Hepatitis;
4- Typhoid;
5- Respiratory diseases;
6- Measles/Rubella;
7- Abscesses (minor surgeries);
8- Contusions;
9- Eye problems(included Zvis);
10- Others (mention) …..
173 Did the patient make any visit in order to treat this 1- yes move to (175)
disease during the last four weeks? 2 - No
174 What is the main reason for not getting treatment 1 - I think that the problem is simple;
of this disease ? 2- High cost;
3- Far Distance;
4 - Low Quality;
5- Has not physical Ability to go;
6 - Long waiting time of the previous visit;
7 - Family Responsibilities;
8 - Use traditional treatments without consultation;
9 - Use medical treatments without consultation;
10- Other (mention) ……...
175 How many visits made by the patient during the
last four weeks for this disease ?
First visit second visit Third visit
176 Where did the patient go for treatment ? 1- MOH Hospitals
2- MOH primary healthcare facilities
3- One day surgery hospitals(MOH)
Answers selections
- 9 -

4- Specialized Medical centers; First visit second visit Third visit
5- Family planning and MCH;
6- HIO Hospitals and outpatient clinics;
7 - Other Governmental Hospitals(Military,
police, Electricity, etc.;
8 - CCO. ;
9 - University Hospitals;
10 - Teaching Hospitals;
11 - Private Hospitals;
12 - Private clinics;
13 - Mosque/Church;
14 - Polyclinic;
15 - Pharmacies;
16 - Others (mention) ………
177 Who provide you with the health service ? 1 - Specialist, Consultant; First visit second visit Third visit
2 - Family Physician, General Practitioner,
3 - Assistant Nurse;
4 - Nurse;
5 - Physiotherapy technician;
6 - Traditional Healer;
7 - Other;(mention) ……
178 How far is the institution from your house? In KM Km Km Km
179 What is the main means of transportation used to move ? 1- Walking;
2 - Private car;
3 - Public vehicle;
4- Taxi;
5 - Bicycle;
6 - Motor cycle;
7- Cart;
8 -Animal;
9 -Ambulance;
10 - Airplane;
11 - Other (mention)….
180 How much time to get to this institution ? In minutesminute minute minute
181 Did you bear any expenses incurred to move or get 1 - yes
health service from your income or family income ? 2 - No. 194
182 Cost of transporting the patient to and from the in L.E
healthcare place ( in L.E. )
- 10 -

183 Cost of transportation of the relative to in L.E.
accompany patient ? (if present)
184 Total transportation cost in case of ignoring in L.E.
details (patient and companion)
185 How much money has been spent on health in L.E.
and curative services in the following items
186 1 - Doctor consultation in L.E.
187 2 - Radio- diagnostic(MRI,X-ray , CT) in L.E.
188 3 - Medication in L.E.
189 4 - Minor operations in L.E.
190 5 - Physiotherapy in L.E.
191 6 - Traditional treating in L.E.
192 7 - Others (mention….) in L.E.
193 Total cost of the health care in L.E.
194 Did any person or party contribute in payment 1- Yes
of your treatment expenses ? (in L.E) 2- No 203
195 1 - Governmental in L.E.
196 2 - Public Sector in L.E.
197 3 - Private Sector in L.E.
198 4 - HIO in L.E.
199 6 - Social organization in L.E.
200 7 - Syndicates in L.E.
201 8 - Others (Friends-Relatives) in L.E.
202 Total contribution in L.E.
203 Are you satisfied with the level of quality of 1- Completely satisfied
the health service delivery ? 2- Somewhat satisfied
3- Neutral next disease
4- Unsatisfied 206
204 What are the causes of satisfaction ? 1 - Facility is nearby easy to reach
(Maximum 3 causes) 2- Reasonable cost
3 - Same gender
4 - Good quality
5 - Short waiting time
- 11 -

6 - Good communication skills ;
7 - Clean places ;
8- Others (mention) …...
205 What are the causes of dissatisfaction ? 1 - High cost of the consultation fees;
(Maximum 3 causes) 2 - High cost of the medication ;
3 - High cost of the lab. Investigation ;
4 - Difficult administrative process;
5 - Low Quality;
6 - Far away and difficulty to reach;
7 - Long waiting time;
8 - Consultation days is inappropriate ;
9 - Dirty place ;
10 - No providers;
11 - No same sex provider;
12 - Others (mention) ……
206 Is there any other health institution 1- yes 207
nearer to your home ? 2- No (finish the questionnaire)
207 Why didn't you go there? 1- High cost
2- Difficult administrative process
3- Low quality
4- Long waiting time
5- Consultation days is inappropriate
6 - Dirty place
11 - No same gender provider;
8- Others(Mentions…)
- 12 -

147
3- CHRONIC DISEASES QUESTIONNAIRE


Governorate:
Kism / Markaz
First Visit
Second Visit
Third Visit
Result code
Second : Visit Data
Visit No. Visit dateVisit time
Visit result
Ministry of Health
Publication or Quotation isProhibited without referring
Arab Republic of Egypt
And StatisticsCentral Agency for Public Mobilization
Urban / Rural
Segment no.
to the source
First : Identification data :
shiakha / city / village
Road name / Block number
Patient name : Household member number :
District no. / building owner name
3- Refused.
4-Unable or Ineligible
5- Other (mention)……..
Household number within governorate Household number within shieaka / village
Household number within the frame
1- completed
2- Patient wasn't in house
Chronic Diseases Questionnaire
Household Health Services Utilization And Expenditure Survey
2009/2010
( 3 )

2
Survey the use of pre
Answer Selection car
Question SN
1- Number of diseases suffered during the last 4 weeks 101
2-
# 3-
1st Disease
1- Hypertension; Type Of Disease: 102
2- Hyperglycemia
3- Rheumatic diseases;
4- Renal diseases (Renal Failure);
5- Cardiac diseases;
6- TB;;
7- Asthma;
8- Cancer;
9- Mantel diseases;
10- Malnutrition;
11- Others (Mention…).
1-Yes 105
2-No
Was person able to do
his usual practice in the
presence of the disease?
103
How many days the
patient could not do his
activities during the last
four weeks?
104
1-Yes 107
2-No
Did the patient make
any visit to in order to
treat this disease during
the last four weeks?
105
1-I think that the problem is simple;
What is the main reason
of not to getting a
treatment for this
disease?
106
2- High cost;
3- Far Distance;
4- Low Quality;
5- Has not physical Ability to go;
6- Long waiting time of the previous
visit;
7- Family Responsibilities;
8- Use traditional treatments without
consultation;
9- Use medical treatments without
consultation;
10- Other (Mention…).
3 Major diseases

3
How many visits made
by the patient during
the last four weeks for
treatment of this
disease?
107
3rd
visit 2nd
visit 1st visit 1- MOH Hospitals;
Where did he go? 108
2- MOH primary healthcare facilities
3- One day surgery hospitals(MOH)
4- Specialized Medical Centers;
5- Family planning and MCH;
6- HIO Hospitals and outpatient
clinics;
7- Other Governmental Hospitals
(Military, Police, Electricity, Etc.;
8- CCO;
9- University Hospitals;
10- Teaching Hospitals;
11- Private Hospitals;
12- Private Clinics;
13- Mosque/Church;
14- Polyclinic;
15- Pharmacies;
16- Others (Mention…)..
1- Specialist, Consultant; Who provide you with
the health service?
109
2- Family Physician, General
Practitioner;
3- Assistant Nurse;
4- Nurse;
5- Physiotherapy technician;
6- Traditional Healer;
7- Other (Mention…)..
KM How far the institution
from your house?
110
1- Walking; What is the main mean
of transportation used?
111 2- Private car;
3- Public vehicle;
4- Taxi;
5- Bicycle;
6- Motor cycle;
7- Cart(Caro).
8- Animal;
9- Ambulance;
10- Airplane;
11- Other (Mention…)..

4
How much time takes
to get to this institution?
In minutes?
112
1-Yes
2-No 126
Did you bear any
expenses to move or get
health service from
your income or your
Family income of ?
113
in EL Costs of transporting
the patient to go and
return?
114
in EL Cost of transportation
of the relative to
accompany the patient?
115
in EL Total transportation
cost.
116
in EL How much money has
been spent on following
health and curative
services?(Doctor
Consultation)
117
in EL Laboratory
investigations
118
in EL Radio-diagnostic (MRI,
X-ray, CT
119
in EL Medication 120
in EL Minor operations 121
in EL Physiotherapy 122
in EL Traditional healing 123
in EL Others (Mention…). 124
in EL Total cost of the
health care
125
1-Yes
2-No 135
Do you contributed to any
person or any party in the
payment of treatment
expenses Incas of yes
mention the contributed
parties and amounts paid?
126
In L.E Governmental; 127
In L.E Public Sector; 128
In L.E Private Sector; 129
In L.E HIO; 130
In L.E Social Organization;; 131
In L.E Syndicates; 132
In L.E Others (Friends-
Relatives)
133
In L.E Total contribution 134
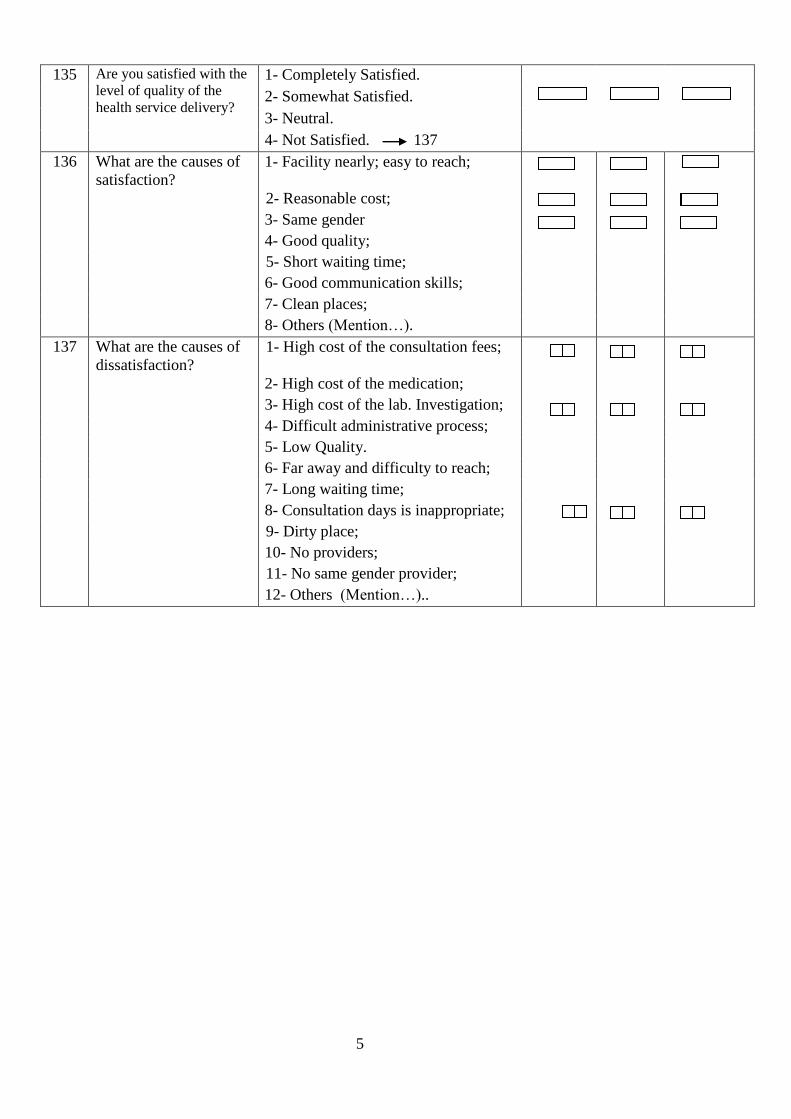
5
1- Completely Satisfied. Are you satisfied with the
level of quality of the
health service delivery?
135
2- Somewhat Satisfied.
3- Neutral.
4- Not Satisfied. 137
1- Facility nearly; easy to reach; What are the causes of
satisfaction?
136
2- Reasonable cost;
3- Same gender
4- Good quality;
5- Short waiting time;
6- Good communication skills;
7- Clean places;
8- Others (Mention…).
1- High cost of the consultation fees; What are the causes of
dissatisfaction?
137
2- High cost of the medication;
3- High cost of the lab. Investigation;
4- Difficult administrative process;
5- Low Quality.
6- Far away and difficulty to reach;
7- Long waiting time;
8- Consultation days is inappropriate;
9- Dirty place;
10- No providers;
11- No same gender provider;
12- Others (Mention…)..

6
Second Disease
1- Hypertension; Type Of Disease: 138
2- Hyperglycemia
3- Rheumatic diseases;
4- Renal diseases (Renal Failure);
5- Cardiac diseases;
6- TB;;
7- Asthma;
8- Cancer;
9- Mantel diseases;
10- Malnutrition;
11- Others (Mention…).
1-Yes 141
2-No
Did the patient make
any visit to in order to
treat this disease during
the last four weeks?
139
1-I think that the problem is simple;
What is the main reason
of not to getting a
treatment for this
disease?
140
2- High cost;
3- Far Distance;
4- Low Quality;
5- Has not physical Ability to go;
6- Long waiting time of the previous
visit;
7- Family Responsibilities;
8- Use traditional treatments without
consultation;
9- Use medical treatments without
consultation;
10- Other (Mention…).
Second Disease
Second Disease
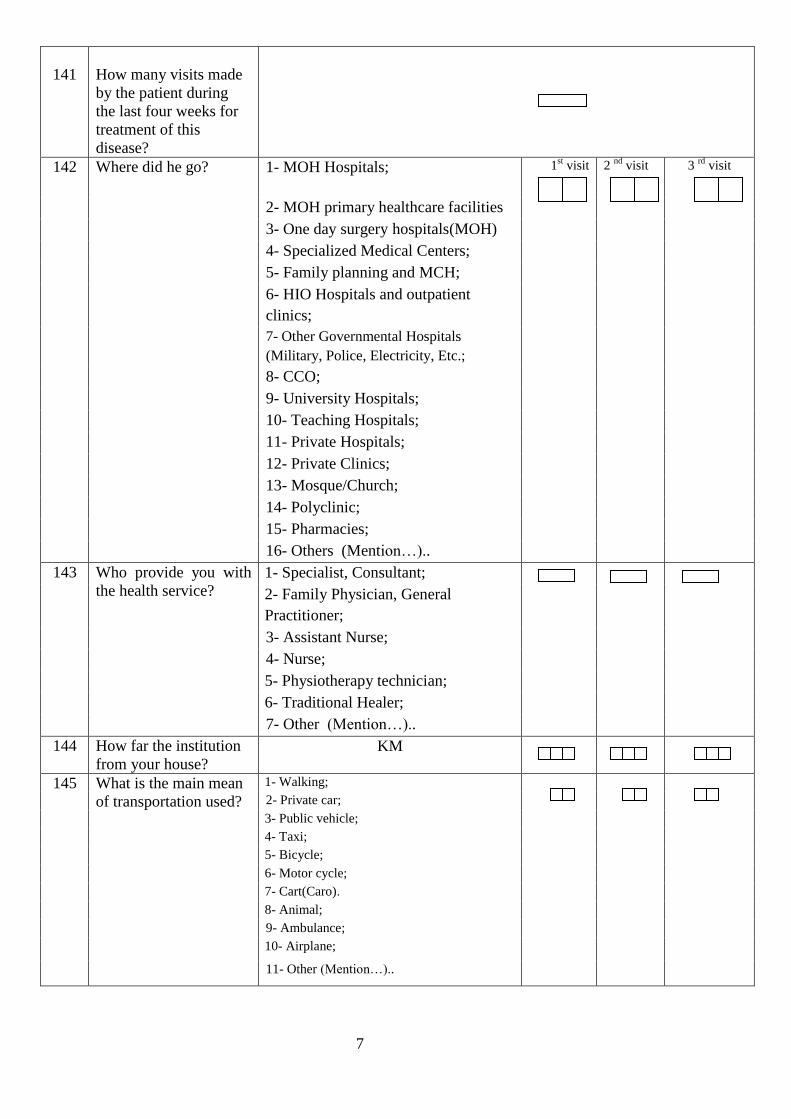
7
How many visits made
by the patient during
the last four weeks for
treatment of this
disease?
141
3 rd
visit 2 nd
visit 1st visit 1- MOH Hospitals;
Where did he go? 142
2- MOH primary healthcare facilities
3- One day surgery hospitals(MOH)
4- Specialized Medical Centers;
5- Family planning and MCH;
6- HIO Hospitals and outpatient
clinics;
7- Other Governmental Hospitals
(Military, Police, Electricity, Etc.;
8- CCO;
9- University Hospitals;
10- Teaching Hospitals;
11- Private Hospitals;
12- Private Clinics;
13- Mosque/Church;
14- Polyclinic;
15- Pharmacies;
16- Others (Mention…)..
1- Specialist, Consultant; Who provide you with
the health service?
143
2- Family Physician, General
Practitioner;
3- Assistant Nurse;
4- Nurse;
5- Physiotherapy technician;
6- Traditional Healer;
7- Other (Mention…)..
KM How far the institution
from your house?
144
1- Walking; What is the main mean
of transportation used?
145 2- Private car;
3- Public vehicle;
4- Taxi;
5- Bicycle;
6- Motor cycle;
7- Cart(Caro).
8- Animal;
9- Ambulance;
10- Airplane;
11- Other (Mention…)..

8
How much time takes
to get to this institution?
In minutes?
146
1-Yes
2-No 160
Did you bear any
expenses to move or get
health service from
your income or your
Family income of ?
147
in EL Costs of transporting
the patient to go and
return in EL?
148
in EL Cost of transportation
of the relative to
accompany the patient?
149
in EL Total transportation
cost.
150
in EL How much money has
been spent on following
health and curative
services?(Doctor
Consultation)
151
in EL Laboratory
investigations
152
in EL Radio-diagnostic (MRI,
X-ray, CT
153
in EL Medication 154
in EL Minor operations 155
in EL Physiotherapy 156
in EL Traditional healing 157
in EL Others (Mention…). 158
in EL Total cost of the
healthcare
159
1-Yes
2-No 169
Do you contributed to any
person or any party in the
payment of treatment
expenses Incas of yes
mention the contributed
parties and amounts paid?
160
In L.E Governmental 161
In L.E Public Sector 162
In L.E Private Sector 163
In L.E HIO; 164
In L.E Social Organization 165
In L.E Syndicates 166
In L.E Others (Friends-
Relatives)
167
In L.E Total contribution 168

9
1- Completely Satisfied. Are you satisfied with the
level of quality of the
health service delivery?
169
2- Somewhat Satisfied.
3- Neutral.
4- Not Satisfied. 171
1- Facility nearly; easy to reach; What are the causes of
satisfaction?
170
2- Reasonable cost;
3- Same gender
4- Good quality;
5- Short waiting time;
6- Good communication skills;
7- Clean places;
8- Others (Mention…).
1- High cost of the consultation fees; What are the causes of
dissatisfaction?
171
2- High cost of the medication;
3- High cost of the lab. Investigation;
4- Difficult administrative process;
5- Low Quality.
6- Far away and difficulty to reach;
7- Long waiting time;
8- Consultation days is inappropriate;
9- Dirty place;
10- No providers;
11- No same gender provider;
12- Others (Mention…)..

10
1- Hypertension; Type Of Disease: 172
2- Hyperglycemia
3- Rheumatic diseases;
4- Renal diseases (Renal Failure);
5- Cardiac diseases;
6- TB;;
7- Asthma;
8- Cancer;
9- Mantel diseases;
10- Malnutrition;
11- Others (Mention…).
1-Yes 175
2-No
Did the patient make
any visit to in order to
treat this disease during
the last four weeks?
173
1-I think that the problem is simple;
What is the main reason
of not to getting a
treatment for this
disease?
174
2- High cost;
3- Far Distance;
4- Low Quality;
5- Has not physical Ability to go;
6- Long waiting time of the previous
visit;
7- Family Responsibilities;
8- Use traditional treatments without
consultation;
9- Use medical treatments without
consultation;
10- Other (Mention…).
How many visits made
by the patient during
the last four weeks for
treatment of this
disease?
175
Third Disease
Second Disease

11
3 rd
visit 2 nd visit 1st visit 1-MOH Hospitals;
Where did he go? 176
2- MOH primary healthcare facilities
3- One day surgery hospitals(MOH)
4- Specialized Medical Centers;
5- Family planning and MCH;
6- HIO Hospitals and outpatient
clinics;
7- Other Governmental Hospitals
(Military, Police, Electricity, Etc.;
8- CCO;
9- University Hospitals;
10- Teaching Hospitals;
11- Private Hospitals;
12- Private Clinics;
13- Mosque/Church;
14- Polyclinic;
15- Pharmacies;
16- Others (Mention…)..
1- Specialist, Consultant; Who provide you with
the health service?
177
2- Family Physician, General
Practitioner;
3- Assistant Nurse;
4- Nurse;
5- Physiotherapy technician;
6- Traditional Healer;
7- Other (Mention…)..
KM How far the institution
from your house?
178
1- Walking; What is the main mean
of transportation used?
179 2- Private car;
3- Public vehicle;
4- Taxi;
5- Bicycle;
6- Motor cycle;
7- Cart(Caro).
8- Animal;
9- Ambulance;
10- Airplane;
11- Other (Mention…)..
How much time takes
to get to this institution?
In minutes?
180

12
1-Yes
2-No 194
Did you bear any
expenses to move or get
health service from
your income or your
Family income of ?
181
in EL Costs of transporting
the patient to go and
return in EL?
182
in EL Cost of transportation
of the relative to
accompany the patient?
183
in EL Total transportation
cost.
184
in EL How much money has
been spent on following
health and curative
services?(Doctor
Consultation)
185
in EL Laboratory
investigations
186
in EL Radio-diagnostic (MRI,
X-ray, CT
187
in EL Medication 188
in EL Minor operations 189
in EL Physiotherapy 190
in EL Traditional healing 191
in EL Others (Mention…). 192
in EL Total cost of the
healthcare
193
1-Yes
2-No 203
Do you contributed to any
person or any party in the
payment of treatment
expenses Incas of yes
mention the contributed
parties and amounts paid?
194
In L.E Governmental; 195
In L.E Public Sector; 196
In L.E Private Sector; 197
In L.E HIO; 198
In L.E Social Organization;; 199
In L.E Syndicates; 200
In L.E Others (Friends-
Relatives)
201
In L.E Total contribution 202

13
1- Completely Satisfied. Are you satisfied with the
level of quality of the
health service delivery?
203
2- Somewhat Satisfied.
3- Neutral.
4- Not Satisfied. 205
1- Facility nearly; easy to reach; What are the causes of
satisfaction?
204
2- Reasonable cost;
3- Same gender
4- Good quality;
5- Short waiting time;
6- Good communication skills;
7- Clean places;
8- Others (Mention…).
1- High cost of the consultation fees; What are the causes of
dissatisfaction?
205
2- High cost of the medication;
3- High cost of the lab. Investigation;
4- Difficult administrative process;
5- Low Quality.
6- Far away and difficulty to reach;
7- Long waiting time;
8- Consultation days is inappropriate;
9- Dirty place;
10- No providers;
11- No same sex provider;
12- Others (Mention…)..
1- Yes 207
2- No (finish the questionnaire)
Is there any other health
institution nearer to
your home
602
1- High cost Why didn't you go there 602
2- Difficult administrative process
3- low quality
4- Long waiting time
5- Consultation days is inappropriate
6- Dirty place;
7- No same gender provider;
8- Others (Mentions..)

163
4- DENTAL DISEASES QUESTIONNAIRE


Governorate:
Kism / Markaz
First Visit
Second Visit
Third Visit
Urban / Rural
1- completed
2- Patient wasn't in house
3- Refused.
4-Unable or Ineligible
5- Other (mention)……..
Household member number :
District no. / building owner name
First : Identification data :
shiakha / city / village
Road name / Block number
Patient name :
to the sourceProhibited without referring
Visit timeVisit result
Arab Republic of Egypt
And StatisticsCentral Agency for Public Mobilization
Ministry of Health
Publication or Quotation is
Segment no.
Household number within governorate Household number within shieaka / village
Household number within the frame
Result code
Second : Visit Data
Visit No. Visit date
Dental Diseases Questionnaire
Household Health Services Utilization And Expenditure Survey
2009/2010
( 4 )

No. Question101 Number of diseases suffered the Last 12 3 major dislases 1-
months 2- 3-
102 Type of disease : 1- Dental cares ;2- Gingivitis ;3- Tumor ;4- Others (mention) ….
103 Did the patient make visit in order to treat 1- Yes 105this disease during the eat 12 months ? 2- No
104 What is the main reason for not searching for 1- I think that the problem is simple ;a treatment ? 2- High codt
3- Far Distance ;4- Low Quality ;5- Has not physical ability to go ;6- Long waiting tim of the previous visit ;
7- Family Responsibilities ;8- Use traditional treatments without consultaion ;9- Use medical treatments without consultaion ;10- Others (mention) …. .
105 How many visits made by the patient during the last 12 month for treatment ?
first visit second visit third visit
106 Where did the patient go for treatment ? 1- MOH Hospitals ;2- MOH primary healthcare facilities3- One day surgery hospitals(MOH)4- Specialized Medical Centers ;5- HIO Hospitals and outpatient clinics;
6- Other Governmental Hospitals ( Military , police, Eiectricity , Etc . ;7- CCO ;8- University Hospitals ;9- Teaching Hospitals ;10- Private Hospitals ;11- Private Clinics ;12- Mosque / Church ;13- Polyclinic ;14- Pharmacis ;15- Others ( mention) ….
107 Who provide you health service ? 1- Specialist, Consultant ;2- Famity physician, General Practitioner;
3- Assistant Nurse ;4- Nurse ;5- Traditional health provider ;6- Others ( mention) ….
First Disease :
Andwer Selection
- 1 -

first visit second visit third visit
108 How far the institution from your house? In KM K.M K.M K.M
109 What is the main means used to move ? 1- Walking ;
2- Private car ;
3- Public vehicle ;
4- Taxi ;
5- Bicycle ;
6- Motor cycle ;
7- Cart ;
8- Animal ;
9- Ambulance ;
10- Airplane ;
11- Others ( mention) ….
110 How long time was taken to get this instiution? minute minute minute
In minutes
111 Did any expenses incurred to move or get health 1- Yes
service from your income or family income ? 2- No 124
112 Cost of transporting the patient to and from in L.E
health care institution .
113 Cost of transporting of the relative to in L.E
accampanies the patient ?
114 Total transportation cost in L.E
115 How much money has been spent on health and in L.E
curative services on the fallowing items ;
medical consultation
if no write ( zero) in all gabs
116 Laboratory investigations in L.E
117 Radio- diagnostic ( MRI , X - ray , CT) in L.E
118 Medication in L.E
119 Minor operations in L.E
120 Orthodontics in L.E
121 Traditional treating in L.E
122 Others ( mention) …. in L.E
123 Total cost of the health care in L.E - 2 -

first visit second visit third visit
124 Did you contribute to person or party in the 1- Yes
payment of treatment expenses ? 2- No 133(in case of yes mention contributed parties and amount paid)
125 1- Governmental ; In L.E
126 2- Public Sector ; In L.E
127 3- Private Sector ; In L.E
128 4- HIO ; In L.E
129 6- Social Organization ; In L.E
130 7- Syndicates ; In L.E
131 8- Others ( Friends - Relatives ) In L.E
132 Total contribution In L.E
133 Are you satisfied with the level of quality 1-completely satisfied 2-somewhat satisfied
of the health service delivery ? 3-nutrat second disease4- unsatisfied 135
134 What are the causes of satisfaction ? 1- Facility nearby / easy to reach ;
( maximum 3 causes ) 2- Reasonable
3- Same gender ;
4- Good quality ;
5- Short waiting time ;
6- Good communication skills ;
7- Clean places ;
8- Others ( mention) ….
135 What are the causes of dissatisfaction ? 1- High cost of the consultation fees ;
( maximum 3 causes ) 2- High cost of the medication ;
3- High cost of the lab. Investigation ;
4- Difficult administrative process ;
5- Low quality provider
6- Far away and difficult to reach ;
7- Long waiting time ;
8- Consultation days is inappropriate ;
9- Dirty place ;
10- No providers ;
11- No same gender provider ;
12- Others ( mention) ….
- 3 -

136 Type of disease : 1- Dental cares ;2- Gingivitis ;3- Tumor ;4- Others (mention) ….
137 Did the patient make visit in order to treat 1- Yes 139this disease during the eat 12 months ? 2- No
138 What is the main reason for not searching for 1- I think that the problem is simple ;a treatment ? 2- High codt
3- Far Distance ;4- Low Quality ;5- Has not physical ability to go ;6- Long waiting tim of the previous visit ;
7- Family Responsibilities ;8- Use traditional treatments without consultaion ;9- Use medical treatments without consultaion ;10- Others (mention) …. .
139 How many visits made by the patient during the last 12 month for treatment of ?
first visit second visit third visit
140 Where did the patient go for treatment ? 1- MOH Hospitals ;2- MOH primary healthcare facilities3- One day surgery hospitals(MOH)4- Specialized Medical Centers ;5- HIO Hospitals and outpatient clinics;
6- Other Governmental Hospitals ( Military , police, Eiectricity , Etc . ;7- CCO ;8- University Hospitals ;9- Teaching Hospitals ;10- Private Hospitals ;11- Private Clinics ;12- Mosque / Church ;13- Polyclinic ;14- Pharmacis ;15- Others ( mention) ….
141 Who provide you health service ? 1- Specialist, Consultant ;2- Famity physician, General Practitioner;
3- Assistant Nurse ;4- Nurse ;5- Traditional health provider ;6- Others ( mention) ….
Second Disease :
- 4 -

first visit second visit third visit
142 How far the institution from your house? In KM K.M K.M K.M
143 What is the main means used to move ? 1- Walking ;
2- Private car ;
3- Public vehicle ;
4- Taxi ;
5- Bicycle ;
6- Motor cycle ;
7- Cart ;
8- Animal ;
9- Ambulance ;
10- Airplane ;
11- Others ( mention) ….
144 How long time was taken to get this instiution? minute minute minute
In minutes
145 Did any expenses incurred to move or get health 1- Yes
service from your income or family income ? 2- No 158
146 Cost of transporting the patient to and from in L.E
health care institution .
147 Cost of transporting of the relative to in L.E
accampanies the patient ?
148 Total transportation cost in L.E
149 How much money has been spent on health and in L.E
curative services on the fallowing items ;
medical consultation
if no write ( zero) in all gabs
150 Laboratory investigations in L.E
151 Radio- diagnostic ( MRI , X - ray , CT) in L.E
152 Medication in L.E
153 Minor operations in L.E
154 Orthodontics in L.E
155 Traditional treating in L.E
156 Others ( mention) …. in L.E
157 Total cost of the health care in L.E - 5 -

first visit second visit third visit
158 Did you contribute to person or party in the 1- Yes
payment of treatment expenses ? 2- No 167(in case of yes mention contributed parties and amount paid)
159 1- Governmental ; In L.E
160 2- Public Sector ; In L.E
161 3- Private Sector ; In L.E
162 4- HIO ; In L.E
163 6- Social Organization ; In L.E
164 7- Syndicates ; In L.E
165 8- Others ( Friends - Relatives ) In L.E
166 Total contribution In L.E
167 Are you satisfied with the level of quality 1-completely satisfied 2-somewhat satisfied
of the health service delivery ? 3-nutrat second disease4- unsatisfied 169
168 What are the causes of satisfaction ? 1- Facility nearby / easy to reach ;
( maximum 3 causes ) 2- Reasonable
3- Same gender ;
4- Good quality ;
5- Short waiting time ;
6- Good communication skills ;
7- Clean places ;
8- Others ( mention) ….
169 What are the causes of dissatisfaction ? 1- High cost of the consultation fees ;
( maximum 3 causes ) 2- High cost of the medication ;
3- High cost of the lab. Investigation ;
4- Difficult administrative process ;
5- Low quality provider
6- Far away and difficult to reach ;
7- Long waiting time ;
8- Consultation days is inappropriate ;
9- Dirty place ;
10- No providers ;
11- No same gender provider ;
12- Others ( mention) ….
- 6 -

170 Type of disease : 1- Dental cares ;2- Gingivitis ;3- Tumor ;4- Others (mention) ….
171 Did the patient make visit in order to treat 1- Yes 173this disease during the eat 12 months ? 2- No
172 What is the main reason for not searching for 1- I think that the problem is simple ;a treatment ? 2- High codt
3- Far Distance ;4- Low Quality ;5- Has not physical ability to go ;6- Long waiting tim of the previous visit ;
7- Family Responsibilities ;8- Use traditional treatments without consultaion ;9- Use medical treatments without consultaion ;10- Others (mention) …. .
173 How many visits made by the patient during the last 12 month for treatment of ?
first visit second visit third visit
174 Where did the patient go for treatment ? 1- MOH Hospitals ;2- MOH primary healthcare facilities3- One day surgery hospitals(MOH)4- Specialized Medical Centers ;5- HIO Hospitals and outpatient clinics;
6- Other Governmental Hospitals ( Military , police, Eiectricity , Etc . ;7- CCO ;8- University Hospitals ;9- Teaching Hospitals ;10- Private Hospitals ;11- Private Clinics ;12- Mosque / Church ;13- Polyclinic ;14- Pharmacis ;15- Others ( mention) ….
175 Who provide you health service ? 1- Specialist, Consultant ;2- Famity physician, General Practitioner;
3- Assistant Nurse ;4- Nurse ;5- Traditional health provider ;6- Others ( mention) ….
Third Disease :
- 7 -

first visit second visit third visit
176 How far the institution from your house? In KM K.M K.M K.M
177 What is the main means used to move ? 1- Walking ;
2- Private car ;
3- Public vehicle ;
4- Taxi ;
5- Bicycle ;6- Motor cycle ;6- Motor cycle ;7- Cart ;8- Animal ;9- Ambulance ;10- Airplane ;11- Others ( mention) ….
178 How long time was taken to get this instiution? minute minute minute
In minutes
179 Did any expenses incurred to move or get health 1- Yes
service from your income or family income ? 2- No 192
180 Cost of transporting the patient to and from in L.E
health care institution .
181 Cost of transporting of the relative to in L.E
accampanies the patient ?
182 Total transportation cost in L.E
183 How much money has been spent on health and in L.E
curative services on the fallowing items ;
medical consultationif no write ( zero) in all gabs
184 Laboratory investigations in L.E
185 Radio- diagnostic ( MRI , X - ray , CT) in L.E
186 Medication in L.E
187 Minor operations in L.E
188 Orthodontics in L.E
189 Traditional treating in L.E
190 Others ( mention) …. in L.E
191 Total cost of the health care in L.E
- 8 -
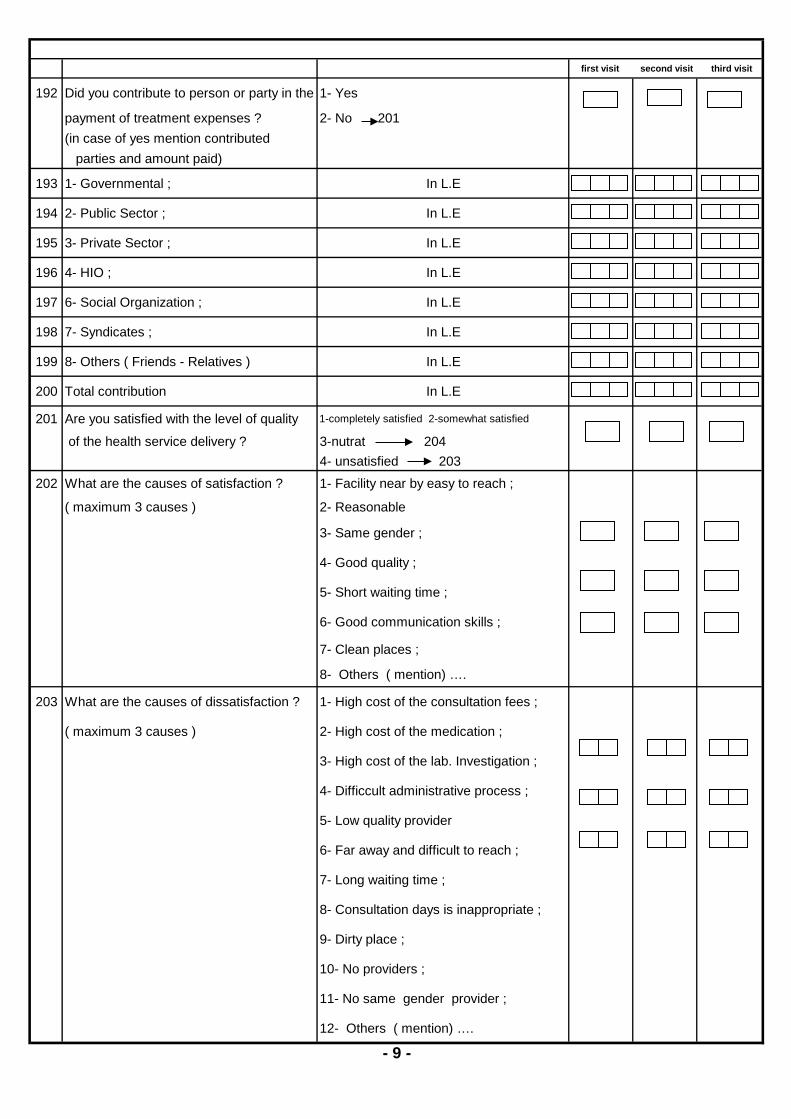
first visit second visit third visit
192 Did you contribute to person or party in the 1- Yes
payment of treatment expenses ? 2- No 201(in case of yes mention contributed parties and amount paid)
193 1- Governmental ; In L.E
194 2- Public Sector ; In L.E
195 3- Private Sector ; In L.E
196 4- HIO ; In L.E
197 6- Social Organization ; In L.E
198 7- Syndicates ; In L.E
199 8- Others ( Friends - Relatives ) In L.E
200 Total contribution In L.E
201 Are you satisfied with the level of quality 1-completely satisfied 2-somewhat satisfied
of the health service delivery ? 3-nutrat 2044- unsatisfied 203
202 What are the causes of satisfaction ? 1- Facility near by easy to reach ;
( maximum 3 causes ) 2- Reasonable
3- Same gender ;
4- Good quality ;
5- Short waiting time ;
6- Good communication skills ;
7- Clean places ;
8- Others ( mention) ….
203 What are the causes of dissatisfaction ? 1- High cost of the consultation fees ;
( maximum 3 causes ) 2- High cost of the medication ;
3- High cost of the lab. Investigation ;
4- Difficcult administrative process ;
5- Low quality provider
6- Far away and difficult to reach ;
7- Long waiting time ;
8- Consultation days is inappropriate ;
9- Dirty place ;
10- No providers ;
11- No same gender provider ;
12- Others ( mention) ….
- 9 -

first visit second visit third visit
204 Is there any other health institution 1- Yes 205
nearer to your home ? 2- No (finish the questionnaire)
205 Why didn't you go there ? 1- High cost
2- Difficult administrative process
3- Low quality
4- Long waiting time
5- Consultation days is inappropriate
6- Dirty place
7- No same sex provider ;
8- Others ( mention) ….
- 10 -

177
5- HOSPITAL ADMISSION QUESTIONNAIRE


Governorate:
Kism / Markaz
First Visit
Second Visit
Third Visit
Household number within shieaka / village
Household number within the frame
1- completed
2- Patient wasn't in house
3- Refused.
4-Unable or Ineligible
5- Other (mention)……..
First : Identification data :
shiakha / city / village
Road name / Block number
Patient name : Household member number :
District no. / building owner name
Urban / Rural
Segment no.
to the source Household number within governorate
Ministry of Health
Publication or Quotation isProhibited without referring
Arab Republic of Egypt
And StatisticsCentral Agency for Public Mobilization
Result code
Second : Visit Data
Visit No. Visit dateVisit time
Visit result
Hospital Admission Questionnaire
Household Health Services Utilization And Expenditure Survey
2009/2010
( 5 )

Answers selection Question No.
No 3 major diseases
1- 2- 3-
Number of
admission at hospital during the last 12 months
101
First admission 1. 1-24 hours or less;
2. more than 24 hours; 3. Do not know.
How long was the
admission period in the – patient ward
102
1. Non-chronic; 104 2. Chronic; 105 3. labor / delivery;
4. cesarean; 5. new natal care 106
6. Accident; 7.Others ( mention …)
What was the main cause for admission ?
103
1. Gastroenteritis;
2. Fever; 3. Hepatitis;
4. Typhoid; 5. Respiratory diseases; 6. Measles / Rubella;
7. Abscesses (minor surgeries) 8. Contusions; 9. eye problems (include ZV);
10. Others (mention)…
For non-chronic
disease , what was the disease?
104
-1-
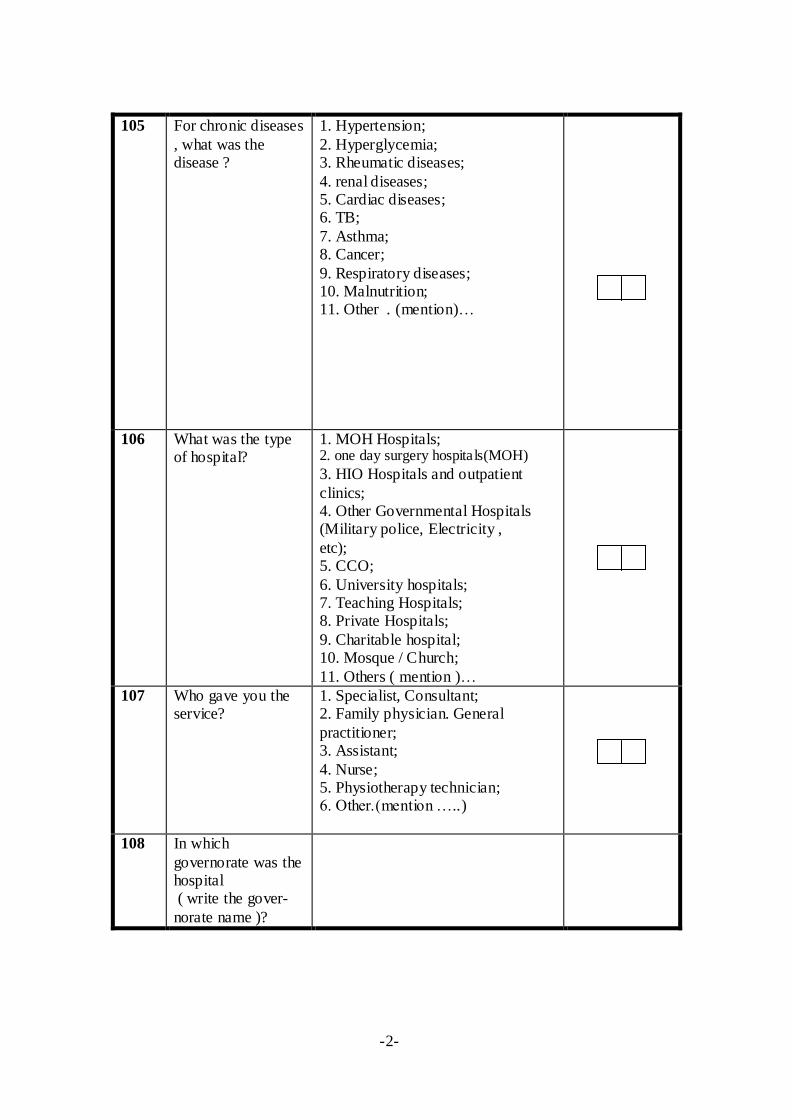
1. Hypertension;
2. Hyperglycemia; 3. Rheumatic diseases;
4. renal diseases; 5. Cardiac diseases; 6. TB;
7. Asthma; 8. Cancer;
9. Respiratory diseases; 10. Malnutrition; 11. Other . (mention)…
For chronic diseases
, what was the disease ?
105
1. MOH Hospitals; 2. one day surgery hospitals(MOH)
3. HIO Hospitals and outpatient
clinics; 4. Other Governmental Hospitals (Military police, Electricity ,
etc); 5. CCO;
6. University hospitals; 7. Teaching Hospitals; 8. Private Hospitals;
9. Charitable hospital; 10. Mosque / Church;
11. Others ( mention )…
What was the type of hospital?
106
1. Specialist, Consultant; 2. Family physician. General
practitioner; 3. Assistant;
4. Nurse; 5. Physiotherapy technician; 6. Other.(mention …..)
Who gave you the service?
107
In which
governorate was the hospital ( write the gover-
norate name )?
108
-2-
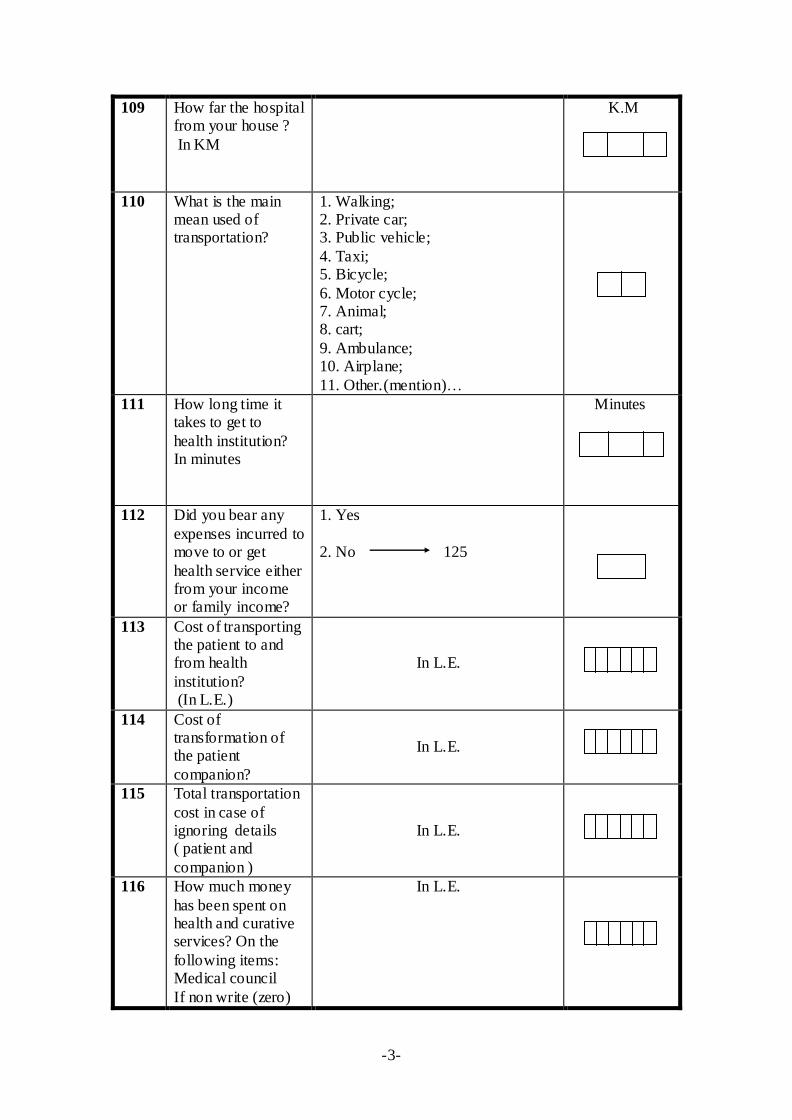
K.M
How far the hospital from your house ?
In KM
109
1. Walking; 2. Private car; 3. Public vehicle;
4. Taxi; 5. Bicycle;
6. Motor cycle; 7. Animal; 8. cart;
9. Ambulance; 10. Airplane;
11. Other.(mention)…
What is the main mean used of transportation?
110
Minutes
How long time it takes to get to
health institution? In minutes
111
1. Yes
2. No 125
Did you bear any
expenses incurred to move to or get
health service either from your income or family income?
112
In L.E.
Cost of transporting the patient to and from health
institution? (In L.E.)
113
In L.E.
Cost of transformation of the patient
companion?
114
In L.E.
Total transportation
cost in case of ignoring details ( patient and
companion )
115
In L.E. How much money
has been spent on health and curative services? On the
following items: Medical council
If non write (zero)
116
-3-

In L.E.
1. Laboratory Investigation
117
In L.E.
2. Radio-diagnostic ( MRI, X-ray, CT)
118
In L.E.
3. Medication 119
In L.E.
4. Surgeries
120
In L.E.
5. physiotherapy 121
In L.E.
6. Fees of patient &
admission and accommodation for
companion
122
In L.E.
7. Others ( mention)…
123
In L.E.
Total cost of the
health care
124
Yes
No 134
Did you contribute
to any person or party in the payment of
treatment expenses?
125
In L.E.
1. governmental; 126
In L.E.
2. Public Sector; 127
In L.E.
3. Private Sector; 128
In L.E.
4. HIO; 129
In L.E.
5. Social
Organization;
130
In L.E.
6. Syndicates; 131
In L.E.
7. Other ( Friends-Relatives )
132
In L.E. Total contribution 133
-4-
1-completely satisfied 2-someone satisfied
3- natural Second time 4- Not satisfied 136
Are you satisfied with the level of
quality of the health service delivery?
134
1. Near facilities; easy to reach; 2. reasonable cost;
3. Same gender; 4. Good quality;
5. short waiting time; 6. Good communication skills; 7. Clean places;
8. Others(mention)…..
What are the causes of satisfaction?
(maximum 3 causes)
135
1. High cost of the consultation
fees; 2. High cost of the medication; 3. High cost of the lab .
Investigation; 4. Difficult administrative
process; 5. Low quality; 6. far away and difficulty to
reach; 7. Long waiting time;
8. Consultation days is inappropriate; 9. Dirty place;
10. No provider; 11. No same gender provider;
12. Others (mention)…
What are the causes
of dissatisfaction (maximum3causes) ?
136
-5-

Second admission
1. 1-24 hours or less;
2. more than 24 hours; 3. Do not know.
How long was the
admission period in the – patient ward
137
1. Non-chronic; 139
2. Chronic; 140 3. labor / delivery;
4. cesarean; 141 5. new natal care 6. Accident;
7.Others ( mention …)
What was the main
cause for admission ?
138
1. Gastroenteritis;
2. Fever; 3. Hepatitis; 4. Typhoid;
5. Respiratory diseases; 6. Measles / Rubella;
7. Abscesses (minor surgeries) 8. Contusions; 9. eye problems (include ZV);
10. Others (mention)…
For non-chronic
disease , what was the disease?
139
-6-

1. Hypertension;
2. Hyperglycemia; 3. Rheumatic diseases;
4. renal diseases; 5. Cardiac diseases; 6. TB;
7. Asthma; 8. Cancer;
9. Respiratory diseases; 10. Malnutrition; 11. Other . (mention)…
For chronic diseases
, what was the disease ?
140
1. MOH Hospitals; 2. one day surgery hospitals(MOH);
3. HIO Hospitals and outpatient
clinics; 4. Other Governmental Hospitals (Military police, Electricity ,
etc); 5. CCO;
6. University hospitals; 7. Teaching Hospitals; 8. Private Hospitals;
9. Charitable hospital; 10. Mosque / Church;
11. Others ( mention )…
What was the type of hospital?
141
1. Specialist, Consultant; 2. Family physician. General
practitioner; 3. Assistant;
4. Nurse; 5. Physiotherapy technician; 6. Other.(mention …..)
Who gave you the service?
142
In which
governorate was the hospital ( write the gover-
norate name )?
143
K.M
How far the hospital
from your house ? In KM
144
-7-

1. Walking; 2. Private car;
3. Public vehicle; 4. Taxi;
5. Bicycle; 6. Motor cycle; 7. Animal;
8. cart; 9. Ambulance;
10. Airplane; 11. Other.(mention)…
What is the main mean used of
transportation?
145
Minutes
How long time it
takes to get to health institution?
In minutes
146
1. Yes
2. No 160
Did you bear any expenses incurred to
move to or get health service either from your income
or family income?
147
In L.E.
Cost of transporting the patient to and from health
institution ? (In L.E.)
148
In L.E.
Cost of transformation of the patient
companion?
149
In L.E.
Total transportation
cost in case of ignoring details ( patient and
companion )
150
In L.E.
How much money
has been spent on health and curative services? On the
following items: Medical council
If non write (zero) in all gaps
151
In L.E. 1. Laboratory
Investigation
152
-8-

In L.E.
2. Radio-diagnostic ( MRI, X-ray, CT)
153
In L.E.
3. Medication 154
In L.E.
4. Surgeries
155
In L.E.
5. physiotherapy 156
In L.E.
6. Fees of patient &
admission and accommodation for
companion
157
In L.E.
7. Others ( mention)...
158
In L.E.
Total cost of the healthcare
159
Yes
No 169
Did you contribute
to any person or party in the
payment of treatment expenses?
160
In L.E.
1. governmental; 161
In L.E. 2. Public Sector; 162
In L.E.
3. Private Sector; 163
In L.E.
4. HIO; 164
In L.E.
5. Social
Organization;
165
In L.E.
6. Syndicates; 166
In L.E. 7. Other ( Friends-
Relatives )
167
-9-
In L.E.
Total contribution 168
1-completely satisfied
2-someone satisfied 3- natural Second time
4- Not satisfied 171
Are you satisfied
with the level of quality of the health
service delivery?
169
-10-
1. Near facilities; easy to reach
2. reasonable cost; 3. Same gender;
4. Good quality; 5. short waiting time; 6. Good communication skills;
7. Clean places; 8. Others
What are the causes
of satisfaction? (maximum 3 causes)
170
1. High cost of the consultation fees; 2. High cost of the medication;
3. High cost of the lab . Investigation;
4. Difficult administrative process; 5. Low quality;
6. far away and difficulty to reach;
7. Long waiting time; 8. Consultation days is inappropriate;
9. Dirty place; 10. No provider;
11.No same gender provider 12. Others (mention)…
What are the causes of dissatisfaction (maximum3causes)
?
171
-11-

Third admission
1. 1-24 hours or less;
2. more than 24 hours; 3. Do not know.
How long was the
admission period in the – patient ward
172
1. Non-chronic; 174
2. Chronic; 175 3. labor / delivery;
4. cesarean; 176 5. new natal care 6. Accident;
7.Others ( mention …)
What was the main
cause for admission ?
173
1. Gastroenteritis;
2. Fever; 3. Hepatitis; 4. Typhoid;
5. Respiratory diseases; 6. Measles / Rubella;
7. Abscesses (minor surgeries) 8. Contusions; 9. eye problems (include ZV);
10. Others (mention)…
For non-chronic
disease , what was the disease?
174
-12-

1. Hypertension.
2. Hyperglycemia; 3. Rheumatic diseases;
4. renal diseases; 5. Cardiac diseases; 6. TB;
7. Asthma; 8. Cancer;
9. Respiratory diseases; 10. Malnutrition; 11. Other . (mention)…
For chronic diseases ,
what was the disease ?
175
1. MOH Hospitals; 2. one day surgery hospitals(MOH)
3. HIO Hospitals and outpatient clinics;
4. Other Governmental Hospitals (Military police,
Electricity , etc); 5. CCO; 6. University hospitals;
7. Teaching Hospitals; 8. Private Hospitals;
9. Charitable hospital; 10. Mosque / Church; 11. Others ( mention )…
What was the type of
hospital?
176
1. Specialist, Consultant; 2. Family physician. General
practitioner; 3. Assistant; 4. Nurse;
5. Physiotherapy technician; 6. Other.(mention …..)
Who gave you the service?
177
In which governorate was the hospital
( write the gover-norate name )?
178
K.M
How far the hospital from your house ? In KM
179
-13-

1. Walking;
2. Private car; 3. Public vehicle;
4. Taxi; 5. Bicycle; 6. Motor cycle;
7. Animal; 8. cart;
9. Ambulance; 10. Airplane; 11. Other.(mention)…
What is the main
mean used of transportation?
180
Minutes
How long time it takes to get to health
institution? In minutes
181
1. Yes
2. No 196
Did you bear any expenses incurred to move to or get health
service either from your income or family
income?
182
In L.E.
Cost of transporting 1the patient to and
from health institution ?
(In L.E.)
183
In L.E. Cost of transformation of the
patient companion?
184
In L.E.
Total transportation
cost in case of ignoring details ( patient and
companion )
185
In L.E.
How much money has
been spent on health and curative services? On the following
items: Medical council
If non write (zero) in all gaps
186
In L.E. 1. Laboratory
Investigation
187
-14-

In L.E.
2. Radio-diagnostic ( MRI, X-ray, CT)
188
In L.E.
3. Medication 189
In L.E.
4. Surgeries
190
In L.E.
5. physiotherapy 191
In L.E.
6. Fees of patient & admission and
accommodation for companion
192
In L.E.
7. Others
( mention)…
193
In L.E.
Total cost of the
healthcare
194
Yes
No 205
Did you contribute to
any person or party in the payment of treatment expenses?
195
In L.E.
1. governmental; 196
In L.E. 2. Public Sector; 197
In L.E.
3. Private Sector; 198
In L.E.
4. HIO; 199
In L.E.
5. Social Organization;
200
In L.E.
6. Syndicates; 201
In L.E.
7. Other ( Friends-Relatives )
202
In L.E.
Total contribution 203
-15-

1-completely satisfied
2-someone satisfied 3- natural 208
4- Not satisfied 207
Are you satisfied with
the level of quality of the health service
delivery?
204
1. Near facilities; easy to
reach; 2. reasonable cost;
3. Same gender; 4. Good quality; 5. short waiting time;
6. Good communication skills; 7. Clean places;
8. Others.
What are the causes
of satisfaction? (maximum 3 causes)
205
1. High cost of the consultation fees;
2. High cost of the medication; 3. High cost of the lab .
Investigation; 4. Difficult administrative process;
5. Low quality; 6. far away and difficulty to
reach; 7. Long waiting time; 8. Consultation days is
inappropriate; 9. Dirty place;
10. No provider; 11.No same gender provider; 12. Others (mention)…
What are the causes of dissatisfaction
(maximum3causes) ?
206
1-yes
2- No(finish the questionnaire)
Is there any other
health institution nearer to the
phone?
207
1. high cost ; 2. Difficult administrative
process; 3. Low quality; 4. Long waiting time;
5. Consultation days is inappropriate;
6. Dirty place; 7. No same gender provider; 8. Others (mention)…;
Why didn’t go there?
208
-16-
197
6- TREATMENT ABROAD QUESTIONNAIRE


Governorate:
Kism / Markaz
First Visit
Second Visit
Third Visit
Urban / Rural
1- completed
2- Patient wasn't in house
3- Refused.
4-Unable or Ineligible
5- Other (mention)……..
Household member number :
District no. / building owner name
First : Identification data :
shiakha / city / village
Road name / Block number
Patient name :
to the sourceProhibited without referring
Visit timeVisit result
Arab Republic of Egypt
And StatisticsCentral Agency for Public Mobilization
Ministry of Health
Publication or Quotation is
Segment no.
Household number within governorate Household number within shieaka / village
Household number within the frame
Result code
Second : Visit Data
Visit No. Visit date
Treatment Abroad
Household Health Services Utilization And Expenditure Survey
2009/2010
(6 )

Answer Selection Question No.
Number of treatment
abroad during the 24
months 101
First time:
1-The medical board.
2- Health Insurance.
3- Private way.
Did you go through? 102
1-Not available at my country.
2- Low quality of healthcare service in my country.
3- There is some relative abroad.
4- Others (mention)…
Why did you go for
treatment abroad? 103
dayـــــــــــــــــ Which country did
you go for treatment
abroad? 104
In L.E.
How long did you
spend for treatment
abroad? 105
In L.E.
Cost of transporting
the patient to and
from other country ?
in (L.E)
106
In L.E.
Cost of transportation
of the patient
companion? 107
In L.E.
Total of
transportation cost in
case of ignoring
details(patient and
companion) ?
108
In L.E.
How much money
has been spent on the
following service
from your or family
income ?
Medical council
If non write ( zero )
in all gaps
109
In L.E. 1. Medical
Examination
In L.E. 2. laboratory
investigation
3. Radio-diagnostic
(MRI , X-ray , CT )
110
-1-
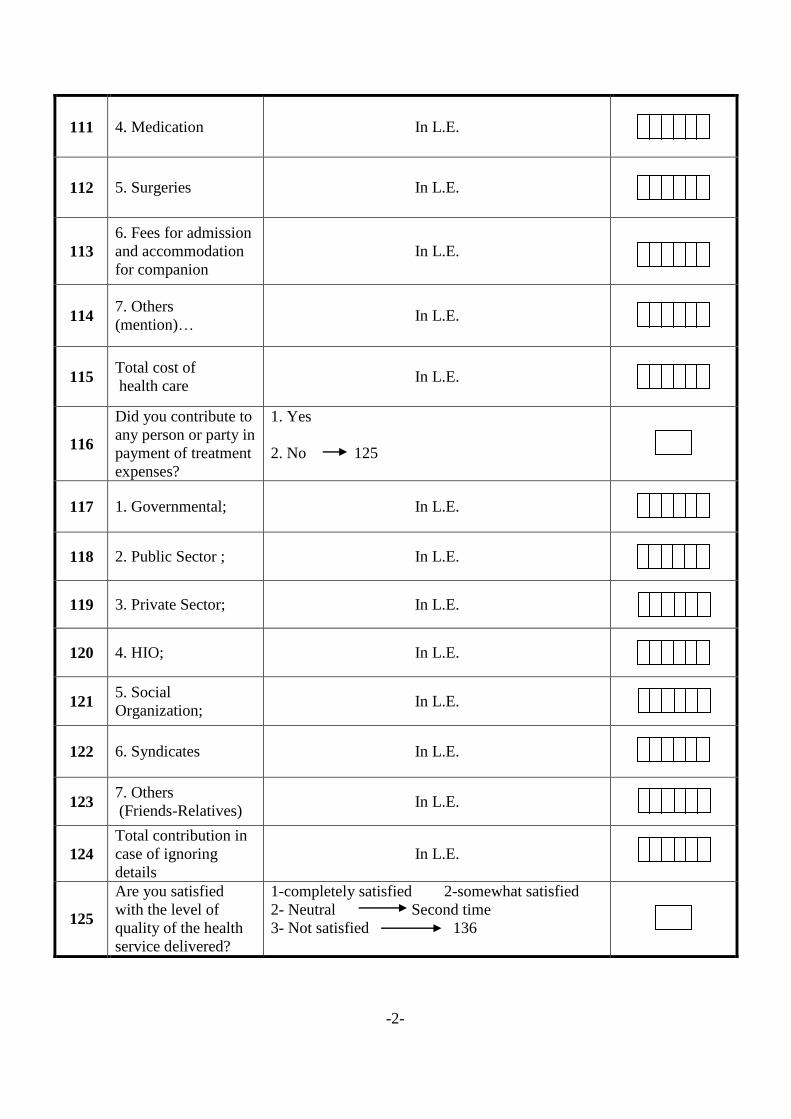
In L.E. 4. Medication 111
In L.E. 5. Surgeries 112
In L.E.
6. Fees for admission
and accommodation
for companion 113
In L.E.
7. Others
(mention)… 114
In L.E. Total cost of
health care 115
1. Yes
2. No 125
Did you contribute to
any person or party in
payment of treatment
expenses?
116
In L.E. 1. Governmental; 117
In L.E. 2. Public Sector ; 118
In L.E. 3. Private Sector; 119
In L.E. 4. HIO; 120
In L.E. 5. Social
Organization; 121
In L.E. 6. Syndicates 122
In L.E. 7. Others
(Friends-Relatives) 123
In L.E.
Total contribution in
case of ignoring
details 124
1-completely satisfied 2-somewhat satisfied
2- Neutral Second time
3- Not satisfied 136
Are you satisfied
with the level of
quality of the health
service delivered?
125
-2-

1. facility nearby easy to reach;
2. Reasonable cost;
3. Same sex;
4. Good quality;
5. Short waiting time;
6. Clean places;
8. Others. (mention)…
What are the causes
of satisfaction ?
(Maximum 3 causes) 126
1. High cost of the consultation fees;
2. High cost of medication;
3. High cost of the lab Investigation;
4. Difficult administrative process;
5. Low quality;
6. Far away and difficulty to reach;
7. long waiting time;
8. Consultation days is inappropriate;
9. Dirty place;
10. No providers;
11. No same sex provider;
12. Others . (mention)…
What are the causes
of dissatisfaction ?
(Maximum 3 causes)
127
-3-

Second time:
1-The medical board.
2- Health Insurance.
3- Private way.
Did you go through? 128
1-Not available at my country.
2- Low quality of healthcare service in my country.
3- There is some relative abroad.
4- Others (mention)…
Why did you go for
treatment abroad? 129
dayـــــــــــــــــ Which country did
you go for treatment
abroad? 130
In L.E.
How long did you
spend for treatment
abroad? 131
In L.E.
Cost of trans porting
the patient to and
from other country ?
in (L.E)
132
In L.E.
Cost of transportation
of the patient
companion? 133
In L.E.
Total of transport-
ation cost in case of
ignoring
details(patient and
companion) ?
134
In L.E.
How much money
has been spent on the
following service
from your or family
income ?
Medical council
If non write ( zero )
in all gaps
135
In L.E. 1. Medical
Examination
In L.E.
2. laboratory
investigation
3. Radio-diagnostic
(MRI , X-ray , CT )
136
In L.E. 4. Medication 137
In L.E.
5. Surgeries 138
-4-

In L.E.
6. Fees for admission
and accommodation
for companion 139
In L.E.
7. Others
( mention)… 140
In L.E. Total cost of
health care 141
1. Yes
2. No 151
Did you contribute to
any person or party in
payment of treatment
expenses?
142
In L.E. 1. Governmental; 143
In L.E. 2. Public Sector ; 144
In L.E. 3. Private Sector; 145
In L.E. 4. HIO; 146
In L.E. 5. Social
Organization; 147
In L.E. 6. Syndicates 148
In L.E. 7. Others
(Friends-Relatives) 149
In L.E.
Total contribution in
case of ignoring
details 150
1-completely satisfied 2-somewhat satisfied
2- neutral third time
3- Not satisfied 153
Are you satisfied
with the level of
quality of the health
service delivered?
151
1. facility nearby easy to reach;
2. Reasonable cost;
3. Same sex;
4. Good quality;
5. Short waiting time;
6. Clean places;
8. Others. (mention)…
What are the causes
of satisfaction ?
(Maximum 3 causes)
152
-5-
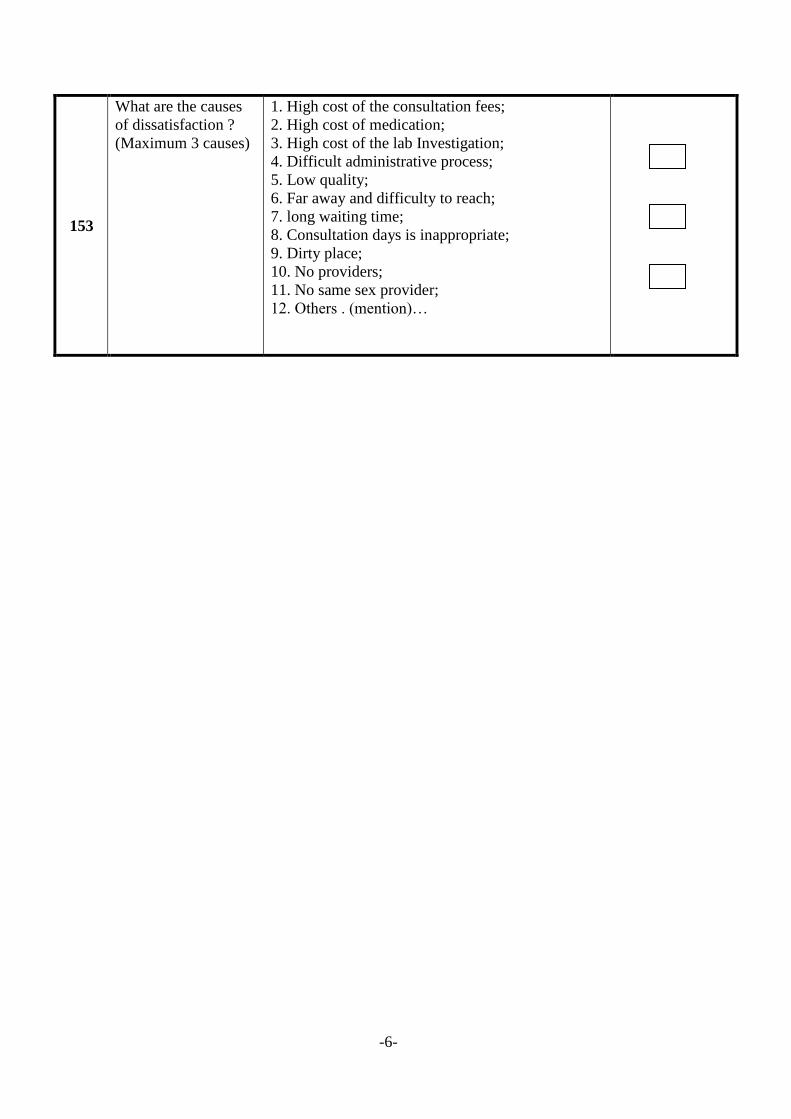
1. High cost of the consultation fees;
2. High cost of medication;
3. High cost of the lab Investigation;
4. Difficult administrative process;
5. Low quality;
6. Far away and difficulty to reach;
7. long waiting time;
8. Consultation days is inappropriate;
9. Dirty place;
10. No providers;
11. No same sex provider;
12. Others . (mention)…
What are the causes
of dissatisfaction ?
(Maximum 3 causes)
153
-6-

Third time:
1-The medical board.
2- Health Insurance.
3- Private way.
Did you go through? 154
1-Not available at my country.
2- Low quality of healthcare service in my
country.
3- There is some relative abroad.
4- Others (mention)…
Why did you go for
treatment abroad? 155
dayـــــــــــــــــ Which country did you
go for treatment
abroad? 156
In L.E.
How long did you
spend for treatment
abroad? 157
In L.E.
Cost of trans porting
the patient to and from
other country ? in (L.E) 158
In L.E.
Cost of transportation
of the patient
companion? 159
In L.E.
Total of transport-ation
cost in case of ignoring
details(patient and
companion) ?
160
In L.E.
How much money has
been spent on the
following service from
your or family income
?
Medical council
If non write ( zero ) in
all gaps
161
In L.E. 1. Medical
Examination
In L.E.
2. laboratory
investigation
3. Radio-diagnostic
(MRI , X-ray , CT )
162
In L.E. 4. Medication 163
In L.E. 5. Surgeries 164
-7-

In L.E.
6. Fees for admission
and accommodation for
companion 165
In L.E.
7. Others
( mention)… 166
In L.E. Total cost of
health care 167
1. Yes
2. No 177
Did you contribute to
any person or party in
payment of treatment
expenses?
168
In L.E. 1. Governmental; 169
In L.E. 2. Public Sector ; 170
In L.E. 3. Private Sector; 171
In L.E. 4. HIO; 172
In L.E. 5. Social Organization; 173
In L.E. 6. Syndicates 174
In L.E. 7. Others
(Friends-Relatives) 175
In L.E. Total contribution in
case of ignoring details 176
1-completely satisfied
2-somewhat satisfied
3- neutral end interview
4- Not satisfied 179
Are you satisfied with
the level of quality of
the health service
delivered?
177
1. facility nearby easy to reach;
2. Reasonable cost;
3. Same sex;
4. Good quality;
5. Short waiting time;
6. Clean places;
8. Others. (mention)…
What are the causes of
satisfaction?
(Maximum 3 causes) 178
-8-

1. High cost of the consultation fees;
2. High cost of medication;
3. High cost of the lab Investigation;
4. Difficult administrative process;
5. Low quality;
6. Far away and difficulty to reach;
7. long waiting time;
8. Consultation days is inappropriate;
9. Dirty place;
10. No providers;
11. No same sex provider;
12. Others . (mention)…
What are the causes of
dissatisfaction ?
(Maximum 3 causes) 179
-9-

211
7- PREVENTIVE CONSULTATIONS
QUESTIONNAIRE


Governorate:
Kism / Markaz
First Visit
Second Visit
Third Visit
Result code
Second : Visit Data
Visit No. Visit dateVisit time
Visit result
Arab Republic of Egypt
And StatisticsCentral Agency for Public Mobilization
Ministry of Health
Publication or Quotation is
Segment no.
to the sourceProhibited without referring
Household number within governorate Household number within shieaka / village
Household number within the frame
Household member number :
District no. / building owner name
First : Identification data :
shiakha / city / village
Road name / Block number
Patient name :
5- Other (mention)……..
Urban / Rural
1- completed
2- Patient wasn't in house
3- Refused.
4-Unable or Ineligible
Preventive Consultations Questionnaire
Household Health Services Utilization And Expenditure Survey
2009/2010
( 7 )

2
Question SN
1- Number of consultations during the last 12 months 101
# 2-
3-
3
rd visit 2
nd visit 1
st visit First consultation
1- vaccination Type Of Consultation: 102
2- Growth Monitoring
3- Antenatal care
4- Pregnancy fallow up
5- Family planning
6- Routine check up including dental care;
7- Pap. smear;
8- Mammography
9- Pre- marriage Consultation
10- Pre-employment/ traveling check up.
11- Others (Mentions..)
1- MOH Hospitals; Where did the patient go to ask for
Consultation?
103
2- MOH primary healthcare facilities
3- Specialized Medical Centers;
4- Family planning and MCH
5- HIO Hospitals and outpatient clinics;
6- Other Governmental Hospitals(Military, Police,
Electricity, Etc.;
7- CCO;
8- University Hospitals
3 Major Consultation
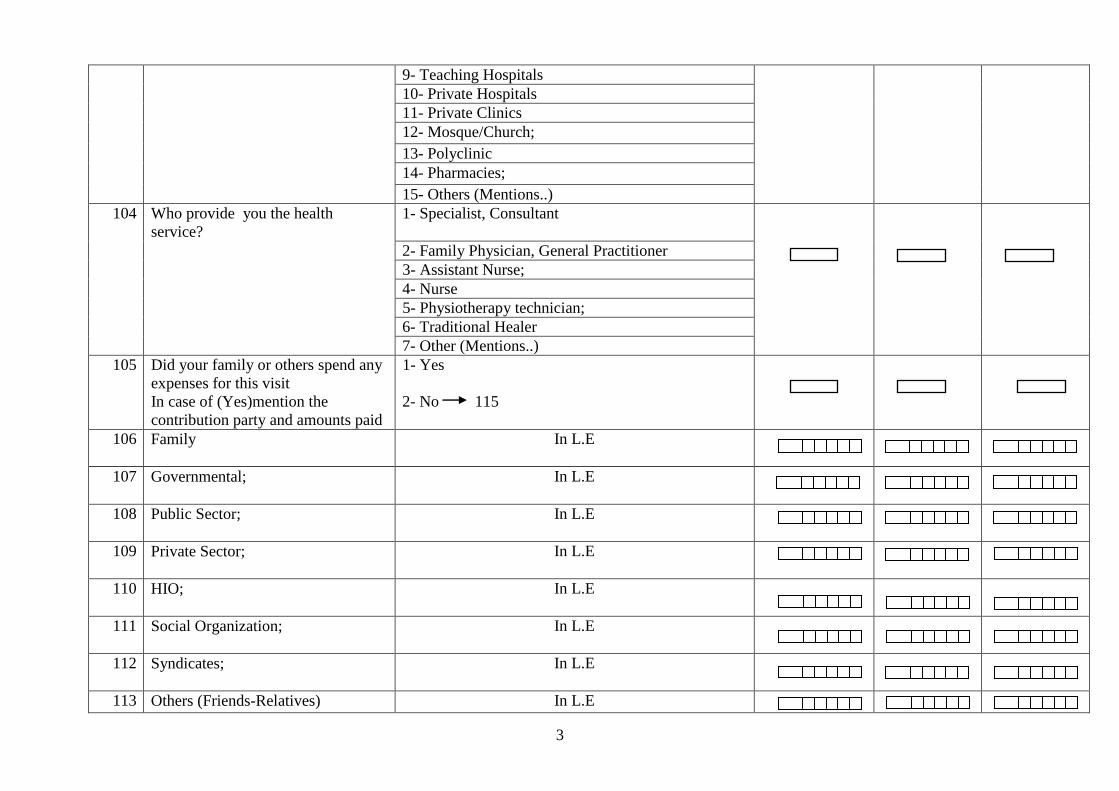
3
9- Teaching Hospitals
10- Private Hospitals
11- Private Clinics
12- Mosque/Church;
13- Polyclinic
14- Pharmacies;
15- Others (Mentions..)
1- Specialist, Consultant Who provide you the health
service?
104
2- Family Physician, General Practitioner
3- Assistant Nurse;
4- Nurse
5- Physiotherapy technician;
6- Traditional Healer
7- Other (Mentions..)
1- Yes
2- No 115
Did your family or others spend any
expenses for this visit
In case of (Yes)mention the
contribution party and amounts paid
105
In L.E Family 106
In L.E Governmental; 107
In L.E Public Sector; 108
In L.E Private Sector; 109
In L.E HIO; 110
In L.E Social Organization; 111
In L.E Syndicates; 112
In L.E Others (Friends-Relatives) 113
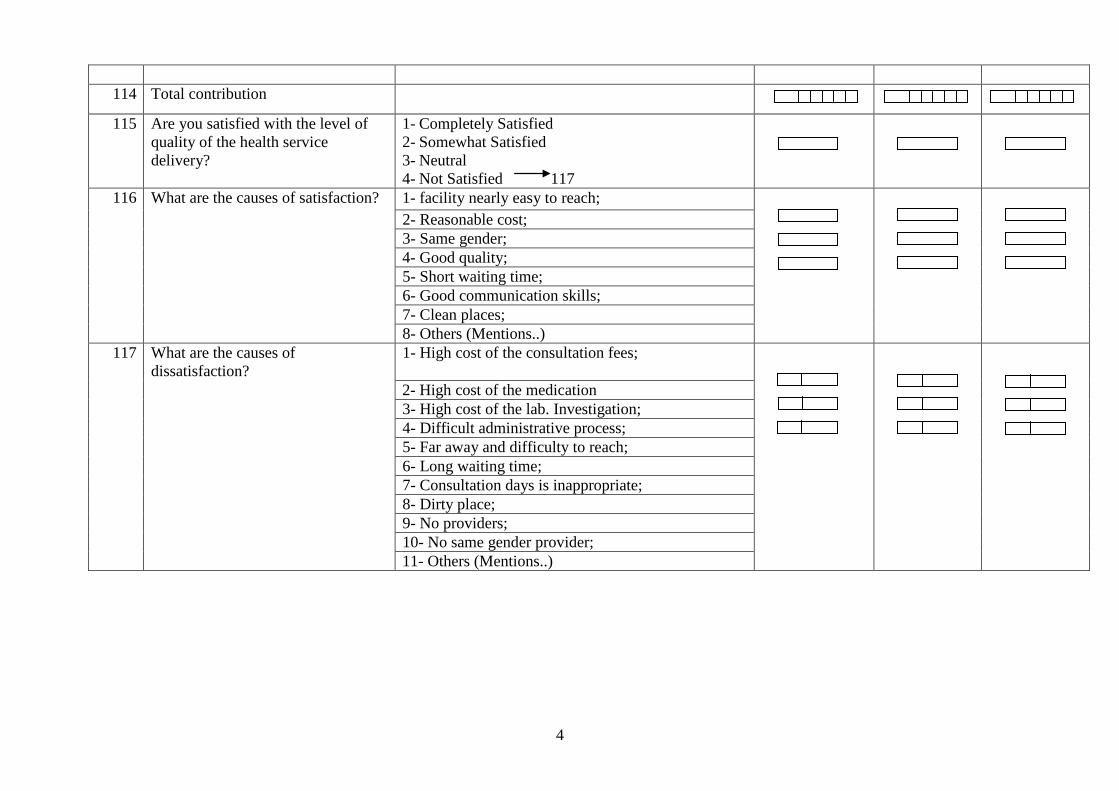
4
Total contribution 114
1- Completely Satisfied
2- Somewhat Satisfied
3- Neutral
4- Not Satisfied 117
Are you satisfied with the level of
quality of the health service
delivery?
115
1- facility nearly easy to reach; What are the causes of satisfaction? 116
2- Reasonable cost;
3- Same gender;
4- Good quality;
5- Short waiting time;
6- Good communication skills;
7- Clean places;
8- Others (Mentions..)
1- High cost of the consultation fees;
What are the causes of
dissatisfaction?
117
2- High cost of the medication
3- High cost of the lab. Investigation;
4- Difficult administrative process;
5- Far away and difficulty to reach;
6- Long waiting time;
7- Consultation days is inappropriate;
8- Dirty place;
9- No providers;
10- No same gender provider;
11- Others (Mentions..)

5
3 rd
visit 2 nd
visit 1st visit 2
nd Preventive Consultation
1- vaccination Type Of Consultation: 118
2- Growth Monitoring
3- Antenatal care
4- Pregnancy fallow up
5- Family planning
6- Routine check up including dental care;
7- Pap. smear;
8- Mammography
9- Pre- marriage Consultation
10- Pre-employment/ traveling check up.
11- Others (Mentions..)
1- MOH Hospitals; Where did the patient go to ask for
Consultation?
119
2- MOH primary healthcare facilities
3- Specialized Medical Centers;
4- Family planning and MCH
5- HIO Hospitals and outpatient clinics;
6- Other Governmental Hospitals(Military, Police,
Electricity, Etc.;
7- CCO;
8- University Hospitals
9- Teaching Hospitals
10- Private Hospitals
11- Private Clinics
12- Mosque/Church;
13- Polyclinic
14- Pharmacies;
15- Others (Mentions..)
1- Specialist, Consultant Who provide you the health
service?
120
2- Family Physician, General Practitioner

6
3- Assistant Nurse;
4- Nurse
5- Physiotherapy technician;
6- Traditional Healer
7- Other (Mentions..)
1- Yes
2- No 131
Did your family or others spend any
expenses for this visit
In case of (Yes)mention the
contribution party and amounts paid
121
In L.E Family 122
In L.E Governmental; 123
In L.E Public Sector; 124
In L.E Private Sector; 125
In L.E HIO; 126
In L.E Social Organization; 127
In L.E Syndicates; 128
In L.E Others (Friends-Relatives) 129
In L.E Total contribution 130
1-Completely Satisfied
2-Somewhat Satisfied
3-Nutral
4-Not Satisfied 133
Are you satisfied with the level of
quality of the health service
delivery?
131
1- Near facility; easy to reach; What are the causes of satisfaction? 132
2- Reasonable cost;
3- Same gender;
4- Good quality;
5- Short waiting time;
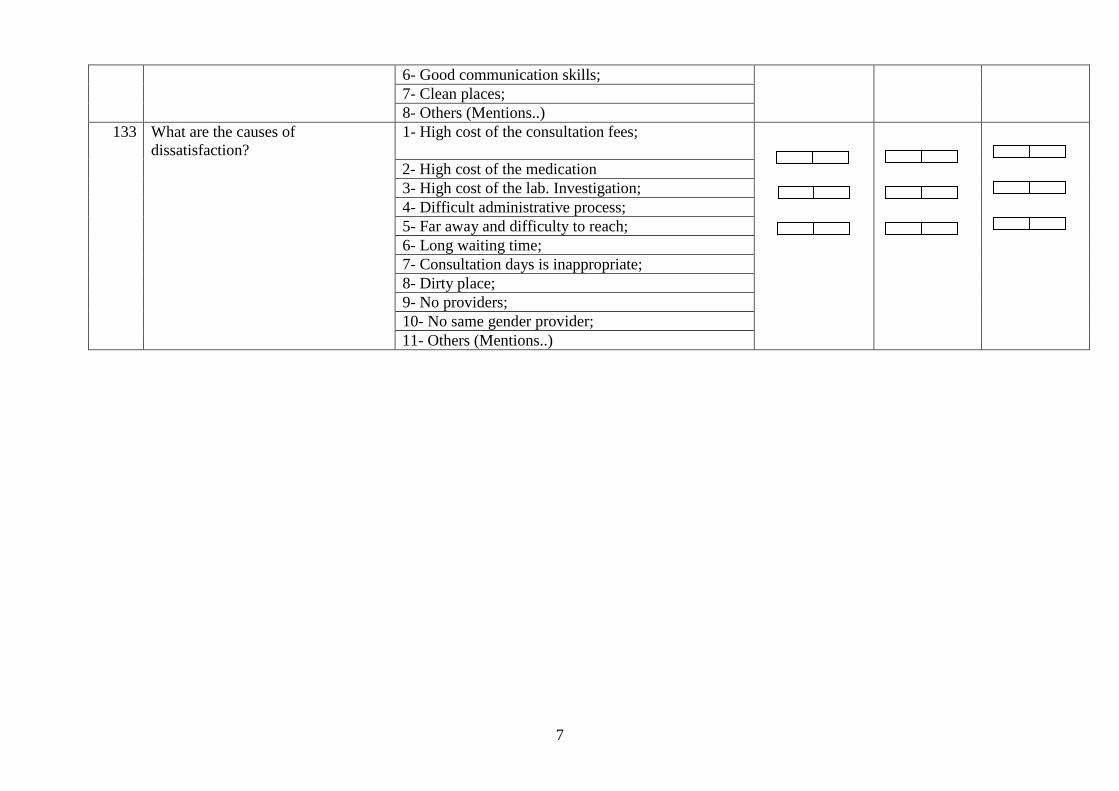
7
6- Good communication skills;
7- Clean places;
8- Others (Mentions..)
1- High cost of the consultation fees;
What are the causes of
dissatisfaction?
133
2- High cost of the medication
3- High cost of the lab. Investigation;
4- Difficult administrative process;
5- Far away and difficulty to reach;
6- Long waiting time;
7- Consultation days is inappropriate;
8- Dirty place;
9- No providers;
10- No same gender provider;
11- Others (Mentions..)

8
3 rd
visit 2 nd
visit 1st visit 3
rd Preventive Consultation
1- vaccination Type Of Consultation: 134
2- Growth Monitoring
3- Antenatal care
4- Pregnancy fallow up
5- Family planning
6- Routine check including for dental care;
7- Pap. smear;
8- Mammography
9- Pre- marriage Consultation
10- Pre-employment/ traveling check up.
11- Others (Mentions..)
1- MOH Hospitals; Where did the patient go to ask for
Consultation?
135
2- MOH primary healthcare facilities
3- Specialized Medical Centers;
4- Family planning and MCH
5- HIO Hospitals and outpatient clinics;
6- Other Governmental Hospitals(Military, Police,
Electricity, Etc.;
7- CCO;
8- University Hospitals
9- Teaching Hospitals
10- Private Hospitals
11- Private Clinics
12- Mosque/Church;
13- Polyclinic
14- Pharmacies;
15- Others (Mentions..)

9
1- Specialist, Consultant Who provide you the health
service?
136
2- Family Physician, General Practitioner
3- Assistant Nurse;
4- Nurse
5- Physiotherapy technician;
6- Traditional Healer
7- Other
1- Yes
2- No 147
Did your family or others spend any
expenses for this visit
In case of (Yes)mention the
contribution party and amounts paid
137
In L.E Family 138
In L.E Governmental; 139
In L.E Public Sector; 140
In L.E Private Sector; 141
In L.E HIO; 142
In L.E Social Organization; 143
In L.E Syndicates; 144
In L.E Others (Friends-Relatives) 145
Total contribution 146
1-Completely Satisfied
2-Somewhat Satisfied
3-Nutral
4-Not Satisfied 149
Are you satisfied with the level of
quality of the health service
delivery?
147

10
1- Near facility; easy to reach;
What are the causes of satisfaction? 148
2- Reasonable cost;
3- Same gender;
4- Good quality;
5- Short waiting time;
6- Good communication skills;
7- Clean places;
8- Others (Mentions..)
1- High cost of the consultation fees;
What are the causes of
dissatisfaction?
149
2- High cost of the medication
3- High cost of the lab. Investigation;
4- Difficult administrative process;
5- Far away and difficulty to reach;
6- Long waiting time;
7- Consultation days is inappropriate;
8- Dirty place;
9- No providers;
10- No same sex provider;
11- Others (Mentions..)
1- Yes 151
2- No (finish the questionnaire)
Is there any other health institution
nearer to your home
150
1- High cost Why didn't you go there 151
2- Difficult administrative process
3- low quality
4- Long waiting time
5- Consultation days is inappropriate
6- Dirty place;
7- No same gender provider;
8- Others (Mentions..)