efw plants and lakeside - pennon group plc€¦ · pennon group plc (“pennon group”)...
TRANSCRIPT

EfW plants and Lakeside Tuesday, 18 October 2011

Pennon Group Plc (“Pennon Group”) Disclaimers
For the purposes of the following disclaimers, references to this "document" shall mean this presentation pack and shall be deemed to include references to
the related speeches made by or to be made by the presenters, any questions and answers in relation thereto and any other related verbal or written
communications.
This document contains certain "forward-looking statements" with respect to Pennon Group's financial condition, results of operations and business and
certain of Pennon Group's plans and objectives with respect to these matters.
Forward-looking statements are sometimes, but not always, identified by their use of a date in the future or such words as "anticipates", "aims", “believes",
“continue”, "could", "due", "estimates“, "expects", "goal", “intends", "may", “plans", “project”, “seeks”, "should", "targets", “will” and related and similar
expressions, as well as statements in the future tense. By their very nature forward-looking statements are inherently unpredictable, speculative and involve
risk and uncertainty because they relate to events and depend on circumstances that will or will not occur in the future.
There are a number of factors that could cause actual results and developments to differ materially from those expressed or implied by these forward-looking
statements. These factors include, but are not limited to, changes in the economies and markets in which Pennon Group operates; changes in the regulatory
and competition frameworks in which Pennon Group operates; the impact of legal or other proceedings against or which affect Pennon Group; and changes
in interest and exchange rates.
All written or verbal forward-looking statements, made in this document or made subsequently, which are attributable to Pennon Group or any other member
of the Pennon Group or persons acting on their behalf are expressly qualified in their entirety by the factors referred to above. Pennon Group may or may not
update these forward-looking statements.
This document is not an offer to sell, exchange or transfer any securities of Pennon Group or any of its subsidiaries and is not soliciting an offer to purchase,
exchange or transfer such securities in any jurisdiction.
Without prejudice to the above, whilst Pennon Group accepts liability to the extent required by the Listing Rules, the Disclosure Rules and the Transparency
Rules of the UK Listing Authority for any information contained within this document which the Company makes publicly available as required by such Rules:
(a) neither Pennon Group nor any other member of Pennon Group or persons acting on their behalf shall otherwise have any liability
whatsoever for loss howsoever arising, directly or indirectly, from use of the information contained within this document; and
(b) neither Pennon Group nor any other member of Pennon Group or persons acting on their behalf makes any representation or
warranty, express or implied, as to the accuracy or completeness of the information contained within this document
Without prejudice to the above, no reliance may be placed upon the information contained within this document to the extent that such information is
subsequently updated by or on behalf of Pennon Group.
Past performance of securities of Pennon Group cannot be relied upon as a guide to the future performance of any securities of Pennon Group.
2

David Dupont
Group Director of Finance
3

• Pennon Group Plc is a large FTSE 250 which operates and invests in utility
infrastructure businesses. The Group is committed to:
- sustainable development
- enhancing the environment and
- providing high quality customer services
• We have around £4.1 billion assets and employ over 4,300 people
• The Group has two principal subsidiaries:
- South West Water provides water and sewerage services in Devon, Cornwall
and parts of Dorset and Somerset
- Viridor is one of the UK‟s leading recycling, renewable energy and waste
management businesses
Pennon Group PlcOverview
4

Pennon Group PlcInvestment Characteristics
• Top end of FTSE 250
• Clearly focussed strategy
• Steady growth with exposure to resource/cyclical upswings
• Index linked asset base
• Defensive
• Strong SRI credentials

Colin Drummond
Chief Executive, Viridor Ltd
6

Viridor – Overview
From Waste to Resource
Our strategy is to grow and add value by:
• proactively developing new recycling operations to meet ambitious EU/UK targets
• successfully exploiting the huge potential in waste-based renewable energy
generation
• capitalising on our strong position in landfill
Key business statistics:
• 324 operating units including:
− 26 Materials Recycling Facilities
− 83 Household Waste Recycling Centres
− 15 Composting/organics sites
− 3 Energy from Waste plants
− 34 Landfill gas power plants
− 2 Anaerobic Digestion plants
• More than 90 local authority waste contracts
• c3,100 employees
• 46% of 2010/11 profits from recovering value in waste
7
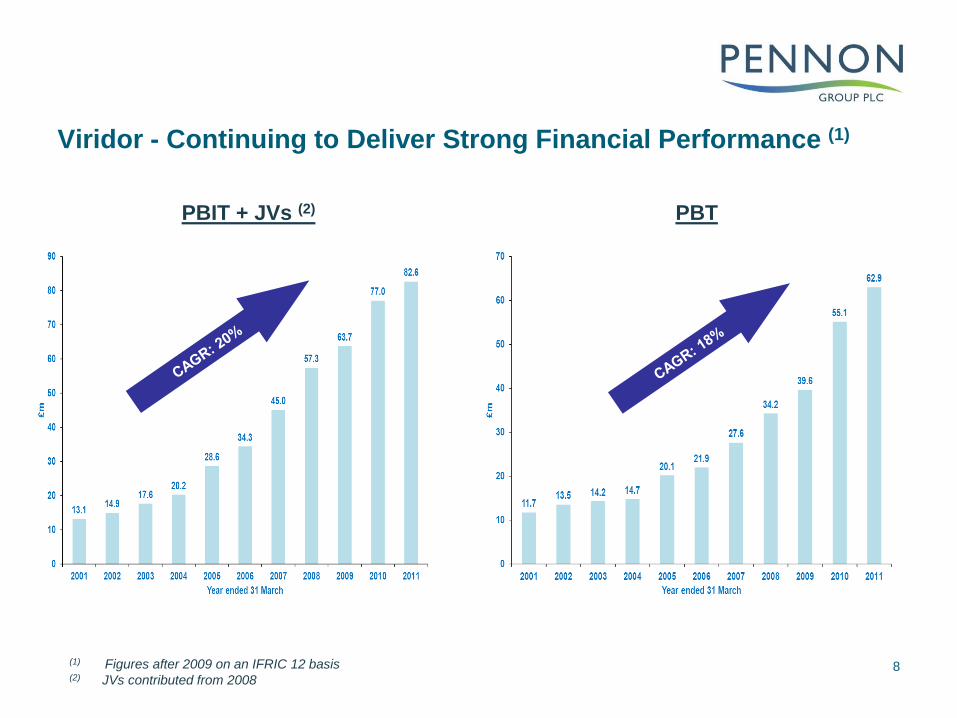
Viridor - Continuing to Deliver Strong Financial Performance (1)
(1) Figures after 2009 on an IFRIC 12 basis(2) JVs contributed from 2008
PBIT + JVs (2) PBT
8

9
Viridor – Profit Contribution by Segment
(1) Contribution plus joint ventures (share of PAT and interest) before intangibles and overheads (including pensions)(2) “Contracts” includes West Sussex PFI, Lakeside and Greater Manchester sub-contracts, other municipal contracts and sludge
contracts and “Other” includes asset disposals(3) Including more than 2% energy generation / recycling in JVs and Contracts & Other
• Business continues successfully to evolve
• 46% of profits from recovering value in waste (3)
Year ended 31 March 2001 Year ended 31 March 2011

Recovering Energy from Waste - 1
10
• A form of biomass
• Two routes
− methane gas (landfill gas and anaerobic digestion)
− combustion technologies
• Waste already accounts for 1.5% of UK electricity
− comparable to wind
− 1.2% landfill gas
− 0.3% combustion
• Unlike wind
− provides base load power (80 to 90% load factors)
− is distributed round grid near users of energy
− is by-product of required waste treatment which is paid for
• Unlike biomass crops we are not requiring agricultural land to be used to
produce a fuel and imported to UK

Recovering Energy from Waste - 2
• EU Landfill Directive requires major reduction in amount of waste going to landfill
− which will need instead to be used for energy generation
− UK government targets imply at least 15m tonnes energy from waste capacity
by 2020 compared to 5m tonnes currently
− supported by steeply rising landfill tax (to £80 per tonne by 2014/15)
• Large EfW plants will be substantially cheaper than landfill in 2014/15
• Planning permissions difficult to obtain
− likely to result in on going capacity shortage (and healthy gate fees)
• Waste could readily account for 6% of UK electricity by 2015 (i.e. 40% of our
15% renewable target)
− in longer term according to ICE and IME could account for 15% to 20% of total
UK electricity
• Situation further enhanced if you recover surplus heat
− e.g. Viridor/Laing/Ineos plant at Runcorn, Europe‟s most advanced waste CHP
scheme
− but requires nearby user of heat
11

Viridor – Renewable Energy
• 137MW operating capacity at 31 March 2011 (compared to 28MW in 2001)
− LFG (108MW), EfW (27MW), AD (2MW)
• Additional 60MW EfW under construction
• Four large EfW plants giving a further 1.3m tonnes/120MW achieved planning
consent over past year
• Target over 300MW total operational capacity in five years time
− c. 2.25m tonnes EfW capacity
• Typical large EfW plant costs c. £200m
− projected to generate c. £25m EBITDA and c. £15m PBIT in first full year,
increasing thereafter
− profit per tonne around 10 times the level in landfill
• Strong financing position as part of Pennon Group
− major advantage versus our competitors in a very attractive capital intensive
sector
12

Andrew Kirkman
Finance Director, Viridor
13

Overview of current and pipeline EfWsMap of geographic locations
14
Lakeside
Oxford
AvonmouthExeter
Trident Park
Runcorn II
Bolton
Dunbar
Operational
Planning permission secured
In construction
Runcorn I
Viridor‟s other operational sites
within its four regional businesses
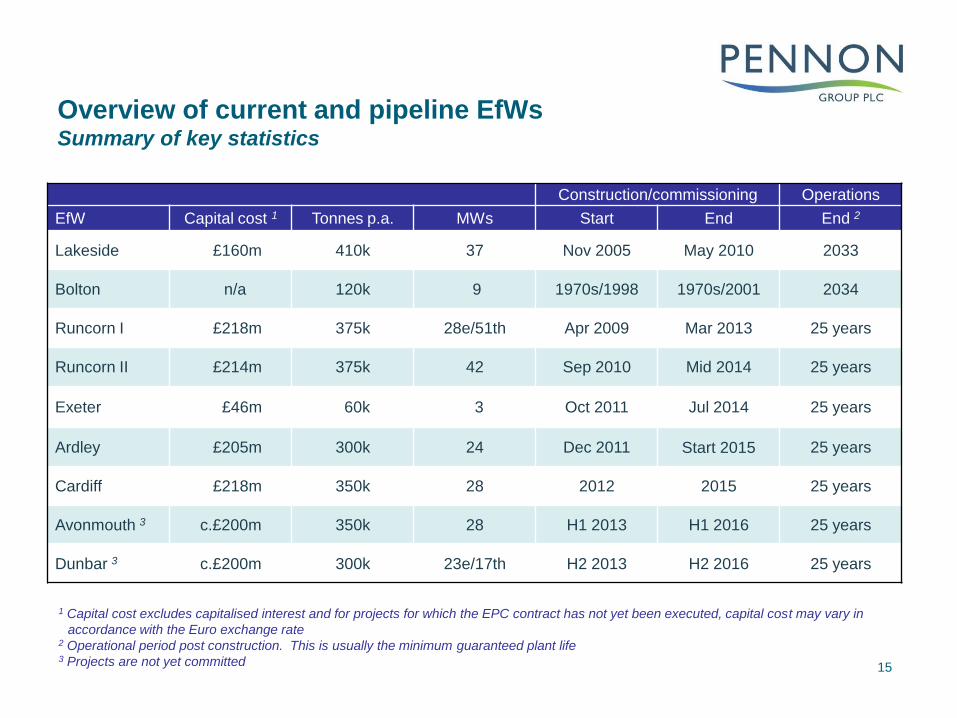
Overview of current and pipeline EfWsSummary of key statistics
15
Construction/commissioning Operations
EfW Capital cost 1 Tonnes p.a. MWs Start End End 2
Lakeside £160m 410k 37 Nov 2005 May 2010 2033
Bolton n/a 120k 9 1970s/1998 1970s/2001 2034
Runcorn I £218m 375k 28e/51th Apr 2009 Mar 2013 25 years
Runcorn II £214m 375k 42 Sep 2010 Mid 2014 25 years
Exeter £46m 60k 3 Oct 2011 Jul 2014 25 years
Ardley £205m 300k 24 Dec 2011 Start 2015 25 years
Cardiff £218m 350k 28 2012 2015 25 years
Avonmouth 3 c.£200m 350k 28 H1 2013 H1 2016 25 years
Dunbar 3 c.£200m 300k 23e/17th H2 2013 H2 2016 25 years
1 Capital cost excludes capitalised interest and for projects for which the EPC contract has not yet been executed, capital cost may vary in
accordance with the Euro exchange rate2 Operational period post construction. This is usually the minimum guaranteed plant life3 Projects are not yet committed

Overview of current and pipeline EfWsKey points to note
16
• Viridor has significant (and increasing) construction management and
operational expertise
• Construction and commissioning risk passed to EPC contractor – Lakeside delay
did not disadvantage Viridor
• The ratio of waste to generation capacity varies depending on:
1. Scale
2. Calorific value
3. Combined heat and power
• In addition, Viridor:
had 108MW of landfill gas generation capacity as at 31 March 2011;
is building 4 Anaerobic Digesters (“AD”) with 2MW capacity each as part of the 50%
owned Greater Manchester PFI. 2 now complete;
will start building a 1MW AD plant at Walpole, Somerset in early 2012; and
is proposing using existing sites for PPP bids e.g. Project Green but will build further
generating capacity in support of PPPs e.g. Glasgow, South London if client driven

Overview of current and pipeline EfWsViridor’s energy generation capacity – summary
Total Viridor
EfW Energy capacity (MW) Waste capacity (kt) Viridor share Energy capacity (MW) Waste capacity (kt)
Operational today
Landfill gas 108 n/a 100% 108 n/a
Lakeside 37 410 50% 18.5 205
Bolton 9 120 100% 9 120
2* GM ADs 4 100 50% 2 50
Total 158 630 137.5 375
Operational by 2014
2*GM ADs 4 100 50% 2 50
Runcorn I CHP 51375
20% 10.275
Runcorn I EfW 28 20% 5.6
Runcorn II EfW 42 375 100% 42 375
Walpole AD 1 30 100% 1 30
Exeter 3 60 100% 3 60
Total 129 940 63.8 590
Operational by 2016
Ardley 24 300 100% 24 300
Cardiff 28 350 100% 28 350
Avonmouth 1 28 350 100% 28 350
Dunbar – EfW 1 23300
100% 23300
Dunbar – CHP 1 17 100% 17
Total 120 1,300 120 1,300
Overall total 407 2,870 321.3 2,265
171 Projects are not yet committed

Accounting for EfWsKey considerations
1. Financing structure
− EfWs funded by project finance are off balance sheet, remainder are
corporately financed and on balance sheet
− financing structure comprises debt, subordinated debt and equity
2. Equity ownership
− JV projects are equity accounted with Viridor share of PAT included within
operating profit. Sub debt interest receipt is shown separately
− wholly owned projects are subsidiary accounted
3. Relationship with PPPs
− EfWs entirely linked to PPPs are accounted for, as with other PPPs, as
service concessions in accordance with IFRIC12
− all other EfWs are accounted as fixed assets in accordance with IAS16
18

Accounting for EfWsSummary of different accounting treatments
Project or corporate
finance
Equity or subsidiary
accountedIAS16 vs IFRIC12
Lakeside Project Equity IAS16
Bolton Corporate Subsidiary IAS16
Runcorn I Project Equity IAS16
Runcorn II Corporate Subsidiary IAS16
Exeter Corporate Subsidiary IFRIC12
Ardley Corporate Subsidiary IAS16
Cardiff Corporate Subsidiary IAS16
Avonmouth Corporate Subsidiary IAS16
Dunbar Corporate Subsidiary IAS16
19
1 Note other PPP projects, not including EfWs, are accounted for under IFRIC 12. These are Greater Manchester and West Sussex
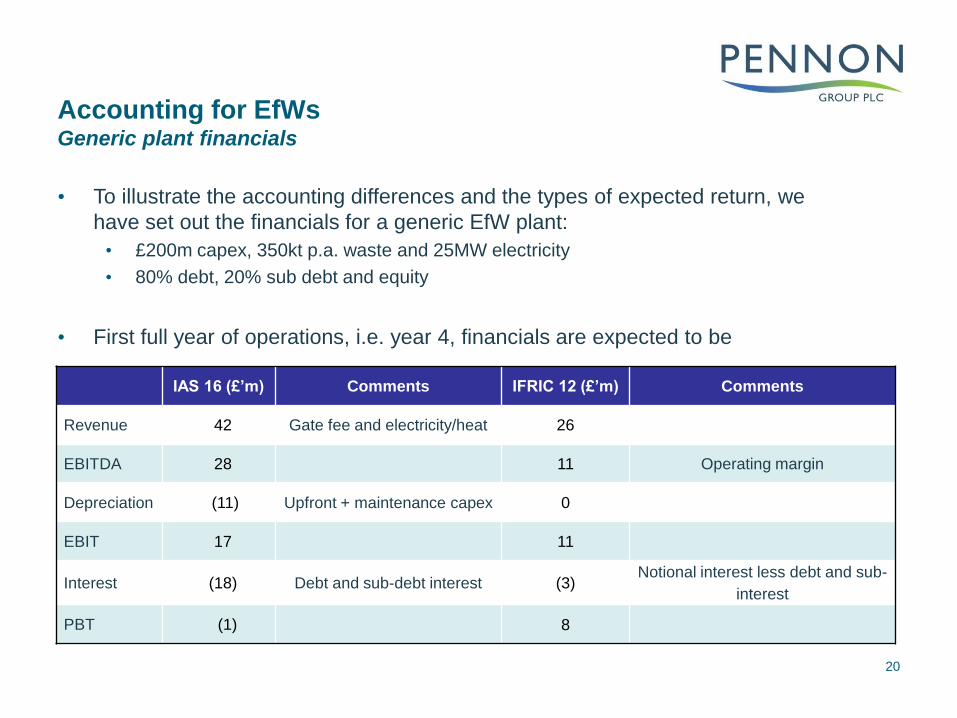
Accounting for EfWsGeneric plant financials
IAS 16 (£’m) Comments IFRIC 12 (£’m) Comments
Revenue 42 Gate fee and electricity/heat 26
EBITDA 28 11 Operating margin
Depreciation (11) Upfront + maintenance capex 0
EBIT 17 11
Interest (18) Debt and sub-debt interest (3)Notional interest less debt and sub-
interest
PBT (1) 8
20
• To illustrate the accounting differences and the types of expected return, we
have set out the financials for a generic EfW plant:
• £200m capex, 350kt p.a. waste and 25MW electricity
• 80% debt, 20% sub debt and equity
• First full year of operations, i.e. year 4, financials are expected to be

Accounting for EfWsGeneric plant financials – Profit profiles
• Profits over the life of the projects should increase with inflation
• PBT under IAS 16 increases as debt and sub-ordinated debt are repaid, IFRIC 12
has a more constant notional interest calculation
21
Generic EfW EBITDA under IFRIC 12 vs IAS 16 Generic EfW PBT under IFRIC 12 vs IAS 16

Accounting for EfWsGeneric plant financials – Cash flow
22
• The chart below shows the expected shareholder cash in-flows and out-flows
over the life of the project – the accounting treatment does not affect cash flows

Valuation of EfWsValuation methodologies
Methodology Comment
Multiple of EBITDA
• EBITDA depends on accounting method (IFRIC12 or IAS 16)
• Does not take account of asset life length
Multiple of book value
• Historic rather than forward measure
• Affected by dividend pay-outs
23
• There are a variety of different valuation techniques available to value EfWs but
those based on accounting measures have significant flaws:
• As a consequence our preferred approach is based on cash flow, either
More complicated – DCF (Discounted Cash Flow); or
More simplistic – Return on invested capital vs cost of capital

Valuation of EfWsKey DCF inputs
Inputs Comments
Revenues
• Gate Fee EfW needs to be economically attractive compared to rising landfill costs. Costs are
expected to be over £100/t by 1 April 2014 (£80/t landfill tax and gate fee)
• Energy price 2012 spot price is £53MWh and most forecasters expect this to rise in excess of
inflation. In addition embedded benefits such as TRIADs
• Renewable incentives Where possible secure RHI going forward, ROCs secured as relevant
Costs
• Labour Costs of running waste handling operations and energy generation
• Maintenance/lifecycle Maintenance capex significantly lower than depreciation
• Consumables/overheads Reagent costs such as lime and carbon. Disposal of bottom ash offset by metal
recycling revenues. Administration costs
Discount rates
• Risk adjusted rate of return Targeted minimum 8% real after tax project return
24
• The key assumptions driving cash flow and returns are:
• Return dependant on financing structure mix and costs of debt and equity

Valuation of EfWsReturn on invested capital vs cost of capital
(£’m) Cost of capital
Real discount
rate
8% 7% 6% 5% 4%
Nominal discount rate 11.2% 10.2% 9.2% 8.2% 7.1%
Pro
jec
t ra
te
of
retu
rn
8% 11.2% 0 16 35 58 84
9% 12.3% 15 33 54 79 107
10% 13.3% 31 51 74 100 131
25
• As stated, Viridor targets a minimum 8% real after tax project return
• The table sets out the value creation for the same generic EfW plant, assuming:
• £200m capital spend evenly over 3 years
• 25 year operating life
• 3% inflation
• The table above also sets out the value creation if a 9% or 10% real rate of
return is achieved, either through an improved position at financial close and/or
operational improvements

Valuation of EfWsUpsides/risks
26
• The ultimate value of these EfWs is dependent on Viridor‟s ability to outperform
base case assumptions and manage risks
• Viridor believes that there will be a shortage of EfW capacity and as a result
merchant capacity will be particularly attractive
• In addition, to reduce waste availability risk, Viridor seeks to tie up long term
baseload contracts and PPPs connected with EfWs
• building EfWs which have contracted PPP tonnage allows for the construction of larger
plants, which are cheaper for local authorities and de-risked for Viridor
• In addition to increasing revenues and reducing costs, Viridor will also explore:
• extending plant lives/repowering (e.g. Bolton, Runcorn II)
• refinancing projects both from corporate to project finance and existing project financed
schemes
• disposing of stakes to alternative equity holders with lower cost of capital/return criteria
whilst Viridor retains the operating contract

Appendix 1Lakeside EfW - Summary
• Waste capacity and supply: 410kt (all merchant). Supply split between Viridor,
Grundon and Lakeside
• Energy: 37MWe
• Capital expenditure: £160m
• Build profile: Start – November 2005. End – May 2010 (Expected 36 months,
actual 54 months)
• Operating life: 25 years
• Construction contractor: Takuma / BAM Nuttall
• Operating contractor: Fortum until January 2013 and then Lakeside
• Plant ownership: 50% Viridor, 50% Grundon. Grundon option to buy in 203327

Appendix 1Bolton EfW - Summary
• Waste capacity and supply: 120kt (all supplied by via the Greater Manchester PFI)
• Energy: 9MWe
• Capital expenditure: n/a
• Build profile: As an incinerator: start – 1970s, end – 1970s. Energy recovery: start –
1998, end – 2001
• Operating life: 2034 concession ends
• Construction contractor: n/a
• Operating contractor: Viridor
• Plant ownership: 100% Viridor. Non-reverting28
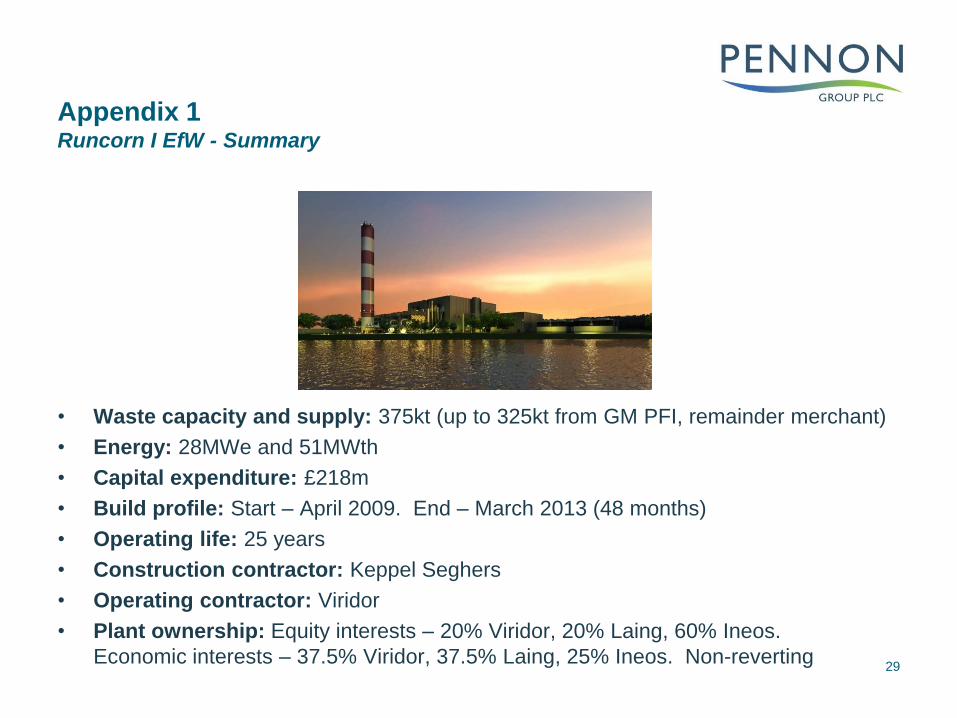
Appendix 1Runcorn I EfW - Summary
• Waste capacity and supply: 375kt (up to 325kt from GM PFI, remainder merchant)
• Energy: 28MWe and 51MWth
• Capital expenditure: £218m
• Build profile: Start – April 2009. End – March 2013 (48 months)
• Operating life: 25 years
• Construction contractor: Keppel Seghers
• Operating contractor: Viridor
• Plant ownership: Equity interests – 20% Viridor, 20% Laing, 60% Ineos.
Economic interests – 37.5% Viridor, 37.5% Laing, 25% Ineos. Non-reverting29

Appendix 1Runcorn II EfW - Summary
• Waste capacity and supply: 375kt (all merchant)
• Energy: 42MWe
• Capital expenditure: £214M
• Build profile: Start – September 2010. End – Mid 2014 (45-48 months)
• Operating life: 25 years
• Construction contractor: Keppel Seghers
• Operating contractor: Viridor
• Plant ownership: 100% Viridor. Non-reverting 30

Appendix 1Exeter EfW - Summary
• Waste capacity and supply: 60kt (all contracted with Devon County Council)
• Energy: 3MWe
• Capital expenditure: £46M
• Build profile: Start – October 2011. End – July 2014 (33 months)
• Operating life: 30 year concession
• Construction contractor: TIRU SA
• Operating contractor: TIRU SA 1st 5 years, Viridor thereafter
• Plant ownership: 100% Viridor. Reverts to Devon County Council after 30 years 31

Appendix 1Ardley EfW - Summary
• Waste capacity and supply: 300kt (c.150kt contracted for 25 years with Oxford
City Council via Oxfordshire PPP)
• Energy: 24 MWe supplied to the National Grid – enough to power 24% of Cherwell
District Council‟s needs
• Capital expenditure: £205m
• Build profile: Start date - December 2011. End date – Start 2015 (36-38 months)
• Operating life: 25 years
• Construction contractor: CNIM / Clugston
• Operating contractor: Viridor (4 year supervisory contract with CNIM)
• Plant ownership: 100% Viridor. Non-reverting32
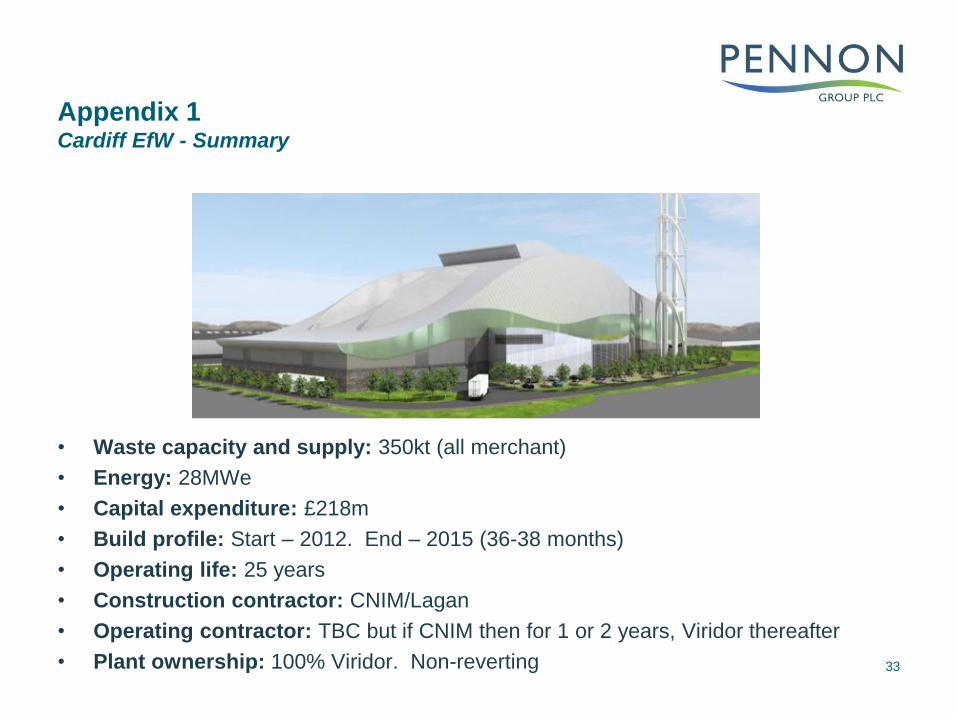
Appendix 1Cardiff EfW - Summary
• Waste capacity and supply: 350kt (all merchant)
• Energy: 28MWe
• Capital expenditure: £218m
• Build profile: Start – 2012. End – 2015 (36-38 months)
• Operating life: 25 years
• Construction contractor: CNIM/Lagan
• Operating contractor: TBC but if CNIM then for 1 or 2 years, Viridor thereafter
• Plant ownership: 100% Viridor. Non-reverting 33

Appendix 1 Avonmouth EfW - Summary
• Waste capacity and supply: 350kt (all merchant)
• Energy: 28MWe
• Capital expenditure: c.£200m
• Build profile: Start – H1 2013. End – H1 2016 (36 months)
• Operating life: 25 years
• Construction contractor: TBA
• Operating contractor: Viridor
• Plant ownership: 100% Viridor. Non-reverting 34

Appendix 1Dunbar EfW - Summary
• Waste capacity and supply: 300kt (all merchant)
• Energy: 23MWe and 17MWth
• Capital expenditure: c.£200m
• Build profile: Start – H2 2013. End – H2 2016 (36 months)
• Operating life: 25 years
• Construction contractor: TBA
• Operating contractor: Viridor
• Plant ownership: 100% Viridor. Non-reverting 35
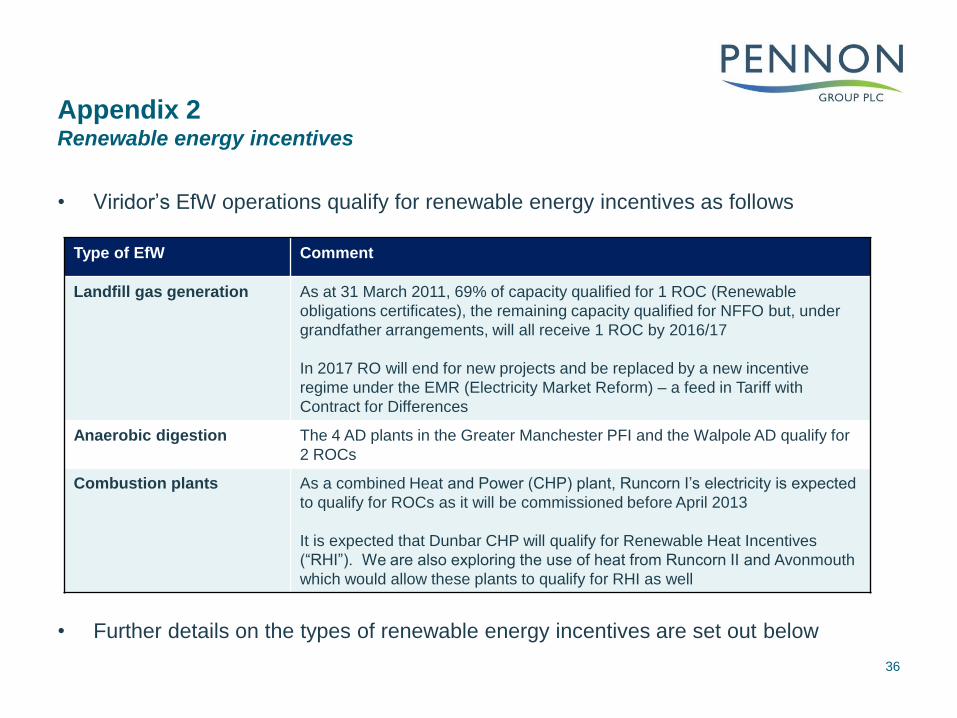
Appendix 2Renewable energy incentives
Type of EfW Comment
Landfill gas generation As at 31 March 2011, 69% of capacity qualified for 1 ROC (Renewable
obligations certificates), the remaining capacity qualified for NFFO but, under
grandfather arrangements, will all receive 1 ROC by 2016/17
In 2017 RO will end for new projects and be replaced by a new incentive
regime under the EMR (Electricity Market Reform) – a feed in Tariff with
Contract for Differences
Anaerobic digestion The 4 AD plants in the Greater Manchester PFI and the Walpole AD qualify for
2 ROCs
Combustion plants As a combined Heat and Power (CHP) plant, Runcorn I‟s electricity is expected
to qualify for ROCs as it will be commissioned before April 2013
It is expected that Dunbar CHP will qualify for Renewable Heat Incentives
(“RHI”). We are also exploring the use of heat from Runcorn II and Avonmouth
which would allow these plants to qualify for RHI as well
36
• Viridor‟s EfW operations qualify for renewable energy incentives as follows
• Further details on the types of renewable energy incentives are set out below

Appendix 2Renewable energy incentives
ROC
• Certification scheme introduced by the Government under the Renewables
Obligation as the main way of supporting the production of „green‟ electricity in the
UK
• Will be replaced by EMR
• Value of ROC estimated to be circa £42/MWh and stabilised by 10% headroom
• Managed by OFGEM - applications, accreditation and issue of certificates
• Issues for conventional EfW
GQCHP required – limited opportunity to repeat a Runcorn due to high heat sink demand
No new EfW will qualify past expected deadline of April 2013 – will be RHI
Value related to biogenic energy content of the input waste some past difficulty in
establishment (14C method now approved though)
Technical challenge as more heat take off reduced electricity production and therefore ROC
income
For Runcorn 28MW in CHP mode c.f. 42MW as power only
• Advanced Conversion Technologies ACT – can get up to 2 ROCs/MWh but
technology less well established except for AD37

Appendix 2Renewable energy incentives
RHI
• Certification scheme introduced by the Government under the Renewables
Obligation as the main way of supporting the use of „green‟ heat in the UK
• Managed by OFGEM
• Ring fenced budget (capped for a period)
• Value £26/MWh thermal but only for bio-energy content
• Under serious investigation for Lakeside
• Issues for EfW
Need a major heat user or district heating scheme but all heat applicable (c.f. need for
GQCHP as ROCS)
Still not quite implemented in the UK – State aid review
Currently not applicable to C&I waste or less than 50% biomass – being challenged as
“absurd”
Supply of heating will be highest when power prices highest balance between heat revenue
and lost power revenue needs to be considered
LEC
• Applies to low carbon energy sources, typically EfW gets 50% on export
• Current “raw” value £4.85 per MWh38

Appendix 3Technical background
Permitting
• Plant needs an Environmental Permit to operate
• Awarded and regulated by the Environment Agency
• Covers all aspect of the environmental impact of EfW operations, waste inputs,
emissions to air/ground/water
• Delivers compliance with Waste Incineration Directive (WID) – currently very strict
• Risks
Lengthy application and review process
Potential challenge from protesters
Industrial Emissions Directive – will replace WID currently unclear if any adverse impact as
not defined
39
Appendix 3Technical background
WRATE
• WRATE (Waste and Resources Assessment Tool for the Environment) software compares the environmental impacts of different municipal waste management systems. Approved by the Environment Agency.
• Normally required as part of a PPP bid – not specific to any individual EfW plant
R1
• Is an energy efficiency calculation from the Waste Framework Directive which has been transposed into the Environmental Permitting Regulations.
• Purpose to define whether or not an EfW is recovery or disposal
• For new plants R1 index of 0.65 required. NB this is not a %age efficiency
• Voluntary not mandatory (unless waste is transferred from another country)
• Reviewed annually so status could be lost if there are any major changes
• Viridor plants do meet most recent R1 criteria (except Exeter due to small scale and Bolton due to scale and age of technology)
• Not deemed critical to any current Viridor contracts
40

Appendix 4The planning process
• Planning applications for EfW‟s producing >50MW of electricity are considered by
the Infrastructure Planning Commission (soon to be consumed by the Planning
Inspectorate)
• Planning applications for EfW‟s producing<50MW of electricity are considered by the
relevant local planning authority
• Any planning application for an EfW will have to be accompanied by an
Environmental Statement as required by the Environmental Impact Assessment
Regulations. It takes approximately 12 months to collect the necessary
environmental data and prepare an application ready for submission to the local
planning authority
• Once submitted the planning authority undertakes a full consultation process that
informs the planning officer‟s report to his/her planning committee which will contain
a recommendation for approval or refusal. Depending on the issues raised during
the consultation process it can take between 6 and 18 months for an application to
be reported to planning committee for a decision
41

Appendix 4The planning process (continued)
• If a planning committee grants planning permission, it is normal that it will be subject to a long list
of planning conditions and a legal agreement. Planning permission cannot be issued until the
legal agreement has been signed. Once the planning permission has been issued any legal
challenge to the decision must be made within 3 months. Any legal challenge will be considered
by the High Court and any subsequent challenge to its decision can find its way to the Court of
Appeal and beyond
• If a planning committee refuses planning permission, the applicant has a right of appeal to the
Secretary of State which must be made within 6 months of the date of the refusal. An appeal for
an EfW will normally be heard at a public Inquiry with the decision being made by an independent
inspector from the Planning Inspectorate. Where an application is considered to be of more than
local interest, the Secretary of State can recover the decision. In such instances following the
completion of a public inquiry, rather than making a decision, the inspector will make his/her
recommendation to the Secretary of State. Whether it is issued by the Planning Inspectorate or
the Secretary of State the decision letter acts as the planning permission. Once issued, any legal
challenge to the Secretary of State‟s decision must be made within 6 weeks. Any legal challenge
will be considered by the High Court and any subsequent challenge to its decision can find its
way to the Court of Appeal and beyond
42
