efficient method for color iris localization · efficient method for color iris localization esraa...
TRANSCRIPT
Daway et al. Iraqi Journal of Science, 2016, Vol. 57, No.1A, pp: 253-261
____________________________
*Email: [email protected]
253
Efficient Method for Color Iris Localization
Esraa G. Daway1*
, Loay E.George2, Radhi Sh.Hamoudi
1
1Department of Physics, College of Education, Almustanserya University, Baghdad, Iraq 2Department of Computer Science, College of Science, University of Baghdad, Baghdad, Iraq
Abstract
Iris detection is considered as challenging image processing task. In this study
efficient method was suggested to detect iris and recognition it. This method
depending on seed filling algorithm and circular area detection, where the color
image converted to gray image, and then the gray image is converted to binary
image. The seed filling is applied of the binary image and the position of detected object binary region (ROI) is localized in term of it is center coordinates are radii
(i.e., the inner and out radius). To find the localization efficiency of suggested
method has been used the coefficient of variation (CV) for radius iris for evaluation.
The test results indicated that is suggested method is good for the iris detection.
Keywords: iris, localization, Isolation, recognition.
القزحيه الملونه لتحديد الفعاليهالطريقة
1، راضي شدهان الطويل2، لؤي ادور جورج*1دواي اسراء كاطع العراق بغداد، ،ية التربيه ، الجامعه المستنصريهقسم الفيزياء ، كل1
العراق بغداد، كلية العلوم، جامعة بغداد، قسم الحاسبات،2
الخالصه،في هذه الدراسه تم اقتراح ان تميز القزحيه له دور مهم في كثير من تطبيقات المعالجه الصوريه
تحويل الصوره الملونه الى صور ذات محشو البذره وكشف الدائره ،حيث يتطريقة خوارزميه جديده تعتمد على تدرجات رماديه ومن ثم يتم تحويلها الى ثنائيه وطبقت عليها حشو البذره تم تحديد مواقع كشف الدائري في
ره االصليه . من اجل استخراج القزحيه فقط لمعرفة كفاءة هذه الطريقه الصوره الثنائيه والتي اسقطت على الصو المقترحه تم اعتماد مقياس معامل التباين لنصف القطر ومن خالله تبين ان الطريقه المقترحه هي طريقه جيده.
1. Introduction
With the increasing emphasis on security, automated personal identification based on
biometrics has been receiving extensive attention over the past decade. Biometrics aims to
accurately identify each individual using different physiological or behavioral characteristics, such as fingerprints, iris, face, retina, gait, palm-prints and hand geometry (Jain et al., 1999;
Zhang,2000). Recently, iris recognition is becoming an active topic in biometrics due to its high
reliability for personal identification [1] (Jain et al., 1999; Mansfield et al. 2001; Daugman, 2003). Iris
localization is a key step in iris recognition; it isolates the iris part in eye image by detecting both the inner and outer boundaries of iris area. The overall performance of an iris recognition
system is highly related to the localization accuracy [2]. The accurate pupil detection, as the
inner iris boundary, is the most important and the first step in iris localization (Kheirolahy et al., 2009). Numerous methods were proposed to locate the pupil; they based on the fact that
the pupil edge can be estimated as circular shape.
ISSN: 0067-2904 GIF: 0.851
Daway et al. Iraqi Journal of Science, 2016, Vol. 57, No.1A, pp: 253-261
254
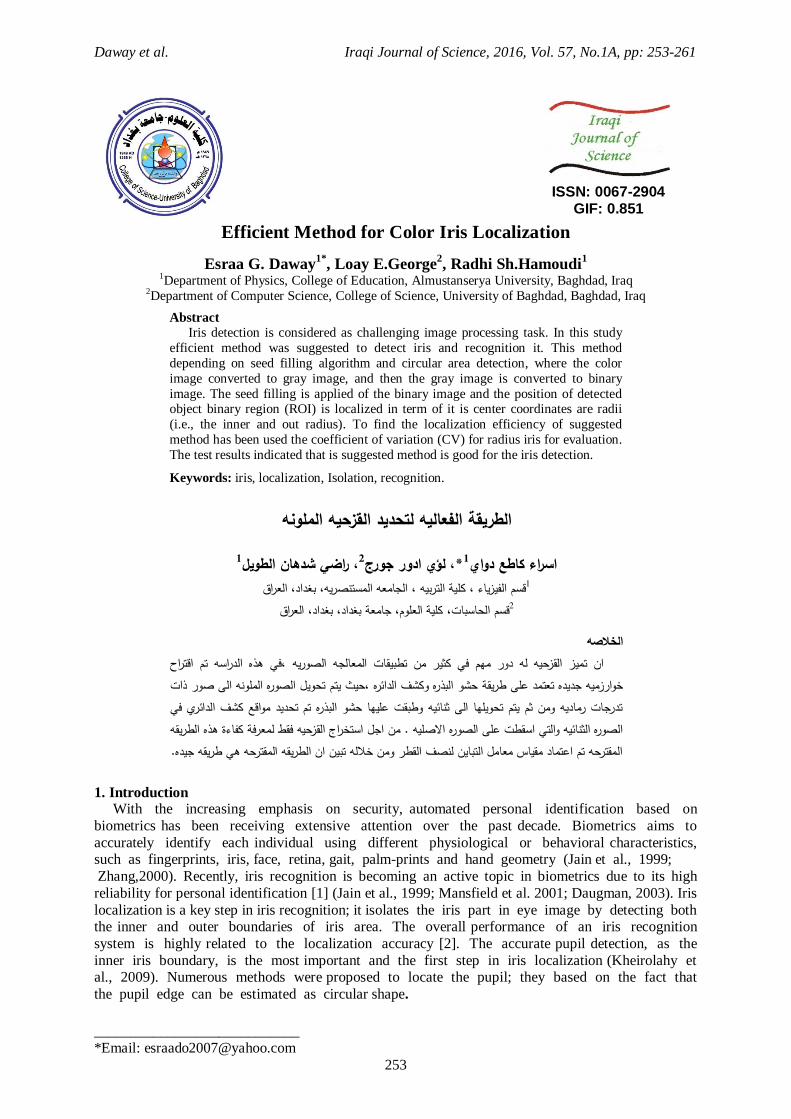
2. The Iris
Human eye iris is a visible color ring bounded by the pupil (the dark opening) and white sclera, as
depicted in Figure-1.
Figure 1- Anterior surface of the iris
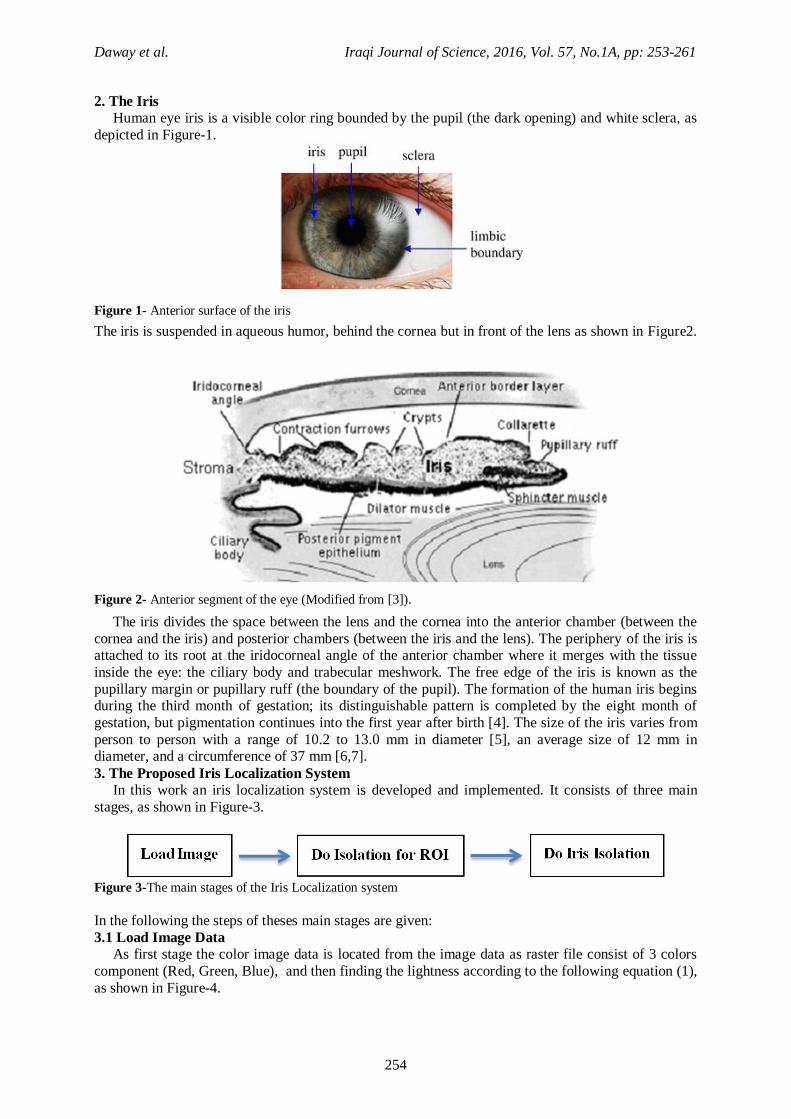
The iris is suspended in aqueous humor, behind the cornea but in front of the lens as shown in Figure2.
Figure 2- Anterior segment of the eye (Modified from [3]).
The iris divides the space between the lens and the cornea into the anterior chamber (between the
cornea and the iris) and posterior chambers (between the iris and the lens). The periphery of the iris is attached to its root at the iridocorneal angle of the anterior chamber where it merges with the tissue
inside the eye: the ciliary body and trabecular meshwork. The free edge of the iris is known as the
pupillary margin or pupillary ruff (the boundary of the pupil). The formation of the human iris begins during the third month of gestation; its distinguishable pattern is completed by the eight month of
gestation, but pigmentation continues into the first year after birth [4]. The size of the iris varies from
person to person with a range of 10.2 to 13.0 mm in diameter [5], an average size of 12 mm in diameter, and a circumference of 37 mm [6,7].
3. The Proposed Iris Localization System
In this work an iris localization system is developed and implemented. It consists of three main
stages, as shown in Figure-3.
Figure 3-The main stages of the Iris Localization system
In the following the steps of theses main stages are given:
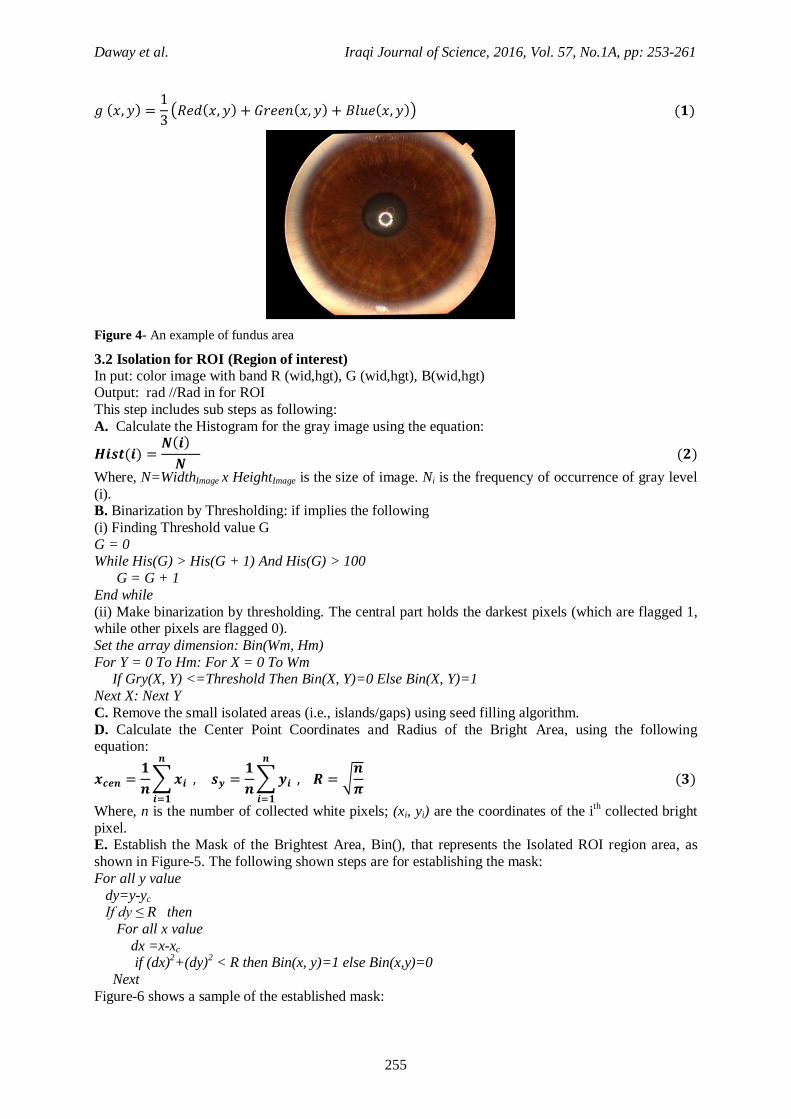
3.1 Load Image Data As first stage the color image data is located from the image data as raster file consist of 3 colors
component (Red, Green, Blue), and then finding the lightness according to the following equation (1),
as shown in Figure-4.
Daway et al. Iraqi Journal of Science, 2016, Vol. 57, No.1A, pp: 253-261
255
( )
( ( ) ( ) ( )) ( )
Figure 4- An example of fundus area
3.2 Isolation for ROI (Region of interest)
In put: color image with band R (wid,hgt), G (wid,hgt), B(wid,hgt) Output: rad //Rad in for ROI
This step includes sub steps as following:
A. Calculate the Histogram for the gray image using the equation:
( ) ( )
( )
Where, N=WidthImage x HeightImage is the size of image. Ni is the frequency of occurrence of gray level
(i). B. Binarization by Thresholding: if implies the following
(i) Finding Threshold value G
G = 0 While His(G) > His(G + 1) And His(G) > 100 G = G + 1
End while
(ii) Make binarization by thresholding. The central part holds the darkest pixels (which are flagged 1, while other pixels are flagged 0).
Set the array dimension: Bin(Wm, Hm)
For Y = 0 To Hm: For X = 0 To Wm If Gry(X, Y) <=Threshold Then Bin(X, Y)=0 Else Bin(X, Y)=1
Next X: Next Y
C. Remove the small isolated areas (i.e., islands/gaps) using seed filling algorithm.
D. Calculate the Center Point Coordinates and Radius of the Bright Area, using the following equation:
∑
∑ √
( )
Where, n is the number of collected white pixels; (xi, yi) are the coordinates of the ith
collected bright
pixel. E. Establish the Mask of the Brightest Area, Bin(), that represents the Isolated ROI region area, as
shown in Figure-5. The following shown steps are for establishing the mask:
For all y value
dy=y-yc If dy ≤ R then
For all x value
dx =x-xc if (dx)
2+(dy)
2 < R then Bin(x, y)=1 else Bin(x,y)=0
Next
Figure-6 shows a sample of the established mask:

Daway et al. Iraqi Journal of Science, 2016, Vol. 57, No.1A, pp: 253-261
256
Figure 5- The isolation of ROI as circle region
Figure 6- The Mask Image output of do Isolation for ROI (Region of interest)
3.3 Iris Isolation In put: G (wid,hgt), B(wid,hgt) with size x,y
Output: Iris Isolation.
In this stage the iris is isolated from the ROI region by using following steps:
A. Calculate the Mean (m) & Standard Deviation (σ) [8] of the Pixels belong to ROI by applying equations (4) and (5).
For all x and y values DO
If Bin (x,y)=1
∑ ( ) ( )
√∑ ( )
( )
B. Apply Linear Contrast Stretching and calculate the mean of the established stretched image, the
applied Contrast Stretching for gray image was performed only on the pixels belong to ROI .The stretching step is applied using the following equation (6):
{
( )
( )
Where, Min=m–σ and Max=m+σ.
C. Do Binarization by Thresholding: The gray image is converted to binary image using the mean
value as threshold value. For all x value
For all y value
If Bin(X, Y) = 1 Then If tImg(X, Y) >= Mean Then tImg(X, Y) = 1 Else tImg(X, Y) = 0
End if
Next y
Next x
Daway et al. Iraqi Journal of Science, 2016, Vol. 57, No.1A, pp: 253-261
257
D. Do Tiling; Repeatedly, to remove the white points appeared in the binary image, after converting
the image to binary, the image conform two regions as same circle (white and background black). The
edge region includes some noise points, to remove this point we used tiling:
tImg(X, Y)=Tiling(Ics (X,Y)) E. Apply seed filling to remove gaps and islands in the iris region [9].
F. Remove the boundary points using a window (with size 3x3):
Set Bin(X,Y)=1 iff (x,y) is a location not close to boundary of the region Otherwise set Bin(X,Y)=0
G. By using the modified mask, Bin(), re-establish the binary image from the gray image.
H. Invert the Binary Representation of the binary image using the following: If Bin(X, Y) = 1 Then tImg(X, Y) = 1 - tImg(X, Y)
I. Determine the Center Coordinates (Xcen, Ycen) and Radius (Rd) for the iris pixels (i.e., the pixels
whose binary value is 1):
Set Sx=0: Sy=0: n=0 For all X ϵ [0, ImgWid-1]
For all Y ϵ [0, ImgHgt-1]
If Bin(X, Y)=1 and tImg(X, Y)=1 Then Sx=Sx+X: Sy=Sy+Y: n=n+1
End if
Next Y Next X
√
J. Apply Radial Scan to Collect the External Boundary points, and then determine the radius array,
Rad ().
K. Determine the mean (Rmean) and standard deviation (σradius) of all Radii collected within all sectors. L. Re-determine the center coordinates (Xcen, Ycen) and radius values (Rd), to get more Accurate
Values. The following criterion has been applied to filter out the abnormal radii elements values and
then re-determine the parameters (Xcen, Ycen, Rd):
| ( ) |
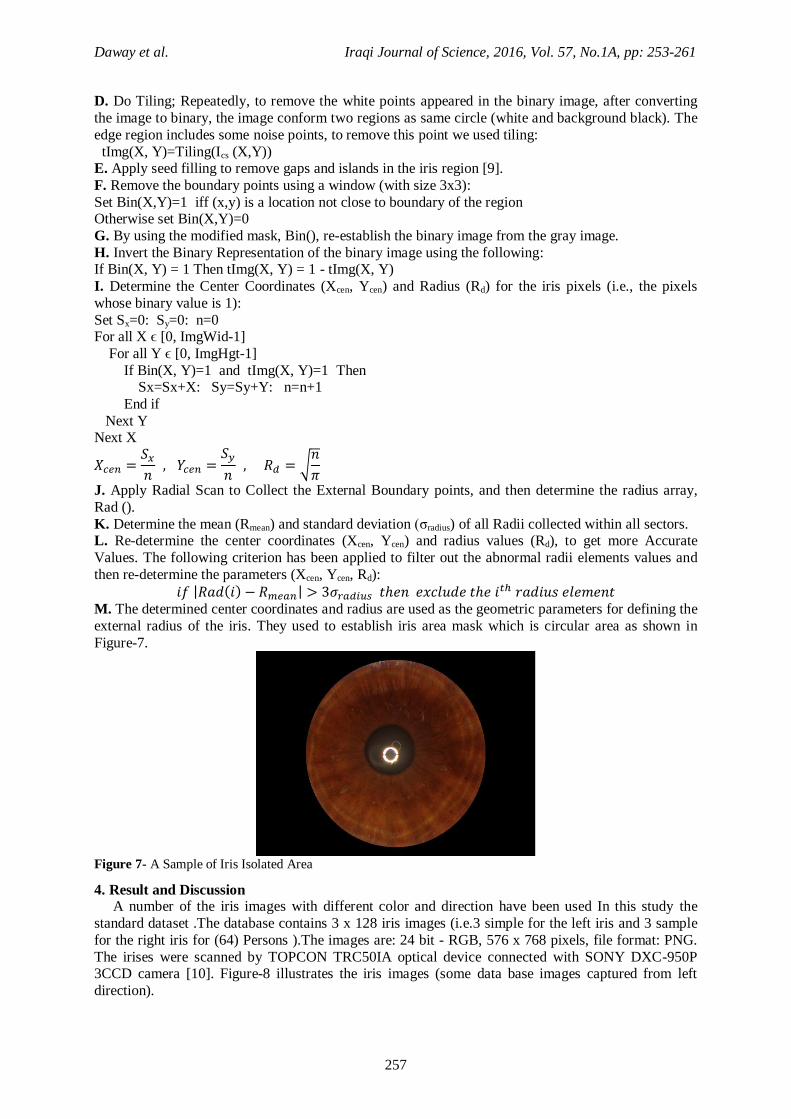
M. The determined center coordinates and radius are used as the geometric parameters for defining the
external radius of the iris. They used to establish iris area mask which is circular area as shown in
Figure-7.
Figure 7- A Sample of Iris Isolated Area
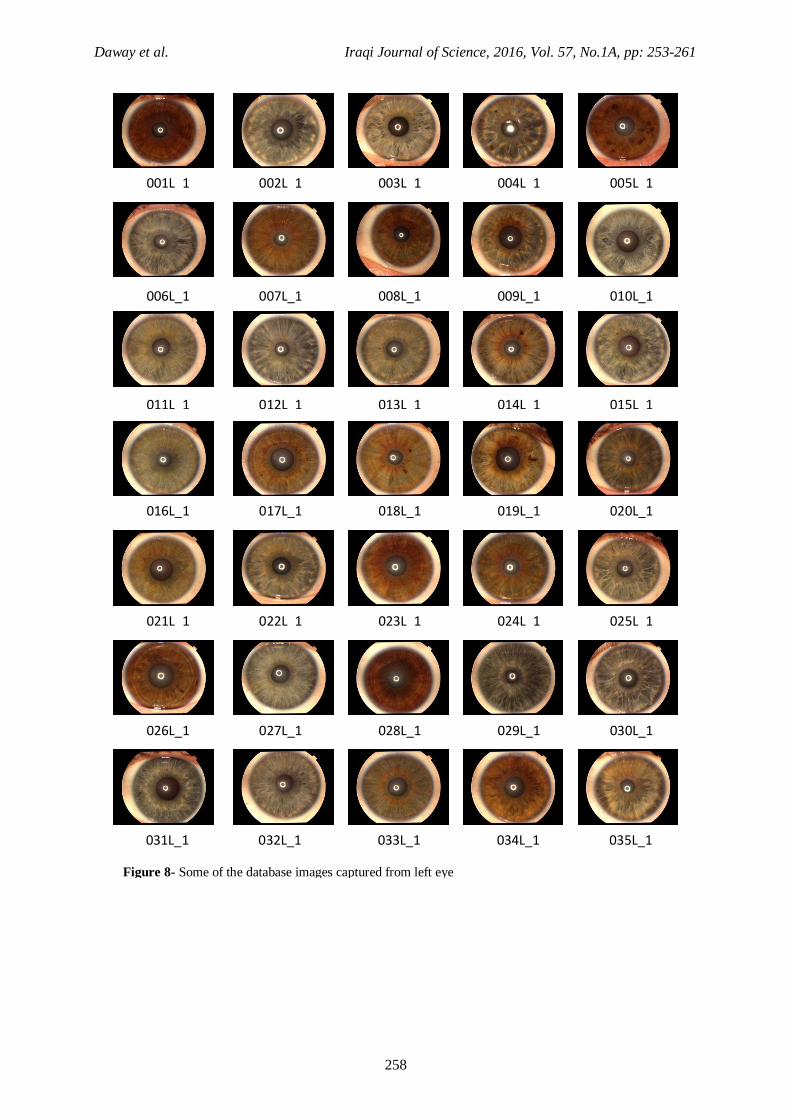
4. Result and Discussion A number of the iris images with different color and direction have been used In this study the
standard dataset .The database contains 3 x 128 iris images (i.e.3 simple for the left iris and 3 sample
for the right iris for (64) Persons ).The images are: 24 bit - RGB, 576 x 768 pixels, file format: PNG.
The irises were scanned by TOPCON TRC50IA optical device connected with SONY DXC-950P 3CCD camera [10]. Figure-8 illustrates the iris images (some data base images captured from left
direction).
Daway et al. Iraqi Journal of Science, 2016, Vol. 57, No.1A, pp: 253-261
258
001L_1 002L_1 003L_1 004L_1 005L_1
006L_1 007L_1 008L_1 009L_1 010L_1
011L_1 012L_1 013L_1 014L_1 015L_1
016L_1 017L_1 018L_1 019L_1 020L_1
021L_1 022L_1 023L_1 024L_1 025L_1
026L_1 027L_1 028L_1 029L_1 030L_1
031L_1 032L_1 033L_1 034L_1 035L_1
Figure 8- Some of the database images captured from left eye
Daway et al. Iraqi Journal of Science, 2016, Vol. 57, No.1A, pp: 253-261
259
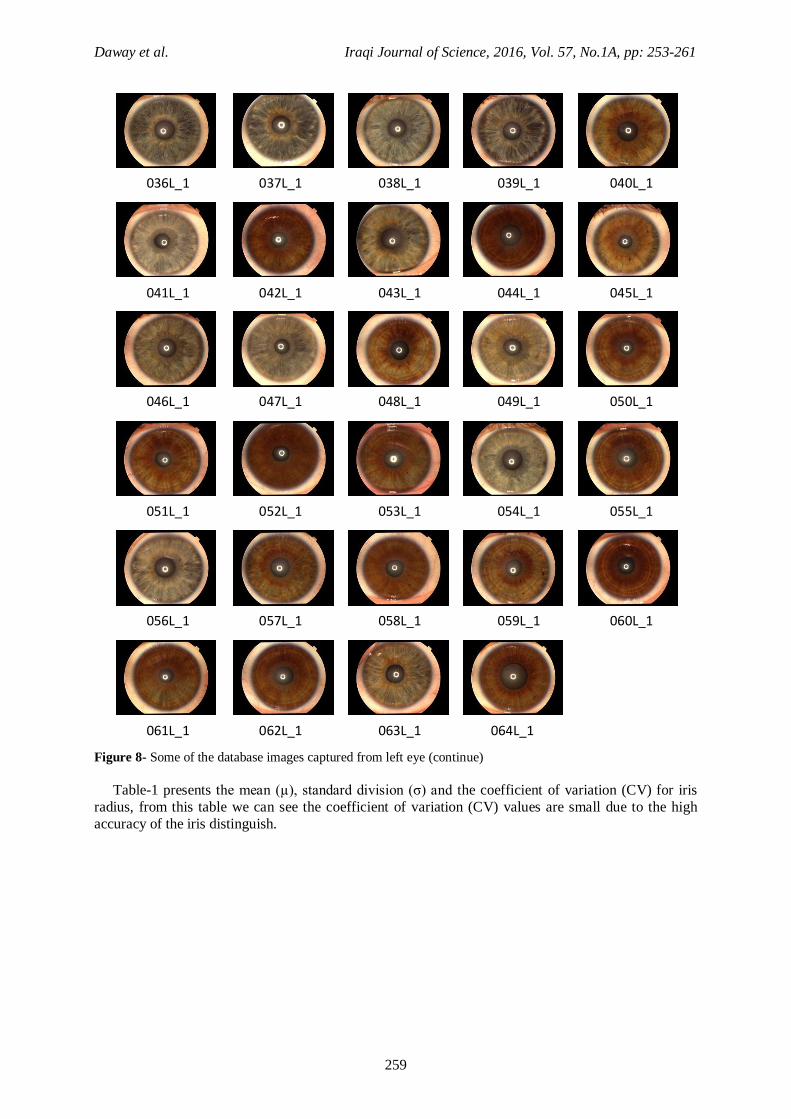
Figure 8- Some of the database images captured from left eye (continue)
Table-1 presents the mean (µ), standard division (σ) and the coefficient of variation (CV) for iris
radius, from this table we can see the coefficient of variation (CV) values are small due to the high
accuracy of the iris distinguish.
036L_1 037L_1 038L_1 039L_1 040L_1
041L_1 042L_1 043L_1 044L_1 045L_1
046L_1 047L_1 048L_1 049L_1 050L_1
051L_1 052L_1 053L_1 054L_1 055L_1
056L_1 057L_1 058L_1 059L_1 060L_1
061L_1 062L_1 063L_1 064L_1

Daway et al. Iraqi Journal of Science, 2016, Vol. 57, No.1A, pp: 253-261
260
Table 1- The mean (µ), standard division (σ) and coefficient of variation (CV) for determined iris radius
No. μ σ C.V No. μ σ C.V
1 245.366 4.063 0.0166 33 248.368 1.274 0.0051
2 243.913 1.316 0.0054 34 244.900 0.640 0.0026
3 244.601 7.140 0.0292 35 250.723 2.668 0.0106
4 249.300 2.848 0.0114 36 248.887 3.205 0.0129
5 246.774 3.062 0.0124 37 251.006 2.736 0.0109
6 244.507 2.887 0.0118 38 258.747 9.022 0.0349
7 254.618 1.246 0.0049 39 260.230 8.644 0.0332
8 238.187 4.879 0.0205 40 260.230 8.644 0.0142
9 238.669 3.778 0.0158 41 247.494 6.028 0.0244
10 246.709 3.147 0.0128 42 244.542 1.910 0.0078
11 246.826 2.226 0.0090 43 256.918 3.676 0.0143
12 250.206 1.543 0.0062 44 241.571 6.236 0.0258
13 251.216 5.188 0.0206 45 241.964 4.595 0.0190
14 253.342 3.458 0.0136 46 252.530 4.724 0.0187
15 250.129 1.341 0.0054 47 244.215 2.025 0.0083
16 250.615 6.202 0.0247 48 245.878 2.505 0.0102
17 249.464 1.931 0.0077 49 243.708 0.993 0.0041
18 246.205 3.627 0.0147 50 243.127 1.796 0.0074
19 246.936 17.125 0.0693 51 247.568 2.560 0.0103
20 249.239 8.309 0.0333 52 247.118 5.847 0.0237
21 239.916 4.128 0.0172 53 256.499 4.504 0.0176
22 252.797 1.151 0.0046 54 249.274 5.239 0.0210
23 245.984 1.211 0.0049 55 246.530 3.032 0.0123
24 250.573 1.257 0.0050 56 251.315 4.922 0.0196
25 238.714 9.779 0.0410 57 251.695 1.651 0.0066
26 249.314 2.452 0.0098 58 238.648 3.805 0.0159
27 253.718 1.576 0.0062 59 245.966 5.402 0.0220
28 243.645 4.908 0.0201 60 238.216 6.852 0.0288
29 246.618 3.864 0.0157 61 249.473 5.221 0.0209
30 241.315 4.190 0.0174 62 241.229 1.399 0.0058
31 253.175 7.484 0.0296 63 252.406 3.863 0.0153
32 248.888 1.775 0.0071 64 251.038 3.1469 0.0125
Figure-9 shows the histogram of the iris radii computed from the database images. The distribution is close to Gaussian (normal) distribution.
Figure 9- The histogram of the determined iris radius

Daway et al. Iraqi Journal of Science, 2016, Vol. 57, No.1A, pp: 253-261
261
5. Conclusion
In this study an efficient suggested method for iris detection for iris images. The results indicated the
coefficient of variation (CV) normal distribution, and we can see the suggested algorithm has High
accuracy in the iris detection.
References
1. Li Ma, Tieniu Tan, and Fellow. 2004. Efficient Iris Recognition by Characterizing Key Local
Variations. IEEE Transactions on Image Processing,13(6). 2. Jarjes, A.A., Kuanquan Wang , and Mohammed, G.J. 2010.Iris localization: Detecting accurate
pupil contour and localizing limbus boundary. IEEE, 1:349 - 352.
3. Davis-Silberman, N., and Ashery-Padan, R. 2008. Iris Development Vertebrates Genetic and Molecular Considerations, Brain Research, 1192(5):1728.
4. Muron, A. and Pospisil, J. 2000. The Human Iris Structure and Its Usages. 39:87-95.
5. Caroline, P. J. and André, M. P. 2002. The Effect of Corneal Diameter on Soft Lens Fitting,
Part1, Contact Lens Spectrum,17(4): 56. 6. Somying Thainimit, Luís A. Alexandre, and Vasco M. N. de Almeida. 2013. Iris Surface
Deformation and Normalization, IEEE, pp:501 – 506, 4-6.
7. Forrester J. V., Dick, A. D., McMenamin, P. G., and Lee, W. R. 2001. The Eye: Basic Sciences in Practice, W.B. Saunders.
8. Maurice D., Weir, and Joel Hass. 2010. Thomas Calculus Early Transcendentals, Twelfth
Edition, Pearson Education. 9. Henrich, D.1993. Space-Efficient Region Filling in Raster Graphics. The Visual Computer: An
International Journal of Computer Graphics.
10. Michal Dobeš and Libor Machala, Iris Database, website: http://www.inf.upol.cz/iris/.