efficient hop id based routing for sparse ad hoc networks yao zhao 1, bo li 2, qian zhang 2, yan...
Post on 20-Dec-2015
215 views
TRANSCRIPT

Efficient Hop ID based Routing for Sparse Ad Hoc Networks
Yao Zhao1, Bo Li2, Qian Zhang2,
Yan Chen1, Wenwu Zhu31 Lab for Internet & Security Technology, Northwestern University
2 Hong Kong University of Science and Technology
3 Microsoft Research Asia

Outline
• Motivation
• Hop ID and Distance Function
• Dealing with Dead Ends
• Evaluation
• Conclusion

Dead End Problem
• Geographic distance dg fails to reflect hop distance dh (shortest path length)
E DS
A
),(),( DEdDAd hh
),(),( DAdDEd gg
But

Fabian Kun, Roger Wattenhofer and Aaron Zollinger, Mobihoc 2003
GFG/GPSR
GOAFR+
bett
erw
orse
1
2
3
4
5
6
7
8
9
0 2 4 6 8 10 12
Network Density [nodes per unit disk]
Sh
ort
est
Pa
th S
pa
n
0
0.1
0.2
0.3
0.4
0.5
0.6
0.7
0.8
0.9
1
Fre
qu
en
cy
critical
Greedy success
Connectivity
Geographic routing suffers from dead end problem in sparse networks
Motivation

Related Work to Dead End Problem
• Fix dead end problem– Improves face routing: GPSR, GOAFR+, GPVF
R– Much longer routing path than shortest path
• Reduce dead ends“Geographic routing without location inform
ation” [Rao et al, mobicom03] – Works well in dense networks– Outperforms geographic coordinates if obstacle
s or voids exist– Virtual coordinates are promising in reducing de
ad ends– However, degrades fast as network becomes sp
arser

• Motivation
• Hop ID and Distance Function
• Dealing with Dead Ends
• Evaluation
• Conclusion
Outline

Virtual Coordinates
• Problem definition– Define and build the virtual
coordinates, and– Define the distance function based
on the virtual coordinates– Goal: routing based on the virtual
coordinates has few dead ends even in critical sparse networks • virtual distance reflects real distance• dv ≈ c · dh , c is a constant
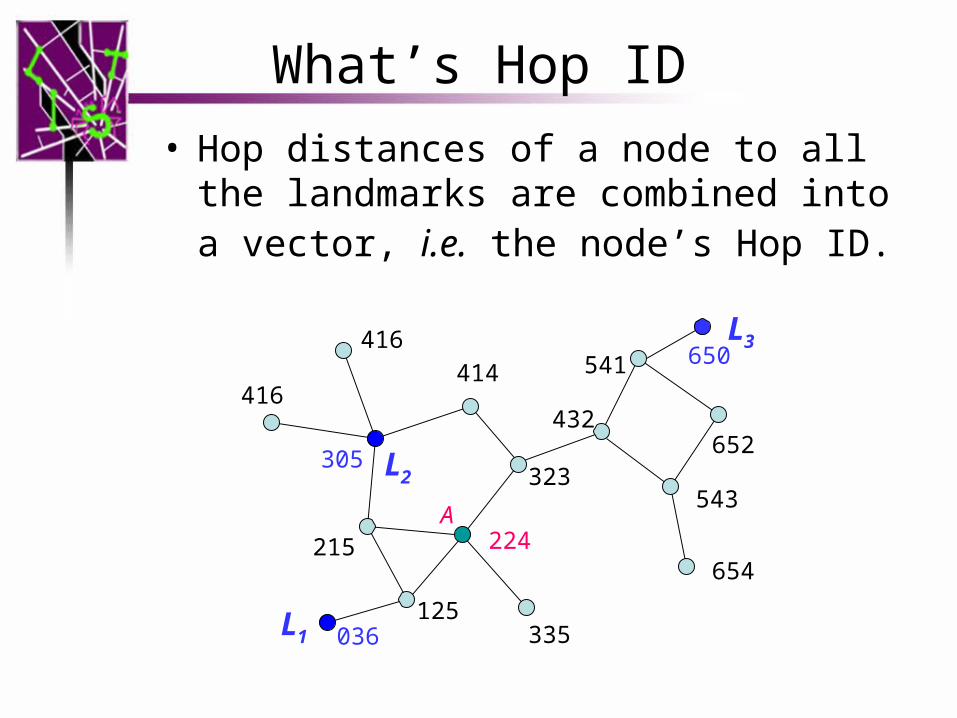
What’s Hop ID
• Hop distances of a node to all the landmarks are combined into a vector, i.e. the node’s Hop ID.
224
215
036
125335
L1
305
L2
416
416 41
4
323
432
541
L3650
652
543
654
A

Lower and Upper Bounds
• Hop ID of A is• Hop ID of B is
),,,( )1()1(2
)1(1 mHHH
),,,( )2()2(2
)2(1 mHHH
),(),(),( BAdLBdLAd hihih
),(|),(),(| BAdLBdLAd hihih
UHHMindHHMaxL kkk
hkkk
)(|)(| )2()1()2()1(
A
B
Li
• Triangulation inequality
(1)
(2)

How Tight Are The Bounds?
• Theorem [FOCS'04)]– Given a certain number (m) of
landmarks, with high probability, for most nodes pairs, L and U can give a tight bound of hop distance • m doesn’t depend on N, number of
nodes
– Example: If there are m landmarks, with high probability, for 90% of node pairs, we have U≤1.1L

Lower Bound Better Than Upper Bound
• One example: 3200 nodes, density λ=3π• Lower bound is much closer to hop distance
LU
0
0.1
0.2
0.3
0.4
0.5
Pe
rce
nta
ge
Lower bound vs Upper bound
L
U
Difference to Hop Distance
0 1 23 4 >4

650
Lower Bound Still Not The Best
• H(S) = 2 1 5• H(A) = 2 2 4• H(D) = 5 4 3• L(S, D) = L(A, D) = 3• |H(S) – H(D)|= 3 3 2• |H(A) – H(D)|= 3 2 1 22
4215
036
125335
L1
305
L2
416
416 41
4
323
432
541
L3
652
543
654
S DA

Other Distance Functions
• Make use of the whole Hop ID vector
• If p = ∞,
• If p = 1,
• If p = 2,
• What values of p should be used?
p
m
k
pkkp HHD
1
)2()1( ||
m
kkkp HHD
1
)2()1( ||
m
kkkp HHD
1
2)2()1( ||
LDp

The Practical Distance Function
• The distance function d should be able to reflect the hop distance dh
– d ≈ c · dh , c is a constant– L is quite close to dh (c = 1)
• If p = 1 or 2, Dp deviates from L severely and arbitrarily
• When p is large, Dp ≈ L ≈ dh
– p = 10, as we choose in simulations

Power Distance Better Than Lower Bound
LDp
0
0.1
0.2
0.3
0.4
0.5
0.6
0.7
0.8
0.9
Pe
rce
nta
gePower distance vs Lower bound
L
Dp
Difference to Hop Distance
[0,1) [1,2) [2,3)[3, 4) [4,5) ≥5
• 3200 nodes, density λ=3π

Outline
• Motivation
• Hop ID and Distance Function
• Dealing with Dead Ends
• Evaluation
• Conclusion

Dealing with Dead End Problem
• With accurate distance function based on Hop ID, dead ends are less, but still exist
• Landmark-guided algorithm to mitigate dead end problem– Send packet to the closest landmark to
the destination– Limit the hops in this detour mode
• Expending ring as the last solution

Example of Landmark Guided Algorithm
224
215
036
125335
L1
305
L2416
416 41
4
323
432
541
L3650
652
543
654
S
DDp(L2, D)>Dp(S,D)Dead End
P
Detour
Mode
Greedy
Mode
A
Dp(S, D)>Dp(A, D)

Practical Issues
• Landmark selection– O(m·N) where m is the number of landm
arks and N is the number of nodes
• Hop ID adjustment– Mobile scenarios– Integrate Hop ID adjustment process int
o HELLO message (no extra overhead)
• Location server– Can work with existing LSes such as CA
RD, or– Landmarks act as location servers

Outline
• Motivation
• Hop ID and Distance Function
• Dealing with Dead Ends
• Evaluation
• Conclusion

Evaluation Methodology
• Simulation model– Ns2, not scalable– A scalable packet level simulator
• No MAC details• Scale to 51,200 nodes
• Baseline experiment design– N nodes distribute randomly in a 2D square– Unit disk model: identical transmission range
• Evaluation metrics– Routing success ratio– Shortest path stretch– Flooding range

Evaluation Scenarios
• Landmark sensitivity• Density• Scalability• Mobility• Losses• Obstacles• 3-D space• Irregular shape and voids

Simulated Protocols
• HIR-G: Greedy only• HIR-D: Greedy + Detour• HIR-E: Greedy + Detour + Expending ring• GFR: Greedy geographic routing • GWL: Geographic routing without location
information [Mobicom03]• GOAFR+: Greedy Other Adaptive Face
Routing [Mobihoc03]

0
0.25
0.5
0.75
1
2 10 18 26 34 42 50
Number of Landmarks
Ro
utin
g S
ucc
ess
Ra
tio
HIR-G λ=3πHIR-D λ=3πHIR-G λ=2πHIR-D λ=2π
Number of Landmarks• 3200 nodes, density shows average number of
neighbors• Performance improves slowly after certain value
(20)• Select 30 landmarks in simulations
1
3
5
7
9
11
13
15
2 10 18 26 34 42 50
Number of Landmarks
Flo
od
ing
ra
ng
e
λ=3πλ=2π

Density
• HIR-D keeps high routing success ratio even in the scenarios with critical sparse density.
• Shortest path stretch of HIR-G & HIR-D is close to 1.
1
1.5
2
2.5
3
3.5
3 5 7 9 11 13
Network Density
HIR-GHIR-DHIR-EGFRGOAFR+GWL
Sp
an
of S
ho
rte
st P
ath
0
0.2
0.4
0.6
0.8
1
3 5 7 9 11 13
Network Density
Su
cce
ss R
atio
HIR-DHIR-GGFRGWL

Scalability
• HIR-D degrades slowly as network becomes larger• HIR-D is not sensitive to number of landmarks

Conclusions
• Hop ID distance accurately reflects the hop distance and
• Hop ID base routing performs very well in sparse networks and solves the dead end problem
• Overhead of building and maintaining Hop ID coordinates is low

Thank You!
Questions?

Lower Bound vs Upper Bound
• Lower bound is much close to hop distance
LU
0
0.1
0.2
0.3
0.4
0.5
Pe
rce
nta
geLower bound vs Upper bound
L
U
Difference to Hop Distance
0 1 23 4 >4

• If two nodes are very close and no landmarks are close to these two nodes or the shortest path between the two nodes, U is prone to be an inaccurate estimation
• U(A, B) = 5, while dh(A, B)=2
U Is Not Suitable for Routing
224
215
036
125335
L1
305
L2
416
416 41
4
323
432
541
L3650
652
543
654
A
B

Landmark Selection
0
151
1
4
812
10
13
9
4
8
34
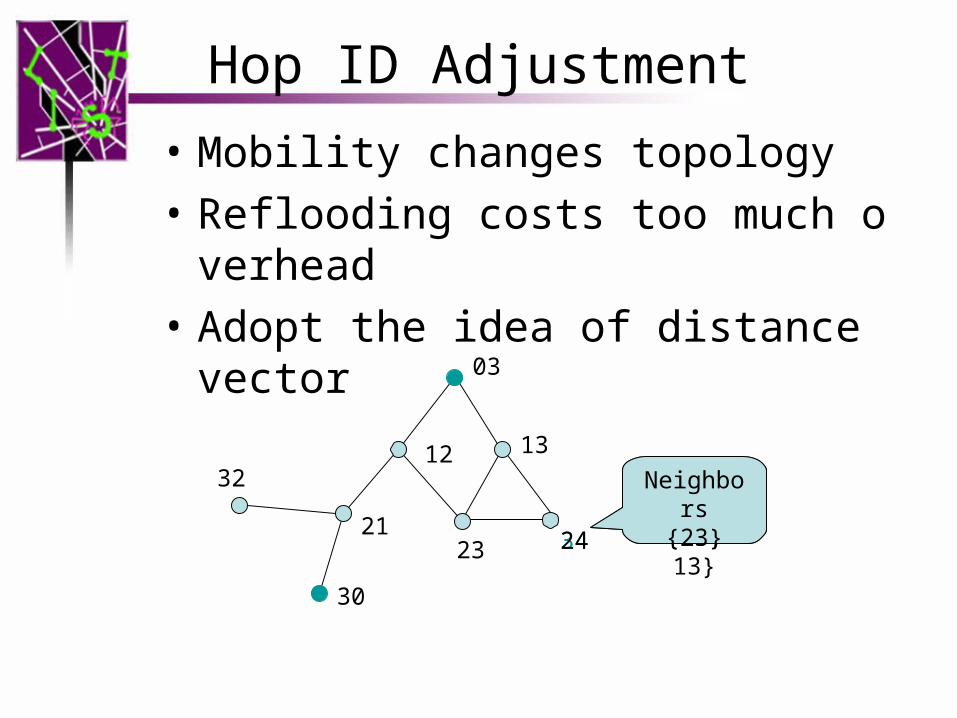
Hop ID Adjustment
• Mobility changes topology
• Reflooding costs too much overhead
• Adopt the idea of distance vector
03
123
2
30
21 2
3
24
13 Neighbor
s{23, 13}
Neighbors
{23}

Build Hop ID System
• Build a shortest path tree• Aggregate landmark candidates• Inform landmarks• Build Hop ID
– Landmarks flood to the whole network.
• Overall cost– O(m*n), m = number of LMs, n=numbe
r of nodes

Mobility
0.5
0.6
0.7
0.8
0.9
1
0 300 600 900 1200 1500 1800
Pause time(s)
Suc
cess
Rat
io
HIR-G(λ=3π)HIR-D(λ=3π)HIR-G(λ=5π)HIR-D(λ=5π)

GFG/GPSR
GOAFR+
4 6 8 10 12
Network Density [nodes per unit disk]
0
0.1
0.2
0.3
0.4
0.5
0.6
0.7
0.8
0.9
1
Fre
qu
en
cy
• Geographic routing suffers from dead end problem in sparse networks• Fabian Kun, Roger Wattenhofer and Aaron Zollinger, Mobihoc 2003
Motivation
bett
erw
orse
1
2
3
4
5
6
7
8
9
Sh
ort
est
Pa
th S
pa
n
Greedy success
Connectivity
critical

Virtual Coordinates
• Problem definition– Define the virtual coordinates
• Select landmarks• Nodes measure the distance to landmarks• Nodes obtain virtual coordinates
– Define the distance function– Goal: virtual distance reflects real
distance
– dv ≈ c · dh , c is a constant