efficient flow
TRANSCRIPT

EFFICIENT FLOW
Document No: D.T2.12.1 Title: Analysis and evaluation for dissemination Date: 4.6.2021

2
DOCUMENT STATUS Authors
Name Organization
Heikki Koivisto SAMK
Olena de Andres Gonzalez SAMK
Håkan Heurlin SMA
Janne Lahtinen SAMK
Mika Nyrhilä Fintraffic VTS
Review
Name Organization
Heikki Koivisto SAMK
Anders Berg SMA
Håkan Heurlin SMA
Mika Nyrhilä Fintraffic VTS
Olena de Andres Gonzalez SAMK
Janne Lahtinen SAMK
Approval
Name Organization Signature Date
Håkan Heurlin SMA HH 2021-06-04
Janne Lahtinen SAMK JL 2021-06-04
Mika Nyrhilä Fintraffic VTS MN 2021-06-04
Olena de Andres Gonzalez SAMK OAG 2021-06-04
Heikki Koivisto SAMK HK 2021-06-04
Anders Berg SMA AB 2021-06-04
Document History
Version Date Status Initials Description
1 2021-04-13 Draft HK Draft Version
2 2021-06-04 HH, JL, MN, OAG, HK, AB
Final Version

3
INTERREG PROJECT NO: CB 607 Disclaimer: The sole responsibility of this publication lies with the author. The European Union is not responsible for any use that may be made of the information contained therein.

4
Contents 1 Scope and Purpose ................................................................................................................. 6
2 Abbreviations ........................................................................................................................... 7
3 Introduction .............................................................................................................................. 9
4 Analyses and evaluation metodology ..................................................................................... 12
5 Data collection methodology .................................................................................................. 15
6 Traffic analysis and user needs.............................................................................................. 16
6.1 Current situation in Vessel Traffic Services (VTS) ........................................................... 16
6.2 Current traffic situation (AIS-analyses) ............................................................................ 16
7 Concept of operations document ........................................................................................... 18
8 Testbed .................................................................................................................................. 20
8.1 Testbed description ........................................................................................................ 20
8.1.1 Geographical location of the testbed ........................................................................ 20
8.1.2 Fairways in the testbed ............................................................................................ 21
8.1.3 Testbed schematic layout ........................................................................................ 22
8.1.4 ETA information service ........................................................................................... 22
8.2 EF-tool ............................................................................................................................ 24
8.3 Expected results with EF-tool in the testbed ................................................................... 28
8.3.1 On board ferries ....................................................................................................... 28
8.3.2 On ships piloted by pilots ......................................................................................... 28
8.3.3 In VTS ..................................................................................................................... 28
8.4 Actors in the testbed ....................................................................................................... 28
8.4.1 Ferries in testbed ..................................................................................................... 28
8.4.2 Ferry bridge officers ................................................................................................. 28
8.4.3 Pilots ........................................................................................................................ 28
8.4.4 VTS Operators ......................................................................................................... 29
8.5 Role of actors in the testbed ........................................................................................... 29
8.5.1 Role of the ferry bridge officers ................................................................................ 29
8.5.2 How the ferry bridge officers vessel meeting situations currently ............................. 29
8.5.3 Role of the pilots in the testbed ................................................................................ 29
8.5.4 How the pilot is solving meeting situations today ..................................................... 29
8.5.5 Role of the VTS operators in the testbed ................................................................. 29
8.5.6 How VTS operators are finding out meeting locations today .................................... 30
8.6 Technical installation descriptions in the testbed ............................................................. 31
8.6.1 Technical installation description on Ferries ............................................................. 31
8.6.2 Technical installation description pilots .................................................................... 32
8.6.3 Technical installation description in VTS .................................................................. 32
8.7 Impact of COVID-19 to the testbed ................................................................................. 33

5
8.8 Testing of the MS Baltic Bright Adveto Ecdis Sea Traffic Management capabilities and Port of Rauma ........................................................................................................................... 34
9 KPI’s and objectives ............................................................................................................... 35
9.1 Data collection methodology of KPIs ............................................................................... 35
9.2 Analysis of the KPIs results............................................................................................. 35
9.2.1 Interviews ................................................................................................................ 35
9.2.2 On-line survey ......................................................................................................... 35
10 Evaluation of the project ..................................................................................................... 38
11 Conclusions ........................................................................................................................ 41
12 References ......................................................................................................................... 44

6
1 Scope and Purpose The overall objective of the EfficientFlow project was to improve the flow of goods and passengers through the two corridors of Gävle-Rauma and Stockholm-Turku in Baltic Sea Region by implementation of Sea Traffic Management concept. The project consisted from 2 work packages (WP). WP1 related to “Port flow optimisation” and developed Port Activity Application for improved data exchange within the port and between ships and ports in Gävle-Rauma corridor. WP2 related to “Ship flow optimisation” and developed the EF Tool and Efficient Flow Hub Service for improved route exchange process in a real time between ship-ship and ship-ports.
The scope and purpose of the final D.T2.12 document is to collect and analyse information from main deliverables what have been created and reported during EfficientFlow project under WPT2 "Ship flow optimisation" in corridor Stockholm-Turku, duration from 2018 to 2021. In this document have been used information from Deliverables T.2.1.1, T.2.2.1, T.2.11.1.
Deliverable T.2.1.1 reported Current situation and traffic analysis according to the traffic analysis and user needs. This document provided an update to the Flow Management concept that was initiated in earlier EU projects, Mona Lisa 2.0 and STM validation. Deliverable T.2.2.1 provided an update to the Flow Management concept that was initiated during earlier EU projects, Mona Lisa 2.0 and STM validation. Deliverable T.2.11.1 reported collection of data for analysis and evaluation, what was collected with various methods including interviews, logbook entries, enterprise resource planning systems, and Rauma & Gävle Port Activity Application.

7
2 Abbreviations
AIS – Automatic Identification System ECDIS – Electronic Chart Display and information System EF tool – EF tool is the functionality in ECDIS/PPU/VTS that makes the system able to share and receive routes and calculate meeting points based on those routes including the routes schedule ETA – Estimated Time of Arrival ETAIS – ETA Information Service (Web based service that displays ETA from ships, based on the schedule in the ship´s shared route) ETD – Estimated Time of Departure Flow Management - Flow Management is the design, auditing and implementation of traffic control plans at shipping traffic projects. It describes a process through which the speed / timing of ships passage of a narrow strait is adjusted to achieve a safe and efficient traffic flow IEC – International Electrotechnical Commission Meeting point – In this documents context meeting point is a point where ships are meeting or overtaking each other in fairway, this includes crossing traffic MSI – Maritime Safety Information Service Pilot – Local advisors who guide vessels from the sea into port as well as from the port out to sea. They also handle vessel transfers from one quay to another within the port. Pilots work on the bridge alongside the shipmaster and other crew members. Pilot Officer – Ship´s bridge officer who has accomplished pilot examination for the corresponding fairway. Typical onboard ferries that sail on a fixed route between 2 or more ports. With pilot officer, ship doesn’t have to use pilot services PPU – Pilot portable unit, portable navigation system that pilot use when piloting Reporting point – A mark or position at which a vessel is required to report to the local Route – A way or course taken in getting from a starting point to a destination. Shipping routes are the paths taken by ships across the world's seas. They are channels down to a hundred meters wide up to unrestricted, defined by compulsory points of passage (capes, straits, channels), physical constraints (current speed, depth, presence of reefs) and geopolitical contexts. Route exchange – Ships can choose to share their route with other ships, the electronic charts will show the surrounding ships routes for easy understanding of the situation. The standard format of the routes for exchange is RTZ used in conjunction with ECDIS to IEC 61174. Routes can be exchanged by means that support standard operating procedures. Schedule – A schedule is a table included in the route, stating at what date/time the ship plan to be at the routes waypoints SeaIQ – A brand of PPU that has been used by the Swedish pilots in the Efficient Flow Project

8
SOP – Standard Operating Procedure STM – Sea Traffic Management, a concept based on common standards and secure infrastructure enabling interoperable services to enhance the aggregation of the seaborne and shore-based functions (sea traffic services, maritime space management and sea traffic flow management) required to ensure the safe and efficient movement of vessels during all phases of operation. TOS – Traffic Organisation Service, a traffic organization service is a service to prevent the development of dangerous maritime traffic situations and to provide for the safe and efficient movement of vessel traffic within the VTS area. See IALA VTS Manual for exact definition VHF – Very High Frequency, radio frequency range. Common way of communicating at sea to sea & sea to shore, the primary means of communication for VTS and vessels VTS – Vessel Traffic Services are shore-side systems which range from the provision of simple information messages to ships, such as position of other traffic or meteorological hazard warnings, to extensive management of traffic within a port or waterway. VTS area - Area in territorial waters in which VTS is provided to the merchant fleet VTS centre – Premises that are equipped with technology to provide Vessel Traffic Services. VTSO – Vessel Traffic Service Operator Waypoint – A position marking the intersection between two legs in a Voyage Plan
9
3 Introduction The Baltic Sea Region is extremely dependent of efficient transport solutions all year around. Currently there is a need to improve maritime transport and its integration in the logistic chain between Finland and Sweden, in order to optimize the flow of goods both by sea and connecting transport modes in the hinterland. The Baltic Sea is designated by IMO as a Particular Sensitive Sea Area, why all actions to reduce bunker consumption and emissions are of utmost importance. Today, the management of the vessel traffic in the fairways of the area is currently done mainly by voice communication. This increases the risk for misunderstandings, can result in longer lead times, inefficiencies and an unnecessary administrative burden. Automated information exchange between ship-ship and ship-shore centres can ensure efficient traffic flow and enhance the safety of vessel traffic. There is a considerable transport flow of goods and passengers in the ScanMed Corridor in the Central Baltic area. Via Stockholm and Turku, the annual number of passengers amounts to more than 2.7 million persons and the number of transport units to more than 90,000. In the ScanMed Corridor the traffic is constant so any unexpected situations on sea and ports will delay all transportation actions. In the Finland’s maritime strategy for 2014 – 2022 it's noted that one of the ways to improve maritime safety can be done by enhancing the vessel traffic monitoring. One of the solutions for lowering the risks in maritime safety is the development of automated and proactive tools for risk identification in the traffic management system. EfficientFlow project addressed these goals by developing and taking advanced tools for traffic management into operation. The Finnish maritime strategy also states that the developments in ICT can significantly improve the utilization of the traffic system and services. Real time information on the traffic will provide all actors in the ports up to date information on transportations and on circumstances that can have an effect on it. Transports can be planned more precisely and the response to changing situations and the information exchange can be done faster. In the 2015 Swedish Government Maritime Strategy is stated that new technology is an important tool for increasing safety on board, but it also means opportunities to increase environmental performance and efficiency in the shipping industry. Among the priorities for research and innovation in the proposal for the National Transport Plan presented to the government in August 2017, one priority in research and innovation was Sea Traffic management (STM): Shipping needs to develop safety and efficiency through digitalization, traffic management and STM (Sea Traffic Management), and need to adapt to fossil free fuels and be better integrated into societal planning, not least in order to cope with forthcoming change in the transport system. Sea Traffic Management concept includes connecting and updating the maritime world in real time, with efficient information exchange. STM´s goals are to create a safer, more efficient and

10
environmentally friendly maritime sector. The beneficiaries are various shipping actors such as cargo owners, port actors, bridge officers, service providers, ship owners and authorities, insurance company.1 In relation of the year 2015, STM aims to reduce accidents by 50%, reduce voyage costs by 10% and reduce waiting time for berthing by 30%, and lower the fuel consumptions and greenhouse gas emissions by 7% by the year 2030. STM has been defined in the MONALISA 2.0 project and is validated in the STM Validation Project. “The enhanced situational awareness provided by data sharing is valuable and beneficial, providing positive effects for operations, including making better estimates for ETAs and ETDs, improving work procedures, reducing the time spent on information gathering, and a reduction in administrative workloads.”2 EfficientFlow was built on the outcomes from these two projects and main aim of the three-year research was to make the transport flow in the corridors more efficient by improved processes, in order to produce new digital solutions and to demonstrate a successful case of the first implementation of the STM concept in the Baltic Sea Region. One priority area within the EUSBSR is Maritime Safety and Security (PA SAFE). EfficientFlow clearly addressed the PA SAFE which says that “At the core of the required procedural improvements are traffic management and traffic control measures involving the monitoring of ship movements, with the aim of preventing the development of dangerous situations.” EfficientFlow was also fully in line with PA Transport, which emphasized the need for ”Facilitation of a sustainable, in view of economic, social and environmental aspects, and efficient transport system in the Baltic Sea Region requires – along with infrastructural investments – also innovative measures dwelling on new technologies, planning approaches and administrative procedures. The EfficientFlow Project strongly supported the implementation of HELCOM Recommendation no. 34E/2 "Further testing and developing the concept of pro-active route planning as well as other e-navigation solutions to enhance safety of navigation and protection of the marine environment in the Baltic Sea Region" which is “RECOGNISING FURTHER the potential of electronic proactive route planning in the Baltic Sea”. The WPT2 main objective was to introduce the Flow optimization (FO) in the regular ferry traffic and ships using pilots in order to facilitate FO in the ScanMed corridor via Stockholm and Turku and to improve situational awareness, facilitate higher predictability and efficiency as well as time saving and safety in the corridor. The EfficientFlow project partnership for WPT2 was very strong, involving two national authorities (Swedish Maritime Administration and Finnish Transport Agency) as well as Satakunta University of Applied Sciences (Finland) as an academic actor with high reputation in the region. The Port of Stockholm was involved as a user. The major shipping line in the corridor has confirmed the relevance of the project and is involved in the user groups.
1 https://www.seatrafficmanagement.info/about-stm/ 2 Final Report on STM Validation Project https://s3-eu-west-1.amazonaws.com/stm-stmvalidation/uploads/20190709125520/STM-Validation-Final-report.pdf

11
Target groups involved in a WPT2 EfficientFlow project Different relevant target groups were involved in development of foreseen output(s) and benefit from this WP's activities. Ship operators Viking Line, Tallink-Silja, Finnlines and Birka Line were involved with their ships in the Project. Pilots in Finland and Sweden were involved in defining the development of the portable pilot units and in the implementation of the testbed. Navigating officers and personnel in the VTS centers were involved in the development of operational procedures and in the implementation of the testbed. Several other shipping companies were involved in or affected by the increased situational awareness and improved planning horizon offered by Sea Traffic Management Ports of Stockholm, Kapellskär, Turku, Naantali, Långnäs and Mariehamn had ships Calling their ports and gained from better planning opportunities.

12
4 Analyses and evaluation metodology It is generally understood, that evaluating a project means performing a rigorous analysis of completed goals, objectives and activities to determine whether the project has produced planned results, delivered expected benefits, and made desired change. As a process, project evaluation takes a series of steps to identify and measure the outcomes and impacts resulted from project completion. The evaluation in this deliverable covered all activities of the EfficientFlow WP T2 that had concluded or were in their closure period by the 31 MAY 2021. This amounted to 13 concluded project activities, which were sufficiently far along in implementation terms to be evaluated, plus an additional project activities related to WPC.
WP T2 Ship Flow Optimization Activity T2.1 Current situation and traffic analysis. This activity encompassed all preparatory work needed to enter into the concept definition phase: development of traffic analysis, identification of user needs onboard and on the shore side. As a result, Deliverable T2.1.1 Report on traffic analysis and user needs was created. Activity T2.2 Flow Management Concept Definition. The concept and operational processes were defined and described how the flow optimization in the corridor could be operationalized by use cases. A test plan was prepared. As a result Deliverable T2.2.1 Concept of operations document was reported. Activity T2.3 Preparation for procurement of shore centre upgrade. The equipment ashore in the Vessel Traffic Services Centre in Turku and Stockholm needed to be made STM compliant and support the flow optimization services. This have been done as a public tender. As a result of this activity Deliverable T2.3.1 Procurement Documentation was created. Activity T2.4 Procurement of shore centre upgrade. In the course of this activity, a public procurement has been made in order to make the VTS centres in Turku and Stockholm STM compliant. As a result of this activity a Deliverable T2.4.1 Contract was made. Activity T2.5 Preparation for procurement of Portable Pilot Unit (PPU) upgrade. The Portable Pilot Units of the Swedish and Finnish pilots needed to be made STM compliant and used in the corridor. As a result of this activity Deliverable T2.5.1 Procurement documentation have been created. Activity T2.6 Procurement of PPU upgrade. The public procurement will be carried out by the Finnish Transport Agency and the Swedish Maritime Administration. As a result of this activity Deliverable T2.6.1 Contract was made.

13
Activity T2.7 Preparation for procurement of onboard system upgrade. Ships in regular traffic on the corridor (app 15-20), including all ferries between Stockholm and Turku. Selected ships calling Gävle and Rauma were upgraded within this procurement. As a result of this activity Deliverable T2.7.1 Procurement documentation was created. Activity T2.8 Procurement of onboard system upgraded. In the course of this activity, a public procurement was made in order to make the onboard systems for selected vessels STM compliant. As a result of this activity Deliverable T2.8.1 Contracts was made. Activity T2.9 Testbed. The systems were made operational and the testing was carried out in the normal operations of the ships operations, pilots and VTS operators. This activity had some limitations because of the COVID-19 influences to the Testbed in general, this is explained in details in the Test-bed and “Covid-19 affect to the project” parts. As a result of this activity Deliverable T2.9.1 Questionnaire as an input to the analysis and evaluation was created. Activity T2.10 Identification of indicators for analysis and evaluation. A comprehensive analysis and evaluation was carried out. Indicators have been specific, measurable, accurate, realistic, time bound and relevant, same as program indicator of the CBP (time saving). As a result of this activity Deliverable T2.10.1 Report with identified follow-up indicators was made. Activity T2.11 Collection of data for analysis and evaluation. The data was collected from identified sources, both quantitative and qualitative. This activity had some limitations because of the COVID-19 influences to it in general, this is explained in details in the Test-bed and “Covid-19 affect to the project” parts. As a result of this activity Deliverable T2.11.1 Collected package of data was created. Activity T2.12 Analysis and Evaluation for dissemination. The results of the analysis were used for improvements of processes and concept development. As a result of this activity Deliverable T2.12.1 Report (this document) with analysis of achieved value compared with the value proposition was made. Activity T2.13 Coordination. In the lifetime of the Work Package, a number of coordination meetings (online and face-to-fact) were organised to discuss and if necessary took an actions on the progress of the WP. As a result of the activity Deliverable T2.13.1 Meeting documentation was reported. In order to analyse the EfficientFlow objectives and the extent to which they have been reached however, it was covered those project activities that had results of the using and implementing Sea Traffic Management capabilities. Hence, a lighter assessment of activities D.T.2., 2.10 and 2.11 have been included in the specific objective -level analysis. The main stakeholders were included in the group of workshops, interviews and have been participated testing and launching event. Extensive analyses and evaluations have been carried out within the above activities and an extensive exchange of gained experiences was done, including training.

14
Outcome of the WPT2 and Efficient Flow project (online-guidance, training videos, guidebooks, steps on how to work) was done as open source, freely available and will be spread widely to all interested stakeholders.

15
5 Data collection methodology During the project life-time quantitative and qualitative data collection methodology have been used. Excel based on LogEvents, works for services in SMA Azure, EF Hub (SMA), Swedish PPUs (SEAiq), Swedish VTS , AIS (see current situation analysis), RTZ- messages. Additionally, a calculation on vessel fuel consumption in fairway was conducted. Data collection with questionnaire was introduced to testbed actors together with training sessions. Qualitative measurements were based on the questionnaires and interviews targeted to testbed actors. As part of qualitative measurement, following online questionnaires were created for qualitative and quantitative data collection.
• Online survey for VTS operators. • Online survey for pilots. • Online survey for navigators of Efficient Flow- testbed vessels. • Online survey for shipping company representatives managing Efficient Flow- testbed
vessels. • Face-to-face interviews with stakeholders, who have been available according Covid-19
restrictions.
The more detailed reporting could be found under Test-bed chapter. (Chapter 8)

16
6 Traffic analysis and user needs To support EfficientFlow project effort in improving safety, decreasing fuel consumption and environmental footprint, a comprehensive situation analysis was completed using an online Questionnaire-tool and number of interviews. Answers provided by various parties together with further analyses of the results are presented. Current situation and traffic in this chapter analysis focused in gathering information to form a trustworthy view of prevailing traffic situation in Turku-Stockholm channel. Current situation and traffic analysis -activity encompassed all preparatory work needed to enter the concept definition phase. This meant development of traffic analysis, identification of user needs on board and on the shore side.
6.1 Current situation in Vessel Traffic Services (VTS) Both involved parties, VTS Stockholm and Archipelago VTS, provides Vessel Traffic Service. There are similarities and differences in the current procedures and services. This chapter gives a brief description of the current situation. VTS-centres already have a significant impact on traffic optimization in their areas. Now information is provided on VHF at reporting points, or when deemed necessary. The main improvement in focus is to digitalize the information to make it more user friendly and accurate for the ship board users. Other important effect of Efficient Flow project is that ships would have knowledge of each other’s routes in advance to have enough time to react accordingly. Never the less this is not lessen the importance of the VTS, who always have the best overall picture of the traffic situation and the main interest to keep all vessels, people and environment safe at all times.
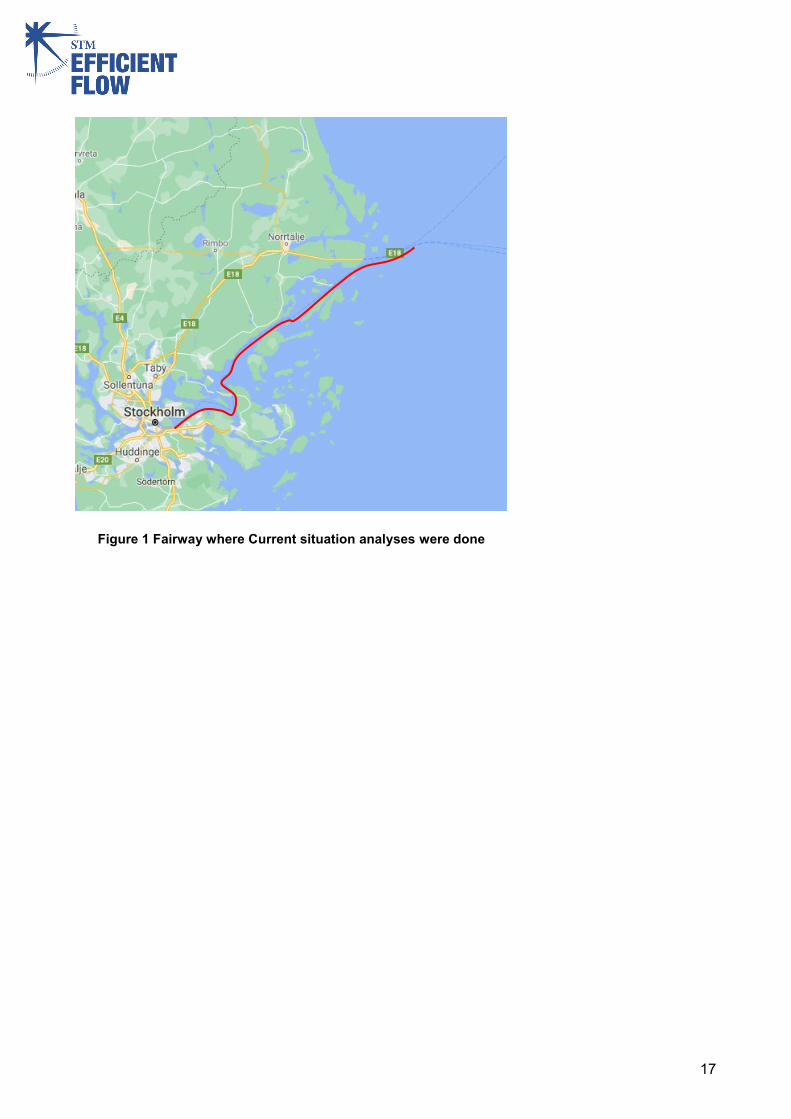
6.2 Current traffic situation (AIS-analyses) The current situation AIS analysis (reported in Deliverable T2.1.1 Report on traffic analysis and user needs) has demonstrated a great potential for a well-functioning meeting point calculation functionality for navigation. It could directly improve the fuel consumption of many vessels within the fairway and therefore contribute to a more economic and environmentally friendly transport through the archipelagos. Furthermore, the aspect of increased safety due to a better coordination within the fairway when it comes to the avoidance of unwanted meeting points would be achieved. Finally, the current situation AIS analysis has proved that within the examined 13-day period a total of at least 36 (equals approximately 10% of the passages) situation have been identified in which a well-functioning meeting point calculation functionality for navigation system would have directly contributed to a cheaper and safer passage of piloted vessels through the Fairway of Söderarm to Stockholm. for details, see Figure 1 Fairway where Current situation analyses were done.
17
Figure 1 Fairway where Current situation analyses were done
18
7 Concept of operations document This chapter provides an update to the Flow Management concept that was initiated in during earlier EU projects, Mona Lisa 2.0 and STM validation. The Flow Management was supposed to be used to ensure the safe passage of ships in restricted areas. This could facilitate optimization of route planning by information exchange ship-to-ship and ship-to-shore. The aim was to make meetings, overtaking or crossing situations safer and more efficient. The Use Cases described the basic work flows onboard the ships navigating in the area and in the Vessel Traffic Service (VTS) centres when they were using the Flow Management tools for information exchange. During the Efficient Flow -project live tests between the ships navigators, pilots and VTS operators were arranged. The aim was to collect feedback on the usability and effectiveness of the Flow Management concept in the archipelagos between Turku and Stockholm. Flow Optimisation is a service that could be implemented by a Vessel Traffic Service (VTS) delivering a Traffic Organisation Service in a VTS area or by other shore-based service provider, such as Port Control, for areas outside of declared VTS areas. Flow Optimisation Service can be either regulatory or advisory based. In a Flow Optimisation Service, a shore-based operator monitors traffic and can advise a ship to slow down or speed up based on its ETA at specific key waypoints. This could help avoid potential traffic congestion and problems further down its route. The service can also re-direct traffic using a “recommended route” communicated to a ship. This could be helpful if a fairway is closed or obstacles are preventing safe passage. This service ensured both safety and predictability for the maritime transport logistics chain. On-board users, ships officers and pilots, can also receive other vessels route plans that can be used for calculation of meeting points in on-board systems (ECDIS's, PPU's). A shore-based operator was performing flow optimization through advice to the ships within a defined sea area using:
• An enhanced traffic image defined as consisting of a complete traffic image together with the planned routes for the STM compliant ships.
• As a part of the route schedule, the operator had access to the ship’s ETA to some key waypoint, denoted flow point (FPT).
• Based on the above information, the operator was continually assessing the overall maritime traffic situation within his sector of responsibility. If a developing traffic situation was identified, the operator could recommend a new ETA for the denoted FPT to resolving the situation at an early stage.
• Ships that were equipped with functionalities (using STM technical enablers) that enabled them to calculate where meeting/overtaking with/of other ships can take place had possibility to solve the upcoming situation between each other.
• In case of a MSI receipt, e.g. a fairway or traffic lane was closed; the operator could use both re-scheduling and suggested route/s, which was a proposed new route segment.
• In the case of a port approach the approach could be synchronized with the port call. Flow Optimization Service was operating in different kind of phases:
• The planning phase during the optimisation of the overall route • The execution phase during re-planning of the route • The execution phase manually by an operator

19
The Flow Optimisation Service could in the future be one of the many tools to implement today’s VTS Traffic Organisation Service (TOS) digitally. Today, this service is not supported by the ships intended routes. The overall objective of the Flow Management (FM) concept is to increase the safety of navigation, and in some specific geographical areas the efficiency of the maritime traffic flow. FM operates on the overall maritime traffic flow within a geographical area and collects and manages all relevant information not only within that specific area but also in the surrounding waters. More precisely, the aim of the FM concept is to optimize and increase navigational/operational safety of the sea [maritime] traffic flow during all planning and executing phases of the voyage. Optimization of maritime traffic is achieved by using advice, not control, hence leaving the final decision to the Master, and using STM technical enablers.

20
8 Testbed 8.1 Testbed description
8.1.1 Geographical location of the testbed The testbed has been located in the Interreg Central Baltic area. In more detail the geographical area covers the fairways between Stockholm and Turku. See Figure 2 Testbed geographical location
Figure 2 Testbed geographical location

21
8.1.2 Fairways in the testbed The fairways in the testbed are somewhat similar on both Finnish and Swedish side. There are several locations (narrow passages) where vessels are not allowed to meet, there are also alternative fairways that can be used to avoid meeting situations. In some parts of the fairways there are speed restrictions. Example of where an alternative fairway is an option to avoid a meeting in a narrow part of the fairway can be seen in Figure 3 Main and Alternative fairway.
Figure 3 Main and Alternative fairway
Alternative fairway
Area where it is not recommended to meet another ship
Main Fairway
22
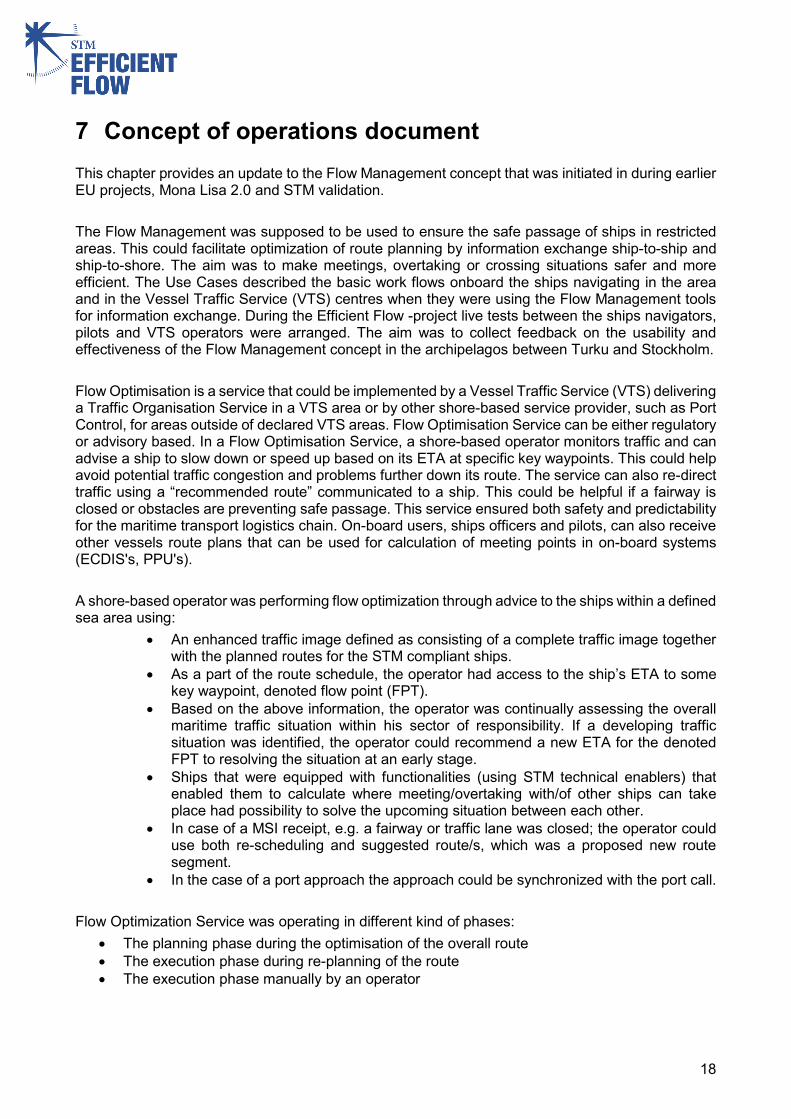
8.1.3 Testbed schematic layout As can be seen in Figure 4 Testbed information flowchart, the Efficient Flow Hub Service (EFHS) play a central role in the sharing of information between the actors in the testbed. A typical use case to explain how information is “flowing”. A Swedish pilot is boarding a ship and connect the PPU to the ship to receive navigational information from the ship to the PPU. When a route is loaded form monitoring in the PPU and the route sharing functionality is active, the route (in RTZ format) is shared with the EFHS. The EFHS has a send list which states to what other services e.g VTS, PPUs, ECDISes and ETAIS the EFHS shall forward the route to. In the testbed there were a choice to use a fixed send list, when a system like this is out into production, a dynamic send list would be to prefer. The reason that EFHS is connected to AIS system is to be able to see if a ship is within the area of concern of the testbed, and also to get information about the ship´s speed. In the EFHS there is a functionality that makes the EFHS to send out a ships route in “Inactive status” (if a ship is doing a speed >0,2knot for 5min) to everyone on the send list, this functionality is there to prevent the recipients receiving “active routes” from ships that are not moving. The EFHS is also able to send text messages to receivers if they have shared a route with EFHS that doesn´t contain a schedule.
Figure 4 Testbed information flowchart
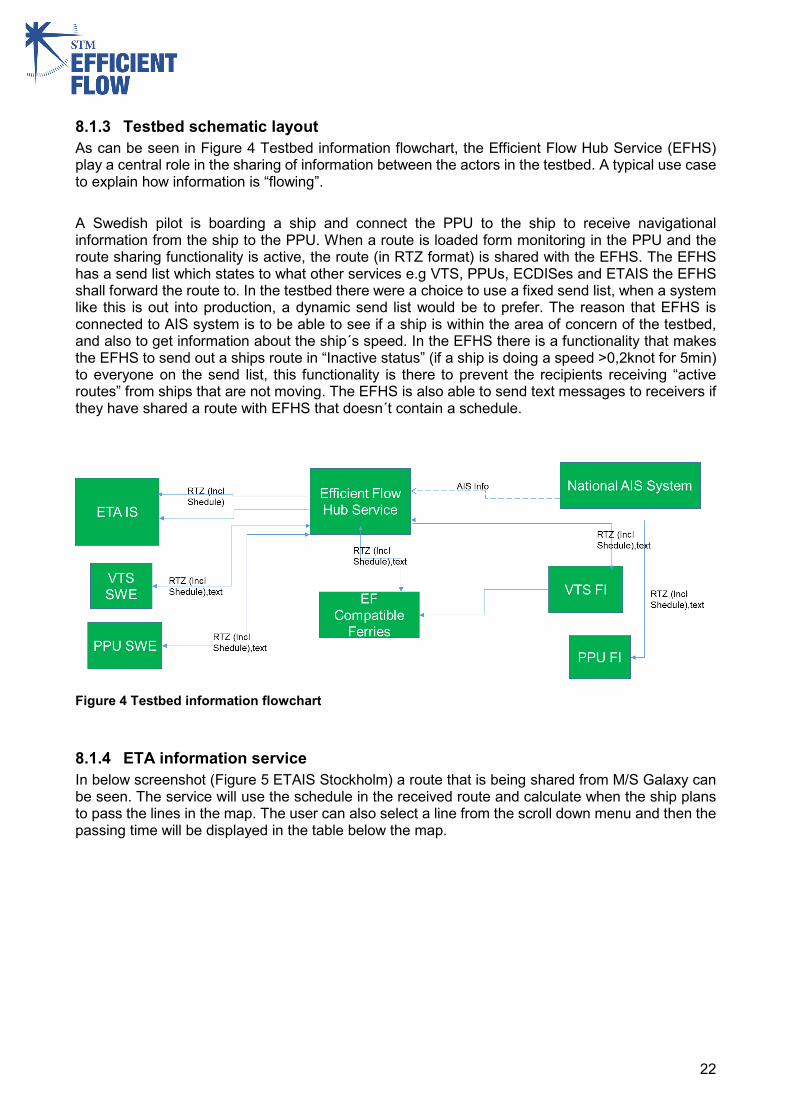
8.1.4 ETA information service In below screenshot (Figure 5 ETAIS Stockholm) a route that is being shared from M/S Galaxy can be seen. The service will use the schedule in the received route and calculate when the ship plans to pass the lines in the map. The user can also select a line from the scroll down menu and then the passing time will be displayed in the table below the map.

23
Figure 5 ETAIS Stockholm

24
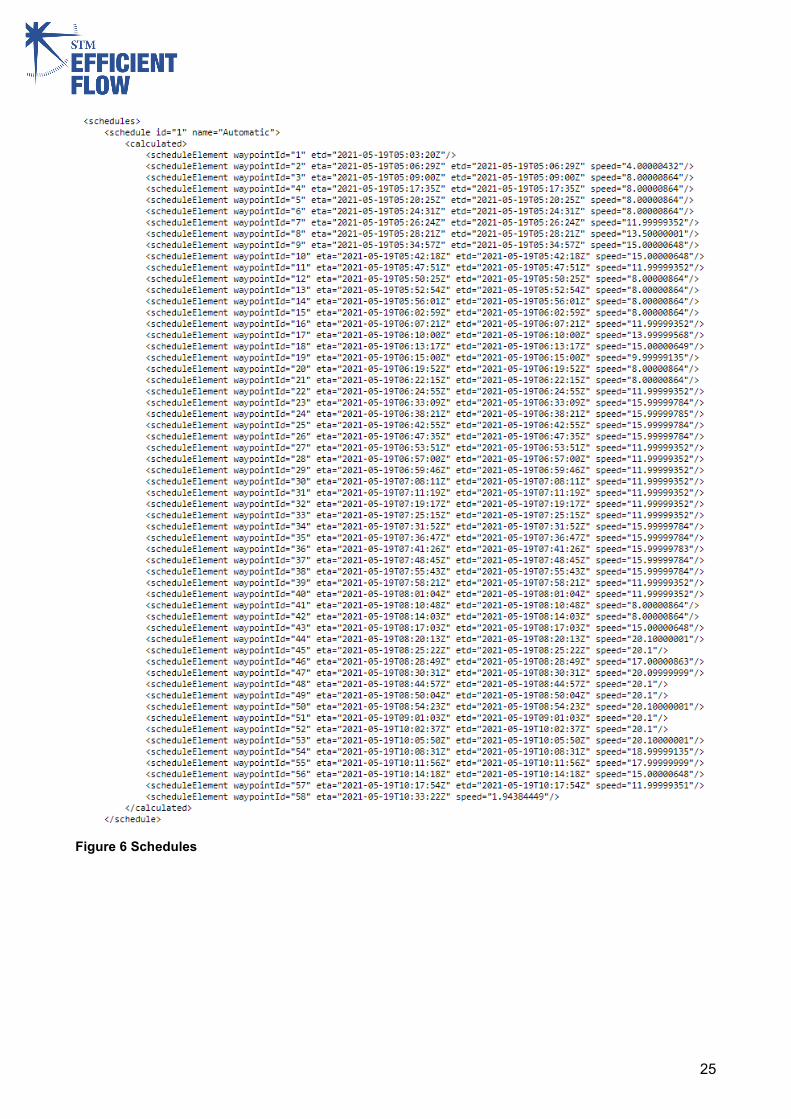
8.2 EF-tool EF-tool is the functionality in ECDIS/PPU/VTS that makes the system able to share and receive routes and calculate meeting points based on those routes including the routes schedule. A schedule is added to the route that is being monitored based on preprogramed speeds in the route, also other speed settings can be applied. The date and time is taken from the system. A schedule look like below in Figure 6 Schedule. If routesharing is activated the momnitored route will be shared to the Efficient Flow Hub Service (EFHS), and from the EFHS it will be forwarded to recipients of the EFHS static send list. Based on the route and the schedule, the receiving PPU/ECDIS/VTS system can calculate and display when a ship will be where, based on that ship´s actual position, actual speed until next waypoint and from thereon preprogramed speeds. Based on above calculation the meeting point (see Figure 7 Meeting point 1 and Figure 8 Meeting point 2 ) can be calculated and displayed for the user. In Figure 9 Meeting point 3, it can be seen where the two ships actually met. The meeting point can be moved by the user to be able to determine what average speed to keep in order to meet where the ships can meet more safely.
25
Figure 6 Schedules

26
Figure 7 Meeting point 1
Figure 8 Meeting point 2

27
Figure 9 Meeting point 3
28
8.3 Expected results with EF-tool in the testbed
8.3.1 On board ferries The EF-Tool is expected to calculate (by means of own route/schedule and the other ship´s route schedule) when/where the meeting will take place and display that for the bridge officer in the PPU/ECDIS. If the bridge officer possesses access to the EF-Tool provided information and he/she uses it correctly, a potential to increased safety, reduction of fuel consumption and consequently reduction in the vessel environmental footprint, would be imminent. Finally, the EF-Tool has a significant potential in noticeable operative cost savings increasing financial sustainability.
8.3.2 On ships piloted by pilots The EF-Tool is expected to calculate (by means of own route/schedule and the other ship´s route schedule) when/where the meeting will take place and display/warn about that for the pilot in the PPU, if the pilot easily have access to this very accurate information and uses it correctly there is a possibility to increase safety, reduce fuel consumption and thereby also reduce the environmental footprint.
8.3.3 In VTS Based on the shared routes/schedules from the ships in the VTS areas meeting point will be calculated and displayed in the VTS systems. In the VTS system there might be areas marked by polygons, if a meeting between two ships is calculated to take place within such a polygon, an alarm could be triggered for the operator.
8.4 Actors in the testbed
8.4.1 Ferries in testbed The four ship owners that have ferries trading in the above mentioned fairways (Tallink, Viking line, Finnlines and Birka Line) were contacted in the beginning of the project to be a part of the project and the testbed. All four ship owners joined the project as members of the usergroup, not as partners. All in all the number of ferries is 18, due to Covid 19 and delays in delivery of ECDIS and PPUs only 10 ferries were equipped with Efficient Flow functionality. For details regarding how these ferries have been in traffic during the testbed due to Covid 19 see 2.7
8.4.2 Ferry bridge officers The officers responsible for the piloting and the watch keeping officers on board the participating ferries in the Efficient Flow project.
8.4.3 Pilots The pilots in Stockholm- (23 pilots) and Turku-pilots (14 pilots) were supposed to participate in the testbed. Due to late delivery of the upgrade of PilotPro application used by the Turkupilots, only 3 pilots in Turku have been using a version of PilotPro with Efficient Flow functionality in the testbed from approximately January 2021, when this version were used in reality, outside the manufacturers premises other more operational issues were found that were adressed and are now taken care of, unfortunately there is a risk that a final version will not be able to be delivered to all Turku pilots before the project ends. Stockholm pilots got the SEAiq-pilot upgraded and trained in the usage of
29
the Efficient Flow functionality in May 2020 and has used it since. Since that the Turku pilots did not get ample time to use the EF tool in their PPU before the questionnaire had to close, Turku pilots were not answering to the On-line questionnaire.
8.4.4 VTS Operators The VTS operators in the VTS Stockholm and in Arkipelag VTS
8.5 Role of actors in the testbed
8.5.1 Role of the ferry bridge officers The role of the ferry staff in testbed has been to familiarize themselves with the use of the EF-Tool and use it to the best ability of the tool and user. Additionally, ferry crews have participated to the online questionnaire and interview.
8.5.2 How the ferry bridge officers vessel meeting situations currently Today the pilot officer is able to see where the other ship is in the fairway the pilot officer use the ECDIS to locate the AIS target of the other ship and then measures or know from experience where they will meet. The pilot officer can also ask the VTS when the other ship passed a reporting point. And from that draw the conclusion about where they will meet. Or the pilot officer can just ask the other ship when the other ship will be at a specific location, e.g. a narrow sound and compare that with own ETA to the same location. Of course there is a risk of human error when calculating the meeting point the way mentioned above.
8.5.3 Role of the pilots in the testbed The role of the pilots in testbed has been to use the EF-Tool in their PPU and also to participate in doing the online questionnaire and online interview. Pilots have been sharing routes from their PPUs when piloting, the ferries with either ADVETO ECDIS or SEAiq-Pilot on board have also been sharing routes.
8.5.4 How the pilot is solving meeting situations today Today the pilot is able to see where the other ship is in the fairway, the pilot use the PPU to locate the AIS target of the other ship and then measures or know from experience where they will meet. The pilot can also ask the VTS when the other ship passed a reporting point and from that draw the conclusion about where they will meet. The pilot can just ask the other ship when the other ship will be at a specific location, e.g. a narrow sound and compare that with own ETA to the same location. Of course there is a risk of human error when calculating the meeting point the way mentioned above.
8.5.5 Role of the VTS operators in the testbed The role of the VTS and its staff in testbed has been to use the EF-Tool and also to participate in doing the online questionnaire and online interview. Fintraffic VTS has implemented the capability of receiving and presenting shared routes visually in their VTS system.

30
8.5.6 How VTS operators are finding out meeting locations today 8.5.6.1 VTS Stockholm VTS Stockholm actively monitoring the traffic with the assistance of radar coverage, AIS and VHF. The goal is to be proactive. Vessels receive information over the VHF about other relevant vessels. Meeting and overtaking areas are agreed between the vessels themselves. If the VTS finds that two vessels will meet at a prohibited area and VHF contact has not been established between the two vessels, then the VTS will contact one of the vessels and ask them to take bridge to bridge contact with the other vessel. 8.5.6.2 Fintraffic VTS Fintraffic VTS has comprehensive common operational picture provided by extensive sensor network connected to tactical display framework. All of the data collected by sensor network (including AIS track data, radar data, weather data, AtoN data and manual data) is fused into a user-defined common operational picture. Operators are presented with a single, comprehensive picture of the entire surveillance area, enabling them to quickly assess the situation at hand. VTS-system includes component in which operator can connect vessel fusion track, a track that is a combination of AIS and radar track, to a route that has been predefined in route library. The route library in the system contains all waterways used by commercial shipping. Progress of the vessel can be simulated and by this meeting and overtaking positions can be predicted. The route tool takes into account speed restrictions and routes can also be amended on the fly if vessel informs VTS that they are choosing alternative route. System also calculates ETAs to different reporting points and other points of interest defined in the route library. Besides technology, operative measures for handling meeting situations are mostly related to mandatory reporting positions along the routes. All vessels over 24 meters in length are obligated to participate in reporting scheme. In the Archipelago VTS area vessels are to report 20 minutes before passing certain points. Vessels are given all relevant information about other traffic, defects of aids to navigation and other fairway safety devices, weather and environmental conditions, possible works in the fairway, speed restrictions and any other circumstances that might hinder the safety of the navigation.

31
8.6 Technical installation descriptions in the testbed
8.6.1 Technical installation description on Ferries On some of the ferries (2 out of 10) the ECDIS was upgraded with Efficient Flow Functionality, on the remaining ferries, iPads with SEAiq pilot were installed. See Rationale for alternative solution of iPads on vessels for more details. The Efficient Flow upgrade was done by ADVETO AB in their ECDIS software, the Efficient Flow functionality were done in the latest release of ADVETO´s ECDIS software, which in some cases caused some of the hardware to be changed on board. 8.6.1.1 Rationale for alternative solution of iPads on vessels The plan in the project was to upgrade existing ECDIS with Efficient flow functionality. Requirement specifications for ECDIS, VTS and PPUs were developed and used in procurements. In the ECDIS procurement the ECDIS manufacturers that had ECDIS systems installed on board the ferries in the testbed were invited to the procurement. Out of four ECDIS manufacturers only one (ADVETO AB) placed a bid and got a contract. On the rest of the ferries (not all due to Covid 19) the project installed iPads and pilot plug transmitters. On the iPads there were installed the same navigation application (SEAiq Pilot) as the Swedish pilots are using, SEAiq pilot has also been upgraded with Efficient flow functionality. For details regarding how the setup was done on board the ferries see Figure 10 PPU Installation on EF Ferries
Figure 10 PPU Installation on EF Ferries

32
8.6.2 Technical installation description pilots The pilots are using a navigation application (SEAiq-pilot in Sweden and PilotPro in Finland) on iPad. The iPad get navigation information from the piloted ship via a pilotplugtransmitter. that is connected to ship´s navigation system. The PPU is connected to internet using sim card, to be able to communicate with EFHS.
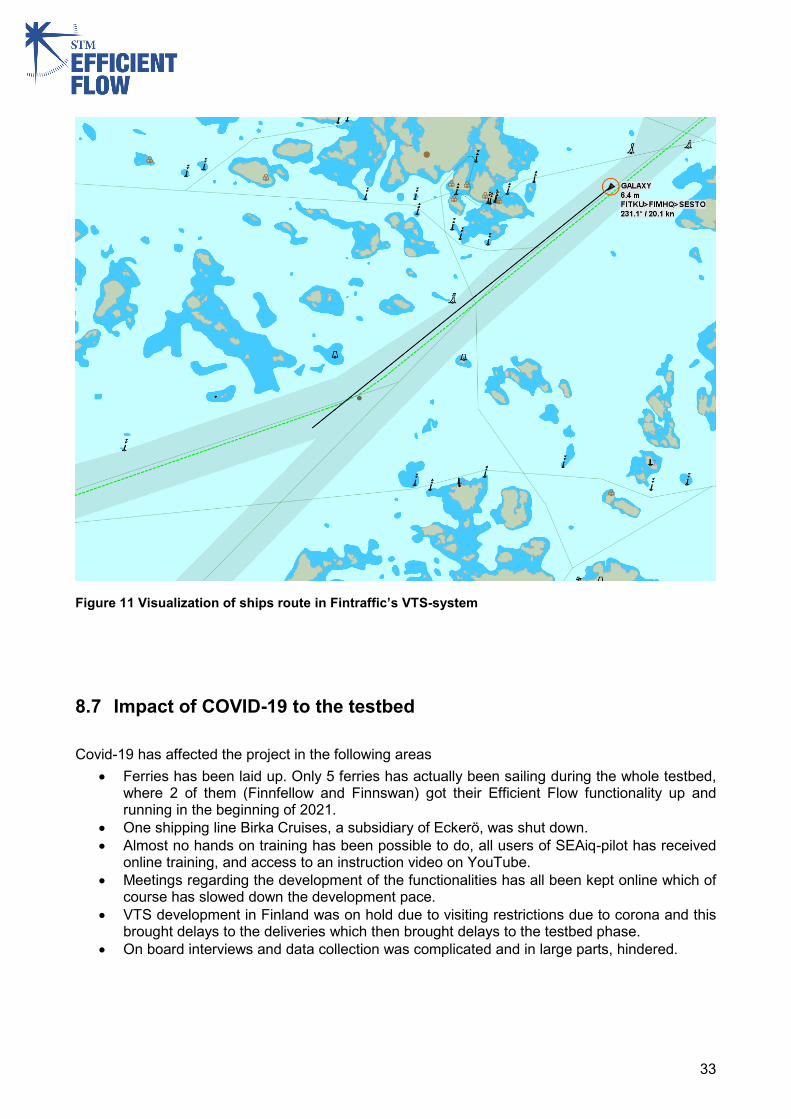
8.6.3 Technical installation description in VTS 8.6.3.1 VTS Sweden In Sweden a procurement of a new VTS system were being done during the course of the Efficient Flow project. Efficient Flow specific requirements were included in the procurement documentation. Unfortunately SMA withdrew from the contract with the assigned vendor due to information security issues which resulted in that no EF-tool were installed in the Swedish VTS system during the project time. 8.6.3.2 Fintraffic VTS Solution in Finland was implemented to present VTS software in use. Supplier received the tender as they are the sole provider that could integrate the new capabilities to Fintraffic´s existing VTS-software. This solution was selected in order to have the new capabilities in the operational software and thus available for all the VTS-operators in day-to-day work. The integration to Fintraffic´s operational systems was also chosen with project lifecycle in mind, 3rd party equipment and/or software wouldn’t have any use after the project testbed phase. Technical solution is part of MARITAS, Maritime Traffic Authority System provided by Navielektro Ky, a private company based in Kaarina, Finland. Navielektro provides high-end situational awareness, surveillance and communication systems for both civilian and military purposes. Their operations include software development and maintenance as well as manufacturing and maintenance of sensors. Navielektro aims to provide its customers with complete, integrated situational awareness solutions that span everything from operations centers to sensor networks. In Figure 11 Visualization of ships route in Fintraffic’s VTS-system, route received from a ship participating in the testbed can be seen (green)
33
Figure 11 Visualization of ships route in Fintraffic’s VTS-system
8.7 Impact of COVID-19 to the testbed Covid-19 has affected the project in the following areas
• Ferries has been laid up. Only 5 ferries has actually been sailing during the whole testbed, where 2 of them (Finnfellow and Finnswan) got their Efficient Flow functionality up and running in the beginning of 2021.
• One shipping line Birka Cruises, a subsidiary of Eckerö, was shut down. • Almost no hands on training has been possible to do, all users of SEAiq-pilot has received
online training, and access to an instruction video on YouTube. • Meetings regarding the development of the functionalities has all been kept online which of
course has slowed down the development pace. • VTS development in Finland was on hold due to visiting restrictions due to corona and this
brought delays to the deliveries which then brought delays to the testbed phase. • On board interviews and data collection was complicated and in large parts, hindered.

34
8.8 Testing of the MS Baltic Bright Adveto Ecdis Sea Traffic Management capabilities and Port of Rauma
Testing of the MS Baltic Bright Adveto Ecdis Sea Traffic Management capabilities and Port of Rauma Port Activity Application during Winter 20/21. Messages were sent in both directions successfully. Messages were visible at the bridge of the MS Baltic Bright and the Port of Rauma mobile application (see Figure 12 Screenshot from Port of Rauma mobile application).
Figure 12 Screenshot from Port of Rauma mobile application

35
9 KPI’s and objectives The testbed consisted of EfficientFlow- functionality in ferries ECDIS, in pilot´s PPUs and in VTS systems in Turku and Stockholm. Key performance indicators (KPI’s) were a set of quantifiable measurements that were used to chart EfficientFlow- tools performance against set objectives. KPI’s aim was to assist determining EfficientFlow- tool operational and organizational achievements focusing in the areas of safety and efficiency of the vessels utilizing the EfficientFlow- tool. STM related validation aims are: 1. Safety: Enhance safety of navigation in congested waters. 2. Safety: Enhance safety of ship meeting, overtaking and crossing situations. 3. Efficient: Enhance efficiency of ship meeting, overtaking and crossing situations.
9.1 Data collection methodology of KPIs Soft indicators have qualitative approach and aim grasping the attitudes and approaches of EF-tool users towards the usability and functionality of the tool in real life situations. Soft indicators have high value in this study due to the fact, that there is very limited time span between the start of the use of the EF-tool and the study. Soft indicators have limited up scalability and level of standardization, as they merely focus on monitoring the performance of a Level of satisfaction of users towards the tool is illustrated in Deliverable 2.11 and is deemed of high relevance in a man-machine interfaced working environment such as modern commercial vessel navigational bridge. Much of the focus is drawn to the presentation of data provided by the EF-tool, while a justified assumption is, that enhanced situational awareness knowing the intentions of other vessel will add to safety of the navigable fairway as a whole. A questionnaire and series of interviews was conducted for the selected user groups, namely navigators in test bed vessels and VTS operators. Interviews were conducted after the questionnaires to have a better understanding to the details revealed by the questionnaire.
9.2 Analysis of the KPIs results
9.2.1 Interviews The interview was conducted from 2021-04-13 to 2021-04-28 as an interview based on a preset number of questions, online by Håkan Heurlin from Swedish Maritime Administration. Interview situations were separate from each other, and respondents were not aware of the responses provided by others. As an over-arching finding from the interviews was the fact, the application contributes to the meetings of vessels only during the period of navigation but while moored and planning the departure.
9.2.2 On-line survey The online-survey aimed to collect qualitative data from bridge personnel of vessels that are equipped with EF-software tool. The questionnaire was made available for vessel personnel and VTS operators on 3d of March 2021 and was closed on 30th of April 2021. During the time of the data

36
collection responses from 34 navigational officers and 6 VTS operators was summoned. VTS operator responses were with very limited time of use resulting in respondent indications of knowledge of the system. Although the VTS online survey clearly indicated the future potential of the EF tool and its contribution to the shared situational awareness of the fairway users, any conclusions made based on VTS responses should be taken with precaution. Technical problems, short test period and small number of participants in the questionnaire all contribute to the fact that quantitative analysis with the aforesaid hindrances might not produce the most accurate results. All ranks had diverse experience and age resulting in no connections between age and experience in rank. Simultaneously no responded was less than 30 years of age at the time of the survey. Eight respondents gave 5 to one or more statements, where “1” was present in 24 responses.. In the online-survey the answering options were 1= totally agree, 2= agree, 3=neutral, 4=disagree, 5= totally disagree. It is noteworthy, that “5” was given by one of the respondents six times, while “1” was given 11 times by another respondent. One respondent gave “2” to 15 statements, and “1” to the first statement. Two responses had both “1” and “5” were present. Safety related questions Safety related responses aimed to reveal the immediate affect the EF-tool has to the operational safety in navigation in congested archipelagic fairways. Therefore, focus was drawn to the meetings and crossings of vessels, additionally to the question of overall safety contribution of the EF-tool. There is a clear majority acknowledging the EF tool contribution to safety. However, it appears, that the question for crossings of vessels in unwanted areas was left somewhat unclear for the respondents. There is no clear division between “meeting” and “crossing”, and this has possibly left to confusion among respondents. Interestingly, there were three respondents, who claimed the EF-tool having no contribution to safety what so ever. These three respondents all had various ages, levels of EF-toll usage, and different ranks. None was a pilot officer. This implies, that there could be a management of change related chanllenge with having new ways of working on board. Much of this is due to the limited time there was to offer for familiarization of the users within the scope of this project. Simultaneously, there is a possibility, that the user interface was uncomfortable for some respondents. This assumption is supported by the fact that the three respondents seeing EF tool not adding value to safety considered the EF-tool provided information hard to predict. Communication related questions Questions related to communications resulted in little polarization between the extremes. Most respondents were between “agree” and “disagree” in all three questions in this category. Although EF-tool undeniably reduces necessity to exchange verbal information between stakeholders, it remains with user responsibility and consideration to abstain from learned manners in using VHF regardless. Therefore, the elaborated affects to the necessity to communicate could be explained with the lack of getting used to the EF-tool and the non-constructed trust to the functionality of the system. Questions related to the usability of the EF-tool There is a wide distribution between the respondents in experiencing the usability of the EF-tool. No extremes were much present, however, neutral played significant role reflecting no strong opinion to either direction. This could be explained with the low level of use in timeline. System is still very young and in best case users have less than one year experience in using the EF-tool. Those, which totally disagreed with EF-tool ease of interpretation, were with all ages, ranks and levels of user

37
experience. Therefore, it is impossible to make interpretations related to the respondent profiles. User as individuals are different and have various ways of working. Undeniably, functionality of the vessel internet system plays a role here. As one respondent commented in the questionnaire: “All depends on vessels internet connections.” For the relevance of information there was strong neutrality present. No strong opinions was expressed to one or another direction although the ease of interpretation emerged various answers to “totally agree” and “totally disagree”. EF-tool provided information was seen with relevance and accurate. EF-tool contribution to maintaining vessel schedule related answers offer an interesting insight to the schedule impact of the EF tool, as there is exceptionally strong neutrality among the respondents. This could be explained with the fact that most vessels responded were tightly scheduled ferries where the impact of EF tool is seen as a safety contributor rather than a financial and/or schedule related. This conclusion is further supported by the fact, that the ferries mostly meet other ferries in the archipelagic fairways resulting in a situation, where all engaged are scheduled ferries. This led to pre-determinate area of meeting a certain scheduled ferry, that again leads to little affect to predictability of the navigation. Finally, EF tool affects to resource management on board is evenly distributed between the respondents. Many saw positive impact to resource planning, however, few respondents saw no positive affects to the use of resources on board.

38
10 Evaluation of the project Sea Traffic Management (STM) is an answer to the need for improved efficiency in maritime transport; within port areas as well as between ports. The STM concept takes a holistic view on services within maritime transport, from quay to quay. STM is a concept for optimizing the processes, interaction between stakeholders and exchange of information. Improved exchange of information is an important facilitator for increased situational awareness, shortened lead times in the port call process and thereby improved efficiency, safety of navigation and environmental performance. STM has been defined in the MONALISA 2.0 project and is validated in the STM Validation Project. EfficientFlow was built on the outcomes from these two projects. The EfficientFlow project contributed to more efficient traffic flow in the two corridors Gävle-Rauma and Stockholm-Turku by implementation of Sea Traffic Management and its integration into the full logistic chain. The results consist of less manual information exchange, improved processes and practical Sea Traffic Management capabilities, what have been proved by testing and questionnaires results. In the ScanMed corridor, the two national authorities, Swedish Maritime Administration and the Finnish Transport Agency, both being partners in the EfficientFlow project, were monitoring and providing information and guidance to the ship traffic to support traffic organization. The fairways in the corridor are intensively operated by ferries, cruise ships and other ships. Some traffic through this corridor is also calling the ports of Gävle and Rauma. All the ferry operators in the corridor confirmed the need of the action and were interested in implementing STM onboard their ships presently operating the corridor in a beginning of project. The pilots could have STM functionality in their portable pilot units (PPU). The flow optimization services implemented in the EfficientFlow project could be included in the operating processes of the ships and VTS. There were a genuine interest from the involved stakeholders to implement and maintain the services after the end of the EfficientFlow project. The solutions are open and standardized. Project specific objectives The WPT2 main objective was to introduce the Flow optimization (FO) in the regular ferry traffic in order to facilitate FO in the ScanMed corridor via Stockholm and Turku and to improve situational awareness, facilitate higher predictability and efficiency as well as time saving and safety in the corridor. The WPT2 included decision support of the pilots, onboard solutions for the ferries in regular traffic including specifications and procurement, Port/Port call synchronisation in area of Stockholm and Turku and system connector, System development/integration/installation, training of personnel onboard the ships, pilots and VTS personnel and had put the flow optimization service in operation. Concept for Flow management The Flow Management (FM) is one of the strategic concepts of Sea Traffic Management (STM). Flow Management focuses on optimizing the overall maritime traffic flow within a specific geographical region both regarding time (e.g. arrival/departure from ports) and space (e.g. avoiding close quarter situations for safety reasons). The knowledge of all or nearly all ship’s route plans and schedules within a specific region gives rise to the possibility of coordinating the traffic.
39
A definition of the concept of the Flow management and operational processes that described how the flow optimization in the corridor could be operationalized was developed The definition was developed using traffic analysis and defined user needs as a basis. The definition of the concept was needed for using the STM functionality in the testbed, in the corridor Stockholm-Turku including upgrade of Shore Centers in Stockholm and Turku, Portable Pilot Units (PPU), onboard systems and a complete testbed and in future implementations in other corridors. The equipment ashore in the Vessel Traffic Services Centre in Turku and Stockholm were made STM compliant and support the flow optimization services. The Portable Pilot Units were made STM compliant and support the flow optimization services. The upgraded units made it easier for pilots in the port to make decisions regarding arriving and outgoing ships. Ships in regular traffic on the corridor, including about 10 ferries between Stockholm and Turku were made STM compliant by upgrading the navigational system onboard. Selected ships which were used in the T1 Work Package “Port Flow Optimization” and which are regularly calling the ports of Gävle and Rauma were also included in this upgrade. After upgrading the VTS and the Portable Pilot Units the systems were made operational and the testing was carried out in the normal operations of the ships operations, pilots and VTS operators (VTS operators only to a certain degree due to delayed delivery). By developing and implementing tools to support flow optimization in fairways and slot-time allocation in the corridor, ships could be provided with a “green wave” through narrow straits in the archipelagos between Sweden and Finland. Optimized ship operations in the ScanMed corridor By Sea Traffic Management, the ship traffic in the ScanMed corridor was optimized by more automatic exchange of navigational information ship-to-ship and ship-to-shore. Ferries and some other ships in regular traffic in the ScanMed corridor were made STM compliant by an upgrade of their navigational system. The Vessel Traffic Services carried Finnish Transport Agency (now Fintraffic) were made STM compliant and the pilots in the region had STM compliance integrated in their portable pilot units. This allowed the appliance of flow optimization services which contributed to the optimized ship operations in the ScanMed corridor.- Analysis of the KPIs results and reliability of the study Data collection among vessel users (including pilots) was proven functional and generally acknowledged 15% limitation of the target group was well reached and presented in the study. Major weakness in this study and related data collection was the time the respondents had to use the EF tool. Therefore, any long reaching conclusions should be based on longer time span in use of the EF tool and thus wider shoulders for the trustworthiness of the study. Spread of the EF tool and data collection of its use in different vessels and in different environments was safeguarded through the pilots., whom took the EF tool with them in the PPU and used it during pilotages in numerous different vessels and vessel types. As pilots represented 14 out of 34 participants in the online questionnaire, the sampling of vessel types is a reliable representation of the reality in the vessel traffic in the region. Interviews of the vessel personnel turned out to be challenging due to the pandemic situation in the aftermath of coronavirus. Many agreed interview situations were cancelled. Demand for agility in
40
arising situations casted a shadow to the data collection throughout the scope of the project. VTS data was collected in Finland with an online survey, but due to the technical hurdles with the service provider NaviElectro used by the Finntraffic VTS as sole technical provider of the VTS system, only six responses were gathered. The online survey responses thus merely provided the views of the Finnish VTS, and none from the Swedish VTS, where the engagement of EF tool to the Swedish VTS infrastructure was hindered by the regulatory framework. Therefore, the VTS contribution to the study was handled in a generic level with limited focus to details.
Covid-19 affect to the project The character of the project was dependent on close collaboration between the beneficiaries and between the users. The project was implemented by different working groups. Face to face meetings, living labs, workshops, seminars were supposed to be regularly held. Unfortunately part of them were held online or cancelled because of COVID-19. The biggest influence of the COVID-19 restrictions were in cancelation of the cruise ships what have been visiting Stockholm and Turku on regular basis during normal conditions. Also some of the liner ferries were laid up, and even one, M/S Mariella was sold. Also it was impossible to organise face-to-face meetings, same as any visits to ships and to the VTS centre in Turku were prohibited. VTS operators could not participate fully in testbed and answer to all questions in Questionnaire properly. In Sweden updating the VTS system was postponed. Due to the COVID-19 outbreak the semi-structured interviews were eventually held online. In regular traffic have been planned to include approximately 15-20 ships, unfortunately because of COVID-19 situation only 10 ships was included. Where actually about 5 of them were in traffic during the testbed period. Reliability of the research Data collection among vessel users was proven functional. Generally 15% is acknowledged as a minimum threshold of the target group for a trustworthy research. In this case it was well reached.. A weakness in this study and related data collection was the limited time the respondents had to use the EF tool. Therefore, any long reaching conclusions should be based on longer time span in use of the EF tool and thus wider shoulders for the trustworthiness of the study. Spread of the EF tool and data collection of its use in different vessels and in different environments was safeguarded through the pilots, whom took the EF tool with them in the PPU and used it during pilotages in numerous different vessels and vessel types. As pilots represented 14 out of 34 participants in the online questionnaire, the sampling of vessel types is a reliable representation of the reality in the vessel traffic in the region.
41
11 Conclusions
The EfficientFlow project WPT2 provided STM capabilities with new ICT-tool in the port of Stockholm, ferries, piloted vessels and VTS centre in Turku . The aim was to use Flow Management to ensure the safe passage of ships in restricted areas in ScanMed corridor. This could facilitate optimization of route planning by information exchange ship-to-ship and ship-to-shore. The aim was to make meetings, overtaking or crossing situations safer and more efficient. By developing and implementing tools to support flow optimization in fairways and slot-time allocation in the corridor, ships could be provided with a “green wave” through narrow straits in the archipelagos between Sweden and Finland. Efficient Flow WPT2 aimed to make 7% time saving in comparison to the past without the use of various tools and functions established through the development of Efficient Flow WPT1 and T2. However ambitious the 7% was, it was noteworthy, that the STM capabilities were a tool to achieve the 7%, not the goal itself. Therefore, as the aim of this document is to collect the data that illustrates the increased efficiency and providing of the STM concept in a live. EfficientFlow project outcome and Port Activity App and STM capabilities are only as good as the people who use it. The real impact of the STM capabilities was to attract users to share information for the effective timing of the formerly known activities. Finally, all evaluations based on the performance of the STM capabilities should be monitored through the user of the application. As can be seen in deliverable D.T2.11.1 CB607_Collection of data for analysis and evaluation, chapter 3.6, a RTZ comparing tool was used in the testbed to log data regarding how often ships have an arising meeting in unwanted areas and how long before that meeting occasion information can be available. In the report two such areas were selected (Furusund and Ålandskobb) and from the data it was calculated that the meeting occasion were detected at an average of 8hrs 45min before the occasion were calculated to actually occur. Of course the above mentioned time depends on when ships share their route and schedule. If the ships share their route and schedule as early as possible, information regarding meeting occasions can be available at a very early stage. The earlier information regarding meeting occasions is available the earlier ships can plan an action to avoid the meeting occasion and the earlier that action is taken the more fuel can be saved. It should be noted that there is maybe no idea to take action e.g. 8 hrs before a meeting occasion since there might be other factors affecting the ships arrival time to the area, but the ships will get an early warning about what is about to happen and can take that into their own planning of their voyage. Flow optimization new STM capabilities could be used in areas with limited capacity for ship traffic. In addition to traffic in the archipelagos, the concept could be used in for inland waterways, coastal traffic, fairways with canals and locks etc. The specifications and the materials prepared for the public procurement of making the VTS systems STM compliant and with possibility to manage flow optimization services were shared openly with other VTS and actors. The specifications for the onboard systems were shared with all manufacturers of navigational system and allowed them to adopt to the services. The results also were shared with universities and research institutes to be used in research. Lessons learnt could be transferred to education and capacity-building.

42
The primary objective of EfficientFlow- tool was to benefit stakeholders through success in areas of safety and efficiency of the shipping operation. This can only be achieved by developing and applying an appropriate strategy for the use of the EfficientFlow- tool. Being a successful shipping company requires management ability to ensure organization meets set objectives. Furthermore, how success is determined in the future and what measures must be taken to meet the future objectives not applicable to date? How will the senior management make sure that objectives are fulfilled and at what extend? An assessment of shipping company success potential should include criteria focused on the areas of safety and efficiency through time savings and speed optimization in shipping operations. (Stanivuk; Bošnjak;& Franić, 2018; Valdez Banda; Hänninen; Lappalainen; Kujala; & Goerlandt, 2014; Edacherian, 2019; Ndefru, 2019; Ndefru, 2019) Shipping companies set strategies for reaching reach objectives. Reciprocally, shipping companies create processes for materializing set strategies. This is done through the achievement of objectives. This is a continuous cycle that applies in full to the development and assessment of the EfficientFlow- tool. Therefore, the foundations of successful shipping operation are set by correctly planned and conducted processes. (Edacherian, 2019; Konsta & Plomaritou, 2012) The EfficientFlow project improves the flow of goods and people in the Central Baltic region. Other ports and corridors in the region have possibilities to gain development opportunities by applying the experiences learnt from EfficientFlow. The transport eco-system is complex and the introduction of new concepts of digitalization, such as STM, requires willingness, time and resources. The invested resources contribute to long-lasting real hands-on changes in the functioning of the transport corridor Stockholm-Turku and improve its digital maturity. And, it also contributes to achieve the transport policy goals of both the EU, the involved countries and the Central Baltic region at large. The value proposition of the EfficientFlow project encompasses increased situational awareness among the actors in the ports and at sea in the corridors; connected port and more flexible route planning; improved port-hinterland information exchange; well-coordinated, faster and more optimized port operations; improved just-in-time processes, saved fuel, less waiting times, improved planning horizon, improved berth productivity; and increased flexibility in case of non-expected events. As a result, ships could adjust speed in order to arrive just-in-time, which means making maritime transport more energy efficient, decreases harmful emissions (CO2), provides positive impact on erosion as well as provides safety and socio-economic benefits to the corridors. Increased accuracy of information by digitization, waiting times and lead times could be reduced in all parts of the logistic chain and a large number of telephone calls between actors could be reduced to a minimum by the introduction of new ICT tools adding to time savings in the movement of goods. The risk of misunderstanding and misinterpretation of information could be reduced, which contributes to reduced movement time of goods in the corridors. The results achieved could last beyond the lifetime of the project and are transferrable to other ports and countries in the Central Baltic area. Proposed future research and next steps
• Roles of VTS operators and maritime pilots in the future. • In order to validate the positive/negative outcome of EF tool and to be able to make any
long reaching conclusions the EF tool need to be evaluated during a longer timespan. • Research continuity in new environments to reveal potential to upscale.

43
• Consider the suitability to use route exchange in future projects regarding shorebased navigational assistance service.

44
12 References Edacherian, A. (2019). Key Performance Indicators for Continuous Quality Improvement. Workshop
on Strategic Planning, KPIs and Learning Outcomes. doi:10.13140/RG.2.2.21770.00964 Final Report on STM Validation Project https://s3-eu-west-1.amazonaws.com/stm-
stmvalidation/uploads/20190709125520/STM-Validation-Final-report.pdf Gözacan, N., & Lafci, Ç. (2020). Evaluation of Key Performance Indicators of Logistics Firms.
Logistics & Sustainable Transport. doi:10.2478/jlst-2020-0002 Konsta, K., & Plomaritou, E. (2012). Key Performance Indicators (KPIs) and Shipping Companies
Performance Evaluation: The Case of Greek Tanker Shipping Companies. International Journal of Business and Management. doi:10.5539/ijbm.v7n10p142
Ndefru, A. (2019). Preparing for Success with Key Performance Indicators. Stanivuk, T., Bošnjak, R., & Franić, B. (2018). Accident Statistics and Key Performance Indicators
in Marine Offshore Industry. International Journal of Maritime Science and Technology. doi:10.17818/NM/2019/1.3
STM web-page https://www.seatrafficmanagement.info/about-stm/ Valdez Banda, O., Hänninen, M., Lappalainen, J., Kujala, P., & Goerlandt, F. (2014). A method for
extracting key performance indicators. WMU Journal of Maritime Affairs. doi:10.1007/s13437-015-0095-z

45
Efficient port calls and traffic Flow in narrow waters
In STM EfficientFlow, the Baltic ports of Rauma and Gävle implement efficient
port calls using real-time information. Improved traffic flow converts waiting times into increased safety and bunker savings for large ships in the narrow
Swedish and Finnish archipelagos. Making STM happen!
SAFETY - ENVIRONMENT - EFFICIENCY
Swedish Maritime Administration ◦ Fintraffic VTS ◦ Port of Gävle ◦ Port of Rauma ◦ Satakunta University of Applied Sciences (SAMK)
www.efficientflow.eu www.stmvalidation.eu/projects/efficientflow