efficient discovery of heterogeneous treatment effects via ...neill/papers/tess2018.pdf ·...
TRANSCRIPT

Efficient Discovery ofHeterogeneous Treatment Effects via Anomalous Pattern Detection
Edward McFowland [email protected]
Joint work with (Sriram Somanchi & Daniel B. Neill)
1

Agenda
• Introduction and Motivation• Machine Learning’s Contributions (and Limits)• How Anomaly Detection Can Help• Treatment Effect Subset Scan– Algorithm– Statistical Properties
• Results• Conclusions
2

Treatment Effect Heterogeneity
3
Control Group
Treatment Group
Age = Young
Age = Mid
Age = Old

___
• Positive and negative effects can cancel
Treatment Effect Heterogeneity
4
Control Group
Treatment Group
Age = Young
Age = Mid
Age = Old
( )PositiveEffect
( )NegativeEffect
( )NoEffect
( )NoEffect

___
Treatment Effect Heterogeneity
5
Control Group
Treatment Group
Age = Young
Age = Mid
Age = Old
( )PositiveEffect
( )NoEffect
( )NoEffect
• Positive and negative effects can cancel
• True effect can be masked( )NoEffect

( )SlightEffect
( )Very PositiveEffect
___
Treatment Effect Heterogeneity
6
Control Group
Treatment Group
Age = Young
Age = Mid
Age = Old ( )NoEffect
( )NoEffect
• Positive and negative effects can cancel
• True effect can be masked
• Effects could really be driven by a subpopulation

( )SlightEffect
( )Very PositiveEffect
___
Treatment Effect Heterogeneity
7
Control Group
Treatment Group
Age = Young
Age = Mid
Age = Old ( )NoEffect
( )NoEffect
• Positive and negative effects can cancel
• True effect can be masked▫ Ex: FDA Approved BiDil Drug
• Effects could really be driven by a subpopulation▫ Ex: Perry Preschool

8
…..
Control Group
Treatment Group
Treatment Effect Heterogeneity

Agenda
• Introduction and Motivation• Machine Learning’s Contributions (and Limits)• How Anomaly Detection Can Help• Treatment Effect Subset Scan– Algorithm– Statistical Properties
• Results• Conclusions
9

• Regression Methods– OLS and Regularized Regression (e.g., LASSO)*– Imai and Ratkovic (2013)– Taddy et al. (2016)
• Single Tree Methods– Su et al (2009)– Imai and Strauss (2011)– Athey and Imbens (2017)*
• Ensemble Methods– Grimmer et al. (2017)– Wager and Athey (2017)*
10
Machine Learning’s Contributions
* provide frequentist asym confidence intervals, for inference of effects significance
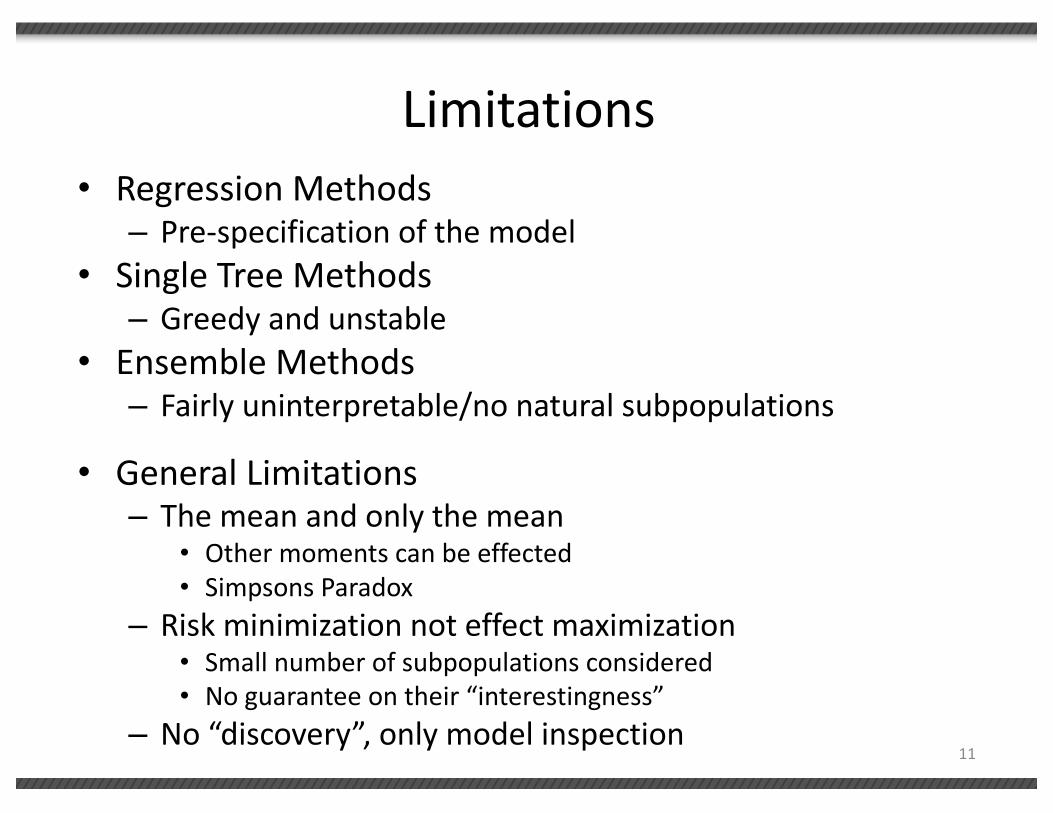
• Regression Methods– Pre-specification of the model
• Single Tree Methods– Greedy and unstable
• Ensemble Methods– Fairly uninterpretable/no natural subpopulations
• General Limitations– The mean and only the mean
• Other moments can be effected• Simpsons Paradox
– Risk minimization not effect maximization• Small number of subpopulations considered• No guarantee on their “interestingness”
– No “discovery”, only model inspection11
Limitations

Agenda
• Introduction and Motivation• Machine Learning’s Contributions (and Limits)• How Anomaly Detection Can Help• Treatment Effect Subset Scan– Algorithm– Statistical Properties
• Results• Conclusions
12

Anomaly Detection Paradigm
• Identifying when a “system” deviates away from its expected behavior.
13

Normal Activity (M0)
Anomalous Pattern Detection Procedure
Test Data
Detect Anomalous Pattern Given
M0
YOKOHAMA SEATTLE JAPAN CSCO LING_YUN_HE ORDER ORDER_OF_SHIPPERUSED_TIRE 2 13.43 9497YOKOHAMA SEATTLE JAPAN CSCO LING_YUN_HE ORDER ORDER_OF_SHIPPERUSED_TIRE 2 13.43 9497YOKOHAMA SEATTLE JAPAN CSCO LING_YUN_HE AMERICAN_TRI_NET_EXPRESSTRI_NET CRUDE_IODINE_PURITY 1 17.68 251151YOKOHAMA SEATTLE JAPAN CSCO LING_YUN_HE NEW_WAVE_TRANSPORT JIT PANELS_F_MODEL_98 3 39.57 65169
Novel PatternA4 A5
A6
A1
A3
A2
14

HTE Pattern Detection
Detect Anomalous Pattern Given
M0
YOKOHAMA SEATTLE JAPAN CSCO LING_YUN_HE ORDER ORDER_OF_SHIPPERUSED_TIRE 2 13.43 9497YOKOHAMA SEATTLE JAPAN CSCO LING_YUN_HE ORDER ORDER_OF_SHIPPERUSED_TIRE 2 13.43 9497YOKOHAMA SEATTLE JAPAN CSCO LING_YUN_HE AMERICAN_TRI_NET_EXPRESSTRI_NET CRUDE_IODINE_PURITY 1 17.68 251151YOKOHAMA SEATTLE JAPAN CSCO LING_YUN_HE NEW_WAVE_TRANSPORT JIT PANELS_F_MODEL_98 3 39.57 65169
Novel Pattern
15
Outcome Gender Race Age Decile SLINE VESSEL SHIPPER NAME F NAME COMMODITY
0.00 M B 2 CSCO LING_YUN_HE AMERICAN_TRI_NET_EXPRESSTRI_NET EMPTY_RACK2.00 F W 4 CSCO LING_YUN_HE ORDER ORDER_OF_SHIPPERUSED_TIRE2.00 M H 4 CSCO LING_YUN_HE ORDER ORDER_OF_SHIPPERUSED_TIRE1.00 F A 8 CSCO LING_YUN_HE AMERICAN_TRI_NET_EXPRESSTRI_NET CRUDE_IODINE_PURITY3.00 M A 4 CSCO LING_YUN_HE NEW_WAVE_TRANSPORT JIT PANELS_F_MODEL_983.00 M B 3 CSCO LING_YUN_HE NEW_WAVE_TRANSPORT JIT PANELS_F_MODEL_983.00 F W 6 CSCO LING_YUN_HE NEW_WAVE_TRANSPORT JIT PANELS_F_MODEL_982.00 M W 3 CSCO LING_YUN_HE ORDER ORDER_OF_SHIPPERUSED_TIRES0.00 F W 2 CSCO LING_YUN_HE CHINA_OCEAN_SHPG CHINA_OCEAN_SHPG_AGENCYEMPTY_CONTAINERS2.00 M B 2 CSCO LING_YUN_HE CHINA_OCEAN_SHPG CHINA_OCEAN_SHPG_AGENCYEMPTY_CONTAINERS
TreatmentGroup
ControlGroup
Outcome Gender Race Age Decile SLINE VESSEL SHIPPER NAME F NAME COMMODITY
0.00 M B 2 CSCO LING_YUN_HE AMERICAN_TRI_NET_EXPRESSTRI_NET EMPTY_RACK2.00 F W 4 CSCO LING_YUN_HE ORDER ORDER_OF_SHIPPERUSED_TIRE2.00 M H 4 CSCO LING_YUN_HE ORDER ORDER_OF_SHIPPERUSED_TIRE1.00 F A 8 CSCO LING_YUN_HE AMERICAN_TRI_NET_EXPRESSTRI_NET CRUDE_IODINE_PURITY3.00 M A 4 CSCO LING_YUN_HE NEW_WAVE_TRANSPORT JIT PANELS_F_MODEL_983.00 M B 3 CSCO LING_YUN_HE NEW_WAVE_TRANSPORT JIT PANELS_F_MODEL_983.00 F W 6 CSCO LING_YUN_HE NEW_WAVE_TRANSPORT JIT PANELS_F_MODEL_982.00 M W 3 CSCO LING_YUN_HE ORDER ORDER_OF_SHIPPERUSED_TIRES0.00 F W 2 CSCO LING_YUN_HE CHINA_OCEAN_SHPG CHINA_OCEAN_SHPG_AGENCYEMPTY_CONTAINERS2.00 M B 2 CSCO LING_YUN_HE CHINA_OCEAN_SHPG CHINA_OCEAN_SHPG_AGENCYEMPTY_CONTAINERS

HTE Pattern Detection
Detect Anomalous Subpopulation
GivenM0
YOKOHAMA SEATTLE JAPAN CSCO LING_YUN_HE ORDER ORDER_OF_SHIPPERUSED_TIRE 2 13.43 9497YOKOHAMA SEATTLE JAPAN CSCO LING_YUN_HE ORDER ORDER_OF_SHIPPERUSED_TIRE 2 13.43 9497YOKOHAMA SEATTLE JAPAN CSCO LING_YUN_HE AMERICAN_TRI_NET_EXPRESSTRI_NET CRUDE_IODINE_PURITY 1 17.68 251151YOKOHAMA SEATTLE JAPAN CSCO LING_YUN_HE NEW_WAVE_TRANSPORT JIT PANELS_F_MODEL_98 3 39.57 65169
Novel Pattern
16
Outcome Gender Race Age Decile SLINE VESSEL SHIPPER NAME F NAME COMMODITY
0.00 M B 2 CSCO LING_YUN_HE AMERICAN_TRI_NET_EXPRESSTRI_NET EMPTY_RACK2.00 F W 4 CSCO LING_YUN_HE ORDER ORDER_OF_SHIPPERUSED_TIRE2.00 M H 4 CSCO LING_YUN_HE ORDER ORDER_OF_SHIPPERUSED_TIRE1.00 F A 8 CSCO LING_YUN_HE AMERICAN_TRI_NET_EXPRESSTRI_NET CRUDE_IODINE_PURITY3.00 M A 4 CSCO LING_YUN_HE NEW_WAVE_TRANSPORT JIT PANELS_F_MODEL_983.00 M B 3 CSCO LING_YUN_HE NEW_WAVE_TRANSPORT JIT PANELS_F_MODEL_983.00 F W 6 CSCO LING_YUN_HE NEW_WAVE_TRANSPORT JIT PANELS_F_MODEL_982.00 M W 3 CSCO LING_YUN_HE ORDER ORDER_OF_SHIPPERUSED_TIRES0.00 F W 2 CSCO LING_YUN_HE CHINA_OCEAN_SHPG CHINA_OCEAN_SHPG_AGENCYEMPTY_CONTAINERS2.00 M B 2 CSCO LING_YUN_HE CHINA_OCEAN_SHPG CHINA_OCEAN_SHPG_AGENCYEMPTY_CONTAINERS
TreatmentGroup
ControlGroup
Outcome Gender Race Age Decile SLINE VESSEL SHIPPER NAME F NAME COMMODITY
0.00 M B 2 CSCO LING_YUN_HE AMERICAN_TRI_NET_EXPRESSTRI_NET EMPTY_RACK2.00 F W 4 CSCO LING_YUN_HE ORDER ORDER_OF_SHIPPERUSED_TIRE2.00 M H 4 CSCO LING_YUN_HE ORDER ORDER_OF_SHIPPERUSED_TIRE1.00 F A 8 CSCO LING_YUN_HE AMERICAN_TRI_NET_EXPRESSTRI_NET CRUDE_IODINE_PURITY3.00 M A 4 CSCO LING_YUN_HE NEW_WAVE_TRANSPORT JIT PANELS_F_MODEL_983.00 M B 3 CSCO LING_YUN_HE NEW_WAVE_TRANSPORT JIT PANELS_F_MODEL_983.00 F W 6 CSCO LING_YUN_HE NEW_WAVE_TRANSPORT JIT PANELS_F_MODEL_982.00 M W 3 CSCO LING_YUN_HE ORDER ORDER_OF_SHIPPERUSED_TIRES0.00 F W 2 CSCO LING_YUN_HE CHINA_OCEAN_SHPG CHINA_OCEAN_SHPG_AGENCYEMPTY_CONTAINERS2.00 M B 2 CSCO LING_YUN_HE CHINA_OCEAN_SHPG CHINA_OCEAN_SHPG_AGENCYEMPTY_CONTAINERS

HTE Pattern Detection
Detect Anomalous Subpopulation
GivenM0
17
Outcome Gender Race Age Decile SLINE VESSEL SHIPPER NAME F NAME COMMODITY
0.00 M B 2 CSCO LING_YUN_HE AMERICAN_TRI_NET_EXPRESSTRI_NET EMPTY_RACK2.00 F W 4 CSCO LING_YUN_HE ORDER ORDER_OF_SHIPPERUSED_TIRE2.00 M H 4 CSCO LING_YUN_HE ORDER ORDER_OF_SHIPPERUSED_TIRE1.00 F A 8 CSCO LING_YUN_HE AMERICAN_TRI_NET_EXPRESSTRI_NET CRUDE_IODINE_PURITY3.00 M A 4 CSCO LING_YUN_HE NEW_WAVE_TRANSPORT JIT PANELS_F_MODEL_983.00 M B 3 CSCO LING_YUN_HE NEW_WAVE_TRANSPORT JIT PANELS_F_MODEL_983.00 F W 6 CSCO LING_YUN_HE NEW_WAVE_TRANSPORT JIT PANELS_F_MODEL_982.00 M W 3 CSCO LING_YUN_HE ORDER ORDER_OF_SHIPPERUSED_TIRES0.00 F W 2 CSCO LING_YUN_HE CHINA_OCEAN_SHPG CHINA_OCEAN_SHPG_AGENCYEMPTY_CONTAINERS2.00 M B 2 CSCO LING_YUN_HE CHINA_OCEAN_SHPG CHINA_OCEAN_SHPG_AGENCYEMPTY_CONTAINERS
TreatmentGroup
ControlGroup
Outcome Gender Race Age Decile SLINE VESSEL SHIPPER NAME F NAME COMMODITY
0.00 M B 2 CSCO LING_YUN_HE AMERICAN_TRI_NET_EXPRESSTRI_NET EMPTY_RACK2.00 F W 4 CSCO LING_YUN_HE ORDER ORDER_OF_SHIPPERUSED_TIRE2.00 M H 4 CSCO LING_YUN_HE ORDER ORDER_OF_SHIPPERUSED_TIRE1.00 F A 8 CSCO LING_YUN_HE AMERICAN_TRI_NET_EXPRESSTRI_NET CRUDE_IODINE_PURITY3.00 M A 4 CSCO LING_YUN_HE NEW_WAVE_TRANSPORT JIT PANELS_F_MODEL_983.00 M B 3 CSCO LING_YUN_HE NEW_WAVE_TRANSPORT JIT PANELS_F_MODEL_983.00 F W 6 CSCO LING_YUN_HE NEW_WAVE_TRANSPORT JIT PANELS_F_MODEL_982.00 M W 3 CSCO LING_YUN_HE ORDER ORDER_OF_SHIPPERUSED_TIRES0.00 F W 2 CSCO LING_YUN_HE CHINA_OCEAN_SHPG CHINA_OCEAN_SHPG_AGENCYEMPTY_CONTAINERS2.00 M B 2 CSCO LING_YUN_HE CHINA_OCEAN_SHPG CHINA_OCEAN_SHPG_AGENCYEMPTY_CONTAINERS 0.00 M B 2 CSCO LING_YUN_HE AMERICAN_TRI_NET_EXPRESS TRI_NET EMPTY_RACK
2.00 M B 2 CSCO LING_YUN_HE AMERICAN_TRI_NET_EXPRESS TRI_NET EMPTY_RACK2.00 M B 2 CSCO LING_YUN_HE AMERICAN_TRI_NET_EXPRESS TRI_NET EMPTY_RACK1.00 M B 2 CSCO LING_YUN_HE AMERICAN_TRI_NET_EXPRESS TRI_NET EMPTY_RACK3.00 M B 2 CSCO LING_YUN_HE AMERICAN_TRI_NET_EXPRESS TRI_NET EMPTY_RACK
Subpopulation

Agenda
• Introduction and Motivation• Machine Learning’s Contributions (and Limits)• How Anomaly Detection Can Help• Treatment Effect Subset Scan– Algorithm– Statistical Properties
• Results• Conclusions
18

The Goal
19
Detect a subpopulation (subsets of attribute values), which correspond to anomalous outcomes for subjects in the treatment group
Black
White
Asian
Hispanic
Other
Native American
Male Female

The Goal
20
Detect a subpopulation (subsets of attribute values), which correspond to anomalous outcomes for subjects in the treatment group
The Optimizations1 Í {a1…at}, … , sM Í {a1…ap}
Black
White
Asian
Hispanic
Other
Native American
Male Female

The Goal
21
Detect a subpopulation (subsets of attribute values), which correspond to anomalous outcomes for subjects in the treatment group
The Optimizations1 Í {a1…at}, … , sM Í {a1…ap}
S = s1 ´ … ´ sM
Black
White
Asian
Hispanic
Other
Native American
Male Female

The Goal
22
Detect a subpopulation (subsets of attribute values), which correspond to anomalous outcomes for subjects in the treatment group
The Optimizations1 Í {a1…at}, … , sM Í {a1…ap}
S = s1 ´ … ´ sMS* = argmaxS F(S)
Black
White
Asian
Hispanic
Other
Native American
Male Female

Treatment Effects Subset Scan (TESS)
23
Black
White
Asian
Hispanic
Other
Native American
I. Compute the statistical anomalousnessof each treatment group subject
II. Detect subpopulation that is collectively the most anomalous
Male Female
YBM YBF
YWM YWF
YHM
YAM
YNM
YOM
YHF
YAF
YNF
YOF

24
II. Detect subpopulation that is collectively the most anomalous
-- This measurement will be a p-value
-- Many subjects with significant p-values
I. Compute the statistical anomalousnessof each treatment group subject
Black
White
Asian
Hispanic
Other
Native American
Male FemaleTreatment Effects Subset Scan (TESS)
PBM PBF
PWM PWF
PHM
PAM
PNM
POM
PHF
PAF
PNF
POF

1. Estimate Conditional Distribution Under H0
25
Control Group
I. Compute the statistical anomalousnessof each treatment group subject
Black
White
Asian
Hispanic
Other
Native American
Male Female
YBM YBF
YWM YWF
YHM
YAM
YNM
YOM
YHF
YAF
YNF
YOF
Treatment Effects Subset Scan (TESS)

1. Estimate Conditional Distribution Under H0
26
Treatment Group
I. Compute the statistical anomalousnessof each treatment group subject
Black
White
Asian
Hispanic
Other
Native American
Male Female
YBM YBF
YWM YWF
YHM
YAM
YNM
YOM
YHF
YAF
YNF
YOF
2. Compute empirical p-values
Treatment Effects Subset Scan (TESS)

1. Estimate Conditional Distribution Under H0
27
Treatment Group
I. Compute the statistical anomalousnessof each treatment group subject
Black
White
Asian
Hispanic
Other
Native American
Male Female
YBM YBF
YWM YWF
YHM
YAM
YNM
YOM
YHF
YAF
YNF
YOF
yiBF
2. Compute empirical p-values
Treatment Effects Subset Scan (TESS)

28
Treatment Effects Subset Scan (TESS)
I. Compute the statistical anomalousness
of each treatment group subject
1. Estimate Conditional Distribution
Under H0
Treatment Group
Black
White
Asian
Hispanic
Other
Native
American
Male Female
PBM PBF
PWM PWF
PHM
PAM
PNM
POM
PHF
PAF
PNF
POF
2. Compute empirical p-values

29
I. Compute the statistical anomalousnessof each treatment group subject
1. Estimate Conditional Distribution Under H0
Treatment Group
Black
White
Asian
Hispanic
Other
Native American
Male Female
PBM PBF
PWM PWF
PHM
PAM
PNM
POM
PHF
PAF
PNF
POF
2. Compute empirical p-valuesi. Maps each bin’s distribution to the
same interval
Treatment Effects Subset Scan (TESS)

30
ii. Pij ~ Uniform[0,1] under H0
2. Compute empirical p-values
I. Compute the statistical anomalousnessof each treatment group subject
1. Estimate Conditional Distribution Under H0
Treatment Group
Black
White
Asian
Hispanic
Other
Native American
Male Female
PBM PBF
PWM PWF
PHM
PAM
PNM
POM
PHF
PAF
PNF
POF
Treatment Effects Subset Scan (TESS)
i. Maps each bin’s distribution to thesame interval

31
2. Compute empirical p-values
I. Compute the statistical anomalousnessof each treatment group subject
1. Estimate Conditional Distribution Under H0
Treatment Group
Black
White
Asian
Hispanic
Other
Native American
Male Female
PBM PBF
PWM PWF
PHM
PAM
PNM
POM
PHF
PAF
PNF
POF
iii. For any N p-values, we expect N*ato be significant at level a
Treatment Effects Subset Scan (TESS)
i. Maps each bin’s distribution to thesame interval
ii. Pij ~ Uniform[0,1] under H0

32
2. Compute empirical p-values
I. Compute the statistical anomalousnessof each treatment group subject
1. Estimate Conditional Distribution Under H0
Treatment Group
Black
White
Asian
Hispanic
Other
Native American
Male Female
PBM PBF
PWM PWF
PHM
PAM
PNM
POM
PHF
PAF
PNF
POF
iii. For any N p-values, we expect N*ato be significant at level a
F(S) =maxα
Nα -NαNα(1−α)
Higher Criticism:
Treatment Effects Subset Scan (TESS)
i. Maps each bin’s distribution to thesame interval
ii. Pij ~ Uniform[0,1] under H0

33
I. Compute the statistical anomalousnessof each treatment group subject
Treatment Group
Black
White
Asian
Hispanic
Other
Native American
Male Female
PBM PBF
PWM PWF
PHM
PAM
PNM
POM
PHF
PAF
PNF
POF
Treatment Effects Subset Scan (TESS)
•Naïve search is infeasible O(2å|Ai| )
II. Discover subsets of attribute values that define the most anomalous outcomes1. Maximize F(S) over all subsets of
s1 ´ … ´ sM

34
Treatment Effects Subset Scan (TESS)Nonparametric Scan Statistic (NPSS)
Have: S Í {A1 ´ … ´ AM}= {s1 ´ … ´ sM}
I. Compute the statistical anomalousnessof each treatment group subject
•Naïve search is infeasible O(2å|Ai| )
II. Discover subsets of attribute values that define the most anomalous outcomes1. Maximize F(S) over all subsets of
s1 ´ … ´ sM

35
Treatment Effects Subset Scan (TESS)Nonparametric Scan Statistic (NPSS)
Have: S Í {A1 ´ … ´ AM}= {s1 ´ … ´ sM}
I. Compute the statistical anomalousnessof each treatment group subject
•Naïve search is infeasible O(2å|Ai| )
II. Discover subsets of attribute values that define the most anomalous outcomes1. Maximize F(S) over all subsets of
s1 ´ … ´ sMAssume: φ w.r.t Nαφ ¯ w.r.t N and αφ is convex
Select: F(S) = maxα φ(α,Nα(S),N(S))Want: maxS F(S)

36
Treatment Effects Subset Scan (TESS)Nonparametric Scan Statistic (NPSS)
Have: S Í {A1 ´ … ´ AM}= {s1 ´ … ´ sM}
I. Compute the statistical anomalousnessof each treatment group subject
•Naïve search is infeasible O(2å|Ai| )
II. Discover subsets of attribute values that define the most anomalous outcomes1. Maximize F(S) over all subsets of
s1 ´ … ´ sM
{a(1)}{a(1),a(2)}
{a(1),……………,a(M)}
Only Consider:
.…
Want: maxS F(S)
Assume: φ w.r.t Nαφ ¯ w.r.t N and αφ is convex
Such That: maxs j⊆{a1, ... , at }
F(s j |A− j ) = maxi=1...t
F a(1)...a(t ){ }| A− j( )There Exist: G(ai)
Select: F(S) = maxα φ(α,Nα(S),N(S))

37
Treatment Effects Subset Scan (TESS)Nonparametric Scan Statistic (NPSS)
Have: S Í {A1 ´ … ´ AM}= {s1 ´ … ´ sM}
Want: maxS F(S)
I. Compute the statistical anomalousnessof each treatment group subject
•Naïve search is infeasible O(2å|Ai| )
II. Discover subsets of attribute values that define the most anomalous outcomes1. Maximize F(S) over all subsets of
s1 ´ … ´ sMAssume: φ w.r.t Nαφ ¯ w.r.t N and αφ is convex
Such That: maxs j⊆{a1, ... , at }
F(s j |A− j ) = maxi=1...t
F a(1)...a(t ){ }| A− j( ){Black}{Black, Hispanic}
{Black, Hispanic, Asian, …, White }
Only Consider:
.…
There Exist: G(ai)
Select: F(S) = maxα φ(α,Nα(S),N(S))

38
Treatment Effects Subset Scan (TESS)Nonparametric Scan Statistic (NPSS)
Have: S Í {A1 ´ … ´ AM}= {s1 ´ … ´ sM}
I. Compute the statistical anomalousnessof each treatment group subject
•Naïve search is infeasible O(2å|Ai| )
II. Discover subsets of attribute values that define the most anomalous outcomes1. Maximize F(S) over all subsets of
s1 ´ … ´ sM
{Black}{Black, Hispanic}
{Black, Hispanic, Asian, …, White }
Only Consider:
.…
Want: maxS F(S)
Assume: φ w.r.t Nαφ ¯ w.r.t N and αφ is convex
Such That: maxs j⊆{a1, ... , at }
F(s j |A− j ) = maxi=1...t
F a(1)...a(t ){ }| A− j( )
Select: F(S) = maxα φ(α,Nα(S),N(S))
There Exist: G(ai) = !" #$
∑&'( ) *+, ≤ .

39
Treatment Effects Subset Scan (TESS)Nonparametric Scan Statistic (NPSS)
Have: S Í {A1 ´ … ´ AM}= {s1 ´ … ´ sM}
I. Compute the statistical anomalousnessof each treatment group subject
•Naïve search is infeasible O(2å|Ai| )
II. Discover subsets of attribute values that define the most anomalous outcomes1. Maximize F(S) over all subsets of
s1 ´ … ´ sM
Intuitively: F( {a(1), a(3)} ) £ F( {a(1), a(2)} ) G(a(3)) £ G(a(2))
Want: maxS F(S)
Assume: φ w.r.t Nαφ ¯ w.r.t N and αφ is convex
Such That: maxs j⊆{a1, ... , at }
F(s j |A− j ) = maxi=1...t
F a(1)...a(t ){ }| A− j( )There Exist: G(ai) = !
" #$∑&'( ) *+, ≤ .
Select: F(S) = maxα φ(α,Nα(S),N(S))

40
Treatment Effects Subset Scan (TESS)Nonparametric Scan Statistic (NPSS)
Have: S Í {A1 ´ … ´ AM}= {s1 ´ … ´ sM}
I. Compute the statistical anomalousnessof each treatment group subject
•Naïve search is infeasible O(2å|Ai| )
II. Discover subsets of attribute values that define the most anomalous outcomes1. Maximize F(S) over all subsets of
s1 ´ … ´ sM
Intuitively: F( {a(1), a(3)} ) £ F( {a(1), a(2)} ) G(a(3)) £ G(a(2)) F(S) =maxα
Nα -NαNα(1−α)
Higher Criticism:
Want: maxS F(S)
Assume: φ w.r.t Nαφ ¯ w.r.t N and αφ is convex
Such That: maxs j⊆{a1, ... , at }
F(s j |A− j ) = maxi=1...t
F a(1)...a(t ){ }| A− j( )There Exist: G(ai) = !
" #$∑&'( ) *+, ≤ .
Select: F(S) = maxα φ(α,Nα(S),N(S))

41
Treatment Effects Subset Scan (TESS)Nonparametric Scan Statistic (NPSS)
Have: S Í {A1 ´ … ´ AM}= {s1 ´ … ´ sM}
I. Compute the statistical anomalousnessof each treatment group subject
•NPSS over an attribute in O(t log t)
II. Discover subsets of attribute values that define the most anomalous outcomes1. Maximize F(S) over all subsets of
s1 ´ … ´ sM
Intuitively: F( {a(1), a(3)} ) £ F( {a(1), a(2)} ) G(a(3)) £ G(a(2)) F(S) =maxα
Nα -NαNα(1−α)
Higher Criticism:
Want: maxS F(S)
Assume: φ w.r.t Nαφ ¯ w.r.t N and αφ is convex
Such That: maxs j⊆{a1, ... , at }
F(s j |A− j ) = maxi=1...t
F a(1)...a(t ){ }| A− j( )There Exist: G(ai) = !
" #$∑&'( ) *+, ≤ .
Select: F(S) = maxα φ(α,Nα(S),N(S))

42
TESS Search Procedure
Treatment Group
Black
White
Asian
Hispanic
Other
Native American
Male Female
PBM PBF
PWM PWF
PHM
PAM
PNM
POM
PHF
PAF
PNF
POF
2. Compute empirical p-values
I. Compute the statistical anomalousnessof each treatment group subject
1. Estimate Conditional Distribution Under H0
1. Maximize F(S) over all subsets of s1 ´ … ´ sM•NPSS over an attribute in O(t log t)
II. Discover subsets of attribute values that define the most anomalous outcomes

43
TESS Search Procedure
(Score = 7.5)
Black
White
Asian
Hispanic
Other
Native American
Male Female
PBM PBF
PWM PWF
PHM
PAM
PNM
POM
PHF
PAF
PNF
POF
2. Compute empirical p-values
I. Compute the statistical anomalousnessof each treatment group subject
1. Estimate Conditional Distribution Under H0
1. Maximize F(S) over all subsets of s1 ´ … ´ sM
•NPSS over an attribute in O(t log t)
II. Discover subsets of attribute values that define the most anomalous outcomes

44
TESS Search Procedure
(Score = 8.1)
Black
White
Asian
Hispanic
Other
Native American
Male Female
PBM PBF
PWM PWF
PHM
PAM
PNM
POM
PHF
PAF
PNF
POF
2. Compute empirical p-values
I. Compute the statistical anomalousnessof each treatment group subject
1. Estimate Conditional Distribution Under H0
1. Maximize F(S) over all subsets of s1 ´ … ´ sM
•NPSS over an attribute in O(t log t)
II. Discover subsets of attribute values that define the most anomalous outcomes
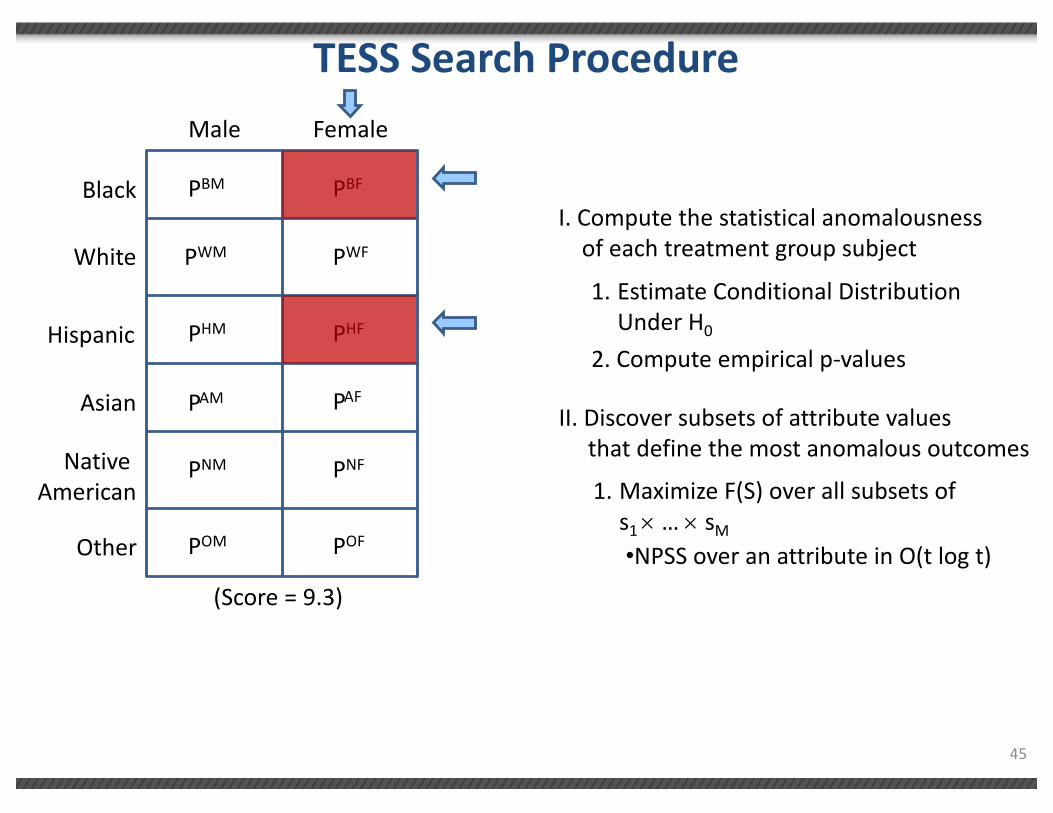
45
TESS Search Procedure
(Score = 9.3)
Black
White
Asian
Hispanic
Other
Native American
Male Female
PBM PBF
PWM PWF
PHM
PAM
PNM
POM
PHF
PAF
PNF
POF
2. Compute empirical p-values
I. Compute the statistical anomalousnessof each treatment group subject
1. Estimate Conditional Distribution Under H0
1. Maximize F(S) over all subsets of s1 ´ … ´ sM
•NPSS over an attribute in O(t log t)
II. Discover subsets of attribute values that define the most anomalous outcomes

46
Significance of our subpopulationCompare subpopulation score to maximum
scores of simulated datasets under H0
TESS Search Procedure
(Score = 9.3)
Black
White
Asian
Hispanic
Other
Native American
Male Female
PBM PBF
PWM PWF
PHM
PAM
PNM
POM
PHF
PAF
PNF
POF
2. Compute empirical p-values
I. Compute the statistical anomalousnessof each treatment group subject
1. Estimate Conditional Distribution Under H0
1. Maximize F(S) over all subsets of s1 ´ … ´ sM
•NPSS over an attribute in O(t log t)
II. Discover subsets of attribute values that define the most anomalous outcomes
Agenda
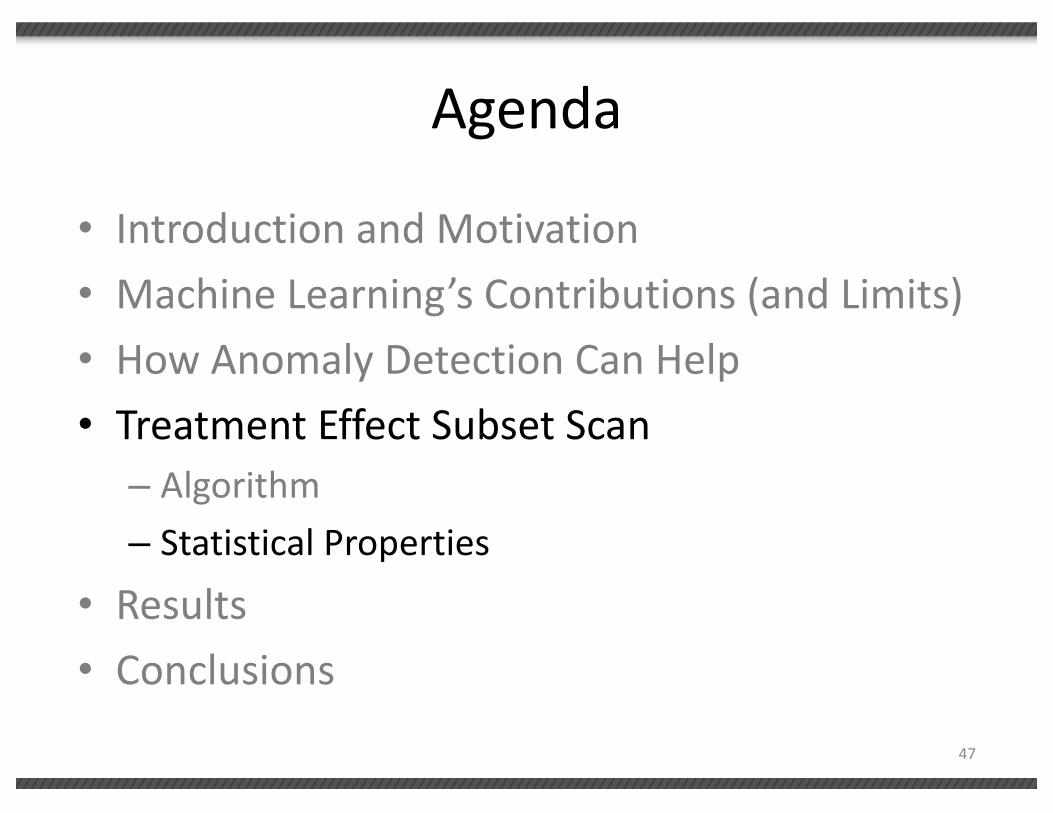
• Introduction and Motivation• Machine Learning’s Contributions (and Limits)• How Anomaly Detection Can Help• Treatment Effect Subset Scan– Algorithm– Statistical Properties
• Results• Conclusions
47

• False Positive under H0 (Theorem 2)
• Power under H1 (Theorem 3)
• Exactness of Detected Subpopulation– Sufficiently Homogenous (Theorem 4)
– Sufficiently Strong (Theorem 5)
TESS’s Statistical Properties
!"# max' ((*) > ℎ(.) → 0
*∗ ⊇ *3
*∗ ⊆ *3
!"5 max' ((*) > ℎ(.) → 1
Agenda
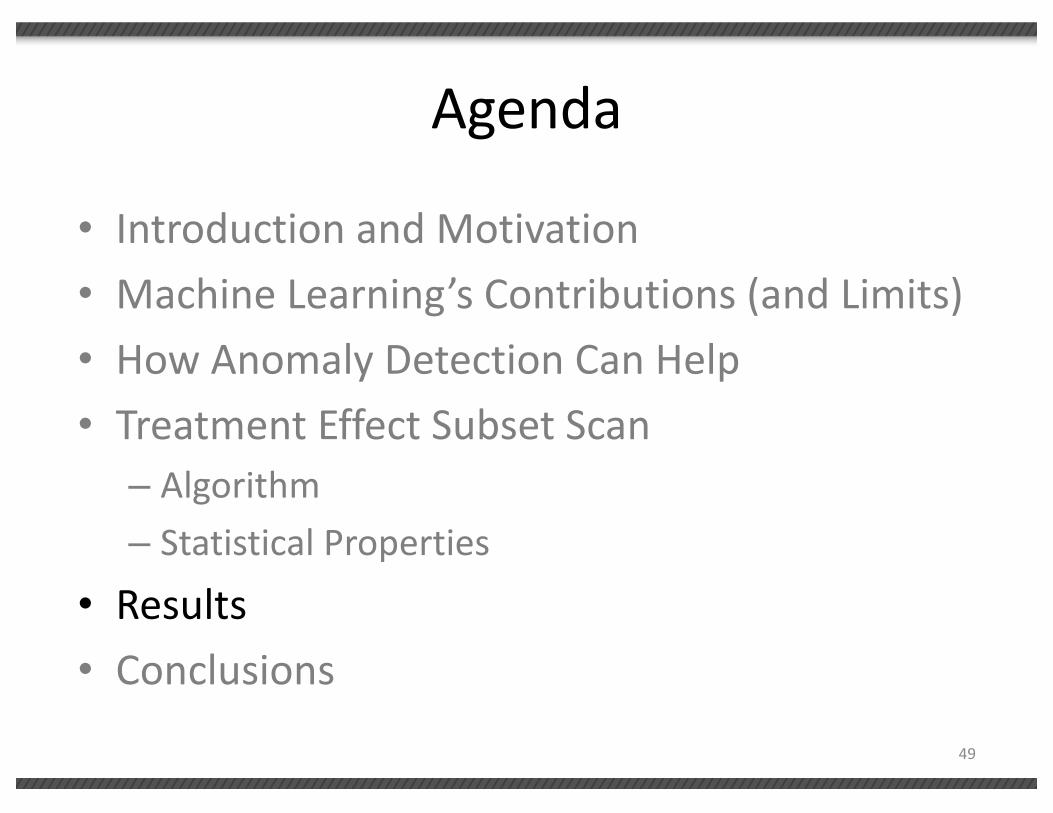
• Introduction and Motivation• Machine Learning’s Contributions (and Limits)• How Anomaly Detection Can Help• Treatment Effect Subset Scan– Algorithm– Statistical Properties
• Results• Conclusions
49

Tennessee Star Analysis (1985)• Effect of classrooms size on achievement (test
scores)
• 4 year panel (kindergarten to 3rd grade)
• 6,500 students, 330 classrooms, 80 schools– Total of over 11,000 records
• Treatment Conditions (randomized within school)– Regular Size Class (20-25 students)– Regular Size + Aide Class (20-25 students)– Small Size Class (13-17 students)
50
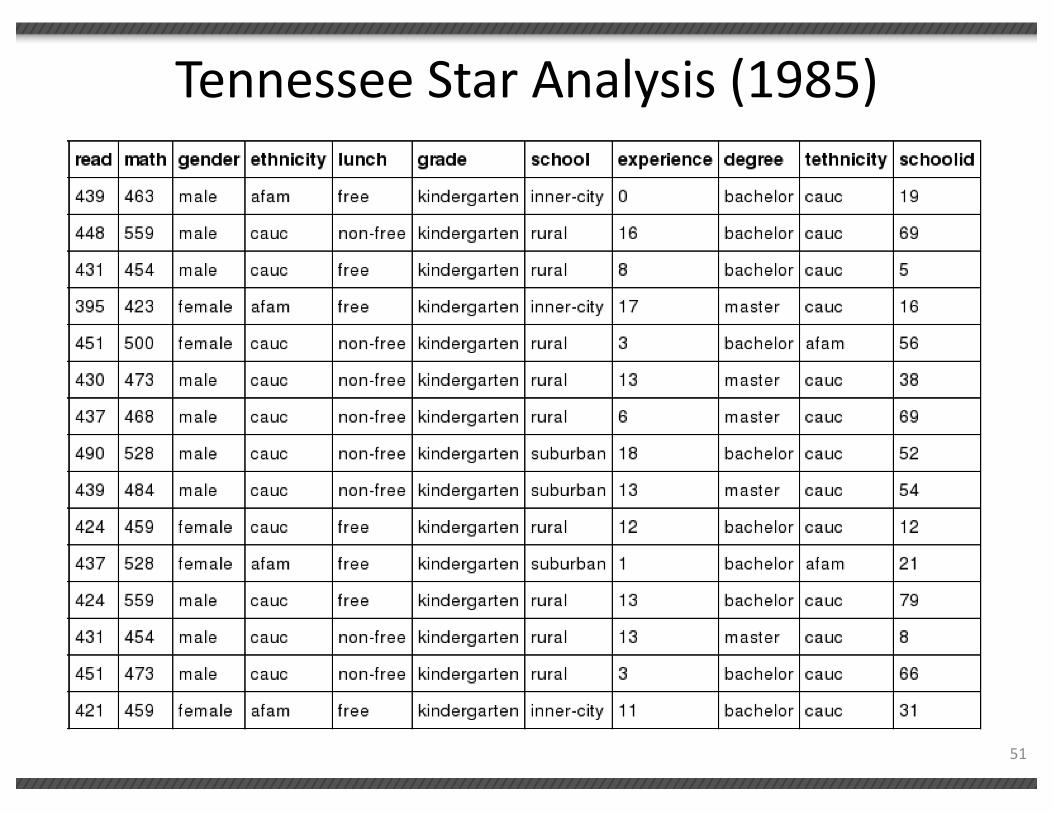
Tennessee Star Analysis (1985)
51

Tennessee Star Analysis
(1)
3.4791
(2.547)
All 2nd Grade
0.000
4263
52
Notes: All estimates are from OLS models.
Standard errors are in parentheses.
*** p<0.01, ** p<0.05, * p<0.1
(2)
-0.2909
(2.277)
All 3rd Grade
0.000
4063
Treatment
Sample
R-squared
Observations

Tennessee Star Analysis (1985)
• Detected Subpopulation– grade:• 2nd or 3rd
– school:• inner-city or urban
– experience:• [10, infinity)
– other features do not have differential effects
53

Tennessee Star Analysis
54

Tennessee Star Analysis
55

Tennessee Star Analysis
(1) (2) (3)
Treatment 3.4791 36.066*** 1.309
(2.547) (6.055) (2.772)
Sample All 2nd Grade Detected Group
(2nd Grade)
Undetected Group
(2nd Grade)
P-value 0.172 <0.001 0.0637
Observations 4263 620 3643
56
Notes: All estimates are from OLS models.
Standard errors are in parentheses.
*** p<0.001, ** p<0.05, * p<0.1

Tennessee Star Analysis
(1) (2) (3)Treatment -0.291 18.703*** 0.1
(2.277) (5.18) (2.478)
Sample All 3rd Grade Detected Group(3rd Grade)
Undetected Group(3rd Grade)
P-value 0.898 <0.001 0.968Observations 4063 706 3357
57
Notes: All estimates are from OLS models. Standard errors are in parentheses.
*** p<0.001, ** p<0.05, * p<0.1

Conclusion• Discovering subpopulations with significant
treatment effects can be paramount• Machine Learning can flexibly estimate effects but it
limited when goal is to identify subpopulations with large effects
• Anomalous Pattern Detection paradigm offers overcome some abilities to overcome these limitations– Maintain high power to detect by searching over and
combining signal across various subpopulations58