efficient approximate method for packed ......efficient approximate method for packed column...
TRANSCRIPT

EFFICIENT APPROXIMATE METHOD FOR PACKED COLUMNSEPARATION PERFORMANCE SIMULATION
Kari I. Keskinen*,**, Anu Kinnunen*, Lars Nyström***, Juhani Aittamaa**
*Neste Engineering Oy, P.O. Box 310, FIN-06101 Porvoo, Finland**Helsinki University of Technology, Chemical Engineering, P.O. Box 6100, FIN-
02015 HUT, Finland***Lappeenranta University of Technology, Chemical Technology, P.O. Box 20, FIN-
53851 Lappeenranta, Finland
ABSTRACT
Packed distillation and absorption columns are often modeled using equilibriumstages. However, determination of the packing height that corresponds to anequilibrium stage is not easy. For binary systems HETP values can be used, butthese are not applicable to multicomponent systems because mass transfer rates ofdifferent components deviate from each other.
Rate-based non-equilibrium models can be used to overcome the problem of theHETP + equilibrium stage calculation method. Our efficient and approximateapproach is different. It uses an equilibrium stage model with multicomponentefficiency factors for a certain packing height. These efficiencies are comparable tothe multicomponent Murphree vapor phase efficiencies used for plate columns.

INTRODUCTION
The most common way to model and design packed distillation and absorptioncolumns is to use ideal equilibrium stages. After achieving the required separationthe packing height that corresponds to an equilibrium stage is estimated and the totalrequired column height is calculated.
In case of binary systems HETP (Height Equivalent to a Theoretical Plate) valuesare used. These are available for many packing types and component pairs in theliterature. For accurate results the component physical properties and flow conditionsshould be evaluated for each equilibrium stage used in simulation to get thecorresponding HETP value for the equilibrium stage in question.
Multicomponent systems and binary systems in uncommon conditions could not behandled properly with HETP concept. In case of binary systems at uncommonconditions no experimental HETP values are available. On the other hand,multicomponent systems can not utilize HETP concept as such, because the masstransfer rates for different components in the system are not equal.
In order to overcome these HETP problems rate-based non-equilibrium models areused. In these models the mass transfer in vapor and liquid phases is taken intoaccount. Thermodynamic phase equilibrium between vapor and liquid phases existsonly in the phase interface. On both sides of the phase interface there are interfacialfilms that are the places where the mass transfer limitations exist. Further away fromthe phase interface there are bulk vapor phase and bulk liquid phase that areassumed to be perfectly mixed in each calculation segment. The rate-based non-equilibrium models are quite heavy to solve and a lot of physical property informationthat is not used by the equilibrium stage methods is required, e.g. viscosities,thermal conductivities, surface tension, diffusion coefficients etc. Also, mass transferarea and correlations for mass transfer rate for each type of packing are needed.
Our approach to model packed columns is different. We start from an equilibriumstage column model. For these models many efficient solution algorithms areavailable. We define the height of packing that is selected as a calculation segment.This segment height is then related to a mass transfer stage. We definemulticomponent efficiencies for the selected packing height (mass transfer stage)that are used to correct the real mass transfer deviation from equilibrium stagesolution in a similar way the multicomponent Murphree vapor phase plate efficienciesare used for plate columns. Therefore our calculation proceeds always in simulationmode, i.e. we do not directly calculate the height of packing needed to obtain therequired separation. This is also the case with rate-based non-equilibrium model.
The model includes generalized Maxwell-Stefan multicomponent mass transfercalculations and thus we are able to predict for each component in each calculationsegment its separation efficiency. Inversely, its is possible to calculate later theHETP value for each component in each calculation segment. The accuracy of themethod is related to the number of calculation segments we specify for a certainpacking height. As the calculation segment height decreases, i.e. the more segmentswe have for a certain packing height, the closer the solution gets to the rigorousintegral solution of the column and at the same time more calculation effort isneeded. Similarly, as in the case of rate-based models, a lot of physical property
information that is not used by the equilibrium stage methods is needed. Also,correlations for mass transfer rate and mass transfer area for each type of packingare needed.
We have implemented the packing calculation in flowsheeting program FLOWBAT[1] that already has similar multicomponent efficiency methods for plate columns(Ilme [2]). Thus we are able to calculate a column with any number of columnsections having differing plate types, packing type and size, column diameter etc.Several correlations from literature have been implemented both for random andstructured packing. Also, we have the capability in our program to evaluate columnhydraulic performance, i.e. flooding, entrainment and pressure drops, simultaneouslywith the separation performance calculation. This allows us to evaluate thethermodynamic properties needed for separation performance simulation in realcolumn conditions.
BACKGROUND
Mass Transfer BasicsThe four simple and most commonly known theories for mass transfer in flows arefilm theory, penetration model, surface-renewal model and turbulent boundary layermodel.
The whole mass transfer resistance in film theory is assumed to be in the thinstagnant volume at the interface of the turbulent phase. This stagnant volume iscalled film. The mechanism of mass transfer through the film is molecular diffusion(Holland [3]).
In separation processes usually two phases are present and both phases should beconsidered for total mass transfer resistances. Both phases then have a film at theinterface and all mass transfer resistances are in these films. This two-film theory byWhitman [4] is much used for processes where the interface of the two phases is inequilibrium, the mass transfer rates are not too high and no surface-activecomponents accumulate on the interface (Seader and Henley [5]).
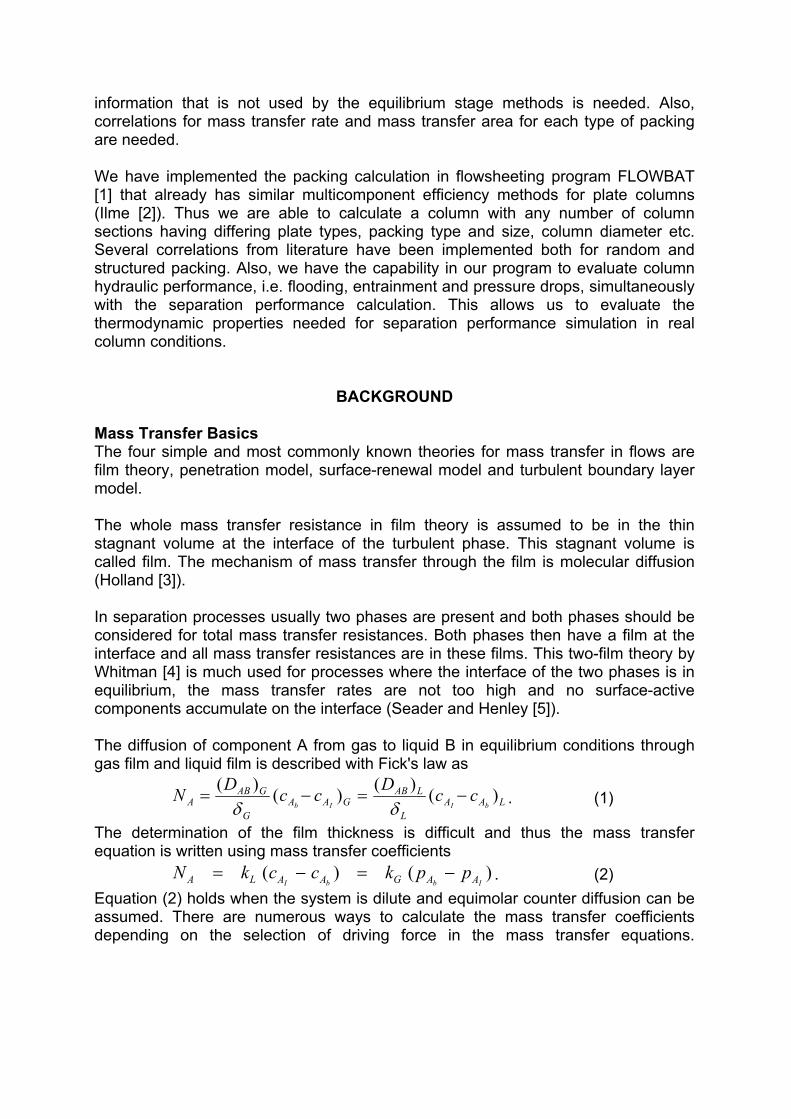
The diffusion of component A from gas to liquid B in equilibrium conditions throughgas film and liquid film is described with Fick's law as
LAAL
LABGAA
G
GABA bIIb
ccDccDN )()()()(−=−=
δδ . (1)
The determination of the film thickness is difficult and thus the mass transferequation is written using mass transfer coefficients
)()(IbbI AAGAALA ppkcckN −=−= . (2)
Equation (2) holds when the system is dilute and equimolar counter diffusion can beassumed. There are numerous ways to calculate the mass transfer coefficientsdepending on the selection of driving force in the mass transfer equations.

Mass Transfer in Binary SystemsEquation (2) can be written for a packed tower using mole fractions as the drivingforce
)()(IbbI AALAAGA xxkyykN −=−= . (3)
According to the two-film theory there is an equilibrium condition at the interface:
I
I
A
AA x
yK = . (4)
Normally, only the bulk conditions and compositions are known, so equation (3) iscombined with equation (4) to give
LGA
AAA
kkK
yxN bb
11
+
−= . (5)
If we define y K xA A Ab
* = , then equation (5) can be written as
L
A
G
AAAAGA
kK
k
yyyyKN b
b
+
−=−= 1)(
**
. (6)
HTU, NTU and HETPFor a dilute system in a packed column we can write mass balance for the gasphase using symbols of figure 1 and effa meaning the effective interfacial area of thepacking:
dzAyyaKdyG CeffG )( *−=& . (7)
Zdz
z
AC
Figure 1. A section of a packed column.
By modifying and solving the equation (7) we get the height of the packing
∫ −=
in
out
y
yCeffG yy
dyAaK
GZ *
&. (8)

It is commonly defined that
CeffGOG AaK
GH&
= (9)
and
∫ −=
in
out
y
yOG yydyN * . (10)
Equation (8) can then be written as
OGOG NHZ = . (11)
OGH is called the overall height of a transfer unit based on gas phase. Often it iscalled HTU for short. On the other hand OGN is the overall number of transfer unitsbased on gas phase, NTU for short.
When dealing with packed columns also the concept of equilibrium stages (idealstages) is used (Stichlmair and Fair [6]):
ETPHnZ = . (12)Here n is the number of equilibrium stages (ideal stages) and ETPH is the heightequivalent to a theoretical plate (HETP). HETP indicates the efficiency of the masstransfer. For binary systems the HETP value is the same for both components as themass transfer efficiency is also the same for both components. According toWesselingh [7] the HETP is almost constant for the whole packed column. HETPvalue can be used to evaluate the required height of packing for a column whenequilibrium stage model is used to determine the number of equilibrium stages toobtain desired product qualities.
Methods for the Calculation of Binary Mass Transfer Coefficients and SpecificMass Transfer AreaThe prediction of mass transfer coefficients using correlations is difficult because themass transfer coefficients depend on the way the column packing is carried out andhow well is the liquid distribution performed (Seader and Henley [5]). Often, when theheight of a packed column is calculated the overall gas phase mass transfercoefficient KG is used, as the mass transfer resistance lies usually in the gas phase:
LGG km
kK+=
11. (13)
In distillation the vapor/liquid-equilibrium curve is not generally linear and thus m isthe local slope of the equilibrium curve:
xdydm∗
= . (14)
In binary systems the slope of the equilibrium curve changes along the height of thecolumn. On the hand, for multicomponent systems the slope is different for eachcomponent.
There are a number of correlations for the calculation of binary mass transfercoefficients and specific mass transfer area. Onda et al. [8], Bravo and Fair [9], Billetand Schultes [10] and Gualito et al. [11] have published correlations for randompacking, while Bravo et al. [12], Fair and Bravo [13], Fair and Bravo [14], Billet and

Schultes [10] and Rocha et al. [15] have published methods for structured packing.Generally, it can be said that these correlations are based on rather small columnsand a limited number of different component pairs. The applicability of a certaincorrelation should be evaluated for the system in question (Ilme [2]).
The HETP values can also be calculated for binary systems from some publishedcorrelations. Vital et al. [16] have reviewed HETP correlations published before1984. Rules of thumb to estimate the HETP values have been presented by Kister[17]. Wagner et al. [18] and Lockett [19] have recently published correlations forHETP calculation of binary systems.
Mass Transfer in Multicomponent SystemsIn ideal multicomponent systems the components present in the mixture do not haveeffect on each other. The components in such systems are of similar size andstructure and they are not polar or just slightly polar. On the other hand in non-idealsystems there exist interactions between components that differ from othercomponents in respect to size, character, polarity and hydrogen bonding tendency.Liquid/liquid-splitting and azeotropy are marks for heavy non-ideality.
In a thermodynamically ideal non-polar system the HTU or HETP values for differentcomponents are identical. On the contrary, in a thermodynamically non-ideal systemthe thermodynamic and physical properties in vapor and liquid are different for eachcomponent leading also to different HTU and HETP values for each component. Inthese systems the diffusion rate of a component does not depend only of thediffusivity of that component but also from the diffusivities of the other components inthe mixture (Ilme [2]).
The diffusion in a multicomponent system is very complicated compared to binarysystems. It is possible to have diffusion against concentration gradient (reversediffusion); no diffusion although a concentration gradient exists (diffusion barrier) ordiffusion while there is any driving force (osmotic diffusion). According to Seader andHenley [5] this can lead in multicomponent systems to HTU and HETP values in therange [ ]+∞∞− , . These strange phenomena are caused by the fact that the drivingforce is not the one used (concentration gradient) in calculations, but it is thegradient of chemical potential, see Wesselingh [7] or Khoury [20].
Multicomponent mass transfer is best described with Maxwell-Stefan diffusionequations. These are used in connection with film theory. Two classes of solutionmethods for Maxwell-Stefan equations have been presented: linearized theory andso called exact solution.
Following the presentation by Taylor and Krishna [21] we arrive to equation (15)when the total mole flux is nearly to zero, the diffusion is equimolar and the masstransfer coefficients do not depend on the mole fluxes of the phases.
[ ] [ ] [ ] [ ] 111 −−− += LL
GGOG kM
cckK (15)
Taylor and Krishna [21] have defined the matrices [ RG ] and [ RL ] for gas and liquidphases, respectively, to calculate the mass transfer coefficients. Equations (16) and(17) give the elements of these matrices.

∑≠=
+=nc
ikk ki
k
nci
iii
zzR1 ,,
, κκ(16)
−−=
ncijiiji zR
,,,
11κκ (17)
In equations (16) and (17) zi is the mole fraction of component i in gas or liquidphase and κi,j is the zero flux mass transfer coefficient for component pair i, j.Making another definition and equation manipulation Taylor and Krishna [21] finallyarrive at
[ ] [ ] [ ] [ ]LL
GGOG RK
ccRK +=− 1 . (18)
In case of non-equimolarity so called bootstrap matrices must also be included andthey are calculated for nearly ideal system from the enthalpies of vaporization or inmore non-ideal system using the differences between vapor and liquid partial molarenthalpies.
Multicomponent Mass Transfer in Packed ColumnsBased on figure 2 by Taylor and Krishna [21] the mass balance for gas phase can bewritten:
ceffiGi AaJ
ZdydG ,−=& . (19)
G&
L&
Figure 2. Packed column (Taylor and Krishna [21]).

Equation (19) can be given in matrix form
ceffG AaJZdydG )()(
−=& . (20)
This leads to equation (21)
[ ] ceffOGG AayyKczdydG )()( * −=& . (21)
Equation (21) can be expressed in dimensionless form (Taylor and Krishna [21]) as
[ ] )()( * yyNd
ydOG −=
ζ, (22)
where ζ=z/Z dimensionless height of the packing and[NOG] matrix of overall numbers of mass transfer units.
The matrix of overall numbers of mass transfer units, [NOG], can be expressed as
[ ] [ ] [ ]SG
effOG
ceffOGGOG u
ZaK
GAZa
KcN == & . (23)
When equation (18) is combined with (23) we get
[ ] [ ] [ ] [ ] 111 −−− += LGOG NKLGNN&
& . (24)
The inverse matrices [ NG ]-1 and [ NL ]-1 are defined by Taylor and Krishna [21] as
[ ] [ ]ZauRN
eff
SGGG =−1 (25)
and
[ ] [ ]ZauRN
eff
SLLL =−1 . (26)
The height of mass transfer unit for vapor phase is defined as
[ ] [ ]eff
SGGG a
uRH = . (27)
Similarly for liquid phase
[ ] [ ]eff
SLLL a
uRH = . (28)
The matrix of overall heights of mass transfer units, [HOG], can be expressed as
[ ] [ ] [ ] [ ]LGOG HKLGHH&
&+= . (29)
Ilme [2] has given the corresponding overall height of a transfer unit when thebootstrap matrices [ ] [ ]LG ββ and are taken into account:
[ ] [ ] [ ] [ ] [ ] [ ] [ ] 111 −−− += LLGGGOG HKLGHH βββ&
&. (30)

Finally the HETP matrix, [HETP], can be calculated, analogously to binary systems,consisting of the elements (Taylor and Krishna [21]):
1211
11
ln,
−=
=
≠−= nc,...,,ji,
λ, H
λ,λ
λ H
Hi,jOG
i,ji,j
i,jOG
ETP
i,j
ji
i,j
. (31)
Here the matrix of stripping factors [λ] is defined as
[ ] [ ]LGM&
& =λ . (32)
EFFICIENCY OF PACKED COLUMNS
Murphree Vapor Phase Plate EfficiencyWe shortly review Murphree vapor phase plate efficiency to better describe ourdefinition of efficiency for packed columns. Based on figure 3 we can define theMurphree vapor phase plate efficiency as
1*
1
−
−
−−
=nn
nnmv yy
yyE , (33)
where Emv Murphree vapor phase plate efficiency,1−ny the average composition of vapor coming to plate n from plate below,
ny the average composition of vapor leaving plate n to plate above, and*ny the vapor composition that is in equilibrium with the average
composition of the liquid leaving from plate n.
1+nx
1−ny1−ny
''1+nx
Figure 3. Definition of Murphree vapor phase plate efficiency. (a) A real plate. (b) Atheoretical plate to define the Murphree vapor phase plate efficiency ( ''
1+nx is the liquid flowfrom plate above to the ideal plate). (Ilme [2])
If we take a look at the definition of the Murphree vapor phase plate efficiency inequation (33) we can see that in multicomponent systems in each plate of thecolumn the efficiencies are different for each component. Additionally, when we haveconcentration maxima and minima inside the column the Emv values can take valuesbetween [ ]+∞∞− , as the divisor can be about zero. This does not pose a big problem

as in these situations no concentration changes for these components occur and theEmv values can in practice be limited to a suitable interval.
Multicomponent Efficiency for Packed ColumnsEquation (22) can be expressed as
[ ] y)(y1OGH
zd(y)d
−∗−= . (34)
Figure 4 (Kister [17], p. 523 with modified symbols) shows the binary systemequilibrium curve describing the mass transfer in a packed column.
dz
nyG&
1−nyG&
yn
yn-1
xn+1
yn-yn-1
Ac
xn
Figure 4. Mass transfer in a packed column.
The equilibrium vapor concentration y* cannot be taken as a constant for a segmentof the packing bed. This is due to the fact that liquid and vapor flow in oppositedirections and thus the equilibrium vapor concentration y* changes along the heightof the packing according to the composition change of the liquid phase. Thus, if welike to calculate the vapor composition at a certain height of the packing we need tointegrate the equation (34) numerically.
The numerical integration of equation (34) can be avoided when the term (y* - y) isapproximated with arithmetic mean value for a limited segment height. Then for thesegment number n we have
( ) ( ) [ ] [ ] ( ) [ ] ( ) ( ) ( )
+−
+=− −++−
− 221111
1nnnnnn
nOGnnnyyxKxK
HZyy , (35)
where yn the vector of gas concentration leaving segment n,yn-1 the vector of gas concentration entering segment n,xn the vector of liquid concentration leaving segment n,xn+1 the vector of liquid concentration entering segment n,Zn the height of segment n,[HOG]n the matrix of overall heights of mass transfer units in segment n,[K]n the diagonal matrix of (VLE) K values corresponding to liquid
concentrations xn, and[K]n+1 the diagonal matrix of (VLE) K values corresponding to liquid
concentrations xn+1.
Now we define for packed columns the efficiency as, see figure 4 (similarly to theMurphree vapor phase plate efficiency of equation (33)):

1
1
−
−
−−
=n
*n
nn
yyyyE . (36)
This definition can be applied for all components, so that all terms in equation (36)can have the component index. Now we define a diagonal matrix [A]n having as thediagonal elements the reciprocals of term ( )1
*−− nn yy for nc-1 components.
[ ]
−
−
−
=
−−−
−
−
1,1*
,1
1,2*
,2
1,1*,1
100
010
001
nncnnc
nn
nn
n
yy
yy
yy
A
K
MOMM
K
K
(37)
This leads to the following expression to calculate the efficiencies for eachcomponent in segment n of a packed column.
( ) [ ] [ ] [ ] ( ) [ ] ( ) ( ) ( )( )1111
2 −++− −−+= nnnnnnnOG
nnn yyxKxKHZAE (38)
As an example the efficiency for component i=1 in a three component system forpacking segment n we get by using equation (38):
)([ +−−+++−
= −++++−
1,1,11,21,121,11,11,2,12,1,111,1
*,1
, 11
2nnnnnnnnnnOG
nn
n
ni yyxKxKxKxKHyy
Z
E
( ) ]1,2,21,21,221,11,21,2,22,1,2112 −++++ −−+++ nnnnnnnnnnOG yyxKxKxKxKH . (39)
Description of the Method and Its ImplementationThe method described in previous section has been implemented to in-houseflowsheeting simulation program called FLOWBAT [1]. There are several columnmodels in the program to describe distillation: distillation simulation module withrigorous plate efficiency calculation called DISTI (with inside out algorithm usingNewton method or relaxation method), model for column/stripper/absorber COLUMNwith a specific solution algorithm suitable for strippers and absorbers, reactivedistillation column model RDISTI, reactive distillation column model combined withside reactor models RRDIST, and reactive rate-based distillation model DESIGNER.Aittamaa [22] originally started using multicomponent plate efficiencies in distillationcalculation in DISTI. Later this approach was further developed by Ilme [2]. Thesemethods have been extensively tested by Ilme [2], Klemola [23], Jakobsson [32] andalso for industrial columns by Ilme et al. [24] and Jakobsson et al. [25].
The above articles present the method and its program implementation in quitedetail. In order to handle all kinds of distillation and absorption columns furtherdevelopment on the use of efficiencies have been done for packed columns, both forrandom packing and structured packing. The correlations and calculation methodspresented in literature for column hydraulics and pressure drops have been collectedby Kleine [26]. Their program implementation has been completed with therealization of the packing efficiency method described in this paper. This work has

mostly been carried out by Kinnunen [27]. The mass transfer correlations currentlyimplemented are given in references [8] to [15].
In FLOWBAT it is possible to define all distillation and absorption columns consistingof a number of sections. Each section can have its own plate type or packing type,column diameter etc. Thus it is possible to calculate columns with varying diameterand having both plates and packing. These calculations proceed in simulation mode.This means that the column internals have to be described in detail and then thecolumn hydraulic and separation performances can be evaluated at the same time. Ifthe result is not satisfactory, then modification to the column internals should bemade and the column is recalculated.
The calculation for packing proceeds as follows. The whole height of packing isdivided into a number of segments. Each of the segments corresponds then to amass transfer stage in the distillation calculation. The obtained packing efficienciesare used to correct the compositions in the distillation solver in a similar manner asMurphree vapor phase plate efficiencies are used. The algorithm below is repeatedfor each of the segments to get the efficiency during that distillation solver iteration:1. Evaluate the average conditions of the phases and their average compositions in
addition to the properties of the packing.• Composition and properties of the phases.• Vapor and liquid flow rates.• Parameters of the packing.
2. Calculate the binary diffusion coefficients for all component pairs both for vaporand liquid phases.
3. Calculate the mass transfer coefficients for component pairs both for vapor phaseand liquid phase using one of the methods of references [8] to [15].
4. Calculate the inverse matrices of mass transfer coefficients both for vapor phaseand liquid phase using equations (16) and (17).
5. Evaluate the matrices of the heights of the mass transfer units both for vaporphase and liquid phase using equations (27) and (28).
6. Calculate the matrix of (VLE) K values.7. Evaluate using equation (29) or (30) the matrix of overall heights of mass transfer
units.8. Finally calculate the efficiency defined by equation (36).
In step 7 above it is possible to use various methods. Equation (29) is simpler andsuitable for thermodynamically quite ideal systems. When the mass transfer is non-equimolar and system non-ideal then bootstrap matrices should be used andequation (30) is selected.
It is possible to control the distillation calculation so that first the column is convergedwith fixed efficiencies, say 75 % for each component in each mass transfer stage.Then pressure drop calculation can be added if desired. As a final step the individualcomponent efficiencies are brought in to the calculation. On the other hand, if thesystem is highly non-ideal and selected packing segment heights are not close toHETP values, it might be better to have the efficiencies in the calculation right fromthe beginning to ensure better convergence.

Approximations in the ModelWe have already discussed about some of the approximations done in this method.If we inspect equations (22) and (34) and compare these to our basic equation (35),we can see that our method is closer to the integral solution of (34) when smallersegment heights we select. On the other hand, if the segment heights are too smalland correspondingly the efficiencies for these segments are very low we have alarge number of equilibrium stages in the distillation column solver and this mightlead in to some numerical convergence problems.
If the selected packing segment height for the calculation is too high (say many timesthe approximated HETP value for the packing) then during the calculations numericalproblems may easily arise and additionally the accuracy is not good. Some idea ofthe suitable segment height helps in getting good results.
It is possible to evaluate the bootstrap matrices if desired. This leads into a moreaccurate solution but more computational effort is needed. For non-ideal systems orsystems having components of very different size the use of bootstrap matrices isrecommended.
EXAMPLE CALCULATIONS OF LITERATURE TEST SYSTEMS
This kind of complex model requires comparison with real experimental data. Most ofthe published packed column data is from binary system with rather small columns.Recently, Pelkonen et al. [28] published multicomponent packed column data forstructured packing. They also give a list of available published articles on othermulticomponent structured packing experiments in which there are compositionmeasurements along the packing height. This kind of data is most valuable formethod validation.
Kinnunen [27] studied with the modeling approach we present in this paper thefollowing multicomponent packed column systems:• Acetone/methanol/methylacetate in a 79 mm diameter column where the packing
height of 6.3 mm Raschig rings was varied from 0 to 680 mm and the columnoperated under total reflux, see Arwikar [29].
• Methanol/2-propanol/water in a 100 mm diameter column where Sulzer CYpacking height was 800 + 800 mm and the column operated under total reflux,see Górak and Vogelpohl [30].
• Methanol/acetone/water in a 100 mm diameter column where Rombopack 6Mpacking had a total of height of 3000 mm and two feeds were introduced into thecolumn in different levels between the 1000 mm packing sections, see Pelkonenet al. [31].

Description of the Test CaseIn this paper we deal only with the acetone/methanol/methylacetate case by Arwikar[29]. This column had a diameter of 79 mm and it was operated in normalatmospheric pressure. The column was stabilized in total reflux conditions so thatmeasured vapor and liquid flows were 0.019 mol/s. The height of the packing (6.3mm Raschig rings) was changed between 0 and 680 mm. The concentrations havebeen measured from below and above the packing. Table 1 shows the experimentaldata of Arwikar.
Table 1. Experimental data of Arwikar [29] for liquid concentrations in system withcomponents acetone/methanol/methylacetate, when the column in total reflux condition had
vapor and liquid flows of 0.019 mol/s.
Height ofpacking[ cm ]
Acetone
[ - ]
Methylacetate
[ - ]
Methanol
[ - ]68.0
compositionabove thepacking
0.196 0.373 0.431
43.0 0.198 0.315 0.48826.0 0.181 0.270 0.54823.0 0.185 0.280 0.53515.0 0.169 0.252 0.57910.0 0.165 0.234 0.6005.0 0.154 0.213 0.6330.0
compositionbelow thepacking
0.121 0.140 0.740
reboiler 0.073 0.070 0.856
Comparison of Model Results with Experimental DataThe column was simulated using the methods described in this paper using flow-sheeting program FLOWBAT. The total reflux situation was approximated by suitablemeans and thus the inner column vapor and liquid flows were adjusted to correspondto the experimental value 0.019 mol/s.
The component system acetone/methylacetate/methanol is quite non-ideal and thusthe Wilson model was selected as the VLE model. Other physical property methodswere selected to suit this ternary system from the methods available in FLOWBAT.The basic pure component parameters were retrieved from the databank ofFLOWBAT. The VLE and other property calculation methods and parameters werenot specifically tuned for this simulation and the Wilson parameters were taken fromDECHEMA data books.
The first simulation was carried out using 430 mm total height of packing. This wasdivided into 20 segments of equal height, meaning 21.5 mm for a segment. Inaddition to that also the ideal reboiler and ideal condenser were used in simulation.

In the simulation model each of the segments correspond to an equilibrium stagewhose concentrations are corrected using the efficiencies calculated by the methoddescribed in this paper.
The calculation used equation (29); i.e. no bootstrap matrices were included. The 6.3mm Raschig ring asks for a suitable mass transfer calculation correlation and fromthe ones available the methods by Onda et al. [8] and Bravo and Fair [9] suited forthis case and they also had published parameters available. For comparison we alsosimulated the same case using efficiencies equal to 1 for all components in allstages. This corresponds to the assumption of 21.5 mm for HETP and is marked as"ideal" in figure 5.
0.0
0.2
0.4
0.6
0.8
1.0
0 50
10 15 20 25 30 35 40 45
Height of packing [cm]
Liqu
id m
ole
frac
tion
[ - ]
Acetone (meas.)Methylacetate (meas.)Methanol (meas.)Acetone (calc.)Methylacetate (calc.)Methanol (calc.)
ideal ideal
ideal
Figure 5. Measured and simulated liquid concentrations for the Arwikar [29] case. Columnhad total reflux. The selected segment height was 21.5 mm and the Onda et al. [8] mass
transfer model was used.
It is easy to see from figure 5 that for the "ideal" simulation case the guess of aHETP value of 21.5 mm was a too small value. Qualitatively the efficiency-basedmodel gives reasonable accuracy in this case. We also changed the segment heightand correspondingly the number of segments, but the concentration curves of theefficiency-based calculation practically overlapped with the ones in figure 5. Thisindicates that our method is not very sensitive for the selection of the segment heightand the approximation of the rigorous integral method is good.
Table 2 shows the comparison of the same case as above but using the masstransfer correlations by Onda et al. [8] and Bravo and Fair [9]. It is easy to see thatjust the change of the mass transfer coefficient correlation and specific mass transferarea calculation method makes some difference in the results.

Table 2. Computed liquid concentrations for the Arwikar [29] case consisting ofacetone/methylacetate/methanol.
Method for mass transfercoefficients and specific
mass transfer area:
Onda et al. [8]
Method for mass transfercoefficients and specific
mass transfer area:
Bravo and Fair [9]
Segmentnumber
[ - ]
Height ofpacking[ cm ]
Acetone
[ - ]
Methylacetate
[ - ]
Metha-nol
[ - ]
Acetone
[ - ]
Methylacetate
[ - ]
Metha-nol
[ - ]22
(conden-ser)
43.0compositionabove thepacking
0.1250 0.4133 0.4616 0.1337 0.4523 0.4140
21 40.9 0.1223 0.3999 0.4778 0.1300 0.4381 0.431920 38.7 0.1197 0.3862 0.4941 0.1266 0.4234 0.450019 36.6 0.1173 0.3722 0.5105 0.1234 0.4083 0.468318 34.4 0.1150 0.3580 0.5271 0.1204 0.3928 0.486917 32.3 0.1128 0.3435 0.5437 0.1176 0.3768 0.505616 30.1 0.1107 0.3289 0.5604 0.1149 0.3606 0.524515 28.0 0.1087 0.3141 0.5772 0.1124 0.3440 0.543514 25.8 0.1068 0.2992 0.5940 0.1101 0.3271 0.562813 23.7 0.1050 0.2841 0.6109 0.1079 0.3100 0.582112 21.5 0.1032 0.2690 0.6278 0.1058 0.2927 0.601511 19.4 0.1015 0.2538 0.6447 0.1037 0.2752 0.621010 17.2 0.0998 0.2386 0.6616 0.1018 0.2576 0.64069 15.1 0.0981 0.2234 0.6785 0.0999 0.2400 0.66018 12.9 0.0965 0.2083 0.6952 0.0979 0.2224 0.67967 10.8 0.0947 0.1934 0.7119 0.0960 0.2050 0.69906 8.6 0.0930 0.1787 0.7284 0.0940 0.1877 0.71835 6.5 0.0911 0.1642 0.7446 0.0920 0.1708 0.73734 4.3 0.0892 0.1501 0.7607 0.0898 0.1543 0.75603 2.2 0.0872 0.1364 0.7764 0.0875 0.1383 0.77422 0.0
compositionbelow thepacking
0.0851 0.1232 0.7917 0.0851 0.1229 0.7920
1(reboiler)
Compositionin the reboiler
0.0730 0.0689 0.8521 0.0730 0.0689 0.8581
HETP and HTU Values and EfficienciesThe calculated multicomponent HETP and HTU values for our test case are given intable 3. Again the results are for the Onda et al. [8] correlation. This information isalso shown in figure 6. It is easy to see that even for this short column the HTU andHETP values for the components change quite much. The big difference betweenthe components should also be noted.
The calculated efficiencies of the components as a function of the height of thepacking bed are reported in table 4 and figure 7. Here also the same 21.5 mmsegment height was used in simulation, i.e. efficiency for segment of 21.5 mm.

Table 3. Calculated HETP and HTU values for the components at different points of thepacking height for the acetone/methylacetate/methanol case.
Height ofpacking[ cm ]
HETP[ cm ]
HTU[ cm ]
Acetone Methylacetate
Methanol Acetone Methylacetate
Methanol
41.9 7.1 7.4 8.0 7.4 7.9 7.639.8 7.2 7.5 8.1 7.4 8.0 7.737.6 7.2 7.6 8.2 7.5 8.1 7.835.5 7.2 7.7 8.4 7.5 8.2 7.933.3 7.3 7.7 8.5 7.6 8.4 8.031.2 7.3 7.8 8.6 7.6 8.5 8.129.0 7.4 7.9 8.7 7.6 8.6 8.226.9 7.4 8.0 8.8 7.7 8.7 8.324.7 7.5 8.0 9.0 7.7 8.9 8.522.6 7.5 8.1 9.1 7.8 9.0 8.620.4 7.6 8.2 9.2 7.8 9.2 8.818.3 7.6 8.3 9.4 7.9 9.4 8.916.1 7.7 8.4 9.5 8.0 9.6 9.114.0 7.7 8.5 9.7 8.0 9.8 9.211.8 7.8 8.5 9.9 8.1 10.0 9.49.7 7.9 8.6 10.0 8.2 10.2 9.67.5 8.0 8.7 10.2 8.4 10.4 9.75.4 8.1 8.8 10.4 8.5 10.6 9.93.2 8.2 8.9 10.6 8.6 10.9 10.11.1 8.3 9.0 10.8 8.8 11.1 10.3

a
7
8
9
10
11
0 15 30 45 Height of packing [cm]
HET
P an
d H
TU [c
m]g
HTU, methanolHTU, methylacetateHTU, acetoneHETP, methanolHETP, methylacetateHETP, acetone
Figure 6. Calculated HETP and HTU values for the different components as functions of theheight of the packing.
Table 4. The calculated efficiencies of the 21.5 mm packing segments.
Height ofpacking[ cm ]
Efficiency of different components for a 21.5 mmsegment of packing
[-]Acetone Methylacetate Methanol
41.9 0.294 0.277 0.28039.8 0.292 0.274 0.27637.6 0.291 0.270 0.27335.5 0.289 0.267 0.26933.3 0.288 0.263 0.26531.2 0.286 0.260 0.26229.0 0.285 0.256 0.25826.9 0.283 0.252 0.25424.7 0.281 0.249 0.25122.6 0.280 0.245 0.24720.4 0.278 0.241 0.24318.3 0.276 0.237 0.23916.1 0.273 0.233 0.23514.0 0.270 0.229 0.23111.8 0.267 0.225 0.2279.7 0.264 0.221 0.2237.5 0.260 0.216 0.2185.4 0.256 0.212 0.2143.2 0.252 0.208 0.2101.1 0.248 0.204 0.206

0.15
0.20
0.25
0.30
0.35
0 15 30 45
Height of packing [cm]
Pack
ing
effic
ienc
y
AcetoneMethylacetateMethanol
Figure 7. Efficiency of a 21.5 mm segment of packing as function of the location in thecolumn. Efficiency of components is different.
When inspecting the results in table 4 and figure 7 it should be noted that theseefficiencies are now given for 21.5 mm segment height of packing. These values areused to correct the mass transfer in the segment.
DISCUSSION AND CONCLUSIONS
Based on our test runs on the FLOWBAT flowsheeting program the columnpredictions are very realistic showing the success of the method presented in thispaper. There are some discrepancies between experimental data and simulations,these might result from:• Accuracy of the VLE-models.• Accuracy of other physical properties: densities, viscosities, and especially
diffusion coefficients.• Our model has some approximations as discussed above.• The mass transfer correlations of publications [8] to [15] implemented in the
software. There is some deviation between simulation results with different masstransfer correlations. Many of the correlations are based on limited number ofbinary component pairs and it is possible that the physical properties aretherefore not taken into account properly in the correlations.
The method has still to be verified using more experimental data. The data availablefor multicomponent systems in the literature is quite limited, especially if such data issought that has measured compositions along the height of the packing.
The method can only be as accurate as are the methods used to calculate the binarymass transfer coefficients. This indicates that for different packing types the masstransfer correlations should be developed using as many different component pairsas possible to have fully the effect of physical properties on the models. Also, thesebinary mass transfer correlations should have as wide vapor and liquid loadingconditions as possible.
Our calculations clearly show that each component can have different mass transfercharacteristics inside one column as the composition and temperature change alongthe column. These leads to the conclusion that simple binary component systembased HETP methods are not adequate enough for accurate absorption anddistillation column design. Instead, our approach of using multicomponent masstransfer models to calculate the component efficiencies provides a more reliable wayto estimate the real column performance. Another alternative to our model would bea rate-based non-equilibrium model that also takes into account the different masstransfer rates of the components. Our experience up to now shows that our methodis fast because it uses the solution algorithms developed for the equilibrium stagedistillation model that have been fine-tuned for fast calculation and robustness overthe years.
NOMENCLATURE
[A] diagonal matrix consisting of reciprocals of (y*n – yn), -
AC column cross-sectional area, m2
aeff specific mass transfer area of the packing, m2/m3
c concentration, mol/m3
D diffusion coefficient, m2/sdi driving force for component i in mass transfer, m-1
E packing segment vapor phase efficiency, -Emv Murphree vapor phase plate efficiency, -GL liquid mass flux, kg/(s m2)&G gas mole flow, mol/s[K] diagonal matrix of vapor/liquid equilibrium K values, -[ ]KOG gas phase zero flux overall mass transfer coefficient matrix, mol/(s m2)k mass transfer coefficient, m/s[ ]k L matrix of zero flux liquid phase mass transfer coefficients, mol/(s m2)
[ ]kG matrix of zero flux gas phase mass transfer coefficients, mol/(s m2)HETP HETP (Height Equivalent to a Theoretical Plate), mHG height of mass transfer unit based on gas phase, mHOG height of overall mass transfer unit based on gas phase, mHL height of mass transfer unit based on liquid phase, mJ diffusion flux, mol/(s m2)L liquid mass flux, kg/(s m2)&L liquid mole flow, mol/s[M] matrix of slopes of (VLE) equilibrium curves, -m slope of (VLE) equilibrium curve, -(N) vector of mole fluxes, mol/ (s m2)N mole flux, mol/ (s m2)[NOG] martix of overall numbers of mass transfer units, -Nt total mole flux, mol/ (s m2)n equilibrium stage number, -ni mole amount of component i, molP total pressure, Pa[R] inverse matrix of binary mass transfer coefficients, m2 s/molT temperature, K

uS superficial velocity, m/sx mole fraction of component in liquid phase, -y mole fraction of component in gas phase, -y average mole fraction of component in gas phase, -Z total height of packing, mz height of packing, mzi mole fraction of component i in gas or liquid phase, -
[ ]Gβ bootstrap matrix for gas phase, -[ ]Lβ bootstrap matrix for liquid phase, -δ film thickness, mδij Kronecker delta (1, if i = j and 0, if i ≠ j), -ζ dimensionless height of packing ( = z / Z ), -κij zero flux binary mass transfer coefficient for component pair ij, m/sλ stripping factor, -
Subscripts
b bulk phaseG gas or vaporI interface of phasesi component ij component jnc total number of components present in systemL liquidn segment n
Superscripts
* equilibrium
Abbreviations
HETP HETP height equivalent to a theoretical plateHTU HOG height of a transfer unitNTU NOG number of transfer units
REFERENCES
1. FLOWBAT User's Manual (2002), Kari I. Keskinen and Juhani Aittamaa (eds.),Neste Engineering Oy and Helsinki University of Technology, Laboratory ofChemical Engineering and Plant Design.
2. Jarno Ilme (1997), Estimating Plate Efficiencies in Simulation of Industrial ScaleDistillation Columns, Ph.D. Thesis, Research Papers 57, LappeenrantaUniversity of Technology, Finland.
3. C.D. Holland (1981), Fundamentals of Multicomponent Distillation, McGraw-HillBook Company, New York.

4. W.G. Whitman (1923), The Two-Film Theory of Gas Absorption, Chem.Met.Eng.,29, 146-148.
5. J.D. Seader and E.J. Henley (1998), Separation Process Principles, John Wiley& Sons, Inc., New York.
6. J.G. Stichlmair and J.R. Fair (1998), Distillation: Principle and Practice, Wiley-VCH, USA.
7. J.A. Wesselingh (1997), Non-equilibrium modelling of distillation, Inst. Chem.Engrs, Symp.Series, Distillation & Absorption.
8. K. Onda, H. Takeuchi and Y.J. Okumoto (1968), J. Chem. Eng. Jpn., 1, 56-62.
9. J.L. Bravo and J.R. Fair (1982), Generalized Correlation for Mass Transfer inPacked Columns, Ind. Eng. Chem. Process Des. Dev., 21, 162-170.
10. R. Billet and M. Schultes (1991), Beitrage zur Verfahrens- und Umwelttechnik,Ruhr-Universitat Bochum, 88-106.
11. J.J. Gualito, F.J. Ferino, J.C. Cardenas and J.A. Rocha (1997), Design Methodfor Distillation Columns Filled with Metallic, Ceramic, or Plastic StructuredPackings, Ind.Eng.Chem.Res., 36, 1747-1757.
12. J.L. Bravo, J.A. Rocha and J.R. Fair (1985), Mass transfer in gauze packings,Hydrocarbon Processing, 64(1), 56-60.
13. J.R. Fair and J.L. Bravo (1987), Prediction of Mass Transfer Efficiencies andPressure Drop for Structured Tower Packings in Vapor/Liquid Service, I. Chem.E. Symp. Ser., 104, A183-A201.
14. J.R. Fair and J.L. Bravo (1990), Distillation Columns Containing StructuredPacking, Chem.Eng.Prog., 86(1), 19-29.
15. J.A. Rocha, J.L. Bravo and J.R. Fair (1996), Distillation Columns ContainingStructured Packings: A Comprehensive Model for Their Performance. 2. Mass-Transfer Model, Ind.Eng.Chem.Res., 35, 1660-1667.
16. T.J. Vital, S.S. Grossel and P.I. Olsen (1984), Estimating Separation Efficiency,Hydrocarbon Processing, December 1984, 75-78.
17. H.Z. Kister (1992), Distillation Design, McGraw-Hill, USA.
18. I. Wagner, J. Stichlmair and J.R. Fair (1997), Mass Transfer in Beds of Modern,High-Efficiency Random Packings, Ind.Eng.Chem.Res., 36, 227-237.
19. M.J. Lockett, Easily Predict Structured-Packing HETP, Chem.Eng.Prog., January1998, 60-66.
20. F.M. Khoury (1995), Predicting the Performance of Multistage SeparationProcesses, Gulf Publishing Company, Houston.

21. Ross Taylor and R. Krishna (1993), Multicomponent Mass Transfer, John Wiley& Sons, Inc., New York.
22. Juhani Aittamaa (1981), Estimating Multicomponent Plate Efficiencies inDistillation, Kemia-Kemi, 8, 295.
23. Kimmo T. Klemola (1998), Efficiencies in Distillation and Reactive Distillation,Acta Polytechnica Scandinavica, Chemical Technology Series No. 257, Espoo.
24. Jarno K. Ilme, Kari I. Keskinen, Varpu L. Markkanen and Juhani R. Aittamaa(1997), Simulation of Industrial Multicomponent MTBE Distillation Column Usingan Equilibrium Stage Model with Efficiency Calculation, Inst. Chem. Engrs,Symp.Series, Distillation & Absorption.
25. Kaj Jakobsson, Juhani Aittamaa, Kari I. Keskinen and Jarno Ilme, PlateEfficiencies of Industrial Scale Dehexanizer, Paper to be presented inconference "Distillation & Absorption", Baden-Baden, Germany, 30.9.2002-2.10.2002.
26. Olavi Kleine (1998), Calculation and design of packed distillation column,M.Sc.Thesis, Lappeenranta University of Technology, Department of ChemicalTechnology (in Finnish).
27. Anu Kinnunen (1999), Modelling and calculation of distillation in packed columnsby using efficiencies, M.Sc.Thesis, Lappeenranta University of Technology,Department of Chemical Technology (in Finnish).
28. Sami Pelkonen, Andrzej Górak, André Ohligsläger and Ruth Kaesemann (2001),Experimental study on multicomponent distillation in packed bed columns,Chem. Eng. And Proc. 40, 235-243.
29. K.J. Arwikar (1981), Mass Transfer in Packed Column Absorption andMulticomponent Distillation, Ph. D. Thesis, University of California, SantaBarbara.
30. A. Górak and A. Vogelpohl (1985), Experimental Study of Ternary Distillation in aPacked Column, Separ. Sci. Technol., 20, 33-61.
31. S. Pelkonen, A. Górak, H. Kooijman and R. Taylor (1997), Operation of aPacked Distillation Column: Modelling and Experiments, Inst. Chem. Engrs,Symp.Series, Distillation & Absorption.
32. K. Jakobsson and J. Aittamaa (2001), Comparison of plate efficiency estimationmodels to experimental results of pilot scale: a case study. 2001 AIChE Annualmeeting, Separations Technology, November 4-9, 2001, Reno,NV, USA. pp. 98-103.