efficient algorithms for flood risk analysis
TRANSCRIPT
Lars Arge
1/15
Efficient Algorithms for Flood Risk Analysis
March 29, 2017
Lars ArgeProfessor and Center Director
Lars Arge
2/15
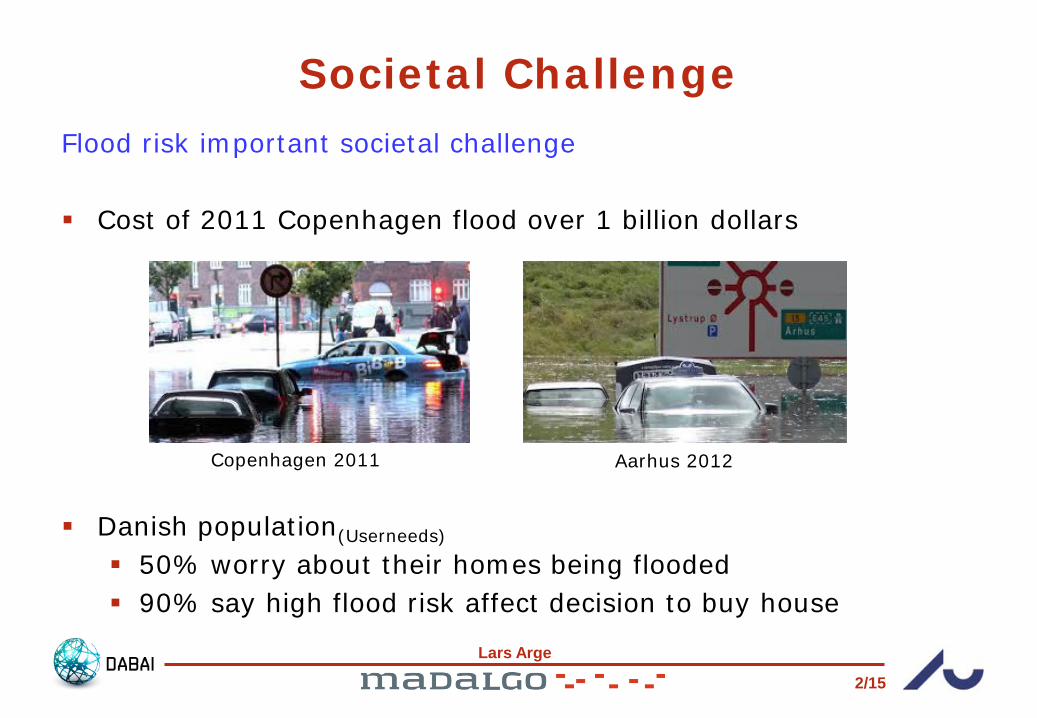
Societal ChallengeFlood risk important societal challenge
Cost of 2011 Copenhagen flood over 1 billion dollars
Danish population(Userneeds)
50% worry about their homes being flooded 90% say high flood risk affect decision to buy house
Aarhus 2012Copenhagen 2011

Lars Arge
3/15
Public Big Data Precise and detailed national terrain model At least 4 measurements per m2
Freely available in base data program
Important basis for flood risk analysis Terrain essential for water flow Thousands of points in family home lot
Lars Arge
4/15
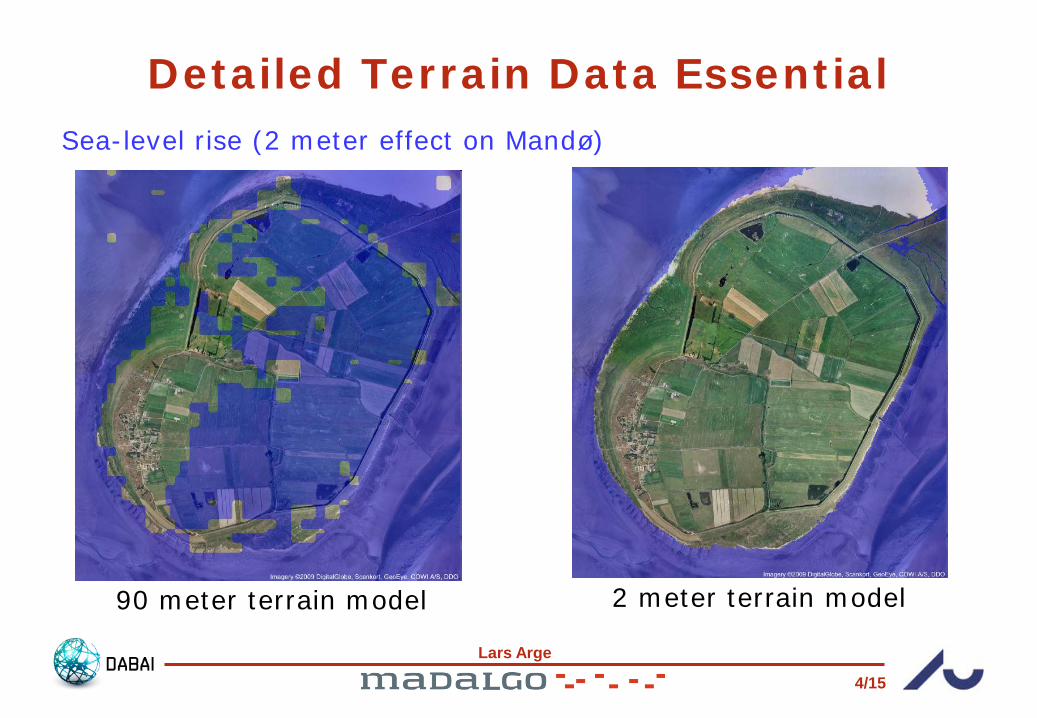
Detailed Terrain Data EssentialSea-level rise (2 meter effect on Mandø)
90 meter terrain model 2 meter terrain model
Lars Arge
5/15
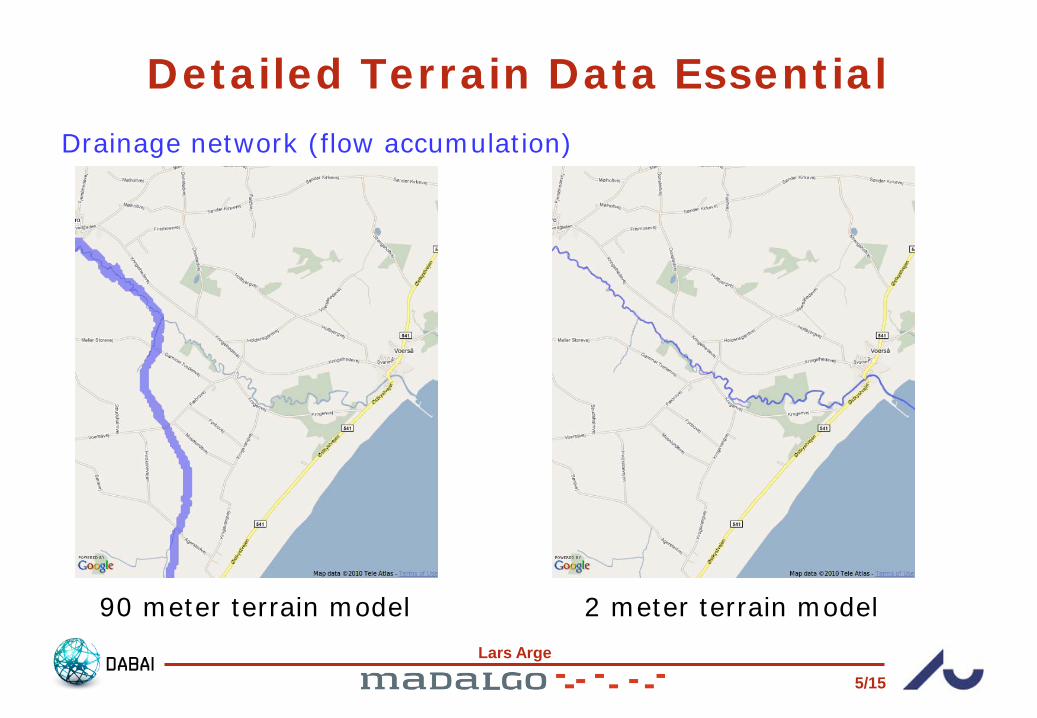
2 meter terrain model90 meter terrain model
Detailed Terrain Data EssentialDrainage network (flow accumulation)

Lars Arge
6/15
Difficult to Handle BIG Detailed DataDetailed terrain data BIG Denmark (42.000 km2) ~168 billion measurements Aarhus ~2 billion measurements
Most analysis software cannothandle such BIG datasets!
Typical workarounds: Tiling (difficult and cumbersome) Data simplification (unreliable results) Small areas (area identification, border conditions)
⇒ Hard to use detailed national terrain model even on regional scale

Lars Arge
7/15
I/O-Efficient AlgorithmsDisk often bottleneck when handling massive data Disk access is 106 times slower than main memory access
Large disk access time amortized by transferring large data blocks→ Important to store/access data to take advantage of blocks
I/O-efficient algorithms: Move as few disk blocks as possible to solve given problem
“The difference in speed between modern CPU and disk technologies is analogous to
the difference in speed in sharpening a pencil using a sharpener on one’s desk or by taking an airplane to the other side of
the world and using a sharpener on someone else’s desk.” (D. Comer) Data size
Tim
e

Lars Arge
8/15
I/O-Efficient Algorithms Matter Example: Traversing linked list (List ranking)
Array size N = 10 elements Disk block size B = 2 elements Main memory size M = 4 elements (2 blocks)
Difference between N and N/B large since block size is large Example: N = 256 x 106, B = 8000 , 1ms disk access time
⇒ N I/Os take 256 x 103 sec = 4266 min = 71 hr⇒ N/B I/Os take 256/8 sec = 32 sec
Algorithm 2: N/B=5 I/OsAlgorithm 1: N=10 I/Os
1 5 2 6 73 4 108 9 1 2 10 9 85 4 76 3

Lars Arge
9/15
Flow accumulation on grid terrain model: Initially one unit of water in each grid cell Water (initial and received) distributed from each cell to lowest
lower neighbor cell (if existing)⇒ Flow accumulation of cell is total amount of water through it⇒ Drainage network = cells with high flow accumulation
Surface Flow Modeling

Lars Arge
10/15
Flow Accumulation AlgorithmNatural algorithm Sort cells by height Visit cells in height order and for each cell
Read height, height of neighbors and water amount Add water to lowest neighbor
Problem: Disk access for each cell Almost same height cells scattered over terrain⇒ Algorithm cannot handle Denmark model

Lars Arge
11/15
Efficient Flow Accumulation AlgorithmOur I/O-efficient algorithm avoids scattered access by Data duplication “Lazy write”
(using I/O-efficient priority-queue)
⇒ ~N/B I/O algorithm⇒ Easily handle Denmark
on normal desktop
Several other I/O-efficient flood riskanalysis algorithms have been developed E.g. event based flood risk

Lars Arge
12/15
Depression Flood Risk: Flash Flood MapModels how surface water gathers in depressions as it rains Water from watershed of depression gathers in the depression Depressions fill, leading to (potentially dramatic) increase in
neighbor depression watershed size
Flash Flood Mapping: Amount of rain before any given raster cell is below water
Watershed area
VolumeWatershed area
Volume

Lars Arge
13/15
CommercializationFlood risk algorithm technology commercialized by start-up SCALGO
Developed successful product SCALGO live Cloud based flood risk analysis platform Made possible by free data and algorithm technology Important interplay between efficient algorithms and visual analytics

Lars Arge
14/15
DABAI Flood Risk Cases The DABAI project will push BIG data flood risk analysis further Combining algorithms, visual analytics and
machine learning technology Involving large number of partners
Currently four planned cases1. Semi-automatic identification of hydrological corrections
AU, DTU, KU, SDFE2. Integration of forecast data with flood risk screening
AU, DMI, SCALGO, SDFE, RM3. Analysis updating after data update SCALGO, SDFE, AU
4. River flood risk using integrated terrain and river data COWI, NIRAS, SCALGO, SDFE, AU, RM