efficacy of a multiple micronutrient enriched maize …
TRANSCRIPT

Effect of a multiple micronutrient enriched maize-based liquid meal supplement on iron
status of grade 3 and 4 learners attending Sunnyside primary school, Pretoria
by
Lusanda Susan Simelane
Submitted in partial fulfillment of the requirements for the degree
MSc Nutrition
in the Faculty of Natural & Agricultural Sciences
University of Pretoria
Pretoria
Supervisor: Dr Zelda White
Co-Supervisor: Prof Andrea Oelofse
February 2015

DECLARATION
I declare that the dissertation, which I hereby submit for the degree MSc nutrition at the
University of Pretoria, is my own work and has not previously been submitted by me for a
degree at this or any other tertiary institution.
SIGNATURE:……………………………………………… Lusanda Susan Simelane
DATE: February 2015

i
ABSTRACT
Background: About one half of school-age children in developing countries are estimated to
be affected by iron deficiency. Failure to treat micronutrient deficiencies can negatively affect
health and economic development.
Objective: To determine the effect of multiple micronutrient maize-based liquid meal
supplement on the iron status and the nutritional status of primary school children.
Design: A randomized double-blind placebo controlled trial was conducted.
Setting and subjects: The study took place at Sunnyside Primary School in Sunnyside, Pretoria,
in the urban area of Tshwane (Gauteng Province, South Africa). Grades 3 and 4 male and female
learners aged 8-12 years, enrolled in the 2010 academic year were recruited for the study.
Methods: Participants were dewormed, to eliminate parasitic infestaion at the beginning of the
study. The experimental product was a maize-based liquid meal supplement enriched with
macronutrients and micronutrients including chelated ferrous bisglycinate, while the control
had the same macronutrient profile but no added micronutrients. The learners took the meal
supplement every morning on school days for 14 weeks. Iron status was measured by
Haemoglobin (Hb) levels and the nutritional status was measured by anthropometric measures
at baseline and end. Groups were compared with respect to change in Hb and change in
anthropometry using an analysis of covariance (ANCOVA) with baseline Hb values as covariate.
Testing was done at the 0.05 level of significance.
Results: There was no significant difference in the Hb levels at baseline (12.6 ± 1.1 g/dL and
12.8 ± 1.1 g/dL) (P = 0.250) between the experimental and control groups respectively. The
prevalence of mild anemia (Hb< 11g/dL) was low in both the experimental and control groups.
Over the 14 weeks study period, consumption of experimental products was similar and there
was no significant effect on Hb levels of the participants observed (P = 0.806) in the
experimental and control groups. There was also no significant change observed in the
anthropometry of the participants.
Conclusion: The maize-based liquid meal supplement enriched with multiple micronutrients did
not have a significant effect on the iron status of the participants in this study, possibly owing
to low prevalence of anemia, a low rate of consumption and therefore iron absorption.

ii
ACKNOWLEDGEMENTS
I would like to thank the following institutions and persons:
My supervisors, Dr Zelda White and Prof Andrea Oelofse, for their guidance, advice, positive
criticism, patience and support during the course of this study
Prof Piet Becker, for assisting me with the statistical analysis for this study
Resaf Company (SA) for supplying the multiple micronutrient enriched maize –based liquid
meal supplement and supporting the study.
The University of Pretoria for the financial support rendered during my period of study at the
University.
The head teacher and teaching staff of Sunnyside Primary School (Pretoria)
The Grade 3 and 4 learners for the year 2010 of Sunnyside Primary School
Mr Jonathan Kotze for the help rendered during the collection of data.
Dietetics students from University of Pretoria (2010), for the assistance they offered during the
collection of data.
My colleagues, for their support and encouragement
My family and friends, for their continued support, understanding and encouragement
Above all, honour and glory goes to the Lord God Almighty for every good thing comes from
Him.

iii
TABLE OF CONTENTS
ABSTRACT………………………………………………………………………………………………………………………………..…i
ACKNOWLEDGEMENTS……………………………………………………………………………………………………........…ii
TABLE OF CONTENTS………………………………………………………………………………………..…………………….…iii
LIST OF TABLES……………………………………………………………………………………………………………..………..….v
LIST OF FIGURES………………………………………………………………………………………………………………………...v
ABBREVIATIONS………………………………………………………………………………………………………………….…....vi
CHAPTER 1: INTRODUCTION………………………………………………………………………………………………………1
1.1 BACKGROUND ........................................................................................................................... 1
1.2 RESEARCH HYPOTHESIS………………………………………………………………………………………………………..4
1.3 OBJECTIVES ............................................................................................................................... 4
1.4 CONCEPTUALIZATION ............................................................................................................... 4
1.5 STRUCTURE OF THIS DISSERTATION ......................................................................................... 7
CHAPTER 2: LITERATURE REVIEW ................................................................................................... 8
2.1 INTRODUCTION ......................................................................................................................... 8
2.1.1 Focus of literature review…………………………………………………………………………………….……………8
2.2 THE ROLE OF IRON IN GROWTH AND DEVELOPMENT ............................................................. 8
2.2.1 Iron metabolism and homeostasis ........................................................................................ 9
2.2.2 Etiology of anemia ............................................................................................................... 11
2.2.3 Diagnosis of iron deficiency and anemia ............................................................................. 16
2.2.4 Consequences of iron deficiency and anemia ..................................................................... 21
2.2.5. Epidemiology of iron deficiency and anemia...................................................................... 23
2.3 STRATEGIES TO ADDRESS IRON DEFICIENCY AND ANEMIA……………………………….…………….….24
2.3.1 Food fortification ................................................................................................................. 25
2.3.2 Education combined with dietary diversification ................................................................ 28
2.3.3 Supplementation ................................................................................................................. 28
2.4. LITERATURE REVIEW SUMMARY ........................................................................................... 38
CHAPTER 3: METHODOLOGY ........................................................................................................ 39
3.1 ETHICAL CONSIDERATIONS ..................................................................................................... 39
iv
3.2 RESEARCH DESIGN……………………………………………………………………………………………………………..39
3.3 STUDY SETTING ....................................................................................................................... 39
3.4 STUDY POPULATION ............................................................................................................... 39
3.4.1. Recruitment and screening ................................................................................................. 39
3.5 SAMPLING METHOD ............................................................................................................... 41
3.5.1 Sample size ........................................................................................................................... 41
3.6 INTERVENTION…………………………………………………………………………………………………………………..41
3.6.1 De-worming ......................................................................................................................... 41
3.6.2 Experimental product .......................................................................................................... 41
3.7 RANDOMISATION AND BLINDING .......................................................................................... 44
3.7.1 Preparing and administering of experimental product ....................................................... 44
3.7.2 Subject compliance and monitoring .................................................................................... 45
3.7.3 Packaging and blinding of experimental products .............................................................. 45
3.8 DATA COLLECTION……………………………………………………………………………………………………………..45
3.8.1 Screening .............................................................................................................................. 45
3.8.2 Schedule of measurements ................................................................................................. 45
3.8.3 Variables............................................................................................................................... 46
3.9 STATISTICAL ANALYSIS ........................................................................................................... 47
CHAPTER 4: RESULTS AND DISCUSSION ....................................................................................... 48
4.1 CHARACTERISTICS ................................................................................................................... 48
4.1.1 Socio-demographic data ...................................................................................................... 48
4.1.2. Anthropometric characteristics .......................................................................................... 50
4.1.3 Consumption ........................................................................................................................ 52
4.1.4 Iron status ........................................................................................................................... 53
4.2 LIMITATIONS:…………………………………………………………………………………………………………………..57
CHAPTER 5: CONCLUSIONS AND RECOMMENDATIONS………………………………..………………………….58
REFERENCES .................................................................................................................................. 59
ADDENDUM 1: ETHICAL APPROVAL ........................................................................................... 744
ADDENDUM 2: ASSENT FORM FOR 7-8 YEARS FOR CLINICAL TRIAL/INTERVENTION RESEARCH

v
..................................................................................................................................................... 755
ADDENDUM 3: NAME BADGES…………………………………………………………………………………………………77
ADDENDUM 4: COMPLIANCE SHEETS……………………………………………………………………………………...78
ADDENDUM 5: SOCIO-DEMOGRAPHIC QUESTIONNAIRE………………………………………………………...79
ADDENDUM 6: SICKNESS DIARY……………………………………………………………………………………………….82
LIST OF TABLES
Table 1.1: Conceptual definitions and operationalization .......................................................... 6
Table 2.1: Influence of the iron status on various indicators in absence of other diseases ..... 17
Table 2.2: Stages of anemia and values used in demographic and health surveys .................. 18
Table 2.3: Cut off values for anemia at sea level and above sea level using hemoglobin
concentration ............................................................................................................................ 18
Table 2.4: Adjustments to haemoglobin cutoffs and individual values for altitude and ethnicity
................................................................................................................................................... 19
Table 2.5: Suggested iron fortification compounds for different food vehicles ....................... 26
Table2.6: Overview of iron supplementation trials on iron status of school age children ....... 30
Table2.7: Overview of multiple micronutrient supplementation trial characteristics trilals on
mean Hb concentration in school age children ........................................................................ 34
Table2.8: Nutritional content of the supplements/fortified foods used in multiple
micronutrient studies ................................................................................................................ 36
Table 3.1: Nutritional composition of experimental and control product ............................... 43
Table 4.1: Charactristics of learners who participated in the 14 week study ........................... 48
Table 4.2: The socio-demographic characteristics of the study population ............................. 49
Table 4.3: Anthropometric characteristics of the study population ......................................... 51
Table 4.4: Anemia prevalence in the experimental and control groups at baseline and at
end……………………………………………………………………………………………………………………………………….54
Table 4.5: Iron status of participants at baseline, end and change from baseline to end………54
LISTOF FIGURES
Figure 1: Conceptual framework ................................................................................................. 5
Figure 2: Regulation of intestinal iron uptake ........................................................................... 10

vi
Figure 3: Trial profile of the 14 week intervention study ........................................................ 40
ABREVIATIONS
ADA American Dietetic Association
AGP alpha-1 glycoprotein
AIDS Acquired Immunodeficiency Syndrome
ALA Eicosapentaenoic acid
ALC Active learning capacity
ANCOVA Analysis of Covariance
BAZ Body Mass Index for age z-score
BMI Body Mass Index
CI Confidence Interval
CRP C- reactive protein
DCYTB duodenal cytochrome
DHA Docosahexaenoic acid
DMT1 Divalent metal ion transporter 1
DOH Department of Health
FAO Food and Agriculture Organization
FBDG Food based dietary guidelines
Fe2+ Ferrous ion
Fe3+ Ferric reductase
H+ Hydrogen
HAZ Height for age z- score
Hb Haemoglobin
HCP1 Heme carrier protein 1
HIV Human Immuno-deficiency Virus
ICSH International Committee for Standardization
IDA Iron deficiency anaemia
MVC Mean corpuscular volume
n number

vii
Na+ Sodium
NaFe EDTA Sodium Ferredetate ethylenediamine tetracetic acid
NFCS National Food Consumption Survey
NSNP National Schools Nutrition Program
PSNP Primary School Nutrition Program
RDA Recommended dietary allowance
RDI Recommended dietary intake
SANHNES South African National Health and Nutrition Examination Survey
sd standard deviation
sTfR soluble transferrin receptor
UNICEF United Nations Children’s Fund
UNU United Nations University
WMD Weight mean difference
WHO World Health Organization
WHZ Weight for height z- score
ZnPP Zinc protoporphyrin

1
CHAPTER 1: INTRODUCTION
1.1 BACKGROUND
Micronutrient malnutrition is considered as a public health problem affecting more than 2
billion people worldwide.1 In developing countries the magnitude is much greater because
malnutrition, infection and poverty are most common, and often interlinked.1,2 Failure to treat
micronutrient deficiencies can negatively affect health and economic development.1 Iron,
vitamin A and iodine deficiencies are the major micronutrient deficiencies affecting children
including school children in developing countries. In addition deficiencies of vitamin C, zinc and
B vitamins often occur concurrently with the 3 major micronutrient deficiencies. About one half
of school age children in developing countries are estimated to be affected by iron deficiency. 3
The school age years are therefore an opportune time for addressing iron deficiency because of
the following reasons: iron deficiency impairs fitness and work capacity thus interventions to
improve iron status may enhance fitness and work capacity of children.4 Improving iron status
may enhance learning potential of children.5 Improving iron status of girls may help prevent
anemia in their reproductive years. Most importantly, the school offers an ideal distribution
system for several types of public health interventions.6 Micronutrient deficiencies are also a
risk factor for frequent and severe infections. These infections in turn may have adverse effects
on nutritional status. 7
School children are significantly disadvantaged in terms of nutrition interventions and/or
programs and in urgent need of additional attention, if they are to reach their full
developmental potential.8 The full genetic potential of the child for physical growth and mental
development may be compromised due to deficiency (even subclinical) of micronutrients.
Children and adolescents with poor nutritional status are exposed to alterations of physical,
mental and behavioral functions that can be corrected to certain extend by dietary measures.9
Therefore, in trying to alleviate micronutrient malnutrition, the South African Government
designed a 3-way food-based approach which includes mandatory food fortification. The other

2
two approaches include a micronutrient supplementation program for women and children,
and an educational program to promote better dietary habits, including breast-feeding
initiatives, school feeding program and campaigns to encourage people to grow their own
vegetables and fruits to improve household food security as well as increasing intakes of
micronutrient-rich foods. The approaches are known as the Integrated Nutrition Program
(INP).10
School feeding has the potential to contribute toward alleviating both short-term hunger and
hidden hunger (micronutrient deficiencies) for school children to reach their full mental and
physical potential and perform optimally in school.8 Therefore, to ensure good nutritional status
and improvement of the general health as well as learning capacity, a comprehensive Primary
School Nutrition Program (PSNP) was introduced twenty years back in South Africa. In its first
ten years of implementation PSNP was coordinated by the Department of Health, in 2004 it was
relocated to the Department of Education. The decision was based on consideration that school
feeding had important educational outcomes which are the functional responsibility of the
Department of Education.11It was then renamed the National Schools Nutrition Program
(NSNP). The primary aim of the program was to improve the educational experience of the
disadvantaged primary school learners through promoting punctuality, alleviating short term
hunger, improving concentration and contributing to general health development.12
In 1996, an evaluation on the PSNP showed a high prevalence of malnutrition especially
amongst the black and colored primary school children, and reports have shown poor and
inconsistent coverage of the program in several parts of the country. Numerous challenges
were encountered in the program, such as inappropriate feeding times and food of a sub-
standard quality and quantity.13 Furthermore, several schools were found to have poor
infrastructure to be able to adequately support the implementation of NSNP effectively. Lack of
proper kitchen infrastructure, cooking equipment and storage facilities such as refrigerators for
storing perishables, have been a drawback in the preparation of school meals. As a result, the
complete advantage of school feeding has not been realized. Therefore, micronutrient

3
deficiencies (including iron deficiency) are still highly prevalent in South African school children
despite the existence of a national school-feeding program. School-feeding program often focus
on relieving short-term hunger, and do not always concentrate on alleviating or preventing
hidden hunger.8
To alleviate short term and hidden hunger, deworming, nutrition education and micronutrient
supplementation are recognized as more cost-effective interventions. However, there has been
a lack of systematic implementation of these interventions as part of the NSNP.13 Controversy
surrounding the use of supplementation products as part of NSNP has been another issue. The
concern has been that: use of commercial supplements may defeat the aim of nutrition
education and may not be in line with local eating habits in addition, enriched commercial
foods tend to be more expensive and do not contribute to “community involvement”.
Unfortunately, the chance of local food based meal to provide the same micronutrient
contribution as a meal that includes a fortified product is very slim, unless it contains fortified
ingredients. In addition, food sources of iron are relatively expensive. Alternative sources of
iron which are cheaper include spinach and legumes, but unfortunately their iron content is
smaller and less bioavailable, presenting yet another challenge.13
This study therefore sought to provide solid scientific evidence describing the magnitude of
impact to be expected from enriched maize-based meal supplements on iron status in primary
school children. The results from this project are meant to assist in making informed choices
about the importance and potential impact of multiple micronutrient interventions in primary
school children. The study sought to provide input for the Integrated Nutrition Program of
South Africa, especially the NSNP on the use of maize-based supplementation in school feeding
schemes to reach the most vulnerable groups. The study investigated the effect of a ready to
use multiple micronutrient enriched maize-based liquid meal supplement on iron status of
primary school children aged 8 to 12 years.

4
1.2 RESEARCH HYPOTHESIS
1. Consumption of a multiple micronutrient enriched maize-based liquid meal supplement 5
days a week for 14 weeks, will improve iron status as measured by hemoglobin, in primary
school children (8 – 12 years old). Iron therapy is expected to increase Hb values.14 The
supplement contains Ferrous bisglycinate chelate which has a higher bioavailability (3.4 -4
times higher) than ferrous sulpphate.15
2. Consumption of a multiple micronutrient enriched maize-based liquid meal supplement, will
improve nutritional status. Multiple micronutrient interventions containing iron improve
nutritional status compared to placebo or single nutrient interventions.16
1.3 OBJECTIVES
1. To determine the effect of multiple micronutrient enriched maize - based liquid meal
supplement on the iron status of primary school children using hemoglobin as a biomarker.
2. To determine the effect of multiple micronutrient enriched, maize-based liquid meal
supplement on the nutritional status of primary school children using anthropometry.
1.4 CONCEPTUALIZATION
The conceptual framework used in this study shows that nutrition status results from several
interrelated causes. Anemia, which is one indication of poor nutrition status, is an outcome of
poor diet, increased iron demand, infection and sometimes inherited conditions. Anemia can be
assessed by measuring hemoglobin concentration, and can be classified as mild, moderate or
severe. To correct anemia, a multiple micronutrient dietary supplement which contains
chelated iron can be useful, as this type of iron is more bioavailable, and the presence of the
other nutrients can work synergistically with the iron to correct anemia. If anemia is not
corrected it may result to poor health, low activity, defects in growth, affect cognition, in severe
cases it may lead to death (Figure 1.1)

5
iron supplementation
Figure 1. Conceptual framework17
Inadequate absorption: iron
absorption inhibitors
Inadequate ingestion: iron
deficient meals
Inadequate utilisation: lack of other erythropoietin nutrients
Increased destruction resulting in decreased release from stores: infections
Increased blood loss or excretion: helminth infestation
Increased requirement e.g. physical growth
Consequences: growth abnormalities inadequate muscle function fatigue low cognition increased morbidity
Stages of anemia: Mild:Hb;9,5 – 10.99 g/dL Moderate: Hb;7 – 9.4 g/dL severe: Hb < 7g/dL
Nutrition Management: food diversification food fortification with iron food fortification with multiple micronutrients dietary supplements containing multiple micronutrients
Medical management: iron supplementation multiple micronutrient supplementation
Anemia

6
Table 1.1: Conceptual definitions and operationalization
Terminology Conceptual definition Operationalization
Anemia Condition indicating a deficiency
of the size or number of red
blood cells or the amount of
haemoglobin they contain.17
Indicated by decrease in the
quantity of hemoglobin i.e. <
7g/dL indicate severe anemia,
7 – 9.4 g/dL indicate moderate
anemia and 9.5 – 10.99 g/dL
indicate mild anemia18
Grade 3 and 4 learners Primary school pupils in Grade 3
and 4 classes.
Sunnyside Primary school boys
and girls (8 -12years old)
Multiple micronutrient
enriched maize-based meal
supplement
A 250ml ready to drink, made
from maize meal and enriched
with multiple nutrients including
chelated iron.
Experimental product
Chelated iron Two molecules of amino acid
bound with a covalent bond to
an iron molecule.19
Ferrous bisglycinate chelate
(Ferrochel®)
Hb: Hemoglobin A conjugated protein containing
four heme groups and globin; it
is the oxygen carrying pigment of
erythrocytes. 17
Cut off points indicate iron
status
Biomarker for Iron status
Iron status Can range from overload to
deficiency and anemia
Iron status has a variety of
indicators. Haemoglobin was
used in this study.
Mild anemia Low Hb, but not severe. Hb: (9.5g/dL to ≤10.99)18

7
1.5 STRUCTURE OF THIS DISSERTATION
A chapter format has been used in presentation of this dissertation.
Chapter 1 is an introductory chapter, followed by Chapter 2, which is a review of the literature.
This review covers the nutrition status of school children including their iron status, the role of
iron in growth and development, iron metabolism, the epidemiology of iron deficiency anemia.
The etiology of iron deficiency anemia (IDA) and the involvement of other micronutrients in the
cause of IDA are also dealt with in this review. Also forming part of the review are the
consequences of IDA, methods of diagnosis as well as the strategies for fighting anemia. A
Review on randomized controlled trial studies, on dietary supplements involving primary school
children are also laid out in Chapter 2.
Chapter 3 shows Methodology including: ethical approval of the study, description of the study
design, the recruitment of the subjects, inclusion and exclusion criteria, screening,
randomisation, blinding, anthropometric and hemoglobin assessment methods as well as the
data collection, capturing and analysis methods used in this study.
Presentation of the results and its discussion is in Chapter 4. In this chapter the description
(demographic information) of the participants is presented. Baseline and end assessment data
are reported in this chapter. In the discussion the results are compared to available literature
and possible interpretation for results is given. Limitations of this study are reviewed in this
chapter.
Chapter 5 gives a conclusion based on all assessments. Recommendations for future research
are given in this chapter.

8
CHAPTER 2: LITERATURE REVIEW
2.1 INTRODUCTION
School age children suffer from multiple micronutrient deficiencies like most people in
developing countries.20 It is estimated that 13 – 27% pre – school children have two or more
micronutrient deficiencies, indicating that 100millions of these children are affected.21 This
indicates that if these children’s condition is not corrected they will move on to primary school
with the same or even worse nutritional status. Reports of impairment in growth, immune
function and cognitive performance have been made, concerning school age children who are
deficient in iron, zinc, vitamin A and iodine.22 Reduction in both productivity and cognitive
performance in adult hood can occur due to the health consequences of micronutrient
deficiencies. Therefore, reducing the prevalence of micronutrient deficiencies is of importance
to several policy makers in developing countries.23
Malnutrition has a negative impact on morbidity, mortality, educability and productivity. In
South Africa, the nutritional status of the population has not improved over the last fourteen
years except for the folate and iodine status. The prevalence of micronutrient deficiencies (i.e.
vitamin A and iron) has increased the double burden of disease in the population.24
Micronutrient deficiencies usually occur concurrently, they tend to interact and coexist. For
example, iron deficiency and vitamin A deficiency usually occur concurrently in the same group
of people. Thus, providing vitamin A supplements for example, can have a positive outcome on
vitamin A status and can improve iron metabolism in affected groups.20
2.1.1 Focus of literature review
The literature review focuses on the role of iron in growth and development, iron metabolism
and homeostasis, etiology of iron deficiency anaemia, diagnosis of iron deficiency anaemia,
epidemiology of iron deficiency and anaemia, iron status and strategies to address iron
deficiency and anaemia.
2.2 THE ROLE OF IRON IN GROWTH AND DEVELOPMENT
Iron is a component of every living cell primarily involved in transport and storage of oxygen,

9
oxidative metabolism and several physiological processes. It is necessary for cellular growth and
functioning.25 Together with other micronutrients, iron is necessary for promotion of physical
growth, sexual maturity and neuromotor development. A number of vitamins and trace
minerals including iron play an important role in boosting both cell-mediated and humoral
immune body defenses. Production of various enzymes, hormones and biochemical mediators
for controlling biological processes and energy production, are shared function of iron with
vitamins and other trace minerals.26 Iron plays a very crucial role in the functioning of the
neurotransmission system through production of dopamine and serotonin.26 The content of
iron in the brain is lowest at birth and increases with age, and reaches adult concentration after
puberty.27 Iron requirements are most likely to exceed intake at 6 – 8months after birth and
during adolescence (for girls).25
2.2.1 Iron metabolism and homeostasis
Iron is a main component of hemoglobin (Hb), needed for basic cellular function in all human
tissues, especially the muscles, brain and blood cells.28 Human beings cannot actively excrete
iron, therefore iron concentration is controlled in the proximal small intestine, at the site of iron
absorption (Figure 2).29 The haem and non haem iron from the diet have specific transporters.
Iron deficiency and hypoxia up regulate heme carrier protein1 (HCP1), a putative haem
transporter.30,31 The divalent metal ion transporter 1 (DMT1), mediates the transport of non
haem iron from the intestinal lumen to the enterocytes.32 DMT1 can only transport ferrous iron
and yet most of the iron enters the duodenum in a ferric form. It is therefore necessary that it
must first be reduced to ferrous iron, ferric reductase, duodenal cytochrome b (DCYTB),33 or
possibly by other reducing agents, such as vitamin C.

10
Figure 2. Regulation of intestinal iron uptake29
HCP: Heme carrier protein; DCYTB: duodenal cytochrome b; DMT1: The divalent metal ion
transporter 1.
Fe2+: ferrous iron: Fe3+: ferric reductase: H+: Hydrogen: Na+: Sodium
Iron that is not transferred to the circulation is stored as ferritin and, is finally lost when the cell
sloughs off at the villus tip. Movement of iron across the basolateral membrane is controlled by
ferroportin 1 and the iron oxidase, hephaestin. The transport protein ferroportin also mediates
iron movement form other cells, including macrophages. Hypoxia and iron deficiency
encourages DMT1, DCYTB and ferroportin stimulation thus increasing iron uptake, iron
deficiency increases iron uptake.33
Hepcidin, a hormone produced by the liver inhibits both absorption and release of iron from
macrophages and other cell types. Therefore, during iron deficiency hepcidin secretion from
the liver is decreased to enable maximum iron absorption.34,35 In the erythroid iron cycle, old
red cells are broken down in the spleen by macrophages, secreted iron returns to the
circulation and binds to transferrin receptors (TfRs) in the bone marrow on erythroid
precursors, and completion of the cycle occurs on entrance of the erythrocytes into the
circulation in the 7-10 days that follows. Iron deficiency encourages maximum iron transfer
through the cycle by increasing expression of ferroportin on macrophages hepatic synthesis,29

11
and TfR1 expression in the bone marrow and other tissues.36 Although the body’s homeostatic
mechanisms are efficient in iron conservation, deficiency of iron can still occur, particularly
when physiologic needs exceed intake or in the case of depletion of iron stores.14
2.2.2 Etiology of anemia
A number of factors may contribute to the development of iron deficiency; low intake and poor
absorption of iron from the diet due to the presence of iron absorption inhibitors such as
polyphenols and phytates, or lack of absorption enhancers such as poor ascorbic acid and meat
intake. High physiological demands of iron during menstruation, pregnancy, and growth may
also contribute to iron deficiency.37,38 Other risk factors include heavy menstrual blood loss,
parasitic infection, acute infection, other micronutrient deficiencies, haemoglobinopathies,50
Human Immune Deficiency Virus (HIV), and other chronic diseases.40,41
2.2.2.1 Iron content in the diet
There are two forms of iron that can be taken up from the diet, haem and non haem iron.
Haem iron is usually obtained from the hemoglobin and myoglobin in animal foods, whereas,
non haem iron comes from cereals, pulses, fruits, and vegetables.42 A majority of diets in
developing countries comprise mainly of cereals and pulses, which means that the form of iron
such a population is likely to get from its diet is non haem iron. Non haem iron, however, has a
low bioavailability.43
2.2.2.2 Bioavailability of iron
Iron bioavailability is defined as the amount of ingested iron which is absorbed and used for
metabolic functions.43 Meals can be categorized into three broad categories in terms of their
iron bioavailability; low, intermediate and high bioavailability.42 The low bioavailability diet
consist of cereals, roots and/tubers and a negligible amount of meat, fish or ascorbic acid. Such
meals have absorption of approximately 5%. Intermediate bioavailability diets have absorption
of approximately 10% and usually consist of cereals, roots and/tubers and negligible food of
animal origin and/vitamin C. The high bioavailability diet is usually composed of generous
quantities of meat, poultry fish, and/foods containing high quantities of ascorbic acid. The iron
absorption of such meals is approximately 15%. The regulation of iron absorption is usually

12
regulated by the iron status; people with normal or high iron stores have a low iron
absorption.46 Sustained negative iron balance can lead to anemia.44 Excessive iron absorption
can have negative effects on the body; it can cause diseases such as hepatic cirrhosis and
diabetes mellitus.47
2.2.2.3 Parasitic infestation
Approximately 35% (320 million) of school age children have round worm infestation; 25% (233
million) are infested with whipworm, and 26% (239 million) have hookworm infestation.48,49,50
Intestinal worms alone account for 11 % and 12% of the total disease burden in 4 -14 years old
boys and girls (from low income countries) respectively.51 It is possible for children to be
concurrently affected by a number of parasitic species.52 Worm infestation may build up over
time and may cause chronic and long lasting health problems. Worms can contribute to
malnutrition through causing lack of appetite, malabsorption and anemia may occur due to
blood loss.52 Parasitic infestation is the most significant infection causing blood loss at the site
of feeding, it also exacerbates bleeding by the secretion of anticoagulants and interferes with
iron uptake in the duodenum as it impairs appetite (with moderate to heavy infection).41 A
relationship between infection intensity and hemoglobin levels has been shown in several
studies and increase in worm infestation results in decreased hemoglobin levels.53,54,55
A study done in East Africa showed that the degree of iron deficiency anemia due to hook
worm infestation was dependant on the intensity and duration of the infection, the iron stores
of the host as well as the species of hookworm. Therefore, Ancylostoma duodenale was more
significant in the prevalence of IDA compared to Necator Americanus.56
Malaria is another parasitic infection which occurs mostly in tropical and sub tropical countries.
Malaria can contribute to iron deficiency and anemia.24 In a cross sectional study from Nigeria,
school children were evaluated to determine the effect of low level Plasmodial infection. The
results indicated that even low level plasmodial infection contributes to anemia.57
2.2.2.4 Other micronutrients in the etiology of anemia
Populations in developing countries are usually affected by concurrent micronutrient

13
deficiencies.29 African school children are vulnerable to coexisting deficiencies of vitamin A and
iron.58,59 A survey carried out in Sri Lanka adolescents reported that 54% males and 55%
females had folate and zinc deficiencies. Moreover, 30% males and 48% females were iron
deficient. The odds ratio of having at least two deficiencies at a time among the iron deficient
children were; 1.6 (95%CI: 0.6 - 4.2) in boys and 0.8 (95%CI: 0.5 - 1.5) in girls. One micronutrient
deficiency could negatively affect the absorption, metabolism and/excretion of another
micronutrient, hence the coexistence. For example, iodine deficiency goiter may be aggravated
by iron deficiency anemia.59
Other micronutrient deficiencies such as riboflavin, folate, vitamin C, A, and B12 may affect
hemoglobin synthesis either by weakening erythropoiesis or indirectly by affecting uptake or
mobilization of iron. Nutrient deficiencies also weaken immune response against helminthic
infections.60
Vitamin A
Vitamin A deficiency and anemia have long been recognized to be linked. Positive correlation
between serum retinol and hemoglobin concentrations have been reported in surveys carried
out in developing countries. Populations with low vitamin A showed a stronger association
between serum retinol and hemoglobin concentrations.61,62
Vitamin A status has an effect on mobilization of iron stores.29 In a study where children were
given soup fortified with iron and vitamin C, an increase in serum iron levels and transferrin
were reported when serum retinol levels were > 40ug/dL than when they were < 20ug/ dL.63
Hemoglobin increases in response to improved vitamin A status in pre-school and primary
school children.63,64
Anemic school children in Tanzania were given on daily basis a placebo, vitamin A (1.5 mg RE),
iron (40mg), or iron plus vitamin A. An increase in hemoglobin was reported in the following
fashion; 3.6g/L, 13g/L, 17.5g/L, and 22.1g/L in the placebo; vitamin A (1.5 mg RE); iron (40mg),
and the iron plus vitamin A groups respectively.64 Anemic and vitamin A deficient pregnant

14
women in Indonesia received a placebo; vitamin A (2.4 mg RE/d), iron (60mg/d) or iron plus
vitamin A 60 mg iron/d, 2.4 mg RE/d.65 Biochemical measures after 8 weeks showed that 16%,
35%, 68% and 97% of pregnant women respectively were no longer anemic. The suggestion is
that dual fortification or supplementation with iron and vitamin A is more effective in
controlling iron or vitamin A deficiency, compared to individual micronutrient fortification or
supplementation.29
Vitamin A status affects anemia in many ways66as follows: vitamin A deficiency results in
decreased resistance to infection, therefore, it gives rise to anemia of infection. Vitamin A
affects iron absorption and/or metabolism, and it is directly involved in the modulation of
erythropoiesis. Given the high incidence of infectious diseases in developing countries, vitamin
A deficiency may aggravate infection, thereby perpetuating anemia of infection.67
Riboflavin
Low intakes of meat and dairy products increase the risk of riboflavin deficiency. In both
developing and developed countries, school children are highly vulnerable to riboflavin
deficiency68 which may affect erythropoiesis thus contributing to the aetiology of anemia (Hb <
11g/dL).69,70 The mechanism by which this impairment occurs is through reduced mobility of
stored iron,71,72 diminished iron absorption and increased iron losses.73,74
A more effective way of improving iron status in adult males and children is to give riboflavin
and iron supplements together.75,76 Three trials carried out with children as well as pregnant
women compared the efficacy of iron supplementation given alone to iron supplementation
together with riboflavin. It was found that dual supplementation enhanced hemoglobin
production. However, the folic acid given with iron may have compromised the accuracy of the
results obtained with the former.77,78 In another trial, riboflavin and iron supplementation
produced no better results than iron supplementation alone.79 Likewise, a trial with Croatian
children showed no added benefit of riboflavin supplementation in school children with
adequate hemoglobin levels.80 The results of these studies suggest that the effect of riboflavin
on hemoglobin status varies and can be affected by a number of factors.29

15
Zinc
Factors that affect iron bioavailability, such as low meat, high phytate and polyphenol intake,
are the same as those affecting zinc absorption.81 Although the data do not suggest that zinc
deficiency plays a role in anemia, iron and zinc deficiencies often coexist and supplements
containing these elements may therefore prove helpful in vulnerable populations.29 However,
numerous studies have reported reduced iron efficacy when zinc and iron are taken
concurrently, possibly due to impairment of iron absorption. An increased intake of non-heme
lowers the biovailability of zinc.82,83 On the contrary, a high dietary zinc to iron ratio can inhibit
iron absorption.104,105 This effect was demonstrated in a study where adults received
micronutrients in water solution,104,05but not when micronutrients were added as dietary
supplements for infant formulations or maize meal preparations.83,85,86 The exact nature of the
mechanism involved in this instance is not clear, but it is likely to be due to competition for
uptake in the eneterocyte. Both iron and zinc ions depend on DMT1 for transportation.32 It is
therefore possible that high zinc concentrations lower iron uptake by the intestines even
though this effect has not been demonstrated in mammalian systems.29
In a randomised controlled supplementation trial in Vietnam, infants were given a daily dosage
respectively alternated as (placebo, 10 mg iron, 10mg zinc or 10mg iron plus 10mg zinc). It was
reported that the zinc and iron supplements were as effective as the iron supplementation
alone in combating iron deficiency and anemia.87 Similar effects were reported in a study
carried out in Mexican children.88,89 Contrasting results were reported in an Indonesian study
conducted with children who received a similar dose for the same amount of time as the
Vietnamese children.87 In the Indonesian study, iron supplementation alone had a better effect
on iron status than combined iron and zinc supplementation, which suggests that the efficacy
of iron absorption is reduced when zinc and iron supplementation coincide.90 The difference in
results of these two studies is attributable in principle to the baseline iron status of the
Vietnamese children,85 who had severe anemia compared to their Indonesian counterparts.90
According to a review by Fischer Walker et al. 2005,91 iron status is not affected when zinc
supplements are given alone. The same review also suggests, however, that iron status is not

16
improved beyond the effect of iron supplementation on its own when zinc and iron
supplements are given concurrently. More studies are therefore needed to investigate the
interaction between the two nutrients.
Folate and vitamin B12
Macrocytic anemia, a type of anemia where the red cells were found to be larger than normal
was discovered by the end of the nineteenth century. Poor intake of folate from the diet and
insufficient folate absorption and utilisation, contributes to suppression of bone marrow
proliferation as part of macrocytic anemia.92 Vitamin B12 deficiency can also contribute to
macrocytic anemia. This anemia is characterised by abnormal red cell precursors in the bone
marrow called megaloblasts. Iron deficiency anemia can occur concurrently with folate and
vitamin B12 deficiency anemia, which results in normocytic anemia. As a result, it may be
difficult to diagnose iron deficiency anemia.93
2.2.3 Diagnosis of iron deficiency and anemia
Iron deficiency can be diagnosed by using a number of indicators such as clinical indicators
where chronic fatigue is usually important. However, clinical indicators are usually not specific
symptoms.14 Dietary evaluation can also be done to assess how much haem and non haem iron
is taken in the diet. The dietary method might also be helpful but better diagnosis relies on
biochemical indicators, particularly for the early stages of deficiency.94
The three stages of iron deficiency are characterised respectively by depletion of iron stores,
followed by iron deficiency eryhropoiesis and iron deficiency, in that order. The first one
involves the depletion of iron stores, the second one is iron deficiency erythropoiesis, and the
third one is iron deficiency anemia. All these stages can be analysed biochemically (Table 2.1).94
Iron deficiency (usually defined as ferritin level < 12 ug/L) is the most prevalent nutritional
deficiency.15 Iron deficiency anemia occurs when there is severe iron deficiency that causes
reduced erythropoiesis, thus reducing the red blood count, which leads to anemia (Hb level <
11.5g/dL).95
It has been agreed that iron status is best determined with the aid of measurements of
hemoglobin, ferritin, soluble transferrin receptor (sTfR), as well as chronic infections serving as

17
indices. However, this procedure is usually expensive and difficult.94 Hemoglobin therefore has
been successfully used in situations where there were financial constraints and field work in
remote areas.96
Table 2.1: Influence of iron status on various indicators in absence of other diseases94
Hb Ferritin (ug/L) STfR
Iron overload Above cut off > 300 Low
Normal Above cut off 100+/-60 Normal
Depleted iron status Above cut off <20 Normal
Iron deficient
erythropoiesis
Above cut off <12 High
Iron deficiency
anemia
Below cut off <10 High
2.2.3.1 Iron status indicators
A number of factors can affect an individual’s iron status, including limited food choice due to
poverty, micronutrient deficiencies, or interaction between nutrients and helminth
infestation.131 Parasitic infestation can affect iron status due to loss of blood, reduced appetite
and lowered rate of absorption.132
A national food consumption survey conducted in 1999 showed that for South African children
as a whole, the intake of calcium, iron, zinc, selenium, vitamin A, D, C and E, riboflavin, niacin,
vitamin B6 and folic acid were below two-thirds of the Recommended Dietary Allowance.
109Children living in urban areas, however, had a significantly higher iron intake (p < 0.05 –
0.001) than those living in rural areas.109 A more recent food consumption survey found that
the prevalence of poor iron and vitamin A status in children in the country appears to have
increased compared with previous national data. In addition, 45.3% of children nationally were
found to have an inadequate zinc status and to be at risk of zinc deficiency.133
A study by Keskin et al. (2005) showed that the prevalence of iron deficiency was relatively
high among school boys of low socio-economic status (SES). Higher tea intake and lower intake
of citrus fruits, red meat and fish among the low SES group, were cited as the major reason for

18
the results obtained in the study.134Biochemical indicators that can be used as indicators for
iron status, include hemoglobin, ferritin and sTfR. Other parameters include, hematocrIt, iron
saturation of plasma transferrin, and zinc protoporphyrin (ZnPP).94
Hemoglobin (Hb)
Anemia can be diagnosed by administering Hb tests. This is an inexpensive and common
measurement. However, hemoglobin concentration, can be affected by a variety of conditions
and diseases, and in any case only becomes noticeable in the third stage of iron deficiency. It
may therefore be necessary to use very specific and sensitive indices to determine whether iron
deficiency is the specific cause of anemia.94 However, hemoglobin measurement alone can be
used to assess prevalence and etiology of anemia when it is not feasible to use multiple
biochemical tests for iron status due to cost or other operational limitations.96 Anemia is graded
variously as mild, moderate or severe anemia (Table 2.2).97
Table 2.2: Stages of anemia and values used in demographic and health surveys 97
Anemia measured by hemoglobin (g/dL)
Anemia Mild Moderate Severe
Children 6-59 months
<11.0 10-10.9 7.0-9.9 <7.0
Children 5-11 years
<11.5 10-11.4 7.0-9.9 <7.0
Children 12-14 years
<12.0 10-11.9 7.0-9.9 <7.0
Non-pregnant women above 15 years
<12.0 10-11.9 7.0-9.9 <7.0
Men (above 15 years)
<13.0 12-12.9 9.0-11.9 < 9.0
Note: Hemoglobin values change with altitude.
Hemoglobin levels depend on factors such as age, sex, biological variation, race, pregnancy,
altitude (Table2.3), iron deficiency anemia, other micronutrient deficiencies, parasitic infection,
certain disease state as well as cigarette smoking.18 Table 2.4 illustrates the adjustments that
need to be made to Hb cutoffs for altitude and ethnicity.18

19
Table 2.3: Cut-off values for anemia at sea level and above sea level using hemoglobin
concentration 98,99
Target Age Hb at sea level (g/dL)
Hb above sea level > 1.500m (g/dL)
Hb above sea level > 2.700m (g/dL)
Infants a 6 -11 months < 11.0 < 12.0 < 13.0 Children 1 – 4 years < 11.0 < 12.0 < 13.0
School age 5 – 11 year < 11.5 < 12.5 < 13.5 School age 12 – 13 years < 12.0 < 13.0 < 14.0 Pregnant women < 11.0 < 13.0 < 14.0 Non pregnant women
< 12.0 < 12.0 < 13.0
Men < 13.0 < 14.0 <1 5.0
Iron deficiency is rare among infants of an age below six months, unless the birth weight is low.
Hemoglobin is best determined using venous blood anticoagulated with EDTA. Blood from the
heel, ear or finger pricks collected in heparinised capillary tubes can be used as an
alternative.100 A cyanmethemoglobin method is most reliable, provided the blood specimens
are correctly diluted. This method is also recommended by the International Committee for
Standardization in Hematology (ICSH).101
Table 2.4: Adjustments to hemoglobin cutoffs and individual values for altitude and ethnicity18
Adjustment to hemoglobin cut-off value (g/dL)
Altitude (m) > 1250, < 1750 +0.5
Ethnicity: African extraction -1.0
The method involves converting all the encountered form of hemoglobin into
cyanmethemoglobin, which is then analysed with a spectrophotometer.101 Hemoglobin levels
can also be determined from field-collected blood spots.102Alternatively a portable hemoglobin
photometer can be used in remote field settings. The HemoCue is a battery-operated device
that uses a dry reagent (sodium azide) in a microcuvette for direct blood collection and
measurement. The accuracy and precision of hemoglobin values based on the HemoCue are
20
comparable to those obtained by following standardised cyanmethemoglobin-based
procedures and methods.103
Ferritin
Ferritin is currently the most useful indicator of iron status. It is the most sensitive parameter in
detecting the first stage of iron deficiency. Plasma content correlates well with iron stores,
hence a lowered, ferritin concentration may indicate depletion of iron stores. However, ferritin
can also be increased by other factors such as infection and inflammation, which means high
ferritin level may not always be an indication that the iron status is within acceptable limits. To
minimize this problem, therefore, chronic and acute infection parameters must also be
measured to determine whether a raised ferritin level is attributable to infection.94 C-reactive
protein (CRP) is currently used to detect the presence of acute infection, while alpha-1
glycoprotein (AGP) is used for chronic infections. A ferritin value below 10ug/L shows definite
iron deficiency despite unclear cutoff values. Another indicator such as sTfR may be used as it is
not likely to be influenced by infection.94
Soluble transferrin receptor
Iron status can be reliably determined with the aid of sTfR where infection is a factor. Iron
requirement has an effect on the release of sTfR from the cells into the blood stream. In the
second stage of iron deficiency sTfR concentration is increased if the Hb concentration remains
above cutoff level after the iron stores are exhausted. Therefore, sTfR is less sensitive than
ferritin but more sensitive than Hb.94 Bone marrow staining is by far the gold standard in
defining iron deficiency.94
Other iron status indicators
(i) HematocrIt: This parameter usually correlates with hemoglobin, but is relatively insensitive
compared to Hb. It is therefore, not a good diagnostic nutritional anemia indicator94
(ii) Iron saturation of plasma transferrin (ratio of plasma iron to total iron binding capacity) and
mean corpuscular volume (MCV): These two indicators are well established and inexpensive to
measure when hematology analysers are available. Iron deficiency is marked by low saturation
of transferrin with iron and decreased size of erythrocytes. Specificity of these indicators is low,
due to the large number of clinical disorders that may affect transferrin saturation.104 Plasma

21
has a diurnal variation and MVC can therefore only indicate the late stage of iron deficiency. It
may be difficult to take these measurements accurately without analysers, as measurements
may be difficult and likely to have errors.96 Ferritin or sTfR are important alternatives in such
situations.94
(iii) Zinc protoporphyrin (ZnPP)
Iron in protoporphyrin is replaced by zinc in cases of iron deficiency and can be measured with
the aid of haematoflourometry,96at the second stage of iron deficiency before Hb levels decline
below cutoff, thus making ZnPP a more sensitive indicator than Hb. However, note that ZnPP
can be influenced (increased) by lead levels.104
2.2.4 Consequences of anemia
As noted, the final stage of iron deficiency is iron deficiency anemia, which is characterised by
low hemoglobin levels105and has been reliably found to retard physical development,
undermine the immune function, inhibit growth and advance onset of fatigue. Cognitive
function and school achievement can also be affected by iron deficiency anemia.106According to
the World Health Organization (WHO), 8000 000 deaths each year are attributable to iron
deficiency anemia. With regard to loss of healthy life, iron deficiency anemia accounts for 25
million disability-adjusted life years.107
2.2.4.1 Effect of on anthropometry
In reality, the double burden of disease has become more severe with the increased prevalence
of micronutrient deficiencies (vitamin A and iron) together with high levels of overweight and
obesity.24 Adding micronutrients to children’s supplementary feeds and fortification of food
have frequently proved to alleviate micronutrient deficiencies and thus helpful in improving the
population’s well being.109 A study conducted in India showed an increase in the mean height-
for-age z-score (HAZ) among school children after they had taken a multiple micronutrient
fortified drink for 14 months.110
According to a review of studies including infants, pre-school and school children, there is a
positive correlation between iron supplementation and linear growth of anemic children.111 In a

22
study by Chwang et al (1988),112an increase in height, weight, and arm circumference
(compared to a control group) was observed in anemic school children who were given iron
supplements for 12weeks. In a study on anthelmintic treatment and iron fortification
conducted with iron deficient primary school children in South Africa, the height-for-age and
weight-for-height z-scores of the subjects was found to have improved significantly.113
Conversely, however, in some studies conducted with iron-replete children it was found that
iron supplementation had proved counterproductive, while in others a similar group of subjects
had proved unaffected by supplementation.113,115 The inconsistency in the results of these
studies could be due to coinciding multiple deficiencies, variation in the duration of studies and
the iron dosages used, different age groups and different degrees of iron deficiency.116
2.2.4.2 Effect on immunity
In cases of infection occurring in the presence of iron deficiency with or without anemia,
normal resistance mechanisms including functioning of phagocytic, T- and B- cells, may be
compromised while the infection lasts, because large doses of iron given to such children may
aggravate the infection. This is because the infectious organism also gets supplied with the iron
resulting in its replication before the immune system of the host has had time to recover.118
Thus deficient as well as excessively high iron levels could compromise the immune function,
which suggests that an iron status within normal parameters should be sought that would
ensure a complete phagocytic and immune response to pathogens.118
Untargeted supplementation in tropical countries where malaria transmission is high, was
found to be associated with an increased risk of severe infection.119,120 Hence the WHO has
suggested (in light of the potential adverse effects of supplementation on malaria infected
individuals) that, iron and folic acid supplementation should be given to anemic children who
are at risk of iron deficiency, and that in such instances concurrent protection against malaria
(such as treated bed nets and anti-malarial drugs) and other infectious diseases should be in
place.

23
2.2.4.3 Effect on cognition and school performance
Results from several randomised trials have shown a causal relationship between iron
deficiency and deficient cognitive function, also suggesting that short-term iron
supplementation can reverse some aspects of impaired cognition. Children suffering from
anemia have demonstrated poor physical and cognitive development. Anemia results in severe
lethargy and low physical capacity for activity, which negatively affect the time spent by
children playing and exploring.122
A study carried out in Malawi demonstrated a significant increase in fluid intelligence in school
children supplemented with iron for 10 months.123 A study carried out in Thailand reported a
great difference between the scores obtained respectively by anemic iron-deficient and iron-
replete children in a Thai language test, as well as in a test gauging general reasoning ability.
The same difference was not evident in arithmetic scores obtained by the same group,
however.124 On the other hand differences between scores of Indonesian school children who
were iron deficient and iron-replete, respectively, were not markedly different for a number of
exams, as well as a test for concentration. However, scores across the board were improved for
the same exams as well as the concentration test as a result of iron supplementation.125
Amplified vulnerability to infections as a result of iron shortage in school children could lead to
lowered school attendance, which could therefore compromise performance.105 Fewer school
days were missed by children fed with biscuits fortified with multiple micronutrients than by a
control group because the intervention had caused a decline in respiratory and diarrhea related
illness.105 A review by Taras (2005) demonstrated an association between iron deficiency and
poor academic performance.126 However, academic performance (at school) improved as result
of iron supplementation administered to normalize depleted iron stores.126
2.2.5. Epidemiology of iron deficiency and anemia
Iron deficiency (ID) and iron deficiency anemia (IDA) are prevalent in women and young
children. More people in the world are affected by iron deficiency than any other type of
malnutrition.95 It is estimated that more than 2 billion people are affected by iron deficiency,

24
and 1.2 billion of these suffer from iron deficiency anemia.127 Anemia is most prevalent in
developing countries, thus 39% of children < 5 years old, 48% of children 5-14 years old, 42% of
all women and 52% of expectant women are suffering from anemia. About 50% of anemia is
due to iron deficiency.97 Estimates show that 53% or 210 million school age children suffer from
IDA.44,45 A recent South African national health and nutrition examination survey showed that,
provincially, the prevalence of iron depletion was the highest in women from Gauteng (11.2%)
and lowest in Eastern Cape women (0.7%).128 Prevalence among younger South African women
was higher (10.5%) than among older women (8.5%). Reports suggest that Asia has the highest
IDA prevalence (58.4%), followed by Africa (49.8%).129 Several studies have been done to try
and capture the IDA prevalence in school children.
A survey of nearly 14000 rural school children in Africa and Asia, showed that IDA prevalence
was more than 40% among children aged 7-11 years old in five African countries (Mali,
Tanzania, Mozambique, Ghana and Malawi).130 IDA prevalence in Asian children aged (7- 11
years) in Vietnam and Indonesia was low (12 and 28 % respectively). Prevalence was found to
be higher among the older than the younger group. Boys had a higher hemoglobin
concentration than girls. However, the IDA prevalence was higher in boys than in girls.130
Results could have been attributable to a higher incidence of parasitic infections among boys, a
higher growth rate (e.g. onset of a more pronounced “growth spurt” than among girls), or other
confounding factors. Certainly a variety of causes are possible.
2.3 STRATEGIES TO ADDRESS IRON DEFICIENCY AND ANEMIA
There are three main strategies for correcting iron deficiency in populations, and they can be
used alone or in combination.125These strategies are: education combined with dietary
modification or diversification, or both to improve iron intake and bioavailability; iron
supplementation and iron fortification of foods. A new approach is biofortification via plant
breeding or genetic engineering. Dietary modification and diversification are the most
sustainable approaches. However, it may be difficult to change dietary practices and
preferences. Moreover, good sources of highly bioavailable iron are expensive.125

25
2.3.1 Food fortification
Even though iron is the most difficult mineral to add in food and ensure adequate absorption,
iron fortification of foods is still the most practical, sustainable and cost-effective long-term
solution to combating iron deficiency.100,101,102 Fortification of staple foods is even more
important as a long-term strategy for addressing micronutrient deficiencies, including iron
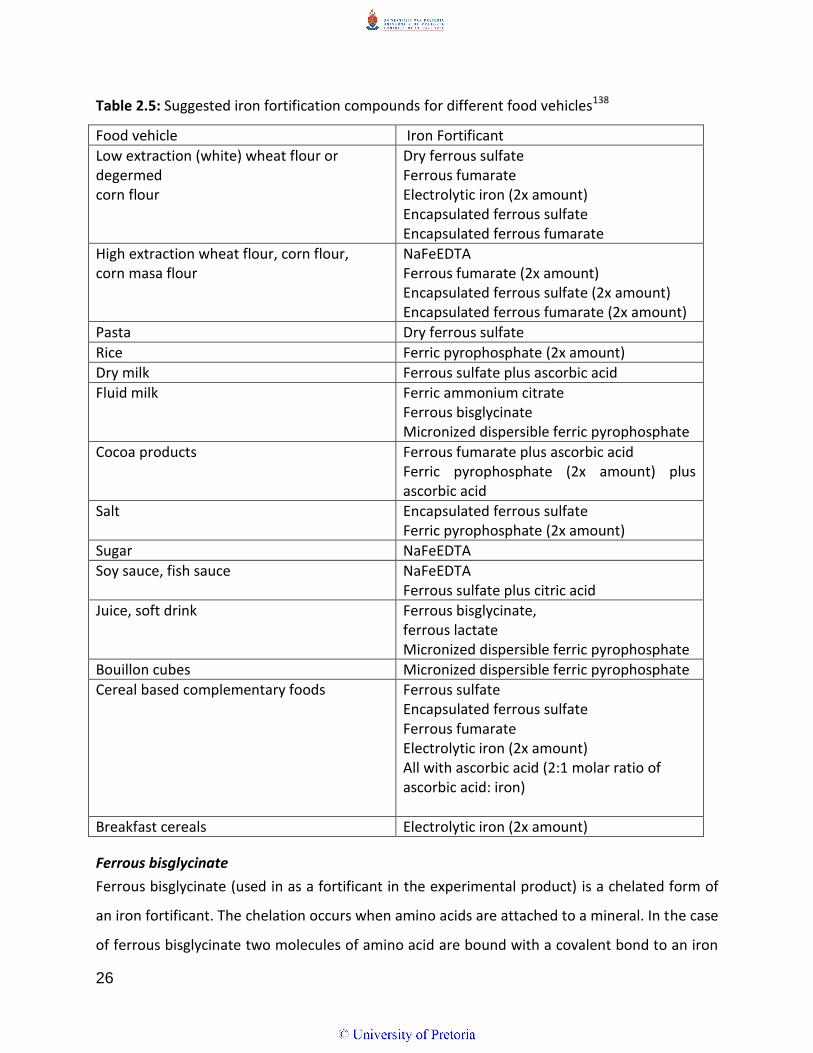
deficiency.43 Different foods can be used as vehicles for several iron fortificants (Table 2.5). In
South Africa the fortification of bread, flour and maize meal was legislated in 2003.108 Maize
and wheat flour are currently fortified to provide a person of 10 years or older with electrolytic
iron (25% from unsifted maize and 50% from maize meal) of the recommended dietary
allowance.108
The most bioavailable iron compounds often lead to the development of unacceptable sensory
changes, such as off flavours and colour change.103 Therefore less soluble forms of iron in low
doses are usually used to avoid organoleptic changes.29 Fortification may be the safest
intervention as low doses similar to the physiological environment are used.101,121 Analysis of
studies where infants received iron fortified foods showed no adverse effects and
demonstrated a significant protection effect against development of respiratory tract
infections.119
Most staple foods contain some iron, however, the quantities differ with the different
cultivars.135 This suggests that selective breeding (biofortification) might increase the iron
content of staple foods.29 But then the high phytate content of most staple foods could still
pose a challenge when it comes to bioavailability. Therefore breeding should also be aimed at
producing cultivars low in iron absorption inhibitors.29 A study in which the aim was to lower
the phytic acid content of rice was done by Lucca et al. (2001), it involved introducing phytase
from Aspergillus fumigates.136 The results indicated a seven fold increase in phytase activity.136
Some studies showed that iron uptake from the soil could be increased by introducing a ferric
reductase gene into the plant root systems.137 Breeding or genetic engineering can be useful in
increasing iron content in staple foods.29
26
Table 2.5: Suggested iron fortification compounds for different food vehicles138
Food vehicle Iron Fortificant
Low extraction (white) wheat flour or degermed corn flour
Dry ferrous sulfate Ferrous fumarate Electrolytic iron (2x amount) Encapsulated ferrous sulfate Encapsulated ferrous fumarate
High extraction wheat flour, corn flour, corn masa flour
NaFeEDTA Ferrous fumarate (2x amount) Encapsulated ferrous sulfate (2x amount) Encapsulated ferrous fumarate (2x amount)
Pasta Dry ferrous sulfate
Rice Ferric pyrophosphate (2x amount)
Dry milk Ferrous sulfate plus ascorbic acid
Fluid milk Ferric ammonium citrate Ferrous bisglycinate Micronized dispersible ferric pyrophosphate
Cocoa products Ferrous fumarate plus ascorbic acid Ferric pyrophosphate (2x amount) plus ascorbic acid
Salt Encapsulated ferrous sulfate Ferric pyrophosphate (2x amount)
Sugar NaFeEDTA
Soy sauce, fish sauce NaFeEDTA Ferrous sulfate plus citric acid
Juice, soft drink Ferrous bisglycinate, ferrous lactate Micronized dispersible ferric pyrophosphate
Bouillon cubes Micronized dispersible ferric pyrophosphate
Cereal based complementary foods Ferrous sulfate Encapsulated ferrous sulfate Ferrous fumarate Electrolytic iron (2x amount) All with ascorbic acid (2:1 molar ratio of ascorbic acid: iron)
Breakfast cereals Electrolytic iron (2x amount)
Ferrous bisglycinate
Ferrous bisglycinate (used in as a fortificant in the experimental product) is a chelated form of
an iron fortificant. The chelation occurs when amino acids are attached to a mineral. In the case
of ferrous bisglycinate two molecules of amino acid are bound with a covalent bond to an iron

27
molecule. Absorption of this type of iron in the small intestine is similar to that of amino acids:
no irritation or constipation or any other side effects are experienced as with other forms of
iron supplementations. In addition, the mechanism by which this type of iron is absorbed seems
to be determined by blood hemoglobin levels. This is important in preventing toxic levels of
iron in the body.19 Furthermore, it has been reported that losses of vitamins in multivitamin
mixtures caused by amino acid chelates are lower than those caused by ferrous sulphate.139
Ferrous bisglycinate is usually recommended for liquid milk and other beverages: it is classified
under the rubric Generally Recognized as Safe (GRAS).140
The relative bioavailability of iron compounds is articulated by comparing their bioavailability
with ferrous sulphate (relative bioavailability of ferrous sulphate = 100%). Compared to ferrous
sulphate, iron from ferrous bisglycinate chelate (Ferrochel®) has been found to have a 3.4 – 4
times higher relative absorption rate in infants with iron-deficiency anemia,141 iron-sufficient
men142 and anemic adolescents.143 A study by Layrisse et al. (2000),144showed that even in the
presence of iron absorption inhibitors (phytates and polyphenols), the relative bioavailability of
iron from Ferrochel® in non-anemic adults is twice as high as that achieved with ferrous
sulphate. Despite contradictory reports concerning ferrous bisglycinate efficacy145,146 in the
prevention and control of iron deficiency and iron deficiency anemia it has been proved
conclusively in several supplementation trials with infants, preschool children and adolescents
that ferrous bisglycinate can improve the iron status of children.15,143,144
Ferrous bisglycinate appears to be a good fortificant because of its high bioavailabilty and
relatively low reactivity, particularly in milk products.139 Its efficacy in fortified liquid milk,
sweetened bread rolls and whey-based beverage was reported satisfactory in three studies
carried out in Brazil,147,148,149 and also in an iron fortified milk drink trial in Saudi Arabia.150A
South African study on the efficacy of bread made from high-extraction flour fortified with
ferrous bisglycinate, reported a small but significant increase in both hemoglobin and ferritin in
school children.151

28
2.3.2 Education combined with dietary diversification
Dietary diversification which involves nutrition education is a long term strategy for controlling
any micronutrient deficiency. Nutrition education helps to create awareness which has to be
converted into action.105 International strategies customized to South African context such as
Food based dietary guidelines (FBDGs) are part of the nutrition education strategy.24 Dietary
diversification aiming at improving iron status should focus on increasing bioavailability of iron
in the diet through high intakes of enhancers and reduced intake of inhibitors.105However, in
light of challenges that might confront prospective behavior change the purpose in view may be
equally served by employing other strategies such as fortification and supplementation besides
food diversification.105
2.3.3 Supplementation
According to the ADA Report (2005), a supplement is a product (excluding tobacco) intended to
complement the diet that contains a few, or most, or a combination, of the following the
dietary ingredients: a vitamin or mineral; a herb or other botanical; an amino acid; a dietary
substance for human use to supplement the diet by increasing the total dietary intake; or a
concentrate metabolite, constituent or extract.152 It can also be described as a product to be
taken orally in a tablet, gel cap, or liquid form; and as a product that is not meant for use as a
conventional food or a sole item of a meal forming part of a dietary regimen.152
Supplementation should therefore proceed with due consideration of the fact that a healthy
diet should comprise a balanced diversity of foods.152 By the same token, however, it should be
noted that the view commonly held within the ambit of nutritional science to the effect that a
balanced diet can meet all nutritional requirements has been challenged.
For example the Nutrition United Nations Sub Committee on Nutrition has declared that dietary
sources alone cannot provide 100% RDA of micronutrients.153 It is justified to aver, therefore,
that nutritional supplements can play a crucial role in improving physical growth, mental
development, and the prevention of common infections.26
Supplementation can be cost-effective when given to targeted high-risk groups.100Quality

29
control during manufacture and correct dosing are important. Overages are usually included in
the formulation of vitamin supplements during manufacture, to ensure that a certain dosage is
still available by the end of the shelf life. A high- dose Vitamin A supplementation programme in
South Africa is being followed since 2001.24Supplementation seeks to control existing
imbalances which may have pathogenic consequences, such as severe iron deficiency. The
purpose of iron therapy is to increase hemoglobin values. Restoration of iron stores may take
about 4 months because of the lifespan of the red blood cells, which is approximately 120
days.14
2.3.3.1 Iron supplementation
Women of reproductive age and young children have been the main focus for IDA reduction
programmes. However, the recent increase in studies reporting on IDA in school- children has
resulted in a programmatic response for the relevant age group.20 A summary of studies on the
effect of iron supplementation on the iron status of school children is given in Table 2.6. Iron
supplementation has been found to have a positive effect on the Hb concentration in treatment
groups, with more significant changes observed in subjects who were anemic at baseline. This
indicates that iron-replete groups were unable to absorb much iron. Deworming of subjects at
the start of the interventions boosted Hb concentration even in the placebo group, which
explains the importance of eradicating parasitic worms in order to improve iron status.154

30
Table2.6: Overview of iron supplementation trials on iron status of school age children.
Reference Country Initial sample size
Type of study Age group Baseline Hb concentration (g/dL)
Duration/supplement Hb outcome (g/dL)
Seomantri (1989)
155
Indonesia 130 ANPL:24 NAPL:35 ANFe:34 NAFe:37
Double blind randomised clinical trial
8.1 – 11.6 yrs ANPL:9.6 NAPL:13.2 ANFe:9.7 NAFe:13.3
3 mo Iron sulphate 10 mg.kg
.1.d
.1
After treat. 3mo.later ANPL:9.5 ANPL 9.6 NAPL:13.3 NAPL 13.4 ANFe13.0 Ante 13.0 NAFe:13.6 NAFe 13.8 Treatment effect observed in anemic but not non anemic children. Not indication whether outcome was significant or not.
Sungthon et al.(2004)
156
Thailand (397) Daily;140 Weekly; 134 Placebo;123
Double blind, randomised placebo controlled trial
Grade 1 to 6 Daily;12.1 Weekly; 12.2 Placebo;12.1
16 wks Ferrous sulphate 30.0mg
Daily;12.8 Weekly; 12.7 Placebo;12.5 A positive treatment effect was observed
Rochnick et al.(2004)
157
Phillipines 1510 Interv: 708 Con: 802
Randomised controlled trial
7 – 12 yrs Intervention:12.4 Control:12.6
17 wk Ferrous sulphate 32.5mg
Intervention:12.4 Control:12.2 Hb concentration of children in intervention group did not change significantly. Hb for untreated group fell.
Hb: hemoglobin; ;ANPL:anemic placebo treated group ; NAPL:non anemic placebo treated group; ANFe:anemic iron supplementation treated group ; NAFe:non anemic iron supplementation treated group.

31
Best absorption of iron supplements is achieved on an empty stomach. However,
gastrointestinal side effects such as nausea, epigastric discomfort and distention, heartburn,
diarrhea or constipation may reduce tolerance and compliance. Oral iron supplements such as
ferrous iron salts (ferrous sulphate and gluconate) are usually preferred because of their low
cost and high bioavailability. Other supplements include: amino acid chelated ferrous
bisglycinate, synthetic chelated NAFerredetate, and EDTA (ethylenediaminetetraacetic acid).
However, the efficacy of ferrous bisglycinate has proved superior to that of its rivals and less
prone to produce undesirable side effects.19
The studies show that iron supplementation on its own has a positive effect on the iron status
of school age children. Significant changes were particularly noticeable in anemic children.
2.3.3.2 Multiple micronutrient supplementation or fortification
Micronutrient deficiencies have been observed to overlap and occur simultaneously in the
same group of people.20 Provision of multiple micronutrient supplementation or fortified foods
to the affected or vulnerable groups may therefore be cost-effective in addressing nutrient
deficiencies.20
A summary of studies on the effect of micronutrient supplementation on the iron status of
school children is provided in Tables 2.7 and 2.8. The latter gives detailed information on the
nutritional content of the supplements used in the studies summarised in Table 2.7. The
intervention/treatment groups involved in these randomised controlled trials were given foods,
beverages, seasoning, biscuits, bread or tablets enriched with multiple micronutrients, whereas
the controls received placebo and/or iron supplements alone. The treatment groups showed an
increase in Hb concentration at varying quantities. The conclusion favouring iron
supplementation alone in some instances, especially in virtue of apparent lack of increase in Hb
after the multiple micronutrient intervention, was most probably drawn as a result of
measurement error.160 It is also important to note the possible effect due to the variability in
the duration of the intervention studies, some had a duration as short as 8 wks158 while some
went on for as long as 8 to 12months161,163,65,166.

32
A systematic review of randomized studies on the placebo effect on Hb response, compared to
that of combining multiple micronutrient with iron supplementation, showed a significant
increase in Hb concentration in children’s weight mean difference (WMD) = 0.65 g/dL, 95% CI
0.50, 0.80, P < 0.001). An initial greater rise was seen in anemic children and in children in the
lower ranges of height-for-age z-scores.159
A pooled analysis of studies comparing combined Fe and micronutrient supplementation with
Fe supplementation alone showed that the addition of multiple micronutrients to Fe resulted
in a small but significant increase in Hb (WMD = 0.14 g/dL, 95% CI 0.00, 0.28, P = 0.04) over Fe
supplementation alone.159 According to expectation, therefore, synthesized evidence alone
shows that instead of impairing the Hb response to iron supplementation children, a judicious
addition of multiple micronutrients may have marginal benefits compared to iron
supplementation alone.159 However, given the mixed results of previous studies, interaction
may be more likely with high dosages of micronutrient supplementation and shifting from a
single to multiple micronutrient supplementation may therefore still have to overcome
challenges such as deficient programme efficacy.159
A food based strategy involving enriched food products, for example, nevertheless remains a
promising nutritional intervention. However, more evidence on the efficacy and effectiveness
of this type of intervention is needed for policy and programme planners to have it
implemented.62

33
Table 2.7: Overview of multiple micronutrient supplementation/ fortification trials on mean Hb concentration in school age children
Hb : Haemoglobin , Praziquantel (P) , Praziquantel + Iron (P+Fe) , Praziquantel+multiple micronutrient supplementation(P+MM) , Praziquantel +iron +multiple micronutrient supplementation (P+Fe+MM), Iodized salt(IS), Triple fortified salt(TFS).
Reference
Country Sample size Type of study Age group Baseline Hb concentration (g/dL)
Duration Intervention Hb outcome (g/dL)and comments
Ayoya et al (2009). 162
Mali
847
Randomised controlled trial
7 – 12 yrs
10.37 (P) 11.42 (P+Fe) 10.57 (P+MM) 10.59 (P+Fe+MM)
12wk
Praziquantel (P) Praziquantel + Iron (P+Fe) Praziquantel+multiple micronutrient supplementation(P+MM) Praziquantel +iron +multiple micronutrient supplementation (P+Fe+MM)
11.54(P+Fe) 10.81 (P) 11.28(P+MM) 11.35 (P+Fe+MM) Possible explanation for low effects of MM on Hb, could be negative interactions among nutrients that interfered with the use of iron or other erythropoietin nutrients
Zimmerman et al. (2004) 58
Morocco
157 goitrous school children with vitamin A and iron deficiency
Randomsed double blind trial
10-13yrs
Iodized salt(IS): 11.6 Triple fortified salt(TFS): 11.4
10 mo
Triple fortified salt
I S: 11.5 TFS: 12.9 Triple fortification of salt effective in increasing hemoglobin levels, possibly because most of the children were taking three main meals plus to snacks per day, all of which had some salt. Thus iron absorption was enhanced by repeated delivery of small doses throughout the day.
vanStuivernberg et al. (2006)151
South Africa
160
Randomised controlled trial
6-11yrs school children
Control:12.7 Electrolytic iron:12.6 Ferrous bisglycinate:12.7
7.5 months
Fortified bread
Control:12.8 Electrolytic iron:12.7 Ferrous bisglycinate:12.9

34
Table 2.7:(cont.) Overview of multiple micronutrient supplementation/ fortification trials on mean Hb concentration in school age children
Reference Country Sample size Type of study Age group Baseline Hb concentration
(g/dL) Duration Intervention Hb outcome
(g/dL)and comments
Osei et al. (2010)163
India
499
Randomised control trial
1-8 yrs
Micronutrient premix fortified: 12.2 Non fortified: 12.17
8 mo
Micronutrient premix added in lunch meals Nonfortified lunch meals
Micronutrient premix fortified: 12.32 Nonfortified: 12.25 Slight increase in Hb of boh groups
Jinabhai et al. (2001) 164
South Africa
579
Double blind randomised placebo controlled trial
8 – 10 yrs
Vit A +iron grp;12.8. Vit A group;12.7. Non fortified group;12.8
16 wks
Fortified biscuit
Vit A +iron grp;12.9. Vit A group;12.8. Non fortified group; 12.9. No treatment effect, may have been due to low prevalence of anemia at baseline.
vanStuijvernberg et al. (1999) 167
South Africa
Experimental; 115 Control;113
Randomized controlled trial
6 -11 yrs
Intervention grp; 12.5 Control grp;12.6
3 wks over a 12 mo period
Fortified biscuit and cold drink
Intervention grp; 6 mo; 12.4 12 mo; 12.9 Control grp; 6 mo; 12.4 and 12 mo; 12.7
Hb: hemoglobin, Vit A: Vitamin A, mo: month, grp: group

35
Table 2.7 (cont.) Overview of multiple micronutrient supplementation/ fortification trials on mean Hb concentration in school age children
Reference
Country Sample size Type of study Age group Baseline Hb Conc (g/dL)
Duration Intervention Hb outcome (g/dL)and comments
Abrams (2003) 158
Botswana
311 Exp:164 Con:147
Non random clinical trial
6 -11yrs
Exp: 12.9 Con: 12.9
8wk
Fruit flavoured fortified beverage
Exp: 12.6 Con: 12.2 Changes in Hb significantly different between experimental and control group. Reduction in Hb level may have been due to change in measuring equipment
Taljaarrd et al.(2013)168
South Africa
CNS;103 CS;104 MNNS;103 MNS;104
Randomised double - blind, controlled intervention
6 -11yrs
CNS; 12.7 CS;12.7 MNNS;12.5 MNS;12.7
8.5 mo
A beverage with and without micrnutrients
CNS; 12.7 CS;12.7 MNNS;12.9 MNS;13.0
Ash et al. (2003)132
Tanzania
841
Randomized double blind placebo controlled
6 -11 yrs
11.9 (MM fort. bev) 11.9 (non fort bev)
6 mo
Multiple micronutrient fortified beverage
11.6 (MM fort. bev) 11.2 (non fort bev) Hb decrease in both groups due to seasonal influence on dietary quality and morbidity pattern with regards to malaria.
Hb: hemoglobin, Ex: experimental group; Con : control proup; CNS : no micronutrients (control beverage) with non nutritive sweetener , CS : no micronutrients(control beverage) with sugar, MNNS : micronutrients with a non nutritive sweetener, MNS: micronutrients with sugar, mo: months, MM fort bev: multiple micronutrient fortified beverage, non fort bev: non fortified beverage.

36
Table2.8: Nutritional content of the supplements /fortified foods used in the multiple micronutrient studies Nutrients 158 132 162 58 163 164 167 168 151
Vitamin: A (ug) (RE)
B carotene 2400
Retinyl palmitate 1750 IU
Vitamin acetate 1030
60 30 350 B carotene 2.0
257.2
Thiamin(mg
1.5 0.25 0.28
Riboflavin (mg)
0.4 0.6 1.7 0.26
Niacin (mg)
2.7 20 3.41
Pyridoxine (mg)
0.5 0.7 400 0.38
Folic acid (ug) 14 0.14 10 1: 0.1 2: 0.2
206
B12 (ug)
3
Biotin (ug)
30
Ascorbic acid (mg)
60 72 120 110
Pantothenat 10 Cynocobalamin (ug)
1.0
Tocopherol (mg)
7.5 10.5 23
Calcium (mg)
250
Iron (mg)
Ferrous bisglycinate chelate 7.0
Ferrochel 5.4 Ferrous fumerate 18
Fe PP 2 Ferrous sulphate 3mg of elemental iron.kg body weight.1.d.1
FeEDTA 5 Fe fumerate 5.9 1.EleFe 20 2.eleFe 40 3. Fe sul30 4.eleFe 60
Elect: 5.04 Ferro bisgly:5.04 Contr;±1.8
Magnesium (mg)
100

37
Nutrients 158 132 162 58 163 164 167 168 151
Iodine (ug)
60 45 150 95.4
Phosphorus (mg)
77
Zinc (mg)
3.75 5.25 15 2.5 2.16
Selenium (ug)
25
Potassium (mg)
40
Molybdenum (ug)
25
Boron (mg)
150
Chloride (mg)
36
Nickel (ug)
5
Copper (mg)
2
Chromium (mg)
120

38
2.4. LITERATURE REVIEW SUMMARY
Anemia is most prevalent in developing countries (i.e. 39% of children aged < 5years, 48% of
children aged 5-14 years, 42% of all women and 52% of expectant women). Iron deficiency
accounts for about 50% of anemia.97Iron deficiency anemia is the final stage of iron deficiency
and is characterised by low hemoglobin levels.105 Factors that may contribute to the
development of iron deficiency include low intake and poor absorption of iron from the diet
due to the presence of iron absorption inhibitors or lack of absorption enhancers; and a greatly
heightened physiological need for iron during menstruation, pregnancy and growth.37,38 It is
common cause that measurement of hemoglobin, ferritin and sTfR in conjunction with chronic
infections as further indices, produces the best results when assessing iron status. However,
this procedure is usually expensive and difficult.94 Hemoglobin measurement has therefore
been successfully substituted as an alternative method in situations challenged by financial
constraints and in remote field works.96
There is good evidence that Iron deficiency anemia can cause retarded physical development,
low cognitive function, weak immune function, growth decline, and accelerated fatigue.106
Micronutrient deficiencies have been observed to overlap and occur simultaneously in the
same group of people.20 Provision of multiple micronutrient supplementation or fortified foods
to the affected or vulnerable groups may therefore be cost effective in addressing nutrient
deficiencies.20

39
CHAPTER 3: METHODOLOGY
3.1 ETHICAL CONSIDERATIONS
Ethical approval to undertake this study was granted by the Research Ethics Committee of the
Faculty of Health Sciences (University of Pretoria) (Addendum 1). Permission to conduct the
study was given by the Gauteng Department of Education and the Sunnyside Primary School.
Informed consent was also sought and granted by the parents or legal guardians of the
learners. All aspects of the protocol were explained to the learners in their classrooms. Learners
with moderate to severe anemia (Hb < 9.5) were not included in the study were referred for
treatment.
3.2 RESEARCH DESIGN
An experimental study design in the quantitative domain was used. The study was a
randomised double blind placebo controlled trial (Figure3).
3.3 STUDY SETTING
Sunnyside Primary School in Sunnyside, Pretoria, situated within the municipal confines of
Tshwane Metro Council (Gauteng Province, South Africa).
3.4 STUDY POPULATION
The study population consisted of male and female learners aged 8 – 12 years enrolled for
Grades 3 and 4 the academic year 2010.
3.4.1. Recruitment and screening
Parents or guardians of learners enrolled for Grade 3 and 4 at Sunnyside Primary School were
informed during a scheduled general parents meeting about the study and its purpose, and
were given an opportunity to ask questions. Children whose parents/guardians had signed
consent forms for participation in the study were eligible for participation in the study and had
to sign assent forms (Addendum 2). Screening was done and children who met the inclusion
criteria were enrolled in the study.

40
Figure 3. Trial profile of the 14 weeks intervention study.
Inclusion criteria
_ Boys and girls in Grades 3 and 4
_ English literate
_ Children with normal iron status (Hb > 11 g/dL) and mild anemia (Hb > 9.5 g/dL)
Group B - Experimental n= 73
Group A - Control n= 71
Completed the study n= 73
Completed study n= 64
Dropouts n =7 Reason: Instructed by parents
All eligible learners Grade 3&4 (8-12yrs)
Deworming
Randomised according to grade, class gender and Hb
Dropout n = 0
Iron status n =144

41
Exclusion criteria:
_Children with moderate to severe anemia (Hb<9.5 g/dL )
3.5 SAMPLING METHOD
A convenient purposive sampling method was used for this research study. A primary school
with a need for school feeding and with an existing school feeding program in place was
chosen. Convenient sampling was used for logistical ease.
3.5.1 Sample size
Sample size was calculated based on the comparison of the two groups with respect to their
change in Hb following 14 weeks of intervention treatment. This was done with either
micronutrient enriched or none micronutrient enriched maize based liquid meal supplement. A
difference in change from baseline of 0.8 g/dL between the groups was regarded as clinically
significant and a standard deviation of 1.5g/dL was assumed (range/4 = (15.5 – 9.5)/4 =1.5g/dL).
For a one sided test at the 0.05 level of significance a sample of 61 subjects per group had a
90% power to detect the clinically significant difference of 0.8g/dL. To account for a dropout
rate of 30%, a sample size of 80 subjects per group was aimed for, however, only 71 and 73
learners were included, allowing for a dropout rate of about 20%.158
3.6. INTERVENTION
3.6.1 De-worming
All participating children were dewormed before the start of the intervention to eliminate
parasitic infestation which results in chronic intestinal blood loss due to the release of
anticlotting agents.56 A single dose of mebendazole (Vermox 500 mg tablet) was administered.
3.6.2 Experimental product
3.6.2.1 Description
The meal supplement used in the study was produced and provided by a South African based
company supplying locally manufactured maize-based ready-to-use “TetraPak” packed meal
supplements. Unfortified maize as the staple food of the target population was used as the
foundation of the products.The meal supplement was a lactose free, gluten free enteral feed,

42
providing 1 kcal/ml and 9 g protein per 250 ml Tetra-Pak portion. The meal supplement was
fortified with micronutrients and had the following nutritional specifications:
High in energy (>250 kJ per 100 ml)
High in vitamins (A, D, E, C, B1, B2, Niacin, B6, B12, Biotin & Pantothenic acid)
High in minerals: calcium, phosphorus, iron, magnesium, zinc & iodine
Source of protein (>2.5 g per 100 ml and >2.5 g per 418 kJ)
High in carbohydrates (>6.5 g per 100 ml)
The control meal supplement had a similar macronutrient profile but without any added micronutrients (Table 3.1).

43
Table 3.1: Nutritional composition of experimental and control product for boys and girls
Nutrient Experimental product
%RDA(9yrs) %RDA(12yrs) Control product % RDA
Energy 1050 KJ 11 1050 KJ 11
Protein (g) 9 26 16 9 26
Carbohydrate (g)
32.5 32.5
Fat (g) 10 10
Fibre-inulin FOS(g)
3 3
Sodium (mg) 275 275
Potassium (mg) 375 375
Chloride (mg) 355 355
Vit A (ug RE) 452.5
65 45
Vit D (ug) 2.5 25 50
Vit E (mg) 9.5 136 95
Vit C (mg) 45 100 75
Vit B1(mg) 0.8 67 57
Vit B2 (mg) 1 71 63
Niacin (mg) 15 94 83
Vit B6 (mg) 1.5 94 75
Folic Acid (ug) 50 17 25
Vit B12 (ug) 0.75 25 75
Biotin (ug) 50 42 50
Pantothenic acid (mg)
4.88 98 81
Calcium (mg) 325 41 41
Phosphurus (mg)
312.5 39 39
Iron (mg) 5 63 63
Magnesium (mg)
105 42 35
Zinc (mg) 5 50 33
Iodine (ug) 100 83 67
Selenium (mg) 0.13 65 -

44
Other characteristics of the product include: Gluten and lactose free; prebiotics (inulin), all
essential amino acids and non-essential amino acids. The product incorporated bioavailable
amino acid chelated minerals including ferrous bisglycinate chelate (Ferrochel®) whose
bioavailability was found to be far superior to the iron from ferrous sulphate.
The maize-based liquid meal supplement was a product used for the following conditions:
Full fluid liquid diet
Remedial treatment for malnutrition, underweight and micronutrient deficiencies
Immuno-compromised conditions, e.g. HIV & AIDS
Tuberculosis
Gastro-intestinal disease, e.g. diarrhea, Irritable bowel syndrome
Supplementation in addition to meals
Poor appetite
Cerebral palsy
Mental health conditions
All other clients as identified by a health professional
The product came in three different flavours (vanilla, chocolate, banana). The vanilla-flavoured
product was used in the study under review.
3.7 RANDOMISATION AND BLINDING
Learners in each class were stratified according to gender and baseline haemoglobin levels then
randomly assigned to two groups (Group A and Group B). A double blind study design was used
for this study. To prevent bias neither the subjects nor the investigator assessing the response
were told of the treatment the subjects were receiving.
3.7.1 Preparing and administering of experimental product
As a "ready to drink" product the maize-based liquid meal supplement did not require any
further preparation before uses. The pre-portioned meal supplements were numbered before
being given to the learners. Supplements intended for Groups A and B were marked with
numbers to be administered accordingly to specific subjects. Children were given supplements
each morning before 10 am. Each learner produced an identity tag before she/he could be

45
given the drink allocated to him/her by number as indicated. The said numbering by subject
was employed as a safeguard against dispensing product twice to a specific subject.
3.7.2 Subject compliance and monitoring
Each child was given an identity tag with the subject number, name, and class (reflecting the
relevant school grade) on it. These identity tags were yellow for Group A and blue for Group B
(Addendum 3). The researcher and assistant monitored compliance by observing the children as
they imbibed their drinks, making sure they did not share. Empties or leftovers were collected
and records of attendance and amounts left over were weighed and recorded in grams on
compliance sheets (Addendum 4) and filed. Compliance or consumption was expressed as
portion percentage (%).
3.7.3 Packaging and blinding of experimental products
The packaging and labeling of the two products were identical. The expiry date printed in lower
cases on the upper surface of the packaging had different dates for each product, and was the
only mean of differentiating between the two products.
3.8 DATA COLLECTION
3.8.1 Screening
Screening of the learners for eligibility to participate in the study was done in July 2010.
Standardised procedure was employed to measure Hb with the aid of a portable HemoCue
photometer (HemoCue Hb 201+Analyser, Angelhom, Sweden).123 Adjustment to hemoglobin
cutoffs was carried out according to altitude and ethnicity (Table 2.5).18 The adjustment led to a
Hb cutoff of 11.0 g/dL for the school children serving as subjects. Learners whose Hb was above
9.5 g/dL were included/invited to participate in the study.
3.8.2 Schedule of measurements
Weight, height, and Hb measurements were taken at the beginning of the intervention (July
2010), and again at the end of the intervention (November 2010).

46
3.8.3 Variables
3.8.3.1 Iron status
The assessment of iron status was achieved by using hemoglobin as the biomarker. No other
parameters were used due to financial and ethical constraints. Baseline and end assessments
were carried out by qualified dietitians and trained dietetic students. Hemoglobin
concentrations were determined with the aid of a portable HemoCue photometer (HemoCue
Hb 201+Analyser, Angelhom, Sweden). The accuracy and precision of hemoglobin values
measured with the aid of the HemoCue photometer are comparable to those obtained with the
cyanmethemoglobin method (the most reliable method recommended by the International
Committee for Standard Hematology). Finger pricks were done by using a single-use lancing
device (Accu-Check® Safe-T-Pro Uno). This lancing device is safety engineered with safety wings
that break during the use to prevent re-use, avoid accidental finger pricks, and eliminate cross-
contamination.103
3.8.3.2 Anthropometric measurements
Anthropometric measurements were recorded at two different time-points (baseline and end)
according to standard techniques by trained dietitians and dietetics students.96 Measures
included height and weight. Body mass index (BMI) for age and height for age were expressed
as z- scores.169
Height
Height was measured with a portable stadiometer (the Leicester height measure, England max
height 2.10 m). In measuring height, clothes were minimal so that posture could be clearly
seen and shoes were taken off. Height measurement was taken using standard techniques to
the nearest 0.1 cm.96
Weight
Weight was measured with the aid of a digital personal scale (Body – Check Analysis- Seca sense
804, Germany). The scale was placed on a hard flat surface (not carpet), checked and adjusted
for zero balance before each measurement. Body weight was measured according to standard
techniques and recorded to the nearest 0.1 kg.96

47
Z -scores
Z-scores for height-for-age (HAZ) and BMI-for-age (BAZ) were determined with the aid of the
WHO Anthro Plus Software.169A HAZ (z-score < -2SD) was indicative of moderate stunting and
HAZ < -1SD was indicative of mild stunting. On the other hand a BAZ < -3 SD reflects severe
thinness, BAZ <-2SD indicated thinness, and BAZ > +1SD indicated overweight and BAZ >+2 SD
reflected obesity.
3.8.3.3 Socio-demographic information
Socio-demographic information was solicited from participants in a standard, made-to-measure
questionnaire (Addendum 5). Parents/guardians were asked to fill in the questionnaires and
return them through their children.
3.8.3.4 Sickness diary
Children were given a sickness diary, to be filled in by their parents whenever they suffered a
bout of illness during the period of study (Addendum 6). The diaries were collected at the end
of the study.
3.9 STATISTICAL ANALYSIS
This randomised, controlled trial was conducted to compare the Hb levels of children aged, 8 –
12 years in experimental and control groups. Only subjects with both baseline and end data
were included in the statistical analysis.
The statistical software STATA Release 11 was used for statistical analyses.
Descriptive statistics were used for all measurements. Groups were compared with respect to
change in Hb based on an analysis of covariance (ANCOVA) with baseline Hb values as
covariate. Testing was done at the 0.05 level of significance.
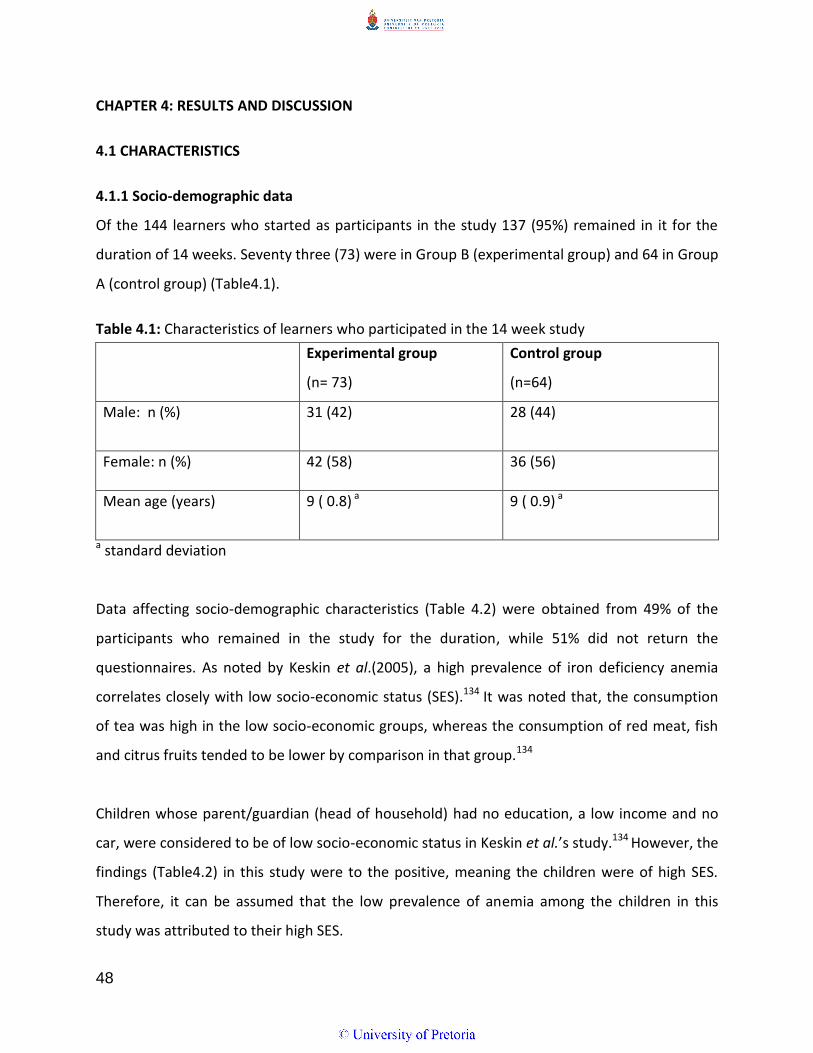
48
CHAPTER 4: RESULTS AND DISCUSSION
4.1 CHARACTERISTICS
4.1.1 Socio-demographic data
Of the 144 learners who started as participants in the study 137 (95%) remained in it for the
duration of 14 weeks. Seventy three (73) were in Group B (experimental group) and 64 in Group
A (control group) (Table4.1).
Table 4.1: Characteristics of learners who participated in the 14 week study
Experimental group
(n= 73)
Control group
(n=64)
Male: n (%) 31 (42)
28 (44)
Female: n (%) 42 (58) 36 (56)
Mean age (years) 9 ( 0.8) a 9 ( 0.9) a
a standard deviation
Data affecting socio-demographic characteristics (Table 4.2) were obtained from 49% of the
participants who remained in the study for the duration, while 51% did not return the
questionnaires. As noted by Keskin et al.(2005), a high prevalence of iron deficiency anemia
correlates closely with low socio-economic status (SES).134 It was noted that, the consumption
of tea was high in the low socio-economic groups, whereas the consumption of red meat, fish
and citrus fruits tended to be lower by comparison in that group.134
Children whose parent/guardian (head of household) had no education, a low income and no
car, were considered to be of low socio-economic status in Keskin et al.’s study.134 However, the
findings (Table4.2) in this study were to the positive, meaning the children were of high SES.
Therefore, it can be assumed that the low prevalence of anemia among the children in this
study was attributed to their high SES.

49
Table 4.2: The socio-demographic characteristics of the study population (n = 67)
Characteristic N %
Size of family
2 6 9 3 9 3
4 19 28
5 16 24 6 6 9
7 7 10
8 4 6
Mother’s marital status
Unmarried 14 21
Married 41 62 Divorced 3 5
Separated 3 5
Widowed 3 5
Traditional marriage 2 3
Who cooks food?
Father 2 3
Mother 54 81 Sibling 5 7
Grandmother 2 3
Aunt 3 4
Other 1 1
Who buys food?
Father 1 1
Mother 59 88 Sibling 3 4
Grandmother 2 3
Aunt 2 3
Head of household Father 34 51
Mother 27 40
Grandmother 2 3 Aunt 2 3
Friend 1 1
Other 1 1
Who decides how much money is spent on food?
Father 13 20
Mother 50 76 Grandmother 2 3
Aunt 1 2
Mom’s level of education
None 2 3 Primary school 4 6
Std 6-8 1 2
Std 9-10 18 3 Tertiary education 37 57
Not applicable 3 5
Household income
None 3 4 R100-500 2 3
R500-1000 5 7
R1000-3000 12 18 Over 5000 15 22

50
4.1.2. Anthropometric characteristics
Anthropometry determines either the cross-sectional nutritional status of a population, or the
nutritional status of an individual.109 The anthropometric characteristics of participants in the
study under review are presented in Table 4.3. There was no significant difference in the weight
of the experimental (33.6 ± 9.6kg) and control (35.3 ± 9.0kg) (P= 0.281) groups at baseline. Both
groups gained some weight, though not significantly, during the period of the study. There was
also no significant difference in the height of the groups at baseline. The participants were not
stunted. The mean BMI z-scores indicated that the learners were not obese. These findings
indicate that there was no significant difference in the nutritional status of the participants at
baseline.
Genetics and the environment play a major role in influencing physical growth. The
environment, and the quality and quantity of food available are important determinants of
growth rate.170,171 The NFCS showed that one in ten of all children aged 1 – 9 years were
underweight, more than one in five were stunted and 6% of children were overweight. The
same survey found that the prevalence of stunting declined while that of excess body weight
rose as maternal education levels increased.109 Although the average age of children involved in
the study was slightly higher than that of their counterparts in the national survey, their
average age (9.8 years) nevertheless fell within the same age bracket as the said counterparts,
therefore comparison of the survey results with those of the present study is justifiable. Thus,
as in the national survey, few participants (< 10%) were underweight.109,172 By contrast,
however, the incidence of stunting and overweight recorded for the survey was different from
that recorded in the study at issue.
In particular, stunting was lower among participants in the present study (< 10%) compared to
the moderate prevalence recorded in the NFCS (20 – 29.9%). Contrariwise, the prevalence of
overweight participants was higher (> 20%) in the present study than that reported by the NFCS
(6%).109 The results emanating from this study were comparable to those of the South African
National Health and Nutrition Examination Survey (SANHENS), which showed that the
prevalence of undernutrition had declined among children of all age groups in South Africa.128

51
Table 4.3: Anthropometric characteristics of the study population
HAZ: Height for age z-scores; BAZ: Body mass index for age z- scores Stunted (HAZ < -2); Wasted (BAZ < -2); 1(ANCOVA, P = 0.05)
At the end of the study no significant changes had become evident in the anthropometry of the
participants (Table 4.3). Other studies undertaken with school children showed significant
increases in growth as well as height-for-age and weight-for-age z- scores.112,113 The positive
results recorded in these studies were attributed to participant’s low iron stores at baseline.
Results that seemed to vary erratically in the instance of studies conducted with iron-replete
children could have been attributable to variations in administered iron dosages, coinciding
Variable Experimental group (n= 73)
Control group (n=64)
p- value1
Mean (sd) Mean (sd)
Weight (kg)
Baseline 33.6 (9.6) 35.3 (9.0) 0.281
End 34.6 (10.1) 36.5 (10.1) 0.276
Height (cm)
Baseline 136.2 (7.8) 137.9 (9.3) 0.255
End 137.7 (0.9) 139.6 (1.3) 0.219
HAZ (stunting)
Baseline 0.009 (1.08) 0.265 (1.20)
0.153
End 0.037 (1.095) 0.292 (1.249)
0.152
Change from baseline to end
0.028 (1.082) 0.027 (1.198) 0.237
BAZ (wasting)
Baseline 0.442 (1.18) 0.650 (1.18)
0.309
End 0.321(1.352) 0.537(1.302)
0.367
Change from baseline to end
0.121 (1.181) 0.113 (1.177) 0.704

52
deficiencies, studies running over varying length of time or combinations of these factors.116
4.1.3 Consumption
The maize-based liquid meal supplement enriched with multiple micronutrients as used in the
study under review was provided for a total of 69 school days over a period of 14 weeks
(shortened due to strike action). Mean consumption (defined as the actual amount of drink
consumed during the study, expressed as a percentage of the total amount provided over the
trial period) was 49.34 % (SD: 27.43) and 53.71% (SD: 31.94) in the experimental and control
groups respectively. The difference in consumption of the drink between the two groups was
insignificant (P = 0.394)
The experimental product provided 5 mg iron per day providing 63% DRI of iron intake when
consumption is complete. However, since the consumption was 49.34% the average daily
intake per individual can be assumed to have been 2.47 mg, thus amounting to 30.9% of DRI
per day. The school children took the maize-based liquid meal supplement in the early hours of
the day, which probably meant that they had taken the supplement shortly after consuming a
breakfast meal, which would therefore not have been fully digested by the time they ingested
the supplement, thus possibly accounting for the low consumption recorded in the course of
the study. Other possible reasons for the low consumption levels may have been absenteeism,
unavailability of child during allocated scheduled handout of supplements, and the observed
relative distaste for the experimental products. Consumption overall as observed in the study
under review is lower than that found in comparable studies.
A consumer sensory evaluation (data not included) of the same product showed that the
learners preferred (not markedly though) the chocolate flavoured maize-based liquid meal
supplement enriched with multiple micronutrients to the other two flavours (vanilla and
banana).173 This preference could be the reason why consumption as observed in this study was
low.

53
4.1.4 Iron status
The prevalence of anemia at baseline in the experimental and control groups is shown in Table
4.4. In the experimental group six (6) cases of mild anemia were diagnosed at baseline (Hb <
11g/dL) while only one (1) participant in the control group was diagnosed as mildly anemic at
that stage. By the end of the study, however, only one (1) participant in the experimental group
had mild anemia, while the control group still had one (1) mildly anemic participant.
This was not unexpected as the learners in the control group were not getting any
micronutrient from their product. Table 4.5 shows the mean Hb levels of the experimental and
control groups. There was no significant difference between the experimental and control
groups in the Hb levels (12.6 ±1.1 g/dL in the experimental group and 12.8±1.1 g/dL in the
control group) (P = 0.250) at baseline (Table 4.5). It should be noted however that Hb was used
in the study as an inexpensive and common measurement, otherwise when used alone Hb is
not a very specific and sensitive indice to determine whether iron deficiency is the specific
cause of anemia.96
Table 4.4: Anemia prevalence in the experimental and control groups at baseline and at end
The intervention had no significant effect on participants’ Hb levels over the intervention
period of 14 weeks. However, at the end of the trial a slight increase in Hb levels (0.08 ±
1.210g/dL) was found in the experimental group, while a decline (-0.249 ± 1.191g/dL) was
observed in the control group (Table 4.5); moreover the prevalence of mild anemia (Hb<
11g/dL)) in the experimental group had decreased from 8% at baseline to 1%.
Mild anemia (Hb 9.5 to ≤
10.99g/dL)
Experimental n(%) Control n(%)
Baseline 6 (8) 1(2)
End 1(1) 1(2)

54
Table 4.5: Iron status of participants at baseline, end and change from baseline to end
Experimental
Mean ± sd
Control
Mean ± sd
p-value1
Baseline Hb (g/dL)
12.6 ± 1.1
12.8 ± 1.1
0.250
End Hb (g/dL)
12.7 ± 0.12
12.6 ± 0.11
0.806
Change from baseline to end
0.087 ± 1.210 -0.249 ± 1.191
0.477
Hb: Hemoglobin; sd: standard deviation; 1(ANCOVA, P = 0.05)
The prevalence of anemia declined in the course of this study from a level regarded as a mild
public health problem (10%)128 to an almost negligible level (2%) despite the low mean
consumption observed (50%). An improvement was mainly observed in the experimental
group. Table 4.6 shows that a negative change irrespective of rate of intake of the product was
observed in the iron status of learners in the control group (-0.241 ± 1.258 in members whose
consumption was < 50% and -0.241 ± 1.191 in members whose consumption was ≥ 50%). On
the other hand a positive change (0.008 ± 1.097) was evident in members of the experimental
group whose consumption was < 50% and 0.123 ± 1.301 in members whose consumption was ≥
50%. On balance, though, the changes were negligible.
Assimilation of iron is low when iron status is at repletion levels.174 If a high bioavailability diet is
followed absorption averages at 15% in non-anemic individuals but climbs to 50% in anemic
subjects .174 The fact that 90% of the children in this study had normal Hb levels (Hb > 11g/dL)
could be the main reason why the experimental product used in this study, despite its high
highly bioavailable iron content, made no appreciable difference to subjects’ iron status. Iron
absorption improves when taken on an empty stomach or between meals. The liquid meal
supplement used in the instance under review was taken early in the day when subjects’
breakfast probably had not had time to digest, with the result that intake of the supplement as
well as absorption of its iron content were low.
Results were comparable with those obtained in other studies conducted with subjects whose

55
iron status was at repletion levels. For instance, no observable result materialized from
administering fortified biscuits during an intervention conducted over a period of 16 weeks in
iron replete (12.8 g/dL) school children aged 8 – 10 years old.164 Supplementation also had no
appreciable effect in the instance of another intervention study carried out in Tanzania132
where participants’ baseline iron status had been normal (11.9 g/dL for both the experimental
and control groups). Seasonal influence in dietary quality and the malaria-related morbidity
pattern were given as reasons for the insignificant results achieved by conducting the
intervention. This shows that iron repletion may not be the only reason for insignificant results
obtained with supplementation venture.
The mean age of participants in the study under review was 9 years, but their age range was 8 –
12 years, which means that some were pre-adolescents or even adolescents who might have
started menstruating, in which case the iron requirements of the menstruating female
participants would have been higher than those of other participants and might not have been
met in full by the supplementation.(not assessed).
Since the experimental product utilized in the study under review contained other chelated
micronutrients besides chelated ferrous bisglycinate (Table 3.1), it follows that some of these
additional nutrients may have interacted biologically with iron supplement because they (the
ferrous and other nutrients) have chemically similar absorption and transport mechanisms (e.g.
calcium).175 A number of interactions between micronutrients could take place when a high
dose of a single nutrient is given or when the supply of an individual micronutrient is
inadequate.175 In such instances iron indicators do not improve as greatly as when iron is given
alone.175 Such interaction could have served to suppress the efficacy of supplementation and
could therefore have been partly responsible for the observed insignificant effect of
supplementation over the study period. Moreover, no indication was found in the observed
outcome of supplementation that vitamin C had enhanced iron intake as might be expected.
Similar results were observed in a study by Ayoya162 where a multiple micronutrient

56
supplement administered to school children aged 7- 12 years old schoolchildren (baseline Hb:
10.42 g/dL; 10.57 g/dL; 10.59 g/dL for the Fe, MM, and Fe+MM groups respectively), barely
lifted Hb values over a study period of 12 weeks, as opposed to when iron supplementation was
taken alone. Negative interactions among nutrients were reported to have interfered with the
use of iron or other erythropoietin nutrients. In another study conducted with Botswana school
children aged 6 – 11 years over a period of 8 weeks (baseline Hb:12.9 g/dL for both the
experimental and control groups), it was found that administering a fortified, fruit-flavoured
drink over the study period had resulted in lowered Hb levels158 possibly because in this
instance too, negative interaction had occurred between nutrients. By contrast, however, other
studies involving multiple micronutrient supplementation have reported a positive effect on the
anemia status of the population concerned.
A positive effect for instance, was observed in a study done in Morocco by Zimmerman58 where
it was found that the Hb levels of school children aged 10 – 13 years had been raised by
administering triple fortified salt (baseline Hb: 11.4g/dL and 11.6 g/dL for the experimental and
control groups respectively). The likely reason for these results may have been the fact that the
children were taking three meals per day plus snacks, all of which contained triple fortified salt.
Iron absorption was therefore enhanced by repeated delivery of small doses throughout the
day,58 unlike Zimmerman’s study, the experimental product in this study was only given once a
day, therefore there was no repeated delivery of the micronutrients.
A significant increase in Hb levels as well as high consumption levels ( >90%) were reported by
Van Stuijvernberg’s study in which South African school children aged 6 -11years old (baseline
Hb: 11.5g/dL and 11.3 g/dL for the experimental and control groups respectively) were given
biscuits to eat that had been fortified with multiple micronutrients.167 The high consumption
meant that, unlike the results obtained with the low consumption of participants in the present
study, the children absorbed useful amounts of the nutrients as result of the continuity.
Positive results on the bioavailability of ferrous bisglycinate have been shown in several studies.

57
For example, in a study conducted in Valencia (Carabobo State, Venezuela) on men aged (15 –
50 yrs old) and women, of whom 40 were menopausal, showed that Ferrochel could partially
prevent the inhibitory effects of phytates, mainly because it is highly soluble even at pH 6,
highly assimilable and not inclined to interact with food.144 The same effect was expected in the
present study as the basis of the liquid meal supplement was maize which contains some
phytates
It is understandable therefore, that the children did not absorb useful amounts of the nutrients,
either because they were iron replete, or because they did not consume sufficient amounts of
the supplement. This is why the intervention did not show a significant impact on participants’
Hb levels.
4.2 LIMITATIONS
The intervention only took place during school days but not on school holidays, weekends or
public holidays. The study was also limited to 14 weeks instead of the envisaged 16 weeks
because of a strike action mounted by teachers in the public schools. The unforeseen break
may have been partly responsible for the insignificant effect of the intervention on learner’s Hb
levels. Research ethics imposed another limiting factor in that its disapproval of participation by
children with a very low iron status naturally precluded participation by moderately and
severely anemic children. It is understandable, therefore, that absorption in children whose
iron status was replete was less pronounced than it could have been with moderately or
severely anemic children. The lack of dietary data was also a limitation as it would have helped
in the interpretation of the intervention results,
A further limitation that may have affected the outcome of the study was the fact that the
product was not subjected to a consumer sensory evaluation test before it was administered,
with the result that no data were obtained about its acceptability prior to the intervention. It
stands to reason, therefore, that a responsive flavour adjustment to appease participants’
preference might have proved instrumental in increasing consumption, which could have led to
different results.

58
CHAPTER 5: CONCLUSIONS AND RECOMMENDATIONS
It can be concluded from measurements of Hb levels that the maize-based liquid meal
supplement enriched with multiple micronutrients administered to participants in the study at
issue did not have a significant effect on their iron status, possibly owing to a low prevalence of
anemia and, for that reason, a low rate of consumption and therefore of iron absorption among
members of the participating group.
It can also be concluded from anthropometric data that the liquid meal supplement did not
have a significant effect on the nutritional status of participants.
RECOMMENDATIONS
It is recommended that the intervention be taken to a primary school where the
children are really needy and anemic to see if a significant effect will be forthcoming
from the intervention.
Since the poor consumption observed in the study under review could have been a
result of aversion to the taste (vanilla flavor) of the maize-based liquid meal supplement
enriched with multiple micronutrients, it is recommended that the chocolate flavoured
product be substituted, since it proved to be the most liked in the consumer sensory
evaluation which was carried out later.
To increase consumption children should be given the supplement between meals when
the digestive process is sufficiently advanced to prevent interference with absorption of
the iron supplement.
It is also recommended that the female participants be questioned in retrospect to
discover whether any of them had begun to menstruate at the time of experimental
supplementation, and that a statistical analysis be done accordingly to accommodate
the outcome of what the recommended questioning reveals.

59
REFERENCES
1. UNICEF/Micronutrient Initiative. Vitamin and mineral deficiency. Global progress report.
Ottawa: Micronutrient Initiative; 2004.
2. Kurz KM. Adolescent nutritional status in developing countries. Proc
Nutr Soc. 1996;55:321–31.
3. Hyder SMZ, Haseen F, Khan M, et al. A multiple micronutrient fortified beverage affects
hemoglobin, iron and vitamin A status and growth in adolescent girls in rural
Bangladesh. J Nutr. 2007;137:2147-2153.
4. Rees JM, Neumark-Sztainer D, Kohn M, et al. Improving the
nutritional health of adolescents - Position statement - Society of Adolescent
Medicine. J Adolesc Health. 1999;24:461–2.
5. Brabin L, Brabin BJ. The cost of successful adolescent growth and
development in girls in relation to iron and vitamin A status. Am J Clin
Nutr. 1992;55:955–8.
6. Standing Committee on Nutrition. Adolescence: a pivotal stage of the
life cycle. SCN News. 2005–2006;31:6–13.
7. Allen LH, Peerson JM, Onlney DK. Provision of multiple rather than two or fewer
micronutrient more effectively improves growth and other outcomes in micronutrient
deficient children and adults. J Nutr. 2009;139:1022–1030.
8. van Stuijvenberg ME. Using the school feeding system as a vehicle for micronutrient
fortification: Experience from South Africa. Food Nutr Bull. 2005;26(2):S213-S219.
9. Bourre JM. Effects of nutrients (in food) on the structure and function of the nervous
system: update on dietary requirements for brain. Part 1: Micronutrients. J Nutr Health
and Ageing. 2006;10(5):377-385.
10. Kloka D. Integrated Nutrition Programme. 2003.
11. Ministry of Education–UNICEF Provincial Report. Evaluation of the school nutrition
programme Gauteng Province. 2008.
12. DOH. The Integrated Nutrition Programme. 2002. Issue 3.
13. Health Systems Trust. An Evaluation of South Africa’s Primary School Nutrition

60
Programme. 1997.http://www.healthlink.org.za
14. Clark SF. Iron deficiency anemia. Nutr Clin Pract. 2008;23:128-141.
15. Pineda O, Ashmead HD. Iron-deficiency anemia in infants and young children with
ferrous bisglycinate chelate. Nutr J. 2001;17(5):381-384.
16. Ramakrishan U, Goldenberg T, Allen LH. Do multiple micronutrient interventions
improve child health, growth, and development? J Nutr. 2011;141:2066–2075.
17. Mahan LK, Escott-Stump S, Raymond JL. Krause’s food and nutrition therapy. Edition 13.
St Louis Missouri. 2012.
18. Sullivan KM, Mei Z, Grummer-Strawn L, et al. Hemoglobin adjustments to define
anemia. Trop Med Intern Health. 2008;13(10):1267–1271.
19. Pendleton J. Ferrous bisglycinate. A gentle form of iron that is easier to absorb. 2008.
http://vitamins-minerals.suite1oi.com/article.cfm/ferrousbisglycinate.
20. Partnership for child development (The World Bank, UNFPA, WFP,Unicef). School age
children; their nutrition and health. 2002; www.schoolsandhealth.org.www.child-
development.org.www.imperial.ac.uk/ (accessed on 12 April 2010).
21. Mason JB. The micronutrient report: Current progress and trends in the control of
vitamin A, Iodine and Iron deficiencies. The micronutrient Initiative: Ottawa, Canada.
2001.
22. Viteri FE, Gonzalez H. Adverse outcomes of poor micronutrient status in childhood and
adolescence. Nutr Rev. 2002;60 (Suppl):577–83.
23. Manger MS, Mc Kenzie JE, Winichagoon P, et al. A micronutrient fortified seasoning
powder reduces morbidity and improves short term cognitive function, but has no effect
on anthropometric measures in primary school children in North East Thailand: a
randomized controlled trial. Am J Clin Nutr. 2008;87:1715.
24. Swart R, Sanders D, Mc Lachlan M. Nutrition: A primary health care perspective, 2002.
25. Lynch S. Iron metabolism in Nutritional anemia. Edited by Kraemer K and Zimmermann
MB, Sight and Life Press, California. 2007.
26. Singh N. Role of micronutrients for physical growth and mental development. Indian J
Pediatr. 2004;71 (1):59-62.

61
27. Aggett J, Agstonic C, Axelsson I, et al. Iron metabolism and requirement in early
childhood: Do we know enough? ESPGHA Committee on nutrition. J Pediatr Gastro and
Nutr. 20002;34:337-345.
28. WHO. World Health Report. Reducing risk, promoting healthy life. Geneva: WHO. 2002.
29. Zimmermann MB. Interactions in the etiology of anemia. Nutritional anemia. Sight and
Life. 2007;119–213.
30. Shayeghi M, Latunde- Dada GO, Oakhil JS, et al. Identification of an intestinal heme
transporter. Cell. 2005;122:789-801.
31. Qui A, Jansen M, Sakaris A, et al. Identification of an intestinal folate transporter and
the molecular basis for hereditary folate malabsorption. Cell. 2006;127:917-28.
32. Gunshin H, Mackenzie B, Berger UV, GunshinY, et al. Cloning and characterization of a
mammalian proton-coupled metal-ion transporter. Nature. 1997;388:482–8.
33. McKie AT, Barrow D, Latunde-Dada GO, et al. An iron-regulated ferric reductase
associated with the absorption of dietary iron. Science. 2001;291:1755-59.
34. Nicolas G, Chauvet C, Viatte I. et al. The gene encoding the iron regulatory peptide
hepcidin is regulated by anemia, hypoxia, and inflammation. J Clin Inves.
2002;110:1037-44.
35. Nemeth E, Valore EV, Territo M, et al. Hepcidin a putative mediator of anemia of
inflammation is a type 11 acute phase protein. Blood. 2003;101:2461-63.
36. Skikne BS, Flowers CH, Cook JD. Serum transferring receptor: a quantitative measure of
tissue iron deficiency. Blood. 1990;75:1870-76.
37. Stoltzufus R, Chwaya HM, et al. Epidemiology of iron deficiency and anaemia in Zanzibar
school children: The importance of hookworms. Am J Clin Nutr. 1997;65:153 -9.
38. Falkingham M, Abdelhamid A, Curtis P, et al. The effects of oral iron supplementation
on cognition in older children and adults: a systematic review and meta analysis. Nutr J.
2010;9:4
39. Nestel P, Bouis HE, Meenakshi JV, et al. Biofortification of staple food crops. J Nutr.
2006;136:1064–67.
40. Labadarios D. Estimating the burden of disease attributable to iron deficiency anemia in

62
South Africa in 2000. S Afr Med J. 2007;97.8:741–6.
41. Lynch SR. The impact of iron fortification on nutritional anemia. Best Pract Res Clin
Haematol. 2005;18:333–46.
42. FAO/WHO. Requirements of vitamin A, iron, folate and B12. Report on joint FAO/WHO
expects consultation. FAO Food Nutr Series no. 23 Rome FAO. 1988.
43. Hurrell RF. Preventing iron deficiency through fortification. Nutr Rev. 1997;55:210-222.
44. Partnership for Child Development. An association between chronic under nutrition and
educational test score in Vietnamese children. Eur J Clin Nutr. 2001;55:801-804.
45. Partnership for Child Development. Short stature and the age of enrollment in primary
school: Studies in two African countries. Social Science and Medicine. 1999;48:675–682.
46. Hallberg L, Hultén L, Gramatkovski E. Iron absorption from the whole diet in men: how
effective is the regulation of iron absorption? Am J Clin Nutr. 1997;66:347–56.
47. Beutler E. How little we know about the absorption of iron. Am J Clin Nutr.
1997;66:419–20.
48. Partnership for Child Development. This wormy world: Fifty years on. Parasitology
Today. 1997 (poster).
49. Chan MS. The global burden of intestinal nematode infections – fifty years on.
Parasitology Today. 1997;13(11):438–443.
50. Bundy DAP. This wormy world – then and now. Parasitology Today. 1997;13(11):519–
528.
51. World Bank. World development Report Investing in Health. Oxford: Oxford University
Press. 1993.
52. Drake IJ, Bundy DAP. Multiple helminth infections in children: impact and control.
Parasitology. 2001;122:S73–S81.
53. Brock C, Cammish N. Factors affecting female participation in seven countries. DFID.
1997.
54. Lwambo NJS, Bundy DAP, Medley GFH. A new approach to morbidity risk assessment in
hook worm endemic communities. Epidemiol infection. 1992;108:469.
55. Beasley NMR, et al. The impact of population level deworming on the hemoglobin

63
levels of school children in Tang Tanzania. Tropical Medicine and International Health.
1999;4:744–750.
56. Albonico M, Stoltzfus RJ, Savioli L, et al. Epidemiological evidence for differential effect
of hookworm species, Ancyclostoma duodenale or Necator amaricans, J Epidemiol.
1998;27:S30-S37.
57. May J, et al. Impact of sub patent multispecies and multiclonal plasmodial infections on
anemia in children from Nigeria. Transactions of the Royal Society of Trop Med Hygiene.
2000;94:399-403.
58. Zimmermann MB, Wegmüller R, Zeder C, et al. Triple fortification of salt with
microcapsules of iodine, iron and vitamin A. Am J Clin Nutr. 2004;80:1283–90.
59. Zimmermann MB, Adou P, Zeder C, et al. Persistence of goiter despite oral iodine
supplementation in goitrous children with iron deficiency anemia in the Côte d’Ivoire.
Am J Nutr. 2000;71:88–93.
60. Nga T, Winichagoon P, Dijkhuizen MA, et al. Multi-micronutrient–fortified biscuits
decreased prevalence of anemia and improved micronutrient status and effectiveness
of deworming in rural Vietnamese school children. J. Nutr. 2009;139:1013–1021.
61. Hinderaker SG, Olsen BE, Lie RT, et al. Anemia in pregnancy in rural Tanzania:
associations with micronutrients status and infections. Eur J Clin Nutr. 2002;56:192–9.
62. Dijkhuizen MA, Wieringa FT, West CE, et al. Concurrent micronutrient deficiencies in
lactating mothers and their infants in Indonesia. Am J Clin Nutr. 2001;73:786–91.
63. Muhilal, Permeisih D, Idjradinata YR, et al. Vitamin A-fortified monosodium glutamate
and health, growth, and survival of children: a controlled field trial. Am J Clin Nutr.
1988;48:1271–6.
64. Mwanri L, Worsley A, Ryan P, et al. Supplemental vitamin A improves anemia and
Interactions in the etiology of anemia growth in anemic school children in Tanzania. J
Nutr. 2000;130:2691–6.
65. Suharno D, West CE, Muhilal, et al.Supplementation with vitamin A and iron for
nutritional anemia in pregnant women in West Java, Indonesia. Lancet. 1993;342:1325-
8.

64
66. Semba RD, Bloem MW. The anemia of vitamin A deficiency: epidemiology and
pathogenesis. Eur J Clin Nutr. 2002;56:271–81.
67. Means RT, Jr. The anemia of infection. Baillieres Best Pract Res Clin Haematol. 2000;13:
151–162. Medicine. J Adolesc Health. 1999;24:461–2.
68. Powers HJ. Riboflavin (vitamin B-2) and health. Am J Clin Nutr. 2003;77:1352–60.
69. Foy H, Kondi A. A case of true red cell aplastic anemia successfully treated with
riboflavin. J Pathol Bacteriol. 1953;65:559–64.
70. Foy H, Kondi A, Mbaya V. Effect of riboflavin deficiency on bone marrow function and
protein metabolism in baboons. Preliminary Report. Br J Nutr 1964;18:307–18.
71. Sirivech S, Frieden E, Osaki S. The release of iron from horse spleen ferritin by reduced
flavins. J Biochem. 1974;143:311–5.
72. Powers HJ. Riboflavin-iron interactions with particular emphasis on the gastrointestinal
tract. Proc Nutr Soc. 1995;54:509–17.
73. Adelekan DA, Thurnham DI. The influence of riboflavin deficiency on absorption and
liver storage of iron in the growing rat. Br J Nutr. 1986;56:171–9.
74. Butler BF, Topham RW. Comparison of changes in the uptake and mucosal processing of
iron in riboflavin-deficient rats. Biochem Mol Biol Int. 1993;30:53–61.
75. Buzina R, Jusic M, Milanovic N, et al. The effects of riboflavin administration on iron
metabolism parameters in a school going population. Int J Vitam Nutr Res. 1979;49:136–
43.
76. Ajayi OA, Okike OC, Yusuf Y. Haematological response to supplements of riboflavin and
ascorbic acid in Nigerian young adults. Eur J Haematol. 1990;44:209–12.
77. Charoenlarp P, Pholpothi T, Chatpunyaporn P, et al. The effect of riboflavin on the
hematologic changes in iron supplementation of schoolchildren. Southeast Asian J Trop
Med Public Health. 1980;11:97–103.
78. Suprapto B, Widardo, Suhanantyo. Effect of low-dosage vitamin A and riboflavin on iron-
folate supplementation in anemic pregnant women. Asia Pac J Clin Nutr. 2002;11:263–7.
79. Powers HJ, Bates CJ. Micronutrient deficiencies in the aetiology of anemia in a rural area
in the Gambia. Trans R Soc Trop Med Hyg. 1987;81:421–5.

65
80. Suboticanec K, Stavljenic A, Schalch W, et al. Effects of pyridoxine and riboflavin
supplementation on physical fitness in young adolescents. Int J Vitam Nutr Res.
1990;60:81–8.
81. Lonnerdal B. Dietary factors influencing zinc absorption. J Nutr. 2000;130(5S):1378S–
83S.
82. Solomons NW, Jacob RA. Studies on the bioavailability of zinc in humans: effects of
heme and non heme iron on the absorption of zinc. Am JClin Nutr. 1981;34:475–82.
83. Sandstrom B, Davidsson L, Cederblad A, et al. Oral iron, dietary ligands and zinc
absorption. J Nutr. 1985;115:411–4.
84. Crofton RW, Gvozdanovic D, Gvozdanovic S, et al. Inorganic zinc and the intestinal
absorption of ferrous iron. Am J Clin Nutr. 1989;50:141–4.
85. Rossander-Hulten L, Brune M, Sandstrom B, et al. Competitive inhibition of iron
absorption by manganese and zinc in humans. Am J Clin Nutr. 1991;54:152–6.
86. Fairweather-Tait SJ, Wharf SG, Fox TE. Zinc absorption in infants fed iron-fortified
weaning food. Am J Clin Nutr. 1995;62:785–9.
87. Berger J, Ninh NX, Khan NC, et al. Efficacy of combined iron and zinc supplementation
on micronutrient status and growth in Vietnamese infants. Eur J Clin Nutr.
2006;60(4):443–54.
88. Rosado JL, Lopez P, Munoz E, et al. Zinc supplementation reduced morbidity, but neither
zinc nor iron supplementation affected growth or body composition of Mexican
preschoolers. Am J Clin Nutr. 1997;65:13–9.
89. Munoz EC, Rosado JL, Lopez P, et al. Iron and zinc supplementation improves indicators
of vitamin A status of Mexican preschoolers. Am J Clin Nutr. 2000;71:789–94.
90. Lind T, Lonnerdal B, Sherlund H, et al. A community based randomized controlled trial of
iron and zinc supplementation in Indonesian infants: interactions between iron and zinc.
Am J Clin Nutr. 2003;77:883–90.
91. Fischer Walker C, Kordas K, Stoltzfus RJ, et al. Interactive effects of iron and zinc on
biochemical and functional outcomes in supplementation trials. Am J Clin Nutr.
2005;82:5–12.

66
92. Chanarin I. The megaloblastic anaemias. 2nd ed. Oxford: Blackwell Scientific
Publications. 1979:1–3.
93. Scott JM. Nutritional anemia: B-vitamins: Nutritional anemia. 2007;111–131
94. Bresalki HK, Erhardt JG. Diagnosis of nutritional anemia- Laboratory assessment of iron
status (Nutritional Anaemia), 2007.
95. Stoltzufus RJ. Update on issues related to iron deficiency and anemia control In:
Labadarios D. Estimating the burden of disease attributable to iron deficiency anemia in
South Africa in 2000. S Afr Med J. 2007;97.8:741–6.
96. Gibson RS. Principles of Nutritional Assessment. 2nd ed. New York: Oxford University
Press, 2005.
97. WHO/UNICEF/UNU. Iron deficiency anemia assessment, prevention, and control.
Geneva: World Health Organization, 2001.
98. Stoltzfus RJ, ML Dreyfuss. Guidelines for the Use of Iron Supplements to Prevent and
Treat Iron Deficiency Anemia. International Nutritional Anemia Consultative Group.
Washington, DC: International Life Sciences Institute Press, 1998.
99. United States Institute of Medicine. Nutrition During Pregnancy and Lactation. An
Implementation Guide. Washington, DC: National Academy Press, 1992.
100. Baltussen R, Knai C, Sharan M. Iron fortification and iron supplementation are cost-
effective interventions to reduce iron deficiency in four sub regions of the world. J Nutr.
2004;134:2678–84.
101. WHO/FAO. Guidelines on Food Fortification with Micronutrients. Eds. Allen L, de Benoist
B, Dary O, Hurrell R. Geneva, WHO, 2006.
102. Laxminarayan R, Mills AJ, Breman JG, et al. Advancement of global health: key messages
from the Disease Control Priorities Project. Lancet. 2006;367:1193–208.
103. Burger SE, Pierre-Louis JN. How to assess iron deficiency anemia and use of hemocue.
Helen Keller International. 2002;17.
104. Cook JD. Diagnosis and management of iron deficiency anemia. Best Pract Res Clin
Haematol. 2005;18(2):319–32.
105. Van Stuijvernberg ME. A biscuit fortified with iron, iodine and B-carotene as a strategy

67
to address micronutrient deficiencies in primary school children. Thesis; department of
paediatircs: University of CapeTown, 2001.
106. Grantham-Mcgregor S, Ani C. Undernutrition and mental development. Nutrition and
brain, Nestle Nutrition Worksop Series Clinical and Performance Programme. 2001;5:1–
18.
107. Arcanjo FPN, Amanco OMS, Braga JAP etc. Randomized controlled trial of iron-fortified
drinking water in Pre-school children. J Am Coll Nutr. 2010;29(2):122-29.
108. Government Gazette Republic of South Africa Regulation Gazette. Foodstuffs, cosmetics
and disinfectants act 1972 Act No. 54 of 1972. Regulation relating to the fortification of
certain food stuffs. 2003;No. 7634:vol 454, Pretoria 7.
109. Labadarios D, Steyn NP, Maunder E, et al. The National Food Consumption Survey
(NFCS): Children aged 1- 9 in South Africa. 2000.
110. Sarma KVR, Udayakuma P, Balakrishna N et al. Effect of micronutrient supplementation
on health and nutrition status of school children : growth and morbidity. Nutrition.
2006;22(suppl):8S–14S.
111. Bhandari N, Bahl R, Taneja S. Effect of micronutrient supplementation on linear growth
of children. Br J Nutr. 2001;85:S131-S137.
112. Chwang L, Soemantri AG, Pollit E. Iron supplementation and physical growth of rural
Indonesian children. Am J Clin Nutr. 1988;47:496–501.
113. Kruger M, Badenhorst CJ, Mansvelt EPG, et al. Effects of iron fortification in a school
feeding scheme and anthelmintic therapy on iron status and growth of six to eight year
old children. Food Nutr Bull. 1996;17:11–21.
114. Idjradinata P, Watkins WE, Pollit E. Adverse effect of iron supplementation on weight
gain of iron–replete young children. Lancet. 1994;343:1252–1254.
115. Aguayo VM. School administered weekly iron supplementation – effect on growth and
hemoglobin status of non –anemic Bolivian school- age children. A randomized placebo
controlled trial. Euro J Nutr. 2000;39:263–269.
116. Allen LH, Ahluwalia N. Nutritional influences on linear growth. Euro J Clin Nutr. 1994;
48:S75–S79.

68
117. Kibel MA, Wagstaff LA. Child health for all: A manual for Southern Africa 2nd edition.
Oxford University Press Southern Africa, Cape Town. 1995.
118. Hershko C. Iron and infection. In van Stuijverngerg ME. A biscuit fortified with iron,
iodine and B-carotene as a strategy to address micronutrient deficiencies in primary
school children. Thesis ; department of pediatrics: University of Cape Town. 2001;17–18.
119. Gera T, Sachdev HP. Effect of iron supplementation on incidence of infectious illness in
children: systematic review. BMJ. 2002;325:1142.
120. Sazawal S, Black RE, Ramsan M, et al. Effects of routine prophylactic supplementation
with iron and folic acid on admission to hospital and mortality in preschool children in a
high malaria transmission setting: community-based, randomized, placebo-controlled
trial. Lancet. 2006;367:133–43.
121. WHO. WHO Statement: Iron supplementation of young children in regions where
malaria transmission is intense and infectious disease highly prevalent.
http://www.who.int/child-adolescent
health/New_Publications/CHILD_HEALTH/WHO_statement_iron.pdf. 2007 (accessed
April 8, 2010).
122. Solon FS, Sarol JN, Bernado Jr ABI, et al. Effect of a multiple-micronutrient fortified fruit
powder beverage on the nutrition status, physical fitness and cognitive performance of
school children in the Philipines. Food and Nutr Bull. 2003;24,4 (Suppl):S129–S140.
123. Shrestha RM. Effects of iodine and iron supplementation on physical, psychomotor and
mental development in primary school children in Malawi. PhD thesis. Wageningen
Agricultural University, Wageningen, Netherlands. 1994.
124. Pollit E, Hathirat P, Kotchabhakdi NJ, et al. Iron deficiency and educational achievement
in Thailand. Am J Clin Nutr. 1989;50(3 Suppl):687–696.
125. Soemantri AG, Pollit E, Kim I. Iron deficiency anemia and educational achievement.
Am J Clin Nutr. 1985;42(6):1221–1228.
126. Taras H. Nutrition and student performance at school. J School Health. 2005;75(6):199–
13.
127. Gillespie S. Major issues in the control of iron deficiencies. The micronutrient initiative.

69
In: Partnership for child development (The world bank,UNFPA,WFP,Unicef). School age
children; their nutrition and health.;www.schoolsandhealth.org.www.child-
development.org.www.imperial.ac.uk/ 2002. (accessed on 12 April 2010).
128. Shisana O, Labadarios D, Rehle T, et al. South African National Health and Nutrition
Examination Survey (SANHNES-1). 2013;Cape Town:HSRC Press.
129. ACC/SCN. Nutrition of the school age child. SCN News.1998;16:3–25.
130. World Bank. Focusing resources on effective school health: a FRESH start to improving
the quality of education (http://wbln0018.worldbank.org/HDnet/Fresh/).2000.
131. Ramakrishnam U. Prevalence of micronutrient malnutrition worldwide. Nutr Rev.
2002;60:546-52.
132. Ash DM, Tatala SR, Frongillo EA, et al. Randomized efficacy trial of a micronutrient
fortified beverage in primary school children in Tanzania. Am J Clin Nutr. 2003;77: 891–
8.
133. Labadarios D, Swart R, Maunder EMW, et al. The National Food Consumption Survey-
Fortification Baseline
(NFCS-FB-I): South Africa, 2005. S Afr J Clin Nutr. 2008;21(3)(Suppl 2):245-300.
134. Keskin Y, moschonis G, Dimitriou M, et al. Prevalence of iron deficiency among
schoolchildren of different scio-economic status in urban Turkey. Eur J Clin Nutr.
2005;59:64-71.
135. Nestel P, Bouis HE, Meenakshi JV, et al. Biofortification of staple food crops. J Nutr.
2006;136:1064–67.
136. Lucca P, Hurrell R, Potrykus I. Genetic engineering approaches to improve the
bioavailability and the level of iron in rice grains. Theor Appl Genet. 2001;102:392–97.
137. Samuelsen AI, Martin RC, Mok DW, et al. Expression of the yeast FRE genes in
transgenic tobacco. J Plant Physiol. 1998;118:51–58.
138. World Health Organization. Guidelines on food fortification with micronutrients.
Geneva: World Health Organization, 2006.
139. Marchetti M. Ashmead H, Tossani N et al. Comparison of the rates of vitamin
degradation when mixed with metal sulphates or metal amino acid chelates. J Food

70
Compst Anal. 2000;13:875–884.
140. Hurrell R, Egli I. Optimizing bioavailability of iron compounds for food fortification in
Nutritional anemia. Ed. Kraemer K and Zimmermann MB, Sight and Life Press, California.
2007.
141. Pineda O, Ashmead HD. Iron-deficiency anemia in infants and young children with
ferrous bisglycinate chelate. Nutrition, 2001;17(5):381-384.
142. Bovell-Benjamin AC et al. Iron absorption from ferrous bisglycinate and ferric
trisglycinate in whole maize is regulated by iron status. AJCN, 2000;71(6):1563-1569.
143. Pineda O et al.. Effectiveness of iron amino acid chelate on the treatment of iron
deficiency anemia in adolescents. J Appl Nutr. 1994;46:1 & 2.
144. Layrisse M, Garcia-Casal MN, Solano L, et al. Iron bioavailability in humans from
breakfasts enriched with iron bis-glycine chelate, phytates and polyphenols. J Nutr.
2000;130(9):2195-2199.
145. Hallberg L, Hulthen L. No advantage in using ferrous bisglycinate as an iron fortificant.
Am J Clin Nutr. 2000;72:1583–93. (letter).
146. Pineda O. Heme and Fe bisglycinate share similar absorption properties. Am J Clin Nutr.
2003;78:493-7. (letter).
147. Lost C, Name JJ, Jeppsen RB, et al. Repleting hemoglobin in iron deficiency anemia in
young children through liquid milk fortification with bioavailable iron amino acid
chelate. J Am Coll Nutr. 1998;17:187–94.
148. Giorgini E, Fisberg M, De Paula RAC, et al. The use of sweet rolls fortified with iron bis-
glycinate chelate in the prevention of iron deficiency anemia in preschool children. Arch
Latinoam Nutr. 2001;51:48–53.
149. Miglioranza LH, Matsuo T, Caballero-Cordoba GM, et al. Effect of long-term fortification
of whey drink with ferrous bisglycinate on anemia prevalence in children and
adolescents from deprived areas in Londrina, Parana, Brazil. Nutrition. 2003;19:419–21.
150. Osman AK, Al-Othaimeen A. Experience with ferrous bis-glycine chelate as an iron
fortificant in milk. Int J Vitam Nutr Res. 2002;72:257–63.

71
151. van Stuijvenberg ME, Smuts CM, Wolmarans P, et al. The efficacy of ferrous bisglycinate
and electrolytic iron as fortificants in bread in iron-deficient schoolchildren. Brit J Nutr.
2006; 95:532–8.
152. ADA Reports. Position of the American Dietetic Association: Fortification and nutrition
supplements. J Am Dietetic Association. 2005;105:1300–1311.
153. Allen L, Gillespie S. What works? A review of the efficacy and effectiveness of nutrition
interventions. United Nations Administrative Committee on Nutrition, Asian
Development Bank, September 2001, pp23-41.
154. Winichagon P, McKenzie JE, Chavasit V, et al. A multifortified seasoning powder
enhances the hemoglobin, zinc and iodine status of primary school children in North
East Thailand: A randomized controlled trial of efficacy. J Nutr. 2006;136:1617–23.
155. Soemantri AG. Preliminary findings on iron supplementation and learning achievement
of rural Indonesian children. Am J Clin Nutr. 1989;50:698–702.
156. Sungthon R, Mo-suwan L, Cngsuvivatwong V, et al. Once weekly and 5 Days a week iron
supplementation differentially affect cognitive function but not school performance in
Thai children. J Nutr. 2004;134:2349–2354.
157. Roschinick N, Parawan A, Baylon MAB, et al. Weekly iron supplementation given by
teachers sustain the hemoglobin concentration of school children in Philipines. Trop
Med and International Health 2004;9(8):904-909.
158. Abrams SA, Mushi A, Hilmers DC, et al. A micronutrient fortified beverage enhances the
nutritional status of children in Botswana. J Nutr. 2003; 133:1834–1840.
159. Gera T, Sachdev HP, Nestel P. Effect of combining multiple micronutrients with an iron
supplementation on Hb response in children: Systematic review of randomized
controlled trials. Public Health Nutr. 2008;12(6):756-773.
160. Pineda O. Heme and Fe bisglycinate share similar absorption properties. Am J Clin Nutr.
2003;78:493-7. (letter).
161. Friis H, Mwaniki D, Omondi B, et al. Effects on hemoglobin of multi –micronutrient
supplementation and multi – helminth chemotherapy: a randomized controlled trial in
Kenyan school children. Eur J of Clin Nutr. 2003;57:573–579.

72
162. Ayoya AM, Spiekermann-Brouwer GM, Traoere-A, et al. Multiple micronutrients
including iron are not more effective than iron alone for improving hemoglobin and iron
status of Malian school children. J Nutr. 2009;139:19721979.
163. Osei AK, Rosenberg IH, Huser RF, et al. Community-level micronutrient fortification of
school lunch meals improved Vitamin A, Folate, and Iron status of schoolchildren in
Himalayan villages of India. J of Nutr. 2010;140:1146-1154.
164. Jinabhai CC, Taylor M, Coutsoudis A, et al. A randomized controlled trial of the effect of
antihelminthic treatment and micronutrient fortification on health status and school
performance of rural primary school children. Annals of Tropical Paediatr. 2001;21:319–
333.
165. Muthayya S, Eilander A, Transler C, et al. Effect of fortification with multiple
micronutrient and n-3 fatty acids on growth and cognitive performance in Indian school
children; the CHAMPION (Children’s Health and Mental Performance Influenced by
Optimal Nutrition) Study. Am J Clin Nutr. 2009;89:1766-75.
166. Kumar M, Rajagoplan S. Impact of a multiple – micronutrient food supplement on the
nutritional status of school children. Food and Nutr Bull. 2006;27(3):203–211.
167. van Stuijvernberg ME, Kvalsvig JD, Faber M, et al. Effect of iron, iodine and B carotene
fortified biscuits on the micronutrient status of primary school children: A randomized
control trial. Am J Clin Nutr. 1999;69:497–503.
168. Taljaard C, Covic NM, van Graan AE, et al. Effects of multi-micronutrient-fortified
beverage, with and without sugar, on growth and cognition in South African
schoolchildren: a randomized, double blind, controlled intervention. Brit J Nutr. 2013;
May:1-4.
169. WHO Anthro Plus software for the global application of the WHO References for 5 – 19
years to monitor growth of school age children and adolescents; 2007.
http://www.who.int/growthref.
170. Bellany C. The state of the world’s children-UNICEF. 2000 pp71 and Tables 1 and 2.
171. Scrimshaw NS. The challenge of global malnutrition to the food industry. Food Technol.
February 1993;60–71.

73
172. Dean AG, Dean JA, Coulombier D, et al. Epi Info Version 6 : a word processing database,
and statistics program for epidemiology on microcomputers. Centre for Disease Control
and Prevention. ATLANTA, Georgia.USA. 1994.
173. Khumalo S. Mineral solubility and consumer acceptability testing of three flavoured
enriched liquid maize based meal supplement. Hons dissertation, University of Pretoria,
2011.
174. FAO/WHO. Requirements of vitamin A, iron, folate and vitamin B12. Report of a joint
consultation FAO Food Nutr Series No 23. Rome: FAO, 1988.
175. Sandstrom B. Micronutrient interactions; effect on absorption and bioavailability. Brit J
Nutr. 2000;85,suppl2:S181–S185.

74
ADDENDUM 1: ETHICAL APPROVAL

75
ADDENDUM 2: ASSENT FORM FOR 7-8 YEARS FOR CLINICAL TRIAL/INTERVENTION RESEARCH
ASSENT FORM FOR PROTOCOL TITLE: Effect of enriched maize-based liquid meal supplement
on the cognitive performance of primary school children.
We wish to know if you would like to volunteer to be part of a research study in which you will
consume a maize – based- ready- to- use meal supplement (let’s call it a maize sip for short).
We are asking you to help us to gather information on the effect of this on learning and
concentration abilities (cognitive performance) and the amount of iron in the bodies of
children. It will also tell us if it improves nutritional status in children like you.
About 160 children are going to take part in this study, and the study will last for 16 weeks over
the first two school terms of the year. During that time you will have to consume one of two
maize sips 5 days a week for the 16 week study period at a specific location at the school. The
sip you will receive will be determined by chance like flipping a coin.
During the study you will undergo different kinds of procedures and tests. We will measure
your weight and height and assess your learning and concentration abilities (cognitive
performance). This will be done before and after the study period. At the beginning and end of
the study, they will also take a tiny amount of blood (5 drops) from your finger. This may hurt,
but will only take a minute. These tests will take about 3 hours in total but will only take place
two times during the whole study.
You will receive deworming medication, 1 tablet, once off before the start of the study. The
unpleasant effects that can occur after taking the medication may include: temporary stomach
pain, diarrhea and vomiting, breaking out with a rash and hives, headaches and agranulocytosis
(sudden fever, shaking and sore throat).We will give you a sickness diary in which you or your
parents must record every time you are ill. It is very important that you tell your doctor, nurse
or your parents if you don’t feel well at anytime during the study.
If you do not want to take part anymore you may decide at anytime during the study to stop
participating, no one will force you to carry on. No one will be cross or upset with you if you
don’t want to. You don’t have to give us your answer now, take your time and read through the
form again before you decide. If you sign at the bottom it will mean that you have read this
paper and that you would like to be in this study.

76
Your name Person obtaining consent Parent /Guardian as
witness
Name
Signature
Date
15 July 2010

77
ADDENDUM 3:
NAME BADGES FOR CHILDREN

78
ADDENDUM 4: COMPLIANCE SHEET
COMPLIANCE JULY – NOV 2010 NAME:……………………………………… ………………………………………………… SUBJECT #: GRADE:………………..
Monday Tuesday Wednesday Thursday Friday COMMENTS
WK1 July 19 20 21 22 23
…………………………………………………………………………………………………………………………………………………………………………………………………………………………………………………………………………………………………………………………………………………………………………………………………………………………………………………………………………………..………………………………………………………………………………………………………………………………………………………………………………………………………………………………………………………………………..………………………………………………………………………………………………………………………………………………………………………………………………………………………………………………………………………..………………………………………………………………………………………………………………………………………………………………………………………………………………………………………………………………………..………………………………………………………………………………………………………………………………………………………………………………………………………………………………………………………………………..………………………………………………………………………………………………………………………………………………………………………………………………………………………………………………………………………..……………………………………………………………………………………………………………………………
WK2 26 27 28 29 30
WK3 2 3 4 5 6
WK4 9 10 11 12 13
Public holiday
WK5 16 17 18 19 20
WK6 23 24 25 26 27
WK7 30 31 Sept. 1 2 3
WK8 6 7 8 9 10
WK9 13 14 15 16 17
WK10 20 21 22 23 24
Schoolholiday
27 28 29 30 Oct. 1
SCHOOL HOLIDAY
WK11 4 5 6 7 8
WK12 11 12 13 14 15
WK13 18 19 20 21 22
WK14 25 26 27 28 29
WK15 Nov. 1 2 3 4 5
WK16 8 9 10 11 12

79
ADDENDUM 5: SOCIO-DEMOGRAPHIC QUESTIONNAIRE Subject no.
Birth date:
Interview date: Child’s name……………………………………………………………………………Gender: M F Address …………………………………………………………………………………Religion………………………………………… ………………………………………………………………………………………………..Mother’s language………………………. Tel :(H)…………………………………………………………………………(W)…………………………………………………………… 1. Relationship to child: Mother Father Grandparent Sibling Aunt/Uncle Other 2.Household composition
Name of household members
Age (yrs)
Gender Family Relationship to the child
Does this person eat and sleep at home at least 4 days a week?
M F Relationship Code Yes No
Relationship (use as child reference): Father (1), Mother (2),Sibling (3),Grandmother (4), Grandfather(5), Aunt (6). Uncle (7), Cousin (8), Friend (9), Other (10)
3. Marital status of mother (tick one)
1 2 3 4 5 6 7 8
Unmarried Married Divorced Separated Widowed Living together
Traditional marriage
Other please specify
Tick one block only for every question
fath
er
Mo
ther
Sib
ling
gran
dm
a
Gra
nd
pa
un
cle
Au
nt
cou
sin
frie
nd
Oth
er
4. Who is mainly responsible for food preparation in the house
1 2 3 4 5 6 7 8 9 10
5. Who decides on what type of foods are bought for the household?
1 2 3 4 5 6 7 8 9 10
6. Who is mainly responsible for serving or feeding the child
1 2 3 4 5 6 7 8 9 10
7. Who is the head of this household?
1 2 3 4 5 6 7 8 9 10
8. Who decides how much is 1 2 3 4 5 6 7 8 9 10

80
Now look at this child and tick one block of every question
9. Would you consider this to be a healthy child?
1 ………………………
2 ……………………
If no, specify
10. Is this child disabled? 1 ………………………..
2 ………………….
If yes, specify
Now decide on the following (considering where the child lives)
11. Type of dwelling: You can tick more than one block if necessary
1 Brick concrete
2 Traditional Mud
3 Tin
4 Plank, wood
5 Other Specify
12. number of people sleeping in the house for at least 4 nights per week?
13. Number of rooms in the house (excluding bathroom, toilet and kitchen, if separate):
14. Number of people per dwelling, living/sleeping (tick one)
1 0-2 persons
2 3-4 persons
3 More than 4 persons
15. Where do you get drinking water from? (tick one)
1 own tap
2 Communal tap
3 River, dam
4 Borehole Well
5 Other specify
16. What type of toilet does this household have? (tick one)
1 Flush
2 pit
3 bucket/ Pot
4 VIP
5 Other specify
17. What fuel is used for cooking most of the time? (you can tick more than one)
1 electric
2 gas
3 paraffin
4 wood
5 sun
6 Open fire
Tick one box only:
18. Does the child’s home have a working (i) Refrigerator/freezer
1 Fridge
2 Freezer
3 Both
4 None
(ii) Stove 1 Yes
2 No
If yes choose one ………………………. Gas, coal, electric
If yes choose one ………………….. With oven without oven
(iii) Primus or paraffin stove 1 Yes
2 No
(iv) Microwave 1 Yes
2 No
(v) Hot plate 1 Yes
2 No
(vi) Radio or Television 1 Radio
2 TV
3 Both
4 None
Now ask questions about:
spent on food?

81
19. Education level of mother (tick only one)
1 None
2 Primary school
3 Std 6 -8
4 Std 9 – 10
5 Tertiary education
6 Don’t know
20. Mother’s employment status (choose one)
1 House wife by choice
2 Unemployed
3 Self- employed
4 Wage earner
5 Other specify
6 Don’t know
21. Education level of caregiver (Tick only one)
1 None
2 Primary school
3 Std 6 -8
4 Std 9 – 10
5 Tertiary education
6 Not applicable
22. Father’s employment status (can tick more than one)
1 Unemployed
2 self employed
3 wage earner
4 retired by choice
5 other specify
6 not applicable e.g. deceased
23. How many people contribute to the total income (Tick one only)
1 1 person
2 2 persons
3 3-4 persons
4 5-6 persons
5 Over 6 persons
24. Household income per month (including wages ,rent, sales of veg. etc, state grants (Tick only one)
1 None
2 R100- R500
3 R500- R1000
4 R1000-R3000
5 R3000-R5000
6 Over R5000
7 Don’t know
25. Is this the usual income of the household? (Tick one box only)
1
2 If NO what other income is available? Specify
26. Is this more or less the income you had over the past six months? (Tick one only)
1 Yes
2 No
27. How much money is spent on food weekly? (Tick one only)
1 R0-R50
2 R50-R100
3 R100-R150
4 R150-R200
5 R200-R250
6 R250-R300
7 R300R350
8 R350-R400
9 Over R400
10 Don’t know
10 Don’t know

82
ADDENDUM 6
SICKNESS DIARY
NAME: _______________________ _________ SUBJECT #:______________
Condition Medication
Start
date
End
date
Name Dosage &
frequency
Start date End date
E.g. Cough 6 Feb
2010
8 Feb
2010
BRONCLEER 5ml
3 times a day
6 Feb
2010
8 Feb
2010

83