efferent projections of the ectostriatum in the pigeon (columba livia)
TRANSCRIPT

Efferent Projections of the Ectostriatumin the Pigeon (Columba livia)
SCOTT A. HUSBAND1 AND TORU SHIMIZU1,2*1Department of Psychology, University of South Florida, Tampa, Florida 33620
2Department of Surgery, University of South Florida, Tampa, Florida 33620
ABSTRACTThe ectostriatum is a major visual component of the avian telencephalon. The core region
of the ectostriatum (Ec) receives visual input from the optic tectum through thalamic nuclei.In the present study, the efferent projections of the ectostriatum were investigated by usingthe anterograde tracers Phaseolus vulgaris leucoagglutinin and biotinylated dextran amine.Projection patterns resulting from these tracers were confirmed by the retrograde tracercholera toxin subunit B. When anterograde tracers were injected in Ec, primary projectionswere seen traveling dorsolaterally to the belt region of the ectostriatum (Ep) and theneostriatal area immediately surrounding Ep (Ep2). Neurons in Ep sent projections primarilyto the overlying Ep2. The efferents of Ep2 traveled dorsolaterally to terminate in threetelencephalic regions, from anterior to posterior: (1) neostriatum frontale, pars lateralis(NFL), (2) area temporo-parieto-occipitalis (TPO), and (3) neostriatum intermedium, parslateralis (NIL). A part of the archistriatum intermedium and the lateral part of theneostriatum caudale also received somewhat minor projections. In addition, some neurons inEc were also the source of direct, but minor, projections to the NFL, TPO, NIL, andarchistriatum intermedium. The topographical relationship among the primary (Ec), second-ary (Ep and Ep2), and tertiary (NFL, TPO, NIL) areas indicate that the neural populations forvisual processing are organized along the rostral-caudal axis. Thus, the anterior Ec sentefferents to the anterior Ep, which in turn sent projections to anterior Ep2. Neurons in theanterior Ep2 sent projections to NFL and the anterior TPO. Similarly, the intermediate andposterior Ec sent projections to corresponding parts of Ep, whose efferents projected tointermediate and posterior Ep2, respectively. The intermediate Ep2 gave rise to majorprojections to TPO, whereas posterior Ep2 neurons sent efferents primarily to NIL. Theorganization of this neural circuit is compared with those of other sensory circuits in the aviantelencephalon, as well as the laminar arrangement of the mammalian isocortex. J. Comp.Neurol. 406:329–345, 1999. r 1999 Wiley-Liss, Inc.
Indexing terms: birds; tectofugal; telencephalon; tract-tracing
The ectostriatum is a large visual structure in the aviantelencephalon. It receives major thalamic input from thenucleus rotundus thalami (Rt) and its subnucleus triangu-laris through the fasciculus prosencephali lateralis (FPL;Karten and Hodos, 1970). The Rt and triangularis in turnreceive input from the optic tectum (TeO; Karten andRevzin, 1966; Revzin and Karten, 1967). The visual routethrough the retina, TeO, Rt, and ectostriatum is called thecollothalamic (Butler and Hodos, 1996) or tectofugal path-way (Karten and Revzin, 1966; Karten and Hodos, 1970).
The ectostriatum consists of two divisions: a core (Ec)and a belt region (Ep). The Ec contains predominantlyround, medium-sized cells and heavily myelinated axonsoriented in a radial manner perpendicular to the laminamedullaris dorsalis (LMD; Karten and Hodos, 1970). Incontrast, neurons in Ep tend to be smaller, elongated, and
possess thinly myelinated axons (Karten and Hodos, 1970).Only neurons of Ec receive Rt input (Karten and Hodos,1970; Benowitz and Karten, 1976; Watanabe et al., 1985),whereas neurons in Ep receive efferents from Ec neurons(Karten and Hodos, 1970; Ritchie, 1979).
Lesions in any of the structures of the collothalamicpathway result in serious deficits in various visual tasks,such as brightness, color, and pattern discriminations
Grant sponsor: NASA; Grant number: NAG2–1000; Grant sponsor: NSF;Grant number: IBN 9209538; Grant sponsor: University of South Florida,Faculty Development Award.
*Correspondence to: Toru Shimizu, Department of Psychology, BEH 339,4202 E. Fowler Ave., Tampa, FL 33620. E-mail: [email protected]
Received 9 June 1998; Revised 20 November 1998; Accepted 23 Novem-ber 1998
THE JOURNAL OF COMPARATIVE NEUROLOGY 406:329–345 (1999)
r 1999 WILEY-LISS, INC.

(Hodos and Karten, 1966, 1974; Cohen, 1967; Hodos,1969). Such lesions can also result in significant reduc-tions in thresholds for the discrimination of brightness,spatial frequency, and size stimuli (Hodos and Bonbright,1974; Macko and Hodos, 1984; Kertzman and Hodos,1988). In particular, lesions in the ectostriatum (Ec andEp) cause severe, and sometimes irreversible, deficits invisual performance (Hodos and Karten, 1970; Hodos et al.,1984, 1986, 1988; Bessette and Hodos, 1989). Lesions ofthe ectostriatum can also affect the cognitive ability ofpigeons to distinguish between natural concepts (e.g.,food/nonfood) and conspecific individuals (Watanabe, 1991,1992).
Despite the importance of the ectostriatum in visualdiscrimination tasks, little is known about the telence-phalic circuits involving this structure (Ritchie, 1979). Thepresent study further investigates the connections of theectostriatum by using anterograde and retrograde tracingmethods. The present study also used immunohistochemi-cal methods to visualize the distribution patterns of twocalcium-binding proteins: parvalbumin (PV) and calbindin(CB). They have been demonstrated as neuromarkers forseveral anatomical structures, including the collothalamicvisual system, although their functional significance invisual processing is not clear (Braun et al., 1985, 1988).Preliminary data from this study have been publishedpreviously in abstract form (Husband et al., 1995; Hus-band and Shimizu, 1997).
MATERIALS AND METHODS
The study used a total of 37 adult White Carneauxpigeons (Columba livia) of both sexes as subjects, obtainedeither from Palmetto Pigeon Plant, Sumter, SC, or DoubleT Farms, Glenwood, IA. The birds had free access to waterand food (Purina pigeon chow) with weights typicallyranging from 500 to 600 grams. Subjects were kept in anAmerican Association for Accreditation of Laboratory Ani-mal Care certified housing facility under a 12-hour lightand dark cycle and were housed in individual cages toreduce the chance of postsurgical infections. The animalswere humanely treated in accordance with the National
Institutes guidelines, and the procedures were approvedby the Institutional Animal Care and Use Committee.
Anterograde tracing experiments
Before the surgery, subjects were food deprived for atleast 8 hours, with free access to water. The birds weredeeply anesthetized with an intramuscular (i.m.) injectionof ketamine (Aveco Co., Fort Dodge, IA; 40 mg/kg of bodyweight) and xylazine (Lloyd Laboratories, Shenandoah,IA; 10 mg/kg of body weight) and then placed in astereotaxic apparatus (David Kopf Instruments, Tujunga,CA). The coordinates of the injection sites were set per thestereotaxic atlas of the pigeon brain (Karten and Hodos,1967). Because earlier studies (Husband et al., 1995;Husband and Shimizu, 1997) indicated neither hemi-spheric asymmetries in the efferent patterns nor interhemi-spheric connections in the areas under consideration,injections were made bilaterally in eight subjects.
In nine subjects, injections of either a 2.5% solution ofPhaseolus vulgaris leucoagglutinin (PHA-L; Vector Labora-tories, Burlingame, CA) in 0.05 M phosphate buffer (PB,pH 7.4) or a 10% solution of 10,000 MW biotinylateddextran amine (BDA; Molecular Probes, Inc., Eugene, OR)in 0.01 M PB were administered. They were injectediontophoretically by means of glass micropipettes, with atip size of 10–20 µm in diameter. The parameters ofiontophoretic injection were a constant anodal current of3.5–5.0 µA on a 7 seconds on/off cycle for a total of 5–20minutes to deposit a small amount of each tracer. After thecompletion of the procedure, subjects were returned totheir home cages with free access to food and water.
After a survival period of 7–10 days, the subjects weredeeply anesthetized by means of an overdose of ketamineand xylazine (i.m.) and transcardially perfused with a0.9% saline solution followed by ice-cold 4% paraformalde-hyde in 0.1 M PB. The brains were post-fixed for 6 to 12hours at 4°C in the fixative, followed by immersion in a30% sucrose solution in PB for at least 12 hours at 4°C forcryoprotection. The brains were frozen in dry ice and thencut in 30- or 40-µm transverse sections on a slidingmicrotome. Sections were washed three times at 10 min-utes each in PB at room temperature.
Abbreviations
A archistriatumABC avidin-biotinylated horseradish peroxidase complexADVR anterior dorsal ventricular ridgeAi archistriatum intermediumBas nucleus basalisBDA biotinylated dextran amineCB calbindinCe central division of nucleus rotundusCTb cholera toxin subunit BDa dorsal anterior division of nucleus rotundusDAB diaminobenzidine tetrahydrochlorideDLL nucleus dorsolateralis anterior thalami, pars lateralisDMA nucleus dorsomedialis anterior thalamiEc core ectostriatumEp peri-ectostriatal beltEp2 neostriatum immediately surrounding EpFA tractus fronto-archistriatalisFPL fasciculus prosencephali lateralisHA hyperstriatum accessoriumHD hyperstriatum dorsaleHV hyperstriatum ventraleHVvl hyperstriatum ventrale, pars ventro-lateralisL1, L2, L3 subdivisions of the Field L complexLH lamina hyperstriatica
LMD lamina medullaris dorsalisLPO lobus paraolfactoriusMN medial neostriatumN neostriatumNCL neostriatum caudale, pars lateralisNCM neostriatum caudale, pars medialisNCT neostriatum caudale (trigeminalis)Nd neostriatum dorsalisNFT neostriatum frontale (trigeminalis)NFL neostriatum frontale, pars lateralisNIL neostriatum intermedium, pars lateralisOM tractus occipitomesencephalicusOv nucleus ovoidalisPA paleostriatum augmentatumPE pallium externumPHA-L Phaseolus vulgaris leucoagglutininPost posterior division of nucleus rotundusPV parvalbuminRt nucleus rotundus thalamiT triangularisTeO tectum opticumTPO area tempo-parieto-occipitalisTrO tractus opticus
330 S.A. HUSBAND AND T. SHIMIZU

For PHA-L, tissue sections were incubated overnight ina solution of goat anti-PHA-L serum (dilution 1:10,000;Vector Laboratories) and 0.3% Triton X-100 (Sigma Chemi-cal Co., St. Louis, MO) in PB at 4°C. Sections were washedin PB at room temperature for 30 minutes, and thenincubated for 1 hour in a solution of biotinylated anti-goatantiserum (1:200; Vector Laboratories) and 0.3% TritonX-100 in PB at room temperature. Tissues were washed for30 minutes in PB and then reacted with an avidin-biotinreagent (ABC Elite Kit, Vector Laboratories) in 0.3%Triton X-100 in PB with 2% NaCl (to lower nonspecificbinding) for 1 hour. Sections were washed in PB andreacted in 0.025% diaminobenzidine (DAB, Sigma) and0.3% hydrogen peroxide in PB for 20 minutes. Sectionswere mounted on glass slides, dehydrated in an ethanol/xylene series, and coverslipped with Permount (FisherScientific, Fair Lawn, NJ).
For BDA processing, sections were first incubated in theavidin-biotin reagent in 0.3% Triton X-100 in PB for 1 hourat room temperature. The tissues were then reacted in asolution of 0.025% DAB and 0.025% nickel ammoniumsulfate (Fisher) with 0.3% hydrogen peroxide for approxi-mately 20 minutes. These sections were then dehydratedand coverslipped as indicated for PHA-L.
Retrograde tracing experiments
In 24 subjects, a small amount of a 1% solution of choleratoxin subunit B (CTb; List Laboratories, Campbell, CA)was injected. The tracer was delivered through glassmicropipettes (10–20 µm in diameter) by an air pressuresystem (Picospritzer II, General Valve Corp, Fairfield, NJ).The parameters for injection were 5–15 pulses of 10 msecper pulse at 20 p.s.i.
After a 2–3 day survival period, subjects were deeplyanesthetized and transcardially perfused as described forthe anterograde experiments above. Sections were imuno-histochemically visualized with overnight incubation at4°C in a solution of goat antiserum against CTb (1:10,000;List Laboratories). Tissues were then incubated in asolution of biotin conjugated anti-goat antiserum (1:200;Vector Laboratories), then in the avidin-biotin reagent(ABC Elite Kit, Vector Laboratories), and finally reactedwith DAB and hydrogen peroxide as described previouslyfor the anterograde experiments.
Immunohistochemistry for calciumbinding proteins
By using immunohistochemical methods, tissues of foursubjects were processed to visualize the distribution pat-tern of two calcium-binding proteins: PV and CB. Theantibodies were a monoclonal mouse anti-PV antibody(dilution 1:10,000; Sigma) and a monoclonal mouse anti-CBantibody (1:10,000; Sigma). The tissues were then washedin PB followed by 1 hour of incubation at room tempera-ture in an appropriate biotinylated secondary antibody(Vector Laboratories) and 0.3% Triton X-100 at a dilutionof 1:200. Afterward, the tissues were processed accordingto the avidin-biotin complex method as described above.Control staining was accomplished by the omission of theprimary antibody.
Additional histochemical proceduresand data analysis
Alternate sections of brain tissue from each experimentwere stained either with cresyl violet (Sigma) or Giemsadye (EM Diagnostic Systems, Gibbstown, NJ; Iniguez et
al., 1985) to visualize major nuclear groups and subdivi-sions. The tissues were examined by using a macroscope(Wild Makroskop) and a microscope (Nikon Microphot FX).The results were photographed and/or recorded throughcamera lucida. Some photographs presented in the figuresare digital images acquired by using a Leaf Luminascanning CCD camera (Leaf System, Inc., Southborough,MA) mounted on either the macroscope or the microscope.Other images were photographed on film with a 35-mmNikon camera. Digital images were loaded into AdobePhotoshop software as black and white positive images(Adobe Systems, Inc., Mountain View, CA) with a Macin-tosh Power PC. Brightness and contrast were adjusted forthe final images. No additional filtering or manipulation ofthe images was performed.
For cases with BDA injections, although the tracer wastransported primarily in an anterograde manner, therewere also some retrogradely labeled fibers evident afterthe injection. Labeled fibers were all recorded and appearin the drawings whether they were anterogradely orretrogradely labeled. Distinction between anterograde andretrograde fibers were made based on the existence ofretrogradely labeled cell bodies.
RESULTS
General findings
There were two main findings in the present study.First, the study showed that Ec sent major projectionsdorsolaterally to Ep and the immediately surroundingneostriatal area of Ep (named Ep2 by Ritchie, 1979). Theefferents of Ep projected primarily to the overlying Ep2,which is located ventral to the lamina hyperstriatica (LH),medial to the area temporo-parieto-occipitalis (TPO), andlateral to the medial portion of the neostriatum (MN).Neurons in Ep2 sent projections that traveled furtherdorsolaterally to terminate in at least three regions extend-ing from the rostral to caudal telencephalon: neostriatumfrontale, pars lateralis (NFL), TPO, and neostriatumintermedium, pars lateralis (NIL, named by Ritchie, 1979).A part of the archistriatum intermedium (Ai) and thelateral part of the neostriatum caudale (NCL) also re-ceived somewhat smaller projections. The experimentsalso indicated minor, direct projections from some Ecneurons to NFL, TPO, NIL, and Ai. The locations of NFL,TPO, NIL, Ai, and NCL are depicted in Figure 1, which is aseries of schematic representations of the pigeon telen-cephalon. No extratelencephalic output directly from theectostriatum was observed.
The second main finding of the current study is thatectostriatal projections were organized along the rostral-caudal axis, corresponding to the organization of its tha-lamic afferents from Rt. Thus, the anterior Rt sent projec-tions to the rostral Ec, which in turn sent projectionsdirectly and indirectly (by means of Ep and Ep2) rostrallyto NFL and dorsolaterally to a rostral portion of TPO.Similarly, neurons of the central part of Rt sent projectionsto the intermediate aspect of Ec, which sent direct andindirect projections (by means of Ep and Ep2) to mainly,but not exclusively, the intermediate TPO. The caudal Ecreceived projections primarily from the posterior Rt; thisportion of Ec then sent direct and indirect efferents (bymeans of Ep and Ep2) to the caudal TPO and NIL, withminor projections to Ai and NCL.
VISUAL PROJECTIONS IN THE AVIAN TELENCEPHALON 331

Organization of the ectostriatum
The left and middle columns of Figure 2 show differentlevels of the ectostriatum along the rostral-caudal axis.The ectostriatum (Ec and Ep) is a large dome-shaped massembedded in the basal neostriatum, just dorsal to LMD,which separates the neostriatum from the paleostriatumaugmentatum (PA; avian equivalent of the mammaliancaudate-putamen). At its rostral margin, the ectostriatumappears ventrolaterally (A 11.0) just as the trigeminalnucleus basalis (Bas in Fig. 1), located anterior to theectostriatum, gradually disappears. The Ec occupies theventral portion of the ectostriatum, immediately dorsal toLMD, whereas Ep is located dorsolateral to Ec. Movingcaudally, the ectostriatum becomes larger and shifts medi-ally (A 10.0 and A 9.0). The topologic relationships of theventral Ec and dorsolateral Ep remain the same until themost caudal margin of the ectostriatum (A 8.0). At thecaudal ectostriatum, Ep is now found directly dorsal toLMD, and Ec is located dorsolateral to Ep. As the ectostria-tum disappears, the auditory Field L appears medially.
In addition to the connections with Rt, Ec and Ep can bedifferentiated by the distribution pattern of a calcium-binding protein, PV (Braun et al., 1985). Neurons andneuropil of both Ec and Ep showed an intense PV-likelabeling, whereas the surrounding Ep2 contained onlyfaintly stained PV-positive cells and faintly labeled neuro-pil, as seen in the middle column of Figure 2.
The Ec tended to contain many PV-positive cells as wellas densely packed processes. In contrast, Ep containedonly a few scattered, intensely stained cells.
Afferent projections of the ectostriatum
The division of Rt into several subgroups has previouslybeen suggested based on its connections (Benowitz andKarten, 1976; Nixdorf and Bischof, 1982; Mpodozis et al.,1996) and chemical contents (Martinez-de-la-Torre et al.,1990). By using the distribution pattern of CB-like label-ing, the dorsoanterior division of Rt (Da) was clearlydistinguishable from the rest of Rt with its intense neuro-pil staining, as seen in the right column of Figure 2.
Retrograde experiments with CTb in Ec, as well asretrograde tracing results from some BDA injections in Ec,revealed a topographically organized projection from Rt tothe ectostriatum (Fig. 3) . Injections of tracers centered onthe most rostral Ec (A 10.75) resulted in labeled cellsmainly in the Da (the left column of Fig. 3). A deposit of atracer into the intermediate and caudal Ec, however,demonstrated no labeled cells in Da (middle and rightcolumns of Fig. 3).
When an injection of CTb was centered on the intermedi-ate Ec (A 9.75), retrogradely labeled neurons were mostlyfound in the central division (Ce in Fig. 2), but also in theposterior division (the middle column of Fig. 3). A depositof CTb centered on the very caudal Ec (A 8.50) resulted inmany labeled cells in the posterior Rt (Post in Fig. 2), withsome also observed in Ce (the right column of Fig. 3). A fewneurons were seen in the nucleus triangularis after tracerswere deposited in any part of Ec. After small injectionsrestricted to Ec, many labeled cells were seen in theventrolateral portion of the hyperstriatum ventrale (HVvl),but not in Ep and Ep2, within the telencephalon.
Efferents of the core region of ectostriatum
Figure 4 depicts labeled fibers after an iontophoreticinjection of BDA (Fig. 4A) or PHA-L (Fig. 4B,C) centeredon Ec. When the tracer did not spread into Ep, PA, or Ep2(Fig. 4A,B), the projection from Ec predominantly traveledin the dorsolateral direction to enter Ep and Ep2, wherethe fibers showed terminal-like collaterals and varicosities(Fig. 4C). A few anterogradely labeled fibers entered andterminated in the areas surrounding Ep2, including NFLand TPO (Fig. 4A). Some labeled fibers were also seentraveling (1) dorsally across LH to HVvl, or (2) ventrallythrough FPL. However, these fibers were probably retro-gradely labeled because a number of BDA or PHA-Lstained cell bodies were also found in HVvl and Rt. Nofibers traveled medially to enter the neostriatum medial tothe ectostriatum. The projection from Ec to Ep and Ep2was confirmed by injections of BDA in Ep and Ep2. When a
Fig. 1. Schematic hemisections of the pigeon telencephalon at the rostral (left), intermediate (center),and caudal (right) levels depict the location of the ectostriatum, its three major projection regions(hatched), and two minor projection regions (dotted) discussed in the present study. For abbreviations, seelist.
332 S.A. HUSBAND AND T. SHIMIZU

small injection of BDA was centered on Ep, which did notspread into Ec, retrogradely labeled cell bodies wereobserved mostly in Ep and Ec (Fig. 4D). A very fewretrogradely labeled cells were seen in Ep2 and HVvl, andno cells were observed in either NFL, TPO, NIL, or Rt.
Efferents of the rostral ectostriatum
When an anterograde tracer (PHA-L or BDA) wasdeposited in Ep and the surrounding Ep2, extensive
projections were seen in multiple telencephalic areasbeyond the ectostriatum. There were no discernible differ-ences between the two tracers in the pattern of efferents.Due to the close proximity of Ec, Ep, and Ep2 regions, mostinjections encroached to varying extents on at least two ofthese three structures. However, it appeared that muchmore dense projections were seen when the primary focusof the injection included Ep and Ep2. The observed differ-ences in the density of labeled fibers could be partly
Fig. 2. Schematic transverse hemisections of Ec and Ep (left) at therostral to caudal levels (from top to bottom). Parvalbumin-positivesections (middle) at the levels approximately corresponding to the leftschematic sections; the dashed lines indicate the boundaries of Ec and
Ep. Calbindin-positive transverse sections of Rt (right) at the rostralto caudal levels (from top to bottom). For abbreviations, see list. Scalebars 5 1 mm.
VISUAL PROJECTIONS IN THE AVIAN TELENCEPHALON 333

Fig. 3. Topographic organization of Rt projection to Ec, based on retrograde tract-tracing methods thatuse BDA. The top row shows the injection site in black, and the next four rows depict retrogradely labeledcell bodies (dots) in Rt and surrounding areas at the rostral to caudal levels (from top to bottom). Forabbreviations, see list.

Fig. 4. A: Camera lucida drawings of anterograde projections after a BDA injection in Ec (black). Hatched area indicates a massive projectionto Ep. BDA labeled fibers are also seen in Ep2, TPO, NFL, as well as HVvl. B,C: Brightfield photomicrographs showing an iontophoretic injectionof PHA-L in Ec (B) and PHA-L labeled fibers and their varicosities in Ep2 resulting from the injection (C). In B, the dashed lines indicate theboundaries of Ec and Ep, and the arrow heads indicate LMD. The field shown in C is indicated by the arrow shown in B. D: Camera lucidadrawings of injection sites of BDA centered on Ep and Ep2 (black). Dots represent retrogradely labeled cell bodies. For abbreviations, see list.Scale bar 5 1 mm in B, 100 µm in C.

explained by the possibility that injections in Ep and Ep2also labeled fibers of passage from Ec traveling to telence-phalic areas beyond Ep and Ep2. Experiments that use aretrograde tracer suggest, however, that Ep2 is the pri-mary source of efferents to other telencephalic areas. Theresults of retrograde experiments are presented in aseparate section below.
Figure 5 is a series of camera lucida drawings of a BDAinjection into the rostral ectostriatum. The labeled fibersshown are representative of the results from these experi-ments. The injection site (A 11.00 of Fig. 5) was primarilyconfined to Ep and Ep2, with minimal encroachment onEc. The BDA labeled fibers from the rostral Ep and Ep2took either a rostrolateral or a dorsolateral course. Theformer projection formed a prominent terminal field inNFL. The latter projection entered and terminated in therostral portion of dorsolateral TPO; only a few labeledfibers were seen in the caudal TPO. There were also a fewretrogradely labeled cells in HVvl and Rt, and labeledpassing fibers in PA and FPL.
Figure 8A,B are photomicrographs taken from anotherBDA injection case, different from the case depicted in
Figure 5. However, the location and size of the twoinjections were similar. Prominent retrogradely labeledfibers and cells were seen in Ec, and extensive antero-gradely labeled fibers were observed traveling dorsolater-ally through Ep2 (Fig. 8A). Figure 8B shows labeled fiberswhich enter into NFL, where they exhibited terminal-likevaricosities; there was little such labeling seen dorsal toLH. The corresponding location of the presumptive termi-nal field seen in Figure 8B is indicated by the large arrowin A 12.75 of Figure 5.
Efferents of the intermediate ectostriatum
Injections of PHA-L or BDA into the intermediate part ofEp and Ep2 consistently resulted in labeled fibers travel-ing dorsolaterally, with termination in a dorsolateralportion of TPO (Fig. 6). Figure 6 is a series of drawingsfrom a BDAinjection (black) into the intermediate ectostria-tum. The injection was centered on Ep with spread to Ecand Ep2 (A 9.75 of Fig. 6). Labeled fibers were seenprojecting dorsolaterally, terminating in a circumscribedarea of the dorsolateral TPO (A 8.50 of Fig. 6) whereprominent terminal-like varicosities and collaterals were
Fig. 5. Series of camera lucida drawings through the rostrocaudalextent of the telencephalon schematically illustrates the location andpattern of both anterogradely and retrogradely labeled fibers, follow-ing an injection of biotinylated dextran amine (BDA) in the rostral
portion of Ep and Ep2 (A 11.00). The thick arrow in A 12.75 indicatesthe corresponding terminal fields shown in Figure 8B. For abbrevia-tions, see list.
336 S.A. HUSBAND AND T. SHIMIZU

observed. A few fibers were also seen in NFL (A 12.75 ofFig. 6) and NCL (A 7.50 of Fig. 6). After BDA injections,retrogradely labeled cells were also seen in HVvl and Rt,as well as labeled passing fibers in PA and FPL (e.g., A 8.50of Fig. 6).
Figure 8C is a photomicrograph showing the injectionsite and labeled fibers traveling dorsolaterally in the samecase depicted in Figure 6. The large arrow in A 8.50 ofFigure 6 indicates the location of the field shown in Figure8D, which shows presumptive terminals in the dorsolat-eral TPO.
Efferents of the caudal ectostriatum
Injections of PHA-L or BDA into the caudal portions ofEp and Ep2 resulted in labeled fibers projecting primarilycaudally to NIL and TPO. Figure 7 is a series of cameralucida drawings showing the labeled fibers resulting fromsuch an injection of BDA. The injection site (black), asshown in A 8.25 of Figure 7, was centered in the caudal Epand Ec with some encroachment on Ep2, but no spread toPA. The majority of BDA-positive fibers took a caudaltrajectory and traveled dorsally to terminate in NIL and
the caudal TPO (A 7.50 of Fig. 7). The NIL is a well-circumscribed area dorsocaudal to the ectostriatum andmedial to the tractus archistriatalis dorsalis. A few labeledfibers were also found in Ai and NCL (A 7.00 of Fig. 7).
Figure 8E,F,G, and H is a photomicrograph showing aninjection site of BDA in the caudal ectostriatum (8E) andthe putative terminal fields in NIL (8F,G) and Ai (8H) thatresulted from the injection. The large arrows in A 7.5 and A7.00 of Figure 7 indicate the locations of the areas fromwhich the photomicrographs in Figure 8F,H was taken.Labeled fibers showed terminal-like varicosities in Ai (8H),but they were not as dense as in NIL (8F). Figure 8G is ahigher magnification photomicrograph showing such fi-bers and terminal-like varicosities in NIL.
Retrograde confirmation of efferent patterns
Rostral ectostriatum. The projection from the rostralEp and Ep2 to NFL was confirmed with injections of CTbinto NFL. Figure 9A shows a schematic representation ofan injection site (black) and spread (hatched) of CTb inNFL, with retrogradely labeled cells (dots) near the injec-tion site. After the injection, numerous CTb-positive cell
Fig. 6. Series of camera lucida drawings through the rostrocaudalextent of the telencephalon schematically illustrates the location andpattern of both anterogradely and retrogradely labeled fibers, follow-
ing an injection of BDA in the intermediate portion of Ep and Ep2(A 9.75). The thick arrow in A 8.50 indicates the correspondingterminal fields shown in Figure 8D. For abbreviations, see list.
VISUAL PROJECTIONS IN THE AVIAN TELENCEPHALON 337

bodies and dendritic processes were seen in the rostralEp2, particularly the mediodorsal and ventrolateral por-tions (Fig. 9B). In addition, a moderate number of labeledcells were found in Ec. The CTb-positive neurons in Ep2(Fig. 10B) tended to be more intensely stained in compari-son to those in Ec (Fig. 10A). Although the injection sitewas confined ventrally to the LH, many retrogradelylabeled neurons were also seen in HV.
There was a marked lack of labeled cells and processesin the more caudal sections of Ec, Ep, and Ep2, whichconfirmed the findings of the anterograde experimentsthat only the rostral ectostriatum was the source ofefferents to NFL. No stained cells were found in a neostria-tal area medial to NFL, referred to as the trigeminal
neostriatum frontale (NFT, Wild et al., 1985), whichreceives somatosensory efferents from the nucleus basalis(Bas).
Intermediate ectostriatum. Injections of CTb into thedorsolateral TPO revealed stained cell bodies concentratedin the intermediate Ep2, with a few labeled cells observedin Ec and Ep. Figure 9C is a schematic figure showing suchan injection site in TPO, accompanied by a photomicro-graph of the ectostriatum and its surrounding area (Fig.9D). Densely stained CTb-positive cells were seen in Ep2,as indicated by the drawing and photograph of these cellsin Figure 9C,D. Labeled cells were found predominantly inthe intermediate part of the ectostriatum and Ep2, confirm-ing the findings of the anterograde experiments.
Fig. 7. Series of camera lucida drawings through the rostrocaudalextent of the telencephalon schematically illustrates the location andpattern of both anterogradely and retrogradely labeled fibers, after aninjection of BDA in the caudal portion of Ep and Ep2 (A 8.25). The
thick arrows in A 7.50 and A 7.00 indicate the corresponding terminalfields shown in Figure 8F and H, respectively. For abbreviations, seelist.
338 S.A. HUSBAND AND T. SHIMIZU

Fig. 8. A,C,E: Brightfield photomicrographs of iontophoretic injec-tions of BDA in the rostral (A), intermediate (C), and caudal (E)portions of Ep and Ep2. The white dashed lines indicate the bound-aries of Ec and Ep, and the black dashed lines in C and E indicate theLH. B,D,F,H: Darkfield photomicrographs of terminal fields in NFL(B) resulting from the injection depicted in A, TPO (D) resulting from
the injection in C, and NIL (F) and archistriatum (H) resulting fromthe injection in E. G: Photomicrograph of BDA-labeled fibers andvaricosities in NIL resulting from the injection depicted in E. Forabbreviations, see list. Scale bars 5 500 µm in A,C,E, 100 µm inB,D,F,H, 50 µm in G.

Fig. 9. A,C,E,G: Camera lucida drawings of injection sites ofCTb (black) with spread beyond (hatched) in NFL (A), TPO (C), NIL(E), and Ai (G). Dots represent retrogradely labeled cell bodies.B,D,F,H: Darkfield photomicrographs of retrogradely labeled neuronsin Ec, Ep, and Ep2 resulting from the injections shown in the correspond-
ing photographs of the left column. The dashed lines indicate eitherthe LH (ventral to HV) or the boundaries of Ec and Ep. Arrowheads inB, D, F, and H indicate LMD. The field depicted in each photographapproximately corresponds to A 11.0, 10.0, 8.0, and 9.0, respectively.For abbreviations, see list. Scale bars 5 500 µm in B,D,F,H.

Caudal ectostriatum. Confirmation of the projectionsfrom the caudal ectostriatum was accomplished with injec-tions of CTb into NIL and Ai. Figure 9E–H shows drawingsand photomicrographs of two representative cases fromthese experiments. The sites of CTb injection (black), withsome tracer spread (hatched), are depicted in Figure 9E forNIL and Figure 9G for Ai. After CTb injections in NIL,retrogradely labeled cell bodies were observed in thecaudal Ep2 along with a few in Ec, as shown in thephotomicrograph (Fig. 9F). In addition, a group of labeledcells were found in Ai, lateral to the tractus occipitomesen-cephalicus (OM) (Fig. 10C). Very few cells were seenscattered in the rostral Ep2, and no cells were seen in themedial neostriatum. The injection depicted in Figure 9 wasrather large, including spread to HV. However, smallerinjections of BDA confined to NIL also resulted in a similardistribution pattern of retrogradely labeled cells. Figure10D shows a photomicrograph of labeled neurons in Ep2dorsolateral to the ectostriatum after such a small BDAinjection in NIL. A CTb injection in Ai depicted in Figure9G resulted in retrogradely labeled cells mainly in thedorsal portion of Ep2 and the medial portion of Ec. A fewcells were also seen in Ep.
DISCUSSION
The results show that Ec sends a projection dorsolater-ally to Ep, which in turn sends efferents to the immedi-
ately surrounding Ep2. The efferents of Ep2 travel furtherdorsolaterally to terminate in at least three major telence-phalic regions: NFL, TPO, and NIL. Somewhat smallerprojections were also observed to Ai and NCL. Minor,direct projections from Ec neurons to NFL, TPO, NIL, andAi were also identified. Ectostriatal projections showed arostral-caudal topography, corresponding to its relation-ship with its afferents from Rt. Thus, the anterior Rt sendsprojections to the rostral Ec. Neurons of the rostral Ec sendprojections to the rostral Ep2 by means of Ep. Efferents ofthe rostral Ep2 project rostrally to NFL and dorsolaterallyto a rostral part of TPO. Similarly, neurons in the centraland posterior parts of Rt send projections to the intermedi-ate and caudal Ec, respectively. Neurons of the intermedi-ate Ec send projections to the intermediate Ep2 (by meansof Ep), then to the intermediate TPO. The caudal portion ofEc sends projections to caudal Ep2 (by means of Ep), whichis the source of projections that take a caudal trajectory tothe caudal TPO and NIL.
Serial arrangement in sensory processing
The present data indicate that visual information in thecollothalamic pathway is processed through at least threetelencephalic populations that exhibit a serial arrange-ment: (1) Ec to (2) Ep and Ep2 to (3) NFL, TPO, and NIL.Figure 11 schematically summarizes the findings of thepresent study. The Ec projects predominantly to the sur-
Fig. 10. Brightfield photomicrographs of retrogradely labeled neu-rons in Ec (A) and Ep2 (B) after an injection of CTb in NFL, depicted inFigure 9A. C:Photomicrograph of retrogradely labeled neurons in Airesulting from an injection of CTb in NIL, depicted in Figure 9E.
D: Photomicrograph of retrogradely labeled neurons in Ep2 resultingfrom an injection of BDA confined to NIL, which was similar in locationto, but smaller than, that of the CTb injection shown in Figure 9E. Forabbreviations, see list. Scale bars 5 50 µm in A,B,D, 200 µm in C.
VISUAL PROJECTIONS IN THE AVIAN TELENCEPHALON 341
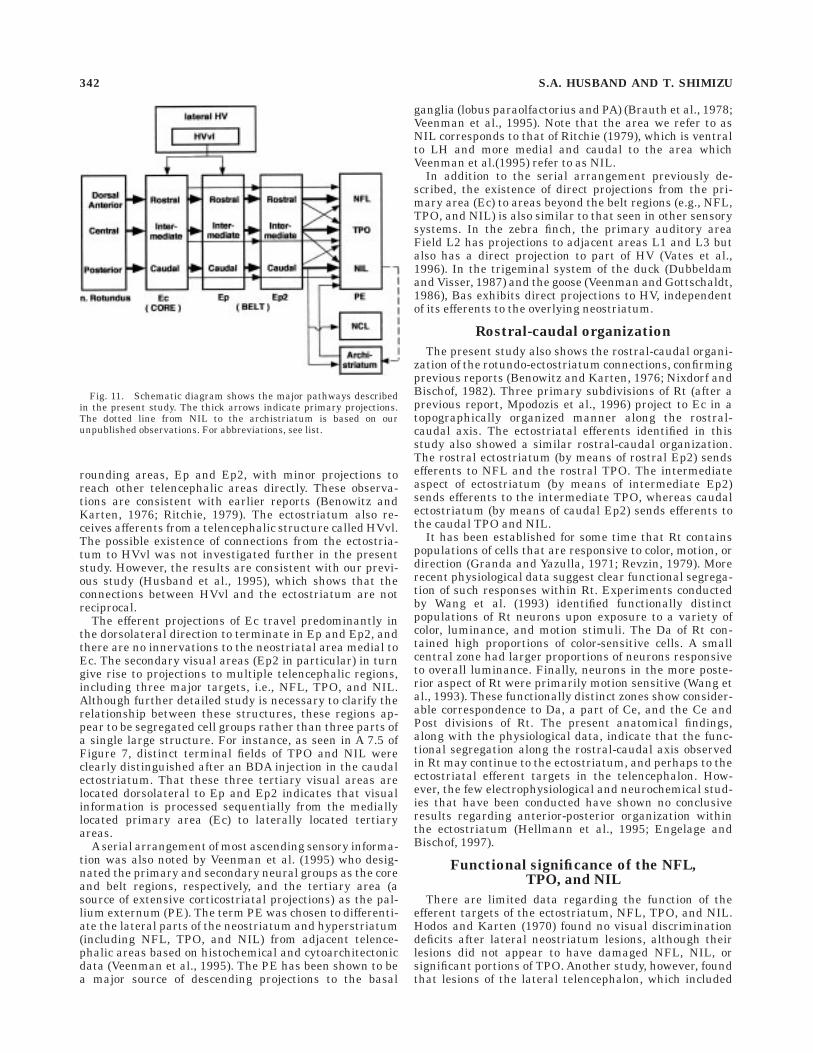
rounding areas, Ep and Ep2, with minor projections toreach other telencephalic areas directly. These observa-tions are consistent with earlier reports (Benowitz andKarten, 1976; Ritchie, 1979). The ectostriatum also re-ceives afferents from a telencephalic structure called HVvl.The possible existence of connections from the ectostria-tum to HVvl was not investigated further in the presentstudy. However, the results are consistent with our previ-ous study (Husband et al., 1995), which shows that theconnections between HVvl and the ectostriatum are notreciprocal.
The efferent projections of Ec travel predominantly inthe dorsolateral direction to terminate in Ep and Ep2, andthere are no innervations to the neostriatal area medial toEc. The secondary visual areas (Ep2 in particular) in turngive rise to projections to multiple telencephalic regions,including three major targets, i.e., NFL, TPO, and NIL.Although further detailed study is necessary to clarify therelationship between these structures, these regions ap-pear to be segregated cell groups rather than three parts ofa single large structure. For instance, as seen in A 7.5 ofFigure 7, distinct terminal fields of TPO and NIL wereclearly distinguished after an BDA injection in the caudalectostriatum. That these three tertiary visual areas arelocated dorsolateral to Ep and Ep2 indicates that visualinformation is processed sequentially from the mediallylocated primary area (Ec) to laterally located tertiaryareas.
Aserial arrangement of most ascending sensory informa-tion was also noted by Veenman et al. (1995) who desig-nated the primary and secondary neural groups as the coreand belt regions, respectively, and the tertiary area (asource of extensive corticostriatal projections) as the pal-lium externum (PE). The term PE was chosen to differenti-ate the lateral parts of the neostriatum and hyperstriatum(including NFL, TPO, and NIL) from adjacent telence-phalic areas based on histochemical and cytoarchitectonicdata (Veenman et al., 1995). The PE has been shown to bea major source of descending projections to the basal
ganglia (lobus paraolfactorius and PA) (Brauth et al., 1978;Veenman et al., 1995). Note that the area we refer to asNIL corresponds to that of Ritchie (1979), which is ventralto LH and more medial and caudal to the area whichVeenman et al.(1995) refer to as NIL.
In addition to the serial arrangement previously de-scribed, the existence of direct projections from the pri-mary area (Ec) to areas beyond the belt regions (e.g., NFL,TPO, and NIL) is also similar to that seen in other sensorysystems. In the zebra finch, the primary auditory areaField L2 has projections to adjacent areas L1 and L3 butalso has a direct projection to part of HV (Vates et al.,1996). In the trigeminal system of the duck (Dubbeldamand Visser, 1987) and the goose (Veenman and Gottschaldt,1986), Bas exhibits direct projections to HV, independentof its efferents to the overlying neostriatum.
Rostral-caudal organization
The present study also shows the rostral-caudal organi-zation of the rotundo-ectostriatum connections, confirmingprevious reports (Benowitz and Karten, 1976; Nixdorf andBischof, 1982). Three primary subdivisions of Rt (after aprevious report, Mpodozis et al., 1996) project to Ec in atopographically organized manner along the rostral-caudal axis. The ectostriatal efferents identified in thisstudy also showed a similar rostral-caudal organization.The rostral ectostriatum (by means of rostral Ep2) sendsefferents to NFL and the rostral TPO. The intermediateaspect of ectostriatum (by means of intermediate Ep2)sends efferents to the intermediate TPO, whereas caudalectostriatum (by means of caudal Ep2) sends efferents tothe caudal TPO and NIL.
It has been established for some time that Rt containspopulations of cells that are responsive to color, motion, ordirection (Granda and Yazulla, 1971; Revzin, 1979). Morerecent physiological data suggest clear functional segrega-tion of such responses within Rt. Experiments conductedby Wang et al. (1993) identified functionally distinctpopulations of Rt neurons upon exposure to a variety ofcolor, luminance, and motion stimuli. The Da of Rt con-tained high proportions of color-sensitive cells. A smallcentral zone had larger proportions of neurons responsiveto overall luminance. Finally, neurons in the more poste-rior aspect of Rt were primarily motion sensitive (Wang etal., 1993). These functionally distinct zones show consider-able correspondence to Da, a part of Ce, and the Ce andPost divisions of Rt. The present anatomical findings,along with the physiological data, indicate that the func-tional segregation along the rostral-caudal axis observedin Rt may continue to the ectostriatum, and perhaps to theectostriatal efferent targets in the telencephalon. How-ever, the few electrophysiological and neurochemical stud-ies that have been conducted have shown no conclusiveresults regarding anterior-posterior organization withinthe ectostriatum (Hellmann et al., 1995; Engelage andBischof, 1997).
Functional significance of the NFL,TPO, and NIL
There are limited data regarding the function of theefferent targets of the ectostriatum, NFL, TPO, and NIL.Hodos and Karten (1970) found no visual discriminationdeficits after lateral neostriatum lesions, although theirlesions did not appear to have damaged NFL, NIL, orsignificant portions of TPO. Another study, however, foundthat lesions of the lateral telencephalon, which included
Fig. 11. Schematic diagram shows the major pathways describedin the present study. The thick arrows indicate primary projections.The dotted line from NIL to the archistriatum is based on ourunpublished observations. For abbreviations, see list.
342 S.A. HUSBAND AND T. SHIMIZU

regions corresponding to NFL and TPO, did impair boththe acquisition and retention of hue, intensity, and patterndiscriminations (Delius et al., 1984).
Interestingly, NFL is also the recipient of informationfrom the other primary visual pathway in birds, thelemnothalamic (Butler and Hodos, 1996) or thalamofugal(Karten et al., 1973) pathway. In the lemnothalamicpathway, projections from the retina terminate on tha-lamic nuclei, the opticus principalis thalami (Karten andNauta, 1968; Shimizu et al., 1994), which in turn project toan enlarged portion of the dorsal telencephalon designatedthe visual Wulst (Hunt and Webster, 1972; Karten et al.,1973). Injections of an anterograde tracer into the visualWulst results in labeled fibers that cross the LH andexhibit terminal-like varicosities in part of NFL (Shimizuet al., 1995). Thus, NFL could be a region of convergencebetween the two visual pathways by means of lemnotha-lamic input from visual Wulst (Ritchie, 1979; Shimizu etal., 1995) and collothalamic input from the ectostriatum(Ritchie, 1979; present study).
The TPO receives information from both somatosensoryand visual areas. Brauth et al. (1978) reported the exis-tence of frontal neostriatum efferents to TPO after injec-tions of horseradish peroxidase into the lateral-most por-tion of TPO. Such injections resulted in retrogradelylabeled cells in the rostral neostriatum, just dorsomedialto the ectostriatum. This neostriatal area in turn receivesinput from a somatosensory thalamic nucleus (the rostralportion of the nucleus dorsolateralis posterior) (Delius andBennetto, 1972; Kitt and Brauth, 1982; Gamlin and Co-hen, 1986). Because visual input to TPO has also beenshown (Ritchie, 1979; present study), these data togetherindicate that TPO is a functionally heterogenous struc-ture. Veenman et al. (1995) reported that TPO projects tothe basal ganglia. The ectostriatum-TPO-basal gangliarelationship may be important for providing various sen-sory feedback in the directing of motor responses tomodulate body position and orientation. The exact natureof the influence of TPO neurons on those in the avian basalganglia are currently unclear.
Regarding NIL, although Ritchie (1979) was able torecord field potentials from neurons in NIL after directelectrical stimulation of the optic papilla and the ectostria-tum, no further physiological studies have been reported.However, another possible function of NIL is suggested bythe similarities in the organization of the avian visual andauditory telencephalic circuits. Similar to the core and beltefferent input to NIL, the caudomedial neostriatum (NCM)of songbirds, adjacent to NIL, receives efferents from aprimary (L2) and secondary (L3) auditory areas (Vates etal., 1996). The NCM has been implicated in the processingof novel song and the formation of song-related memories.Induction of the immediate early genes zenk (Mello et al.,1992, 1995; Mello and Clayton, 1994) and c-jun (Nastiuk etal., 1994) in response to novel song occurs in NCM. Inaddition, strong electrophysiological activation of NCMoccurs in response to complex auditory stimuli, whereassimple auditory tones tend to inhibit NCM neurons (Strip-ling et al., 1997). Hence, the data suggest that NCM is anarea which specializes in the processing of complex, novelauditory stimuli, possibly for the formation of song-relatedmemories. It is possible that NIL serves a similar functionin the visual system; it could process visual informationfrom the ectostriatum for the perception of complex objectsand/or the formation of visual memories.
Comparison with trigeminaland auditory connections
The connection patterns of Ec, Ep, Ep2, and NFL, TPO,NIL are reminiscent of those of other modalities in theavian telencephalon. Figure 12 is a schematic figure of thehorizontal hemisection of the bird telencephalon depictingthe topographical relationship of three sensory areas:trigeminal, visual, and auditory systems. These areas areorganized along the anterior-posterior axis, between themedial neostriatum and NCL. The most anterior region istrigeminal, followed by visual and then auditory regions.The primary areas receiving the thalamic input are Basfrom the principal sensory trigeminal nucleus (Wild et al.,1985), Ec from Rt (Karten and Hodos, 1970), and Field L2from the nucleus ovoidalis (Karten, 1968). The secondaryareas receiving efferent projections from the primary areasare found in the adjacent neostriatum: in the trigeminalsomatosensory system of pigeons (NFT; Wild et al., 1985)and ducks (Dubbeldam and Visser, 1987), in the collotha-lamic visual pathway of pigeons (Ep and Ep2; Karten andHodos, 1970; Ritchie, 1979; present study), and in theauditory system of pigeons (L1 and L3; Wild et al., 1993)and zebra finches (L3; Vates et al., 1996). Finally, tertiaryprocessing areas are arranged next to the secondary areas:in the trigeminal system of pigeons (neostriatum caudaletrigeminalis, NCT; Wild et al., 1985) and ducks (Dubbel-dam and Visser, 1987), in the collothalamic visual system(NFL, TPO, and NIL; Ritchie, 1979; present study), and inthe auditory system of the pigeon (dorsal neostriatumwithin NCL; Wild et al., 1993) and zebra finch (NCM;Vates et al., 1996). The tertiary sensory areas extendlaterally to the edge of the pallium in the rostral telencepha-lon (e.g., NFL, TPO). In the caudal telencephalon, NCLappears and separates the tertiary areas from the edge ofthe pallium. The NCL and Ai also receive sensory inputfrom the tertiary areas of the three modalities, formingdistinct regions for each modality (Ritchie, 1979; Wild etal., 1985, 1993). However, the processing of sensory infor-mation does not appear to be the sole function of these two
Fig. 12. Schematic horizontal hemisection depicts the serial ar-rangement of sensory areas processing trigeminal, visual, and audi-tory information. For abbreviations, see list.
VISUAL PROJECTIONS IN THE AVIAN TELENCEPHALON 343

structures. Other nonsensory areas are also known to existin Ai (Zeier and Karten, 1971) and possibly in NCL(Leutgeb et al., 1996).
The connections of HVvl to the ectostriatum are similarto the connections of primary telencephalic sensory areasof several other modalities in the avian brain. In theauditory pathways of both pigeons (Wild et al., 1993) andzebra finches (Vates et al., 1996), neurons in HV sendefferents to area Field L2. In zebra finches, furthermore,the connections of HV and Field L2 are reciprocal (Vates etal., 1996). There are also reciprocal connections to HV fromBas in the trigeminal system of the duck (Dubbeldam andVisser, 1987) and the goose (Veenman and Gottschaldt,1986).
Comparison with the mammalian cortex
The ectostriatum, neostriatum, and HV are part of thetelencephalic mass called the anterior dorsal ventricularridge (ADVR). The ADVR is a multinuclear formationprotruding into the lateral ventricle and is found only innonmammalian amniotes (i.e., birds and reptiles). Al-though the evolutionary origin of ADVR is still unclear(Lohman and Smeets, 1991; Bruce and Neary, 1995;Striedter, 1997), it has been often compared with themammalian isocortex in terms of the sensory circuits(Northcutt, 1981; Karten and Shimizu, 1989; Reiner, 1993;Butler, 1994; Karten, 1997). The circuits of several sensorymodalities in both the laminar mammalian brain and thenuclear groups of the avian brain exhibit similar patterns(Reiner, 1993; Shimizu and Karten, 1993; Veenman et al.,1995). For example, the connective pattern of collotha-lamic visual pathway to ADVR in birds shows remarkablesimilarities to the typical pattern of sensory circuits in themammalian isocortex. Both systems are characterized bymajor thalamic input to the telencephalon (layer IV inmammals; Ec in birds) which is then relayed to overlyingareas (layer IV projections to layers II and III in mammals;Ec projections to Ep and Ep2 and then NFL, TPO, and NILin birds). In mammals, there are descending projectionsfrom layers II and III to layers V and VI, from whichoutput is directed to the colliculi and thalamic nuclei.From the NIL in birds, there are descending projections tothe archistriatum (Ritchie, 1979; Husband et al., 1995),which in turn is a source of projections to the tectum (Zeierand Karten, 1971; Karten and Shimizu, 1989; Karten,1997). Karten (1991) suggested that the neurons of thearchistriatum which send efferents to the tectum aresimilar to those of the deep lamina of isocortex (layers Vand VI) in terms of their connections.
The ADVR is organized into cytoarchitectonically dis-tinct cell groups along the dorsal-ventral axis: a mediallylocated neostriatum (including the ectostriatum) and dor-sally located HV. However, the present and previousstudies have demonstrated the cytoarchitectonically andfunctionally heterogeneous nature of the neostriatum,ectostriatum, and HV. In particular, the pattern of sensorycircuits shows that major cell groups in ADVR processinformation along the medial-lateral axis. In light of this,ADVR and the isocortex have a common characteristicwhereby cell groups (i.e., cortical layers or ADVR nuclei) inthe sensory circuits are organized perpendicular to thelateral ventricle. In addition to afferent and efferentconnections, these radial organization patterns furtherindicate the general principles of sensory processing in thetelencephalon shared between the isocortex and ADVR.
ACKNOWLEDGMENTS
The authors thank Kent T. Keyser and J. Martin Wildfor their helpful comments on earlier versions of themanuscript.
LITERATURE CITED
Benowitz LI, Karten HJ. 1976. Organization of the tectofugal visualpathway in the pigeon: a retrograde transport study. J Comp Neurol167:503–520.
Bessette BB, Hodos W. 1989. Intensity, color, and pattern discriminationdeficits after lesions of the core and belt regions of the ectostriatum. VisNeurosci 2:27–34.
Braun K, Scheich H, Schachner M, Heizmann CW. 1985. Distribution ofparvalbumin, cytochrome oxidase activity and 14C-2-deoxyglucose up-take in the brain of the zebra finch: II. Visual system. Cell Tissue Res240:117–127.
Braun K, Scheich H, Zuschratter W, Heizmann CW, Matute C, Streit P.1988. Postnatal development of parvalbumin-, calbindin-, and adultGABA-immunoreactivity in two visual nuceli of zebra finches. BrainRes 475:205–217.
Brauth SE, Ferguson JL, Kitt CA. 1978. Prosencephalic pathways relatedto the paleostriatum of the pigeon (Columba livia). Brain Res 147:205–221.
Bruce LL, Neary TJ. 1995. The limbic system of tetrapods: a comparativeanalysis of cortical and amygdalar populations. Brain Behav Evol46:224–234.
Butler AB. 1994. The evolution of the dorsal pallium in the telencephalon ofamniotes: cladistic analysis and a new hypothesis. Brain Res Rev19:66–101.
Butler AB, Hodos W. 1996. Comparative vertebrate neuroanatomy: evolu-tion and adaptation. New York: Wiley-Liss.
Cohen DH. 1967. Visual intensity discrimination in pigeons followingunilateral and bilateral tectal lesions. J Comp Physiol Psychol 63:172–174.
Delius JD, Bennetto K. 1972. Cutaneous sensory projections to the avianforebrain. Brain Res 4:369–374.
Delius JD, Jager R, Friesel M. 1984. Lateral telencephalic lesions affectvisual discriminations in pigeons. Behav Brain Res 11:249–259.
Dubbeldam JL, Visser AM. 1987. The organization of the nucleus basalis-neostriatum complex of the mallard (Anas platyrhynchos L.) and itsconnections with the archistriatum and the paleostriatum complex.Neuroscience 2:487–517.
Engelage J, Bischof HJ. 1997. Single cell responses in the ectostriatum ofthe zebra finch. J Comp Physiol A 179:785–795.
Gamlin PDR, Cohen DH. 1986. A second ascending visual pathway from theoptic tectum to the telencephalon in the pigeon (Columba livia). J CompNeurol 250:296–310.
Granda AM, Yazulla S. 1971. The spectral sensitivity of single units in thenucleus rotundus of pigeon (Columba livia). J Gen Physiol 57:363–384.
Hellmann B, Waldmann C, Gunturkun O. 1995. Cytochrome oxidaseactivity reveals parcellations of the pigeon’s ectostriatum. Neuroreport6:881–885.
Hodos W. 1969. Color-discrimination deficits after lesions of the nucleusrotundus in pigeons. Brain Behav Evol 2:185–200.
Hodos W, Bonbright JC. 1974. Intensity difference thresholds in pigeonsafter lesions of the tectofugal and thalamofugal visual pathways. JComp Physiol Psychol 87:1013–1031.
Hodos W, Karten HJ. 1966. Brightness and pattern discrimination deficitsin the pigeon after lesions of nucleus rotundus. Exp Brain Res 2:151–167.
Hodos W, Karten HJ. 1970. Visual intensity and pattern discriminationdeficits after lesions of ectostriatum in pigeons. J Comp Neurol 140:53–68.
Hodos W, Karten HJ. 1974. Visual intensity and pattern discriminationdeficits after lesions of the optic lobe in pigeons. Brain Behav Evol19:165–194.
Hodos W, Macko KA, Bessette BB. 1984. Near field acuity changes aftervisual system lesions in pigeons. II. Telencephalon. Behav Brain Res13:15–30.
Hodos W, Weiss SR, Bessette BB. 1986. Size-threshold changes after lesionsof the visual telencephalon in pigeons. Behav Brain Res 21:203–214.
Hodos W, Weiss SR, Bessette BB. 1988. Intensity difference thresholds afterlesions of ectostriatum in pigeons. Behav Brain Res 30:43–53.
344 S.A. HUSBAND AND T. SHIMIZU

Hunt SP, Webster KE. 1972. Thalamo-hyperstriate interrelations in thepigeon. Brain Res 44:647–651.
Husband SA, Shimizu T. 1997. Anatomical evidence for parallel processingwithin the avian collothalamic visual pathway. Soc Neurosci Abstr23:172.
Husband SA, Laverghetta AV, Bosco GL, Edwards SC, Shimizu T. 1995.Some observations on the connections of the ectostriatum in the aviantelencephalon. Soc Neurosci Abstr 21:653.
Iniguez C, Gayoso MJ, Carreres J. 1985. A versatile and simple method forstaining nervous tissue using Giemsa dye. J Neurosci Methods 13:77–86.
Karten HJ. 1968. The ascending auditory pathway in the pigeon (Columbalivia): II. Telencephalic projections of the nucleus ovoidalis thalami.Brain Res 11:134–153.
Karten HJ. 1991. Homology and evolutionary origin of the ‘‘neocortex.’’Brain Behav Evol 38:264–272.
Karten HJ. 1997. Evolutionary developmental biology meets the brain: theorigins of mammalian cortex. Proc Natl Acad Sci USA 94:2800–2804.
Karten HJ, Hodos W. 1967. A stereotaxic atlas of the pigeon brain (Columbalivia). Baltimore, MD: The Johns Hopkins Press.
Karten HJ, Hodos W. 1970. Telencephalic projections of the nucleusrotundus in the pigeon (Columba livia). J Comp Neurol 140:35–52.
Karten HJ, Nauta WJH. 1968. Organization of retinothalamic projectionsin the pigeon and owl. Anat Rec 160:373.
Karten HJ, Revzin AM. 1966. The afferent connections of the nucleusrotundus in the pigeon. Brain Res 2:368–377.
Karten HJ, Shimizu T. 1989. The origins of neocortex: connections andlamination as distinct events in evolution. J Cogn Neurosci 1:291–301.
Karten HJ, Hodos W, Nauta WJH, Revzin AM. 1973. Neural connections ofthe ‘‘visual Wulst’’ of the avian telencephalon. Experimental studies inthe pigeon (Columba livia) and owl (Speotyto cunicularia). J CompNeurol 150:253–277.
Kertzman C, Hodos W. 1988. Size difference thresholds after lesions ofthalamic visual nuclei in pigeons. Vis Neurosci 1:83–92.
Kitt CA, Brauth SE. 1982. A paleostriatal-thalamic-telencephalic path inpigeons. Neuroscience 7:2735–2751.
Leutgeb S, Husband S, Riters LV, Shimizu T, Bingman VP. 1996. Telence-phalic afferents to the caudolateral neostriatum of the pigeon. BrainRes 730:173–181.
Lohman AHM, Smeets WJAJ. 1991. The dorsal ventricular ridge and cortexof reptiles in historical and phylogenetic perspective. In: Finlay BL,Innocenti G, Scheich H, editors. The neocortex: ontogeny and phylog-eny. New York: Plenum Press. p 59–74.
Macko KA, Hodos W. 1984. Near-field acuity after visual system lesions inpigeons: I. Thalamus. Behav Brain Res 13:1–14.
Martinez-de-la-Torre M, Martinez S, Puelles L. 1990. Acetylcholinesterase-histochemical differential staining of subdivisions within the nucleusrotundus in the chick. Anat Embryol 181:129–135.
Mello CV, Clayton DF. 1994. Song-induced ZENK gene expression inauditory pathways of songbird brain and its relation to the song controlsystem. J Neurosci 14:6652–6666.
Mello CV, Vicario DS, Clayton DF. 1992. Song presentation induces geneexpression in the songbird forebrain. Proc Natl Acad Sci USA 89:6818–6822.
Mello C, Nottebohm F, Clayton D. 1995. Repeated exposure to one songleads to a rapid and persistent decline in an immediate early gene’sresponse to that song in zebra finch telencephalon. J Neurosci 15:6919–6925.
Mpodozis J, Cox K, Shimizu T, Bischof HJ, Woodson W, Karten HJ. 1996.GABAergic inputs to the nucleus rotundus (pulvinar inferior) of thepigeon (Columba livia). J Comp Neurol 374:204–222.
Nastiuk KL, Mello CV, George JM, Clayton DF. 1994. Immediate-early generesponses in the avian song control system: cloning and expressionanalysis of the canary c-jun cDNA. Mol Brain Res 27:299–309.
Nixdorf BE, Bischof HJ. 1982. Afferent connections of the ectostriatum andvisual Wulst in the zebra finch (Taeniopygia guttata castanotis Gould):An HRP study. Brain Res 248:9–17.
Northcutt RG. 1981. Evolution of the telencephalon in nonmammals. AnnuRev Neurosci 4:301–350.
Reiner A. 1993. Neurotransmitter organization and connections of turtlecortex: implications for the evolution of mammalian isocortex. CompBiochem Physiol 104A:735–748.
Revzin AM. 1979. Functional localization in the nucleus rotundus. In:Granda AM, Maxwell JH, editors. Neural mechanisms of behavior inthe pigeon. New York: Plenum. p 165–175.
Revzin AM, Karten HJ. 1967. Rostral projections of the optic tectum andthe nucleus rotundus in the pigeon. Brain Res 5:264–276.
Ritchie TLC. 1979. Intratelencephalic visual connections and their relation-ship to archistriatum in the pigeon (Columba livia). Unpublished PhDdissertation, University of Virginia.
Shimizu T, Karten HJ. 1993. The avian visual system and the evolution ofneocortex. In: Ziegler HP, Bischof H-J, editors. Vision, brain, andbehavior in birds. Cambridge, MA: MIT. p 103–114.
Shimizu T, Cox K, Karten HJ, Britto LRG. 1994. Cholera toxin mapping ofretinal projections in pigeons (Columba livia), with emphasis onretinohypothalamic connections. Vis Neurosci 11:441–446.
Shimizu T, Cox K, Karten HJ. 1995. Intratelencephalic projections of thevisual Wulst in pigeons (Columba livia). J Comp Neurol 359:551–572.
Striedter GF. 1997. The telencephalon of tetrapods in evolution. BrainBehav Evol 49:179–213.
Stripling R, Volman SF, Clayton DF. 1997. Response modulation in thezebra finch neostriatum: relationship to nuclear gene regulation. JNeurosci 17:3883–3893.
Vates GE, Broome BM, Mello CV, Nottebohm F. 1996. Auditory pathways ofcaudal telencephalon and their relation to the song system of adultmale zebra finches (Taenopygia guttata). J Comp Neurol 366:613–642.
Veenman CL, Gottschaldt KM. 1986. The nucleus basalis-neostriatumcomplex in the goose (Anser anser L). Adv Anat Embryol Cell Biol96:1–85.
Veenman CL, Wild MJ, Reiner A. 1995. Organization of the avian ‘‘cortico-striatal’’ projection system: a retrograde and anterograde pathwaytracing study in pigeons. J Comp Neurol 354:87–126.
Wang Y, Jiang S, Frost BJ. 1993. Visual processing in pigeon nucleusrotundus: luminance, color, motion, and looming subdivisions. VisNeurosci 10:21–30.
Watanabe M, Ito H, Ikushima M. 1985. Cytoarchitecture and ultrastruc-ture of the avian ectostriatum: afferent terminals from the dorsaltelencephalon and some nuclei in the thalamus. J Comp Neurol236:241–257.
Watanabe S. 1991. Effects of ectostriatal lesions on natural concept,pseudoconcept, and artificial pattern discrimination in pigeons. VisNeurosci 6:497–506.
Watanabe S. 1992. Effect of lesions in the ectostriatum and Wulst on speciesand individual discrimination in pigeons. Behav Brain Res 49:197–203.
Wild JM, Arends JJA, Ziegler HP. 1985. Telencephalic connections of thetrigeminal system in the pigeon (Columba livia): a trigeminal sensori-motor circuit. J Comp Neurol 234:441–464.
Wild JM, Karten HJ, Frost BJ. 1993. Connections of the auditory forebrainin the pigeon (Columba livia). J Comp Neurol 337:32–62.
Zeier H, Karten HJ. 1971. The archistriatum of the pigeon: organization ofafferent and efferent connections. Brain Res 31:313–326.
VISUAL PROJECTIONS IN THE AVIAN TELENCEPHALON 345