effects - dm5migu4zj3pb.cloudfront.netdm5migu4zj3pb.cloudfront.net/manuscripts/101000/... · thus,...
TRANSCRIPT
THE EFFECTS OF LARGE INTRAVENOUSINFUSIONS ONBODYFLUID 1
By JOHND. STEWARTAND G. MARGARETROURKE(From the Surgical Laboratories of the Harvard Medical School at the
Massachusetts General Hospital, Boston)
(Received for publication October 28, 1941)
Much consideration has been given to thechanges which result in man and in experimentalanimals from administering by vein various quan-tities of fluids of different composition (1, 2, 3).Thus, the dislocation of body fluid and the urinarychanges which follow rapid infusion of massivequantities of fluid in animals have been described(4, 5, 6). Shifts of water and salts betweenmuscle and blood after infusion of isotonic fluidsof varying pH have been studied in dogs bymeans of muscle biopsy and analysis (7). Thecirculatory effects of administering fluid by veinin various clinical conditions have been investi-gated, having in mind the primary importance ofcirculatory dynamics in determining response tointravenous fluid therapy (1, 8). Such studieshave served to emphasize the fundamental con-clusions of Gamble (9, 10, 11), Peters (12, 13),and others.
In the work on which the present report isbased it seemed desirable to determine the resultsof large amounts of isotonic glucose and NaClsolutions administered by constant intravenousdrip over a period of several days. The physio-logical responses to sustained submaximal infu-sions were under inquiry rather than the reactionto a large or small intravenous injection of briefduration, for it seemed possible that compensatorymechanisms of a different nature might be broughtinto play as the infusions were continued.
MATERIAL AND METHODS
Patients undergoing mild or moderately severe opera-tions under ether anesthesia were studied just beforeoperation, just after operation, at the end of the infusionperiod, and several days afterwards when the effects ofthe infusion had subsided. Determinations were madeon a fasting basis, and the patients took water as de-sired during the infusion period but were allowed onlysmall amounts of fruit juices in addition. The patients
'Aided by grants from the William F. Milton Fund,Harvard University, and the Josiah Macy, Jr. Foundation.
were well-nourished women without cardiovascular orrenal disease. During the study they were under con-stant observation by trained attendants and, if a patientobjected, the infusion was discontinued. Urine was col-lected quantitatively by an indwelling catheter. Arm orleg veins were used for the infusion, the extremity beingsplinted, and except for slight redness about the needlein two or three instances no local reaction was noted.The patients were entirely afebrile, or nearly so, duringthe study. Intake of fluid by oral and intravenous routesand output of urine were totaled at 12-hour intervals.Four patients received 5 per cent glucose solution andsix 0.9 per cent NaCl solution.
ANALYTICAL METHODS
Blood loss at operation was determined by the methodof Gatch and Little (14), sodium of serum or plasmaand of urine by the gravimetric technique of Butler andTuthill (15), potassium by the method of Fiske andLitarczek (16), chloride by Wilson and Ball's method(17), carbon dioxide content of serum according to VanSlyke and Sendroy (18), total nitrogen by macro-Kjeldahl(19) on oxalated plasma or serum and urine, and non-protein nitrogen of serum or plasma by micro-digestionand nesslerization. Serum albumin was determined byHowe's method (20). From the total protein of theserum and the serum albumin, colloid osmotic pressure(" oncotic pressure") was calculated, using the nomo-graphic formula of Wells, Youmans, and Mills (21).Oxygen capacity was determined on heparinized venousblood drawn without stasis and equilibrated with roomair at room temperature (22). Hematocrit readingswere made by adding 4 cc. of blood to 1 cc. of 1.1 per centsodium oxalate and centrifuging in hematocrit tubes untilno further change in the reading occurred, precautionsbeing taken against loss of carbon dioxide. In some ofthe patients receiving 5 per cent glucose by vein theurinary excretion of glucose was measured, but these dataare not included as the losses were trivial.
Plasma volume was determined by the method ofGregersen and his coworkers (23), using the blue dyeT-1824, the serum concentrations being measured spec-trophotometrically. "Available fluid" volume, taken asextracellular fluid volume plus the water of red bloodcells, was determined as described by Stewart andRourke (24). The patients were weighed on a stretcherfitting over silk scales which were accurate to within 10grams.
197

JOHN D. STEWARTAND G. MARGARETROURKE
RESULTS
Data are presented as obtained in three of themore conclusive experiments. Patient R. H. whounderwent colporrhaphy and uterine suspensionunder ether anesthesia received 26.69 liters of 0.9per cent NaCl solution intravenously during aperiod of 96 hours, beginning immediately afteroperation. Convalescence was uneventful, andthe patient seemed to have less than usual post-operative discomfort. There was no detectableedema at any time. Patient G. S., following col-porrhaphy under ether anesthesia, received in-travenously during a period of 144 hours 28.37liters of 5 per cent glucose solution without anyuntoward clinical effects and without edema. Pa-tient S. K., following a trivial surgical procedureconsisting of uterine dilatation and curettage un-der ether anesthesia, was given 6.86 liters of 5per cent glucose solution by vein during a 36-hourperiod. Signs of water intoxication appeared,including nausea and vomiting, epigastric distress,disorientation and excitement, culminating shortlyin coma. The infusion was immediately discon-tinued and complete recovery occurred in a fewhours without the need of giving salt solution.Convalescence was subsequently uninterrupted.The patient was a young woman, 20 years old, in
12 HR.PERIODS
good general condition and without detectablerenal, cardiovascular or hepatic disease.
In Figure 1 are shown fluid intake and urinevolume measurements in the three experiments,together with body weight before and after theinfusion. Measurements of intake and urine vol-ume do not, of course, permit complete appraisalof the state of water balance, for water of oxida-tion on the one hand and extrarenal loss of wateron the other are not considered. Since the latterfactors are roughly stationary, however, the valuesdo show the trend of water balance. Comparisonof the G. S. and S. K. data bring out clearly thelag in water removal, which together with lackof sodium conservation (Figure 4) produced arapid reduction of plasma sodium concentrationin patient S. K.
In Figure 2 are shown balance data with respectto sodium, chloride ion and potassium, as foundin patient R. H. The record of cumulative sodiumbalance brings out the slowness with which themechanisms governing extracellular fluid volumeoperate against an inflow of isotonic NaCl solu-tion. For 4 days they succeed only in progres-sively reducing the rate of increment, but by theeighth period they finally have the upper hand.The tolerance which the body shows for increase
GS. 5 C0/ GLUCOSEINFUSION STUDY
1 2 3 4 5 6 7 8 9 10 11 12
FIG. 1. MEASUREMENTSOF BODYWEIGHTCHANGE,TOTAL WATERINTAKE AND URINE VOLUME
198

EFFECTS OF LARGE INTRAVENOUSINFUSIONS
120
40 Na/ CUMULATIVE BALANCES
._000
2 3 4 5 6 7 8
12 HOUR PERIODS
R.H. 0.9 PER CENT NaC1 INFUSION STUDY
FIG. 2. ELECTROL BALANCE DATA FROM SALTINFUSION STUDY
in fluid when sodium and chloride ion are sup-
plied with water is also indicated by the valuesshown in the upper half of the figure.
In Figure 3 are recorded the incidental lossesof sodium, chloride ion, potassium and nitrogen.The scale of the nitrogen ordinate in grams isadjusted to that of the milliequivalent ordinate interms of the nitrogen: potassium content of pro-
toplasm (muscle).The protein-sparing effect of glucose is shown
by the more gradual loss of nitrogen for G. S.as compared with R. H. The loss of potassiumin excess of nitrogen indicates withdrawal of in-tracellular fluid. The nitrogen-potassium discrep-ancy is much larger in the NaCl than in theglucose study. The total potassium loss for R. H.is 240 milliequivalents, while on the basis ofnitrogen excretion 110 milliequivalents derive
from destroyed protoplasm (44 X,2.5 =110).The remaining 130 milliequivalents correspond to950 cc. of intracellular fluid. Such a relativelysmall loss from the body's total content of intra-cellular fluid is probably not physiologically sig-nificant. The discrepancy in the nitrogen-potas-sium elimination appears to be largely an initialevent occurring in the early postoperative period.It is probably dependent to some extent on anes-thesia and surgical trauma.
The loss of sodium over the 6 days of theglucose infusion in the case of patient G. S. was289 milliequivalents. On the basis of the usualsodium content of interstitial fluid, 147 milli-equivalents per liter, this implies a loss of 1960 cc.Total extracellular fluid for this patient estimatedas 20 per cent of body weight is 13,660 cc. Theloss would therefore amount to 14.5 per cent, aconsiderable but not a seriously large loss. Inthe case of S. K., however, a rapid loss of sodiumfrom failure of renal conservation, together withthe lag in water removal (Figure 1), produced areduction of sodium concentration to a dangerousextent.
Figure 4 presents data on concentration ofsodium in urine and plasma. The urine datafrom the NaCl study produce an impressive curve,which would seem to show quite clearly that theprogressive decline in the rate of increase inextracellular fluid volume and the eventual re-duction of volume are accompanied by an in-creasing removal of water with respect to sodium.The data from the glucose study (Patient G. S.)show very strikingly how extensive is the abilityof the kidney to dilute sodium and how nearlythe theoretically required zero excretion is ap-proached. An approximately thirty-fold dilutionof sodium with respect to its plasma level isattained. The data obtained from Patient S. K.,in contrast with those from G. S., make clear thefailure of this individual to conserve sodium inthe presence of a large water excretion. In pos-sible explanation it may be noted that 6867 cc.were given as compared with 3005 cc. for PatientG. S. over the first 30 hours of the infusion pe-riod, although thereafter this patient received ap-proximately 6 liters per 24 hours without un-toward effects. As seen in Figure 4, the urine
199

JOHN D. STEWARTAND G. MARGARETROURKE
0 1 2 3 4 5 6 7 8 O 1 2 3 4 5 6 7 8 9 10 I 12 0 1 2 3 4 5 6
R.H 0.3 PER CENT NaCIINFUSION STUDY
G.S. 5 PER CENTGLUCOSEINFUSION STUDY
SK.5 PERCENTGLUCOSE*WATERINTOXICATION'
FIG. 3. MEASUREMENTSOF LOSSES OF NITROGEN, SODIUM, CHLORIDE ION AND POTASSIUMINCIDENTAL TO FASTING
sodium concentrations for S. K. progressivelydecline during the period of water intoxicationand with cessation of infusion fall at once to theextremely low level found for G. S. The datathus suggest that the load suddenly placed on
renal regulation is larger than can be immediatelymanaged.
Tables I, II and III show data obtained in study-
ing the concentration of various factors in theblood during the progress of the experiments."Available fluid" volume and plasma volume were
also determined. The accuracy with which nor-
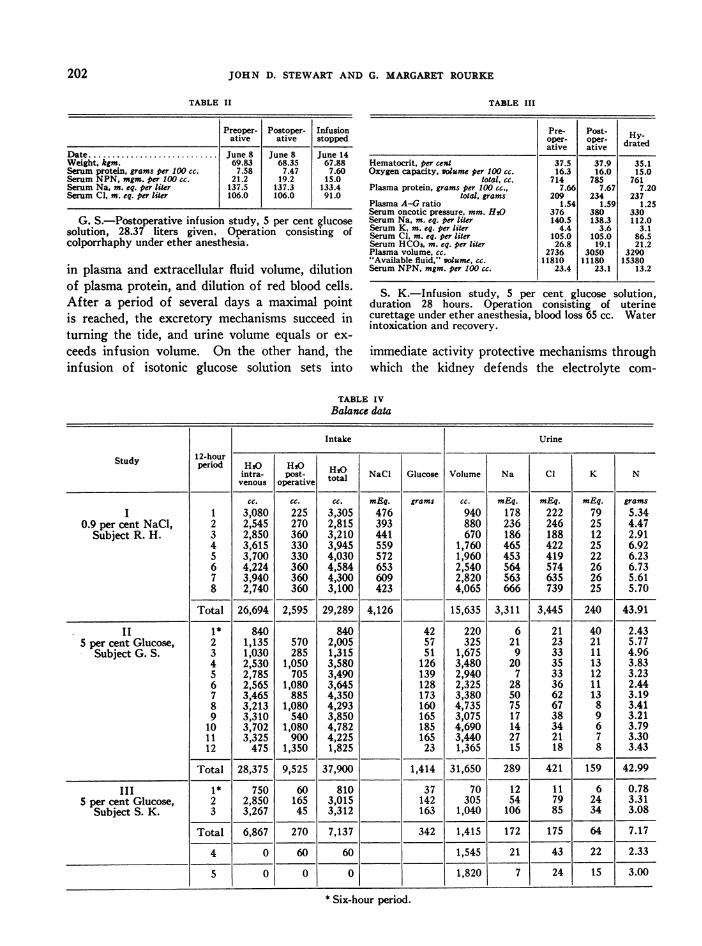
mal values are re-established after cessation of theinfusion is strikingly shown in Table I. Table IVpresents balance data for the infusion period inthe three cases.
z 0-0o 2-a
Hz-4240
zw
-
IIZ 0-
0 20:lx .
F-40.Z .
60.
200

EFFECTS OF LARGE INTRAVENOUSINFUSIONS
12 HOURPERIODS I 2 3 4 5 6 7 8
RF.9O3NaCI
300
ILI 250
*~~200 0
150
i oo , (Na: -0D. URINE
-J 50 PLASM
1 2 3 4 S 6 7 8 9 10 11 12
G.S. 5 0/O GLUCOSE
1 2 3 4 5 6
S.K. 5 0/0 GLUCOSE
FIG. 4. CONCENTRATIONSOF SODIUM IN URINE AND IN PLASMA
DISCUSSION
For the purposes of the experimental plan thepatients studied were normal, healthy individuals,who were making uncomplicated recovery frommoderate surgical trauma and ether anesthesia.As for the disturbances in body fluid connectedwith the anesthesia and operation in this group ofcases, pertinent data have already been reported(25). At no time during the infusion did any
of the patients show gross evidence of edema, a
rather remarkable fact inasmuch as huge addi-
tions to body fluid were made in the saline infusionstudies. It is of interest also that the sensationof thirst was present, being perhaps more constantin the patients who were receiving glucose infu-sions.
These studies show sharp differences betweenthe effects of isotonic sodium chloride solutionand isotonic glucose solution when such solutionsare given at a constant rate by vein over a periodof several days. In general terms the saline solu-tion tends to be retained, with consequent increase
TABLE I
Preoperative Postoperative pioppedn Recovered
Date .............................................. May 19 May 19 May 24 May 28Weight, kgm.............................................. 60.49 59.95 67.23 58.18Hematocrit, per cent ....................................... 42.8 41.9 25.6 33.3Oxygen capacity, volume per 100 cc ........................... 16.3 16.8 11.9 13.6
total, cc ................................... 841 869 757 633Plasma protein, grams per 100cc.............................. 8.16 7.76 5.97 7.82
total, grams ................................. 246 233 283 243Plasma A-G ratio ......................................... 1.39 1.47 1.22 1.04Serum oncotic pressure, mm. H,O ............................ 410 392 247 350Serum Na, m. eq. per liter ................................... 136.2 139.9 138.5 134.0Serum K m. eq. per lir ................................... 3.9 3.9 3.8 4.6Serum Cl, m. eq. per lir ................................... 102.5 106.5 110.0 100.0Serum HCOs, m. eq. per lie ................................ 26.8 24.7 22.4 29.2Plasma volume, ......................................... 3013 3008 4730 3106"Available fluid" volume, ................................. 12130 11960 21850 13970Serum NPN, mgm. per 100 cc................................. 24.4 27.2 12.5 33.0
R. H.-Infusion study, 0.9 per cent NaCl solution, 26.69 liters given. Operation consisting of colporrhaphy anduterine suspension, ether anesthesia. Blood loss 357 cc.
201
JOHN D. STEWARTAND G. MARGARETROURKE
TABLE II TABLE III
Preoper- Postoper- Infusion Pre- Post- Hative ative stopped oper- oper- drated
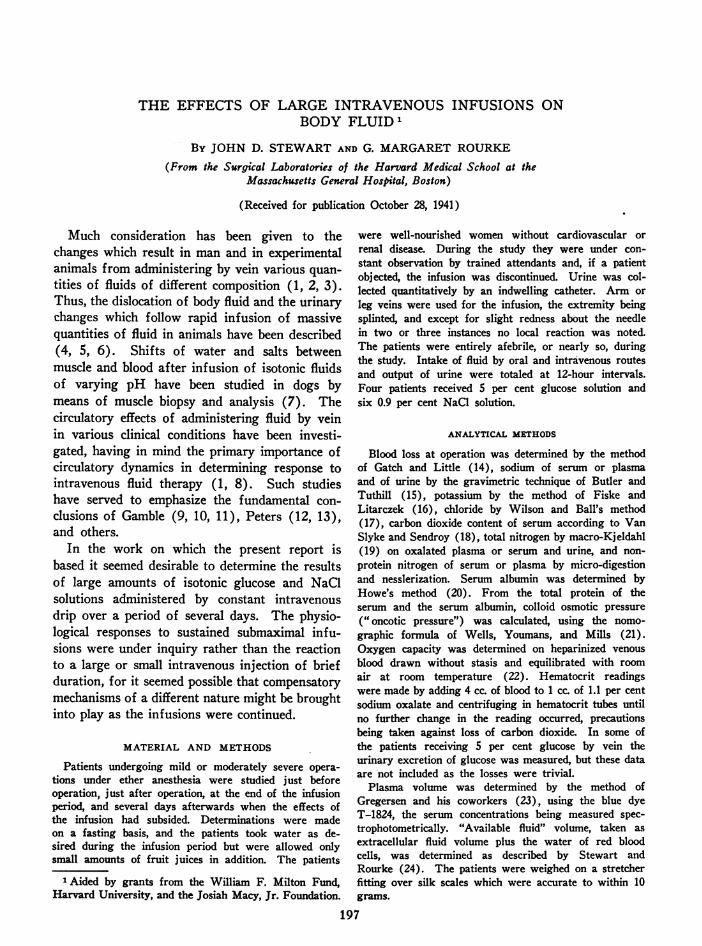
ative ativeDate. June 8 June 8 June 14Weight, kgm. 69.83 68.35 67.88 Hematocrit, per cent 37.5 37.9 35.1Serum protein, grams per 100 cc. 7.58 7.47 7.60 Oxygen capacity, volume per 100 cc. 16.3 16.0 15.0Serum NPN, mgm. per 100 cc. 21.2 19.2 15.0 total, cc. 714 785 761Serum Na, m. eq. per liter 137.5 137.3 133.4 Plasma protein, grams per 100 cc.. 7.66 7.67 7.20Serum Cl, m. eq. per liter 106.0 106.0 91.0 total, grams 209 234 237
Plasma A-G ratio 1.54 1.59 1.25Serum oncotic pressure, mm. H20 376 380 330
G. S.-Postoperative infusion study, 5 per cent glucose Serum Na, m. eq. per liter 140.5 138.3 112.0solution, 28.37 liters given. Operation consisting of Serum K. m. eq. per liter 4.4 3.6 3.1
Srum Cl, m. eq. per liter 105.0 105.0 86.5colporrhaphy under ether anesthesia. Serum HCO3, m. eq. per liter 26.8 19.1 21.2
Plasma volume, cc. 2736 3050 3290"Available fluid," volume cc. 11810 11180 15380
in plasma and extracellular fluid volume, dilution Serum NPN, mgm. per 100 cc. 23.4 23.1 13.2of plasma protein, and dilution of red blood cells. .K.-Infusion study, 5 per c gluos solutionS.KInfslo stuy, 5percent glucose solution,After a period of several days a maximal point duration 28 hours. Operation consisting of uterineis reached, the excretory mechanisms succeed in curettage under ether anesthesia, blood loss 65 cc. Water
' l~~~~~~~~~~~~ntoxication and recovery.turning the tide, and urine volume equals or ex-ceeds infusion volume. On the other hand, the immediate activity protective mechanisms throughinfusion of isotonic glucose solution sets into which the kidney defends the electrolyte com-
TABLE IVBalance data
Intake Urine
Study ~~12-hour -_ _ _ _ _ _ _ _ _ _ _ _ _ _ _ _ -_ _ _ _ _ _
Study 12-period HIs HI20intra- Post- totHI NaCI Glucose Volume Na Cl K N
venous operativetoa
cc. cc. cc. mEq. grams cc. mEq. mEq. mEq. gramsI 1 3,080 225 3,305 476 940 178 222 79 5.34
0.9 per cent NaCl, 2 2,545 270 2,815 393 880 236 246 25 4.47Subject R. H. 3 2,850 360 3,210 441 670 186 188 12 2.91
4 3,615 330 3,945 559 1,760 465 422 25 6.925 3,700 330 4,030 572 1,960 453 419 22 6.236 4,224 360 4,584 653 2,540 564 574 26 6.737 3,940 360 4,300 609 2,820 563 635 26 5.618 2,740 360 3,100 423 4,065 666 739 25 5.70
Total 26,694 2,595 29,289 4,126 15,635 3,311 3,445 240 43.91
II 1* 840 840 42 220 6 21 40 2.435 per cent Glucose, 2 1,135 570 2,005 57 325 21 23 21 5.77
Subject G. S. 3 1,030 285 1,315 51 1,675 9 33 11 4.964 2,530 1,050 3,580 126 3,480 20 35 13 3.835 2,785 705 3,490 139 2,940 7 33 12 3.236 2,565 1,080 3,645 128 2,325 28 36 11 2.447 3,465 885 4,350 173 3,380 50 62 13 3.198 3,213 1,080 4,293 160 4,735 75 67 8 3.419 3,310 540 3,850 165 3,075 17 38 9 3.21
10 3,702 1,080 4,782 185 4,690 14 34 6 3.7911 3,325 900 4,225 165 3,440 27 21 7 3.3012 475 1,350 1,825 23 1,365 15 18 8 3.43
Total 28,375 9,525 37,900 1,414 31,650 289 421 159 42.99
III 1* 750 60 810 37 70 12 11 6 0.785 per cent Glucose, 2 2,850 165 3,015 142 305 54 79 24 3.31
Subject S. K. 3 3,267 45 3,312 163 1,040 106 85 34 3.08
Total 6,867 270 7,137 342 1,415 172 175 64 7.17
4 0 60 60 1,545 21 43 22 2.33
5 0 0 0 1,820 7 24 15 3.00
* Six-hour period.
202

EFFECTS OF LARGE INTRAVENOUSINFUSIONS
position of the extracellular fluids, and largeamounts of urine are excreted containing extra-ordinarily little sodium and chloride. Dilution ofplasma colloids and formed elements in the bloodis accordingly averted. Putting it differently, therenal regulator is extremely sensitive to changesin composition of extracellular fluid, but is quitetolerant of increases in extracellular fluid volume.
It is evident that the administration of isotonicglucose solution by vein in the fasting subjectresults in reduced consumption of body protoplasmthrough the protein-sparing action of glucose.Such weight-conserving effects of glucose infu-sion are offset by the reduction in extracellularfluid stores accompanying the loss of sodium andchloride ion in the urine. The remarkable powerof the healthy kidney to dilute sodium and chlo-ride ion minimizes but does not entirely preventthe dehydrating action of isotonic glucose infu-sions. As shown in the study of Patient S. K.,a dangerous body fluid disturbance may occurduring the infusion of large amounts of isotonicglucose solution. The two factors which broughton the syndrome of water intoxication in thispatient were retention of water without electro-lyte, and failure in renal conservation of sodiumand chloride ion.
A finding of interest was the mobilization ofplasma protein by the saline infusion, but not atall, or much less extensively, by the glucose infu-sion. It would appear that reserve protein in theamount of 25 per cent or so of that in the plasmamay be placed in circulation under conditionswhich tend to dilute plasma colloid, and appar-ently the loan is accurately paid back after theperiod of stress. If reliance can be placed on thealbumin-globulin partition by the method used,then the reserve protein appears to be pre-dominantly globulin. Nevertheless, the plasmabenefits by an important increment in colloid os-motic pressure as a result of such additions.Presumably, large increases in plasma and extra-cellular fluid volume, as brought about by salineinfusions, would be accompanied by increases inlymph and, if so, the total amount of extravascularcirculating protein might also be augmented. Itis a notable fact that the addition of plasma pro-tein to the circulation taking place during salineinfusions was unaccompanied by an increase intotal circulating hemoglobin.
In considering values for extracellular fluidvolume in these studies, it should be borne inmind that the thiocyanate ion is taken up by thewater of red blood cells and, further, that atdiffusion equilibrium between thiocyanate in serumand in transudates, the concentration in transu-dates is about 100/110 of that in the serum (26).Consequently, the "available fluid for solution ofthiocyanate" is to be regarded as only a roughapproximation of true extracellular fluid volume,and the determination is of chief interest in show-ing changes in the same individual under varyingconditions.
CONCLUSIONS
According to the data presented from threepatients who underwent simple surgical proce-dures involving only slight loss of extracellularfluid, the chief effects of continued infusion of0.9 per cent sodium chloride solution and of 5 percent glucose solution on a basis of fasting are asfollows:
Salt solution. Continuous infusion to the ex-tent of 6.5 liters daily produces a very large addi-tion to the volume of extracellular fluid, amount-ing to approximately 80 per cent of the initialvolume. The daily increments, however, becomeprogressively smaller and at the end of 3 to 4days a maximum expansion of volume is reachedwhich is followed by a gradual process of subsi-dence. In terms of initial volumes, the increaseof interstitial fluid is approximately 90 per centand that of blood plasma 60 per cent. An addi-tion to the quantity of protein in plasma occursto an extent which provides a protein concentra-tion at nearly 6 grams per 100 cc. The circulationof extracellular fluid between the vascular andinterstitial compartments is thus sustained andedema does not develop. Comparing the loss ofnitrogen and potassium incidental to fasting withthe N: K ratio in muscle tissue, a relatively smallwithdrawal of intracellular fluid, 950 cc., is indi-cated.
The findings describe the surprising extent towhich the extracellular fluid compartments canbe overfilled without apparent evidence of func-tional disturbance.
Glucose solution. In contrast with the effect ofsalt solution, continuous infusion of 5 per cent
203

JOHN D. STEWARTAND G. MARGARETROURKE
glucose solution causes actual reduction of thevolume of extracellular fluid, as evidenced by lossof body weight and of sodium. This dehydratingeffect is referable to a not quite complete conserva-tion of sodium by the kidney. Renal effectivenessin controlling the formation of an enormous quan-tity of urine (5 liters daily) under circumstanceswhich severely test the reabsorptive mechanismsis, however, very remarkable. The concentrationof sodium in the urine is held below 0.01 Mandsodium concentration in the plasma is almostcompletely sustained. A small protein-sparingeffect from the glucose is shown by a 30 per centreduction in the rate of nitrogen loss found inthe salt infusion study. According to the relativequantities of nitrogen and potassium excreted inthe urine, there is no appreciable withdrawal ofintracellular fluid. The initial rate of glucoseinfusion was 2.4 liters per 24 hours. This wasincreased on the second day to approximately 6liters.
According to evidence from a single patient,infusion of glucose solution at an initial rate of5.5 liters per 24 hours may cause derangement ofrenal control of the electrolyte structure of theplasma (water intoxication). This is shown by afailure to conserve sodium and a consequent rapidfall of sodium concentration in the plasma. Withcessation of infusion there is immediate recoveryof renal control. The concentration of sodiumfalls in the urine and rises to its usual level in theplasma. The data clearly suggest overtaxing ofthe capacity of renal regulation.
These findings illustrate the fallacy of regardingglucose solution as a means of replacing losses ofextracellular fluid and indicate the possible harm-fulness of large infusions. They do not disturbthe rationale of moderate amounts of glucosesolution given intravenously to support renalfunction by providing a physiologically suitablevolume of urine and to replace insensible expendi-tures of water.
Data in agreement with those presented wereobtained from two patients given glucose solutionand from five receiving salt solution.
The authors wish to thank Dr. James L. Gamble forhelp in the preparation of this paper.
BIBLIOGRAPHY
1. Murphy, F. D., Correll, H., and Grill, J. C., Theeffects of intravenous solutions on patients, withand without cardiovascular defects. J. A. M. A.,1941, 116, 104.
2. Blalock, A., Beard, J. W., and Thuss, C., Intravenousinjections. A study of the effects on the com-position of the blood of the injection of variousfluids into dogs with normal and with low bloodpressure. J. Clin. Invest., 1932, 11, 267.
3. Coller, F. A., Dick, V. S., and Maddock, W. G.,Maintenance of normal water exchange with intra-venous fluids. J. A. M. A., 1936, 107, 1522.
4. Cutting, R. A., Lands, A. M., and Larson, P. S.,Distribution and excretion of water and chloridesafter massive saline infusions. Arch. Surg., 1938,36, 586.
5. Warthen, H. J., Massive intravenous injections. Arch.Surg., 1935, 30, 199.
6. Cutting, R. A., Larson, P. S., and Lands, A. M.,Cause of death resulting from massive infusions ofisotonic solutions. Arch. Surg., 1939, 38, 599.
7. Hastings, A. B., and Eichelberger, L., The exchangeof salt and water between muscle and blood. I.The effect of an increase in total body water pro-duced by the intravenous injection of isotonic saltsolutions. J. Biol. Chem., 1937, 117, 73.
8. Gilligan, D. R., Altschule, M. D., and Volk, M. C.,The effects on the cardiovascular system of fluidsadministered intravenously in man. I. Studies ofthe amount and duration of changes in blood volume.J. Clin. Invest., 1938, 17, 7.
9. Gamble, J. L., Ross, G. S., and Tisdall, F. F., Themetabolism of fixed base during fasting. J. biol.Chem., 1923, 57, 633.
10. Gamble, J. L., and McIver, M. A., Body fluid changesdue to continued loss of the external secretion ofthe pancreas. J. exper. Med., 1928, 48, 859.
11. Gamble, J. L., Extracellular fluid and its vicissitudes.Bull. Johns Hopkins Hosp., 1937, 61, 151.
12. Peters, J. P., Body Water: The Exchange of Fluids inMan. Charles C. Thomas, Baltimore, 1935.
13. Peters, J. P., The distribution and movement of waterand solutes in the human body. Yale J. Biol. Med.,1933, 5, 431.
14. Gatch, W. D., and Little, W. D., Amounts of bloodlost during some of the more common operations.J. A. M. A., 1924, 83, 1075.
15. Butler, A. H., and Tuthill, E., An application of theuranyl zinc method for determination of sodiumin biological material. J. biol. Chem., 1931, 93, 171.
16. Folin, O., Laboratory Manual of Biological Chem-istry. D. Appleton-Century Co., New York, 1934,Fifth ed.
17. Wilson, D. W., and Ball, E. G., A study of the esti-mation of chloride in blood and serum. J. biol.Chem., 1928, 79, 221.
204

EFFECTS OF LARGE INTRAVENOUSINFUSIONS
18 Van Slyke, D. D., and Sendroy, J., Jr., Carbon dioxidefactors for manometric blood gas apparatus. J.biol. Chem., 1927, 73, 127.
19. Wong, S. Y., The use of persulfate in the estimationof nitrogen by the Arnold-Gunning modification ofKjeldahl's method. J. biol. Chem., 1923, 55, 427.
20. Howe, P. E., The use of sodium sulphate as theglobulin precipitant in the determination of proteinsin blood. J. biol. Chem., 1921, 49, 93.
21. Wells, H. S., Youmans, J. B., and Mills, D. G., Aformula and monogram for the estimation of theosmotic pressure of colloids from the albumin andtotal protein concentrations of human blood sera.
J. Clin. Invest., 1933, 12, 1103.22. Van Slyke, D. D., and Neill, J. M., The determination
of gases in blood and other solutions by vacuum
extraction and manometric measurement. J. biol.Chem., 1924, 61, 523.
23. Gregersen, M. I., Gibson, J. J., and Stead, E. A.,Plasma volume determination with dyes: errors incolorimetry; the use of the blue dye T-1824. Am.J. Physiol. (Proc.), 1935, 113, 54.
24. Stewart, J. D., and Rourke, G. M., On the measure-ment of extracellular fluid volume with thiacyanate,and body fluid analyses in 33 normal individuals. J.Lab. and Clin. Med., 1941, 26, 1383.
25. Stewart, J. D., and Rourke, G. M., Changes in bloodand interstitial fluid resulting from surgical opera-tion and ether anesthesia. J. Clin. Invest., 1938, 17,413.
26. Lavietes, P. H., Bourdillon, J., and Klinghoffer, K A.,The volume of the extracellular fluids of the body.J. Clin. Invest., 1936, 15, 261.
205