effects of urbanization on meteorological parametersmetnet.imd.gov.in/mausamdocs/15534_f.pdf ·...
TRANSCRIPT

MAUSAM, 55, 3 (July 2004), 429-440
551.588.7
† Presented at the National Symposium on “Advances in frontier areas of Meteorology at the turn of millennium” held at Andhra University, Visakhapatnam, 29-31 October.
(429)
Effects of urbanization on meteorological parameters†
G. S. PRAKASA RAO, A. K. JASWAL and M. S. KUMAR*
India Meteorological Department, Pune - 411 005, India
*Meteorological Office, Santacruz Airport, Mumbai - 400 094, India
(Received 6 May 2003, Modified 14 October 2003)
lkj lkj lkj lkj & Hkkjr tSls fodkl’khy ns’kksa esa nwljs LFkkuksa ls vkdj cls yksxksa] c<+h gqbZ vkcknh ds dkj.k ÅtkZ dh [kir esa gqbZ o`f)] c<s+ gq, ;krk;kr ,oa vkS|ksfxd dk;Zdykiksa ouksa dh dVkbZ rFkk ok;qeaMy ,oat ty eaMy esa NksM+s x, vif’k"V inkFkksZa ds ifj.kkeLo:Ik 'kgjksa ds i;kZoj.k ij fujarj izfrdwy izHkko iM+ jgk gSA 'kgjhdj.k ds lkFk gh lkFk vkS|ksfxdhdj.k dh xfrfof/k;k¡] o"kkZ] iou lkisf{kd vknzZrk vkSj rst+ /kwi ds ?kVksa tSls ‘’kgj dh tyok;q ds ?kVdksa dks izHkkfor djrh gSaA bl 'kks/k&i= dk vf/kdk¡’k v/;;u eq[;r% e/; v{kka’kh; egkuxjksa ds laca/k esa gSA fuEu v{kka’kh; egkuxjksa esa 'kgjhdj.k ds ifj.kkeLOk:Ik vk, ifjorZuksa ¼rkieku dks NksM+dj½ ds fo"k; esa cgqr gh de tkudkjh bl 'kks/ki= esa nh xbZ gSA
1950 ds ckn egkuxjksa esa m|ksxksa dh la[;k esa dkQh o`f) gqbZ gSA bl v/;;u ds fy, nl yk[k+ ls
vf/kd dh vkcknh okys ianzg 'kgjksa ¼pkj egkuxjksa lfgr½ dks pquk x;k gSA i`Foh ij vkus okys lkSj fofdj.k] rst+ ?kwi ds ?kaVs] lkisf{kd vknzZrk] o"kkZ] iouxfr] dqy es?k vkPNknu vkSj vf/kdre ,oa U;wure rkieku tSls fofHkUu ekSle oSKkfud izkpyksa ds tyok;fod vk¡dM+ksa dk fo’ys"k.k jSf[kdh; fo’ys"k.k izo`fr ds vk/kkj ij fd;k x;k gSA bu ekSle oSKkfud izkpyksa esa ikbZ xbZ izo`fr;ksa dk bl 'kks/k&i= esa foospu fd;k x;k gSA”
ABSTRACT. In developing countries like India, the urban environment is constantly under stress as a result of migrant population, enhanced energy consumption of the growing population, increased traffic load and industrial activity, deforestation and release of waste products into the atmosphere and hydrosphere. This urbanization coupled with industrialisation affect the urban climate like temperature, precipitation, wind, relative humidity and bright hours of sunshine. Most of the studies are mainly confined to the mid-latitude cities and very little is known about these urban induced changes (except for temperatures) for low latitude cities.
There has been a conspicuous increase in the number of industries after 1950 in the cities. Fifteen cities (including
four metros) with a population of more than 1 million are selected for this study. Linear trend analysis was carried out over the climatologically data for different meteorological parameters viz., incoming solar radiation, bright hours of sunshine, relative humidity, rainfall, wind speed, total cloud amount and maximum and minimum temperatures. The trends observed in these meteorological parameters are discussed.
Key words − Urbanization, Clouds, Relative humidity, Solar radiation, Rainfall, Sunshine, Wind, Trends,
Heat wave.
1. Introduction
Urban populations are growing very rapidly
throughout the world. Besides this, the world population is urbanizing much faster than is growing. Phenomenal population growth coupled with fast pace of industrialization have been responsible for urban environmental hazards. In the beginning of the 20th century, India had only one city with more than 1 million
population while the number of such cities are now more than twenty. At present more than 218 million people live in the cities in India, which is second largest in the world.
Industries, automobiles, domestic fuel consumption
and the use of domestic appliances contribute to the emissions while gases from garbage dumps add to the deterioration of the air quality and warming of the city

430 MAUSAM, 55, 3 (July 2004)
Fig. 1. Location of fifteen cities environment. During the quarter century between 1971 to 1995, the number of automobiles increased 16 times for a population increase of about 1.6 times (Statistical Abstract of India 1998 and Malayalam Manorama 1998). Most meteorological parameters are affected by urbanization. Though the work on climates of tropical cities started a few decades ago, the available information is extremely sparse except for temperatures. Lot of work is done on surface air temperature by various authors (Hingane et al. 1985, Rupakumar and Hingane, 1988, Sen Roy and Prasad, 1991, Srivastava et al. 1992) and concluded that there is a warming trend in all India surface air temperature. Studies in the mid latitudes established beyond doubt that urban agglomeration cause measurable changes in the atmosphere immediately adjacent to them e.g., temperatures are increased, horizontal winds
slowed, summer rainfall is enhanced. The increases in atmospheric pollutants reduce solar radiation intensity, affect long wave radiation and shorten sunshine duration.
To study the effect of urbanization on the above meteorological parameters, fifteen Indian cities (including four metros), with a population of more than 1 million are selected and shown in Fig. 1.
2. Data and methodology
Meteorological data pertaining to the Indian region
were collected from India Meteorological Department (IMD) at Pune. The linear trend analysis was carried out for monthly mean meteorological parameters and the

RAO et al. : EFFECT OF URBANIZATION 431
TABLE 1
Trends of annual means of radiation, sunshine duration, relative humidity, total annual rainfall, wind speed, total cloud amount and percentage frequencies of summer maximum temperature > 35° C and winter minimum temperature < 10° C
(%) Frequency of temperature S.
No. Station Name Radiation Sun-shine Relative humidity
Rainfall Wind speed Total cloud
amount Maximum >35° C
Minimum <10° C
1. New Delhi − # − # + # + # − # − − −
2. Jaipur − + # + # + − # − − − #
3. Kanpur * − + − − # − − # +
4. Lucknow * − # + # − − # + + −
5. Guwahati * − # + # + # − # + − − #
6. Patna − − # + # − − # − − −
7. Ahmedabad − # − + # + − # − + −
8. Kolkata − # − # − # + # − # + + − #
9. Surat * + + # + − − # + − #
10. Nagpur − # − + # − − # − # − − #
11. Mumbai − # − # + # + # − # − # + # +
12. Pune − # − + # + # + # + # − # −
13. Hyderabad + # − # − + − # − # + − #
14. Chennai − # − # − # + − # − + # **
15. Bangalore + − # + # + # − # − # + **
* : Data not available, # : Trend is significant at 95% confidence level , + : Trends are increasing , ** : Minimum temperature <10° C was not reported, − : Trends are decreasing
TABLE 2
Period of data considered and percentage change for each parameter
Station Radiation Sunshine Relative humidity Rainfall Wind speed Total cloud amount
Period % increase / decrease
(-)
Period % increase / decrease
(-)
Period % increase / decrease
(-)
Period % increase / decrease
(-)
Period % increase / decrease
(-)
Period % increase / decrease
(-)
New Delhi 1957-2000 -5 1957-2000 -22 1901-2001 14 1901-2000 33 1952-2001 -54 1951-2001 -1
Jaipur 1985-1999 -1 1969-1999 7 1952-2000 7 1901-2000 10 1952-2000 -36 1952-2000 -1
Kanpur @ 1964-1975 -3 1901-1991 1 1901-1991 -3 1952-1991 -34 1951-1991 -5
Lucknow @ 1962-1996 -8 1952-2000 12 1901-2000 -7 1952-2000 -37 1952-2000 6
Guwahati @ 1969-1998 -19 1951-2001 2 1902-1998 12 1951-2001 -20 1951-2001 3
Patna 1985-1999 -5 1960-2000 -17 1951-2000 12 1901-2000 -3 1951-2000 -38 1951-2000 -3
Ahmedabad 1962-2000 -8 1962-2000 -2 1901-2000 21 1901-2000 3 1952-2000 -37 1951-2000 -4
Kolkata 1957-2000 -11 1957-1999 -20 1901-1999 -16 1901-1999 18 1951-1999 -37 1951-1999 4
Surat @ 1950-1989 1 1901-2000 5 1901-2000 3 1952-2000 -3 1951-2000 -17
Nagpur 1960-2000 -6 1960-1998 -2 1901-1998 7 1901-1995 -13 1951-1998 -23 1951-1998 -8
Mumbai 1969-2000 -5 1969-2000 -8 1901-2000 4 1901-2000 30 1952-2000 -59 1951-2000 -7
Pune 1957-2000 -4 1945-2000 -3 1901-2002 15 1901-2000 23 1952-2002 38 1951-2002 14
Hyderabad 1978-1999 21 1969-1998 -8 1951-1998 -1 1901-1998 9 1951-1998 -13 1951-1998 -11
Chennai 1957-2000 -5 1957-1999 -4 1901-1999 -5 1901-1999 5 1951-1999 -30 1951-1999 0
Bangalore 1981-1998 2 1953-2000 -24 1901-2000 4 1901-2000 17 1951-2000 -58 1951-2000 -8
@ : Stations are not recording radiation measurements

432 MAUSAM, 55, 3 (July 2004)
Fig. 2. Annual mean global radiations significant at 95% level significance was tested at 95% level of confidence by using t–statistic. The trends (positive or negative) exhibited by different stations on individual parameters are given in Table 1 while the percentage change of the parameter calculated for the availability of the data period are presented in Table 2.
3. Discussions
3.1. Impact of Urbanisation of meteorological
parameters 3.1.1. Total incoming short wave radiation The urban areas are now in the process of increasing
their industrial production and little control has been
exerted to reduce emissions of gases and particulates. Consequently, the increasing amounts of pollutants in tropical urban areas lead to greater absorption, scattering and reflection of incoming solar radiation, which in turn reduces the amount of energy reaching the urban surface.
The radiation data were analysed for available 11
stations except Kanpur, Lucknow, Guwahati and Surat. Results indicate that New Delhi, Ahmedabad, Kolkata, Nagpur, Mumbai, Pune and Chennai are showing significant negative trends (Fig. 2). The percentage decrease varies from station to station between 11% at Kolkata to 1% at Jaipur. Hyderabad and Bangalore exhibit increasing trends, though they were significant for Hyderabad only. The increase in total incoming solar
RAO et al. : EFFECT OF URBANIZATION 433
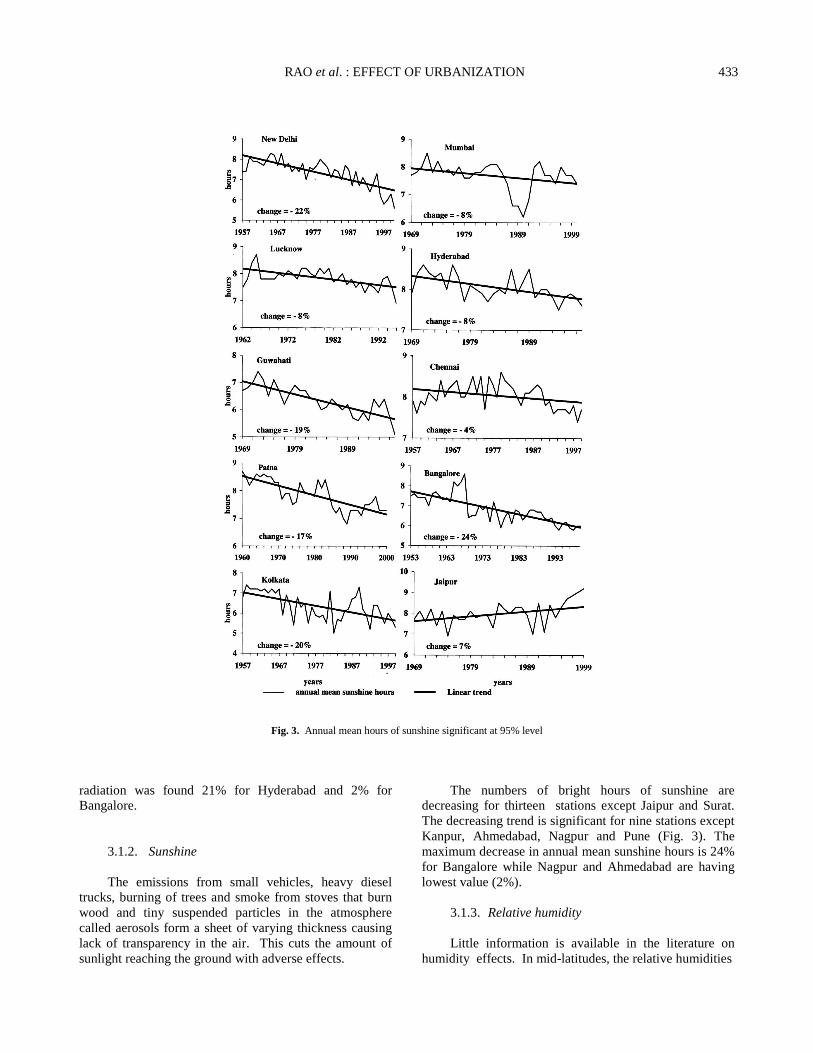
Fig. 3. Annual mean hours of sunshine significant at 95% level radiation was found 21% for Hyderabad and 2% for Bangalore.
3.1.2. Sunshine The emissions from small vehicles, heavy diesel
trucks, burning of trees and smoke from stoves that burn wood and tiny suspended particles in the atmosphere called aerosols form a sheet of varying thickness causing lack of transparency in the air. This cuts the amount of sunlight reaching the ground with adverse effects.
The numbers of bright hours of sunshine are decreasing for thirteen stations except Jaipur and Surat. The decreasing trend is significant for nine stations except Kanpur, Ahmedabad, Nagpur and Pune (Fig. 3). The maximum decrease in annual mean sunshine hours is 24% for Bangalore while Nagpur and Ahmedabad are having lowest value (2%).
3.1.3. Relative humidity
Little information is available in the literature on
humidity effects. In mid-latitudes, the relative humidities

434 MAUSAM, 55, 3 (July 2004)
Fig. 4. Annual mean relative humidity significant at 95% level are lower in the urban areas because of the heat island effect. But in the present study, this effect is not seen at all the stations. The relative humidity values are having increasing trend for 12 stations and significant for 11. The maximum increase in annual mean relative humidity is for Ahmedabad (21%) and the minimum increase is for Kanpur (1%). Kolkata, Hyderabad and Chennai exhibit a decreasing trend, which is significant for Kolkata and Chennai. The significant trends are given in Fig. 4. The variation in the decreasing trend is in the range of 16%
(Kolkata) to 1% (Hyderabad). The heat island effect may cause lower humidities but one has to study the flow rate of diffusion air, density of population and tall buildings effect before generalization.
3.1.4. Rainfall
Urbanization leads to increased buoyancy and convection thereby resulting in increased precipitation (Padmanabhamurty and Bahal 1984). Eleven stations are

RAO et al. : EFFECT OF URBANIZATION 435
Fig. 5. Annual rainfall trends significant at 95% level

436 MAUSAM, 55, 3 (July 2004)
Fig. 6. Annual mean wind speed significant at 95% level showing increasing trend in annual rainfall in conformity with urbanisation effect and significant for New Delhi, Guwahati, Kolkata, Mumbai, Pune and Bangalore (Fig. 5).
The increase in annual total rainfall varies between 33% at New Delhi and 3% at Ahmedabad and Surat. However, rainfall trends at Kanpur, Lucknow, Patna and Nagpur are

RAO et al. : EFFECT OF URBANIZATION 437
Fig. 7. Annual mean total cloud amount trends significant at 95% level decreasing but are not significant. This decrease in annual total rainfall varies between 13% (Nagpur) and 3% (Kanpur, Patna).
Reports in the literature are divergent on the effects of urbanization and industrialization on precipitation. Arguments are advanced that, large city with a super
abundance of condensation nuclei, influence precipitation processes towards a reduction in precipitation by increasing the number of small droplets in the form of clouds and smog. On the other hand smaller urban complexes may supply the right amount of additional condensation nuclei to increase precipitation amounts. Further studies are necessary in this direction.

438 MAUSAM, 55, 3 (July 2004)
Fig. 8. Percentage frequencies of maximum temperature >35° C during March to June significant at 95 % level
Fig. 9. Percentage frequencies of minimum temperature <10° C during December, January and February significant at 95 % level

RAO et al. : EFFECT OF URBANIZATION 439
3.1.5. Wind speed Landsberg (1970) has pointed out that in the large
industrial cities, wind speeds are reduced by 25% and the frequency of calms is increased by 5-20%. The increase in surface roughness within cities causes a reduction of strong wind speeds during the day.
Except Pune (+38%), all the remaining 14 stations
showed a decreasing trend during the daytime. The decreasing trends are significant for 13 stations except Surat (Fig. 6). The reduction in wind speed varies between 59% (Mumbai) and 3% (Surat).
3.1.6. Total cloud amount The measurement of total cloud amount is subjective
and proper care has to be exercised while inferring. The total cloud amount trends are decreasing in respect of 11 stations out of which for 5 stations (Surat, Nagpur, Mumbai, Hyderabad and Bangalore), the trends are significant. The percentage decrease varies from 1% (New Delhi and Jaipur) to 17% (Surat). Lucknow, Guwahati, Kolkata and Pune are having increasing trends in cloud amounts, however trend only at Pune is significant (Fig. 7). The increase in annual mean total cloud amount varies between 3% (Guwahati) and 6% (Lucknow).
3.1.7. Temperatures In the present study the percentage frequency of the
number of days with summer maximum temperature more than 35o C and winter minimum temperature less than 10o C were studied as they have more effects on human beings. The trends for maximum temperature are decreasing for New Delhi, Jaipur, Kanpur, Guwahati, Patna, Nagpur, Pune and significant for Kanpur and Pune only. The trends are positive over Lucknow, Ahmedabad, Kolkata, Surat, Mumbai, Hyderabad, Chennai, and Bangalore and are significant for Mumbai and Chennai (Fig. 8).
The minimum temperature trends are negative for
New Delhi, Jaipur, Lucknow, Guwahati, Patna, Ahmedabad, Kolkata, Surat, Nagpur, Pune and Hyderabad and are significant except for New Delhi, Lucknow, Patna, Ahmedabad and Pune (Fig. 9).
3.2. Future projections Over next 30 years, global population is projected to
grow by nearly 2/3rd from current 5.5 billion to 8.5 billion.
About 7.1 billion people will live in developing countries alone. Population in industrialised countries is now 1.2 billion, which is projected to rise 1.4 billion by the year 2025. World population is urbanising due to shrinking economic opportunities in rural areas. This trend is going to increase the population of mega cities, which are sources of environmental hazards. Disposal of human and industrial waste in rivers and air not only affect the atmosphere and climate but also degrade the quality of fresh water. Rain brings about 400 million hectare meters of water each year to India. However, seventy percent of India’s water supply is polluted. It is time for the policy makers to do something. 4. Conclusions (i) The trends shown by the various meteorological parameters are not uniform for all the Indian cities. (ii) In general radiation values, bright sunshine hours, wind speeds and total cloud amounts are decreasing. Relative humidity, rainfall amounts are increasing. Percentage number of days of maximum/minimum temperatures with a threshold value of >35° C / <10° C are decreasing / increasing respectively over north India while maximum temperature days are increasing over south India. (iii) Orography, the density of population, the distance between the tall buildings, vehicular pollution and the industrial development play an important role in controlling the urban climate. (iv) At this present stage of development, urban climate studies based on routine climatological data leading to description of meteorological features will be necessary for some more time in tropical areas until sufficient knowledge is available for generalisation. Acknowledgements
The authors are thankful to Mrs. Sheeja Kurian for keying in the manuscript.
References
Hingane, L.S., Rupakumar and Ramana Murthy, Bh. V., 1985, “Long-term trends of surface air temperature in India” J. Climatol., 5, 521-528.
Landsberg, H.E., 1970, “Man-made climatic change” Science, 170, 1265-1274.

440 MAUSAM, 55, 3 (July 2004)
Padmanabhamurty, B. and Bahal, H.D., 1984, “Isothermal and isohyetal patterns of Delhi as a sequel of urbanization” Mausam, 35, 4, 539-540.
Rupakumar, K. and Hingane, L. S., 1988, “Long term variations of surface air temperature at major industrial cities of India” Climatic Change, 13, 287-307.
Sen Roy, N. and Prasad, K., 1991, “Climate change and global scientific response, Vayu Mandal, 69-81.
Srivastava, H.N., Dewan, B.N., Dikshit, S.K., Prakash Rao, G.S., Singh, S.S. and Rao, K.R., 1992, “Decadal trends in climate over India”, Mausam, 43, 1, 7-20.