effects of type and amount of fault current limiter
TRANSCRIPT
Signal Processing and Renewable Energy
June 2017, (pp.27-34) ISSN: 2588-7327
Effects of Type and Amount of Fault Current Limiter Impedance on
Stability of System after Short Circuit Fault Occurrence in the Network
Seyed Mohammad Reza Modaresi1, Mahmoud Modaresi*2 1 Department of Computer Engineering and Information Technology, AmirKabir University of
Technology, Tehran, Iran. 2 Department of Electrical Engineering, South Tehran Branch, Islamic Azad University, Tehran, Iran.
Received: 23 April, 2016 Accepted: 01 July, 2017
Abstract
Due to expansion of power network, the short circuit current of power system are increased. Fault
current limiters (FCL) are responsible to reduce and limit the fault currents. In addition, these com-
ponents can also improve the stability of system. In this paper the effect of type and amount of FCL
impedance on angle stability power system is investigated. Furthermore, the indices of rotor mechan-
ical angle generator, when it reaches the steady state, after oscillations due to the fault occurrence for
two types of FCL impedance (resistant and inductance) are being studied. Based on these indices,
the amount of optimum FCL impedance for both resistant and inductance FCL are simulated and cal-
culated on a tested network using a developed computer program.
Keywords: Terms—Fault Current Limiters (FCLs), System Stability, Short Circuit Fault, FCL impedance.
1. INTRODUCTION
The rise in producing and consuming electrical
energy cause the transmission network and
electricity distribution extension. Networks
internal connection, installing series of capaci-
tors and building parallel lines, cause loss re-
duction, increase in power transmission and
increase in system’s reliability and can cause
rise in number of fault and rise in short circuit
currents [1]–[8].
Flowed fault current, cause creation me-
chanical and thermal stress in system’s equip-
ment like transformers, overhead lines, cables
and switches [5]–[10]. Power switches prevent
equipment damaging by disrupting these
currents. But building switches and other
equipment based on short circuit current is not
considered as an appropriate and ideal solution
because the cost of this equipment in compari-
son with weaker equipment is more expensive
and also it’s not possible to destroy destructive
effects of short circuit current on power net-
works [3]. Hence, experts had thought of build-
ing equipment, to limit short circuit current.
Range of short circuit depends on equivalent
Thevenin impedance from fault occurrence lo-
cation. Hence, the basis of these methods is
reducing the range of short circuit in proportion
to increase equivalent Thevenin impedance
from the fault location [5], [11]. Limiting fault
current equipment are called Fault current lim-
iters (FCL) [1], [5].
*Corresponding Author’s Email: [email protected]

28 Modaresi, Modaresi. Effects of Type and Amount of Fault Current Limiter Impedance on …
FCLs other than reducing fault current also
have other advantages including improving
system stability [3], [6], [12], [13] reducing
rate of rise of recovery voltage (RRRV) of
power circuit breakers [11], improving power
quality [14], reducing potential drop [3], [14],
increasing reliability [3], [15], [16]. Including
FCLs disadvantages, cause disturbance in net-
work protective system that for solving this
problem, relays are being reset [14], [17].
This paper shows that though the main tar-
get of installing FCL is reducing system’s fault
current, this equipment can cause system sta-
bility improvement and network potential drop
reduction. Level of this effect is different based
on the amount and type of FCL impedance in
the terms of resistive or inductive.
This paper is formed of 5 sections. In the
first part, an introduction about necessity of
optimization and briefly about works done on
the FCL in previous papers and this paper has
been represented. In part two, different types of
FCL and its performance have been represent-
ed and a simple model for using in this paper
has been represented. In part three, a test net-
work and its performance have been represent-
ed. In part four, taking account the different
amounts of impedance for FCL, done short cir-
cuit test and its results have been represented.
In part five, a total conclusion of paper has
been represented.
2. FCL MODEL
In network normal condition, FCLs approxi-
mately don’t show impedance but in fault con-
dition, importing a series of impedance to the
network, cause fault current limitation [4], [5],
[18]. How to import and export this impedance
based on the type of FCL and its structure is
different and its impedance in some FCLs is
variable. This impedance can be pure induc-
tive, pure resistive or Combine them [3], [14],
[18].
Different types of FCL are
FCLs based on PTC resistance [19].
1- FCLs by mechanical switches [20].
2- FCLs based on resonance circuit and
Thyristor switch [7], [8], [10], [14].
3- Magnetic FCLs [1], [2].
4- Superconductor FCLs (SFCLs) [6], [9],
[12], [15], [18].
SFCLs enter the system as soon as fault
current incensement and limit the first cycle
of fault current [4].
In this paper to modeling the FCL, pure
resistive or inductive impedance employed a
cycle post fault occurrence, in series to sys-
tem circuit. This impedance after resolving
fault or cutting troubled part of system, by
two delay cycles returns to its normal state
means impedance zero state. Figure (1)
shows FCL condition pre and post fault that
can represent each of FCL types. Represent-
ed model taking account the targets of the
paper is proper and useful.
3. INTRODUCING the SAMPLE NETWORK
and TEST SCENARIO
A. Introducing Tested Network
Test network that its single line diagram is
shown in figure (2), includes two regional elec-
tricity systems (Area 1 and Area 2).
Fig. 1. Conditions of FCL from the left to the
right, pre fault and post fault.
Fig. 2. Single line diagram of test system.
G1 G2 G1 G2
Line2 LineB
LineA
Load1
LineA
Load2 LineB
T1 T2 T2 T1
FCL Fault
Line1 B2
Area2 B1
Area1 CB1 CB2
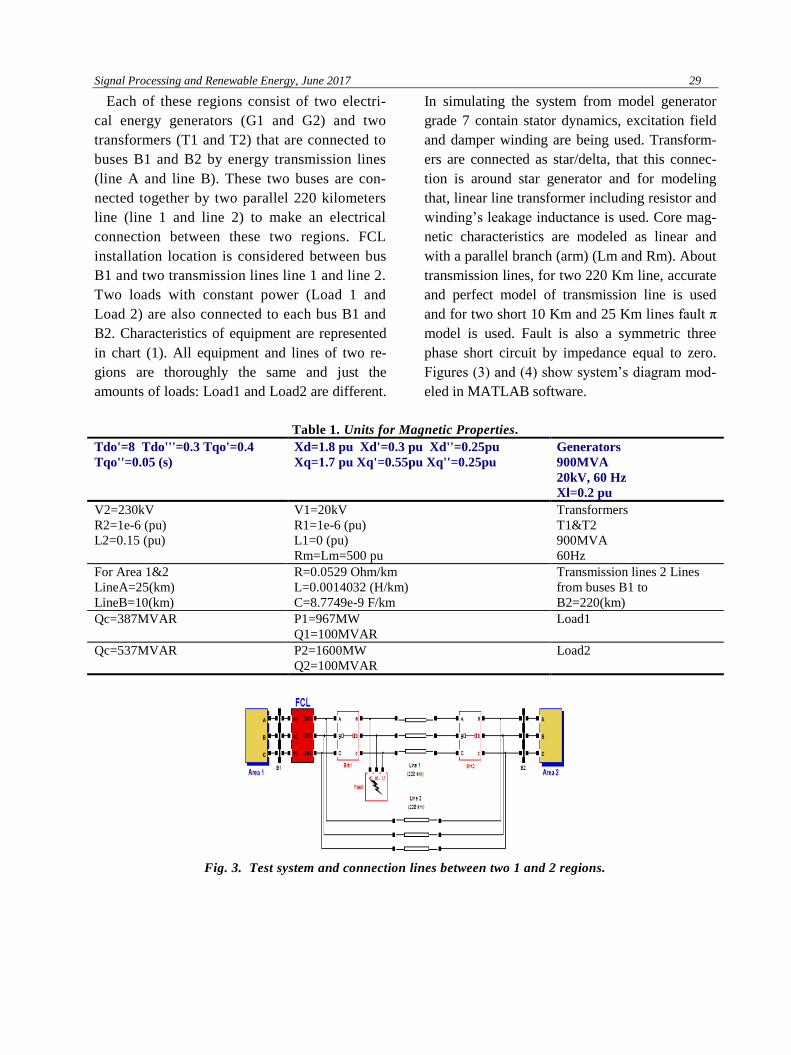
Signal Processing and Renewable Energy, June 2017 29
Each of these regions consist of two electri-
cal energy generators (G1 and G2) and two
transformers (T1 and T2) that are connected to
buses B1 and B2 by energy transmission lines
(line A and line B). These two buses are con-
nected together by two parallel 220 kilometers
line (line 1 and line 2) to make an electrical
connection between these two regions. FCL
installation location is considered between bus
B1 and two transmission lines line 1 and line 2.
Two loads with constant power (Load 1 and
Load 2) are also connected to each bus B1 and
B2. Characteristics of equipment are represented
in chart (1). All equipment and lines of two re-
gions are thoroughly the same and just the
amounts of loads: Load1 and Load2 are different.
In simulating the system from model generator
grade 7 contain stator dynamics, excitation field
and damper winding are being used. Transform-
ers are connected as star/delta, that this connec-
tion is around star generator and for modeling
that, linear line transformer including resistor and
winding’s leakage inductance is used. Core mag-
netic characteristics are modeled as linear and
with a parallel branch (arm) (Lm and Rm). About
transmission lines, for two 220 Km line, accurate
and perfect model of transmission line is used
and for two short 10 Km and 25 Km lines fault π
model is used. Fault is also a symmetric three
phase short circuit by impedance equal to zero.
Figures (3) and (4) show system’s diagram mod-
eled in MATLAB software.
Table 1. Units for Magnetic Properties.
Generators 900MVA
20kV, 60 Hz
Xl=0.2 pu
Xd=1.8 pu Xd'=0.3 pu Xd''=0.25pu
Xq=1.7 pu Xq'=0.55pu Xq''=0.25pu Tdo'=8 Tdo'''=0.3 Tqo'=0.4
Tqo''=0.05 (s)
Transformers T1&T2 900MVA
60Hz
V1=20kV R1=1e-6 (pu) L1=0 (pu) Rm=Lm=500 pu
V2=230kV R2=1e-6 (pu) L2=0.15 (pu)
Transmission lines 2 Lines
from buses B1 to
B2=220(km)
R=0.0529 Ohm/km L=0.0014032 (H/km) C=8.7749e-9 F/km
For Area 1&2 LineA=25(km) LineB=10(km)
Load1 P1=967MW
Q1=100MVAR Qc=387MVAR
Load2 P2=1600MW
Q2=100MVAR Qc=537MVAR
Fig. 3. Test system and connection lines between two 1 and 2 regions.

30 Modaresi, Modaresi. Effects of Type and Amount of Fault Current Limiter Impedance on …
Fig. 4. Region 1 power network and its equipment.
B. Test’s Scenario
The test scenario is like this that a symmetric
three phase short circuit happens in the point
shown in figure (2). One cycle after fault oc-
currence, FCL enters the circuit and the ZFCL
impedance is set in the circuit to limit fault cur-
rent. At the same time protective relays specify
fault occurrence and cut command is sent to
switches set in two sides of fault location.
Switches work after 200ms and the fault point
will be separated. After resolving the fault, it
takes two cycles that FCL returns to its normal
state and system got its new normal state.
Test process for different amounts of resis-
tive or inductive impedance for FCL has been
done that taking account that three phase short
circuit occurrence in network and also amount
and type of FCL impedance, maximum rate of
deviation of generator bus angle (∆Ɵ) in terms of
degree and also period of angular fluctuations
attenuation (ts) in terms of second is calculated.
For choosing attenuation period ts it is calculated
like angular fluctuation should be in the range of
2 percentages less or more than final amount.
4. RESULT OF THE TEST ON SAMPLE
NETWORK
First, it is considered that FCL is not in the
network means FCL impedance equals to zero.
Figure (5) shows angle fluctuations curve for
both generators of region one (G1 and G2)
without FCL. Fault occurred in sixth second
and power switches separate fault transmission
line from the entire network after 200ms. It is
observed that in the mood without FCL system
is unstable and the amount of generator bus
angle deviation tends to infinite.
To make the system be stable, a FCL is in-
stalled in the network. By installing a FCL with
impedance equal to ZFCL=1+i12, it is ob-
served that after fault occurrence the amount of
generator bus angle deviation is affected by
fluctuation but after a while again returns to
stable state. Hence, network becomes stable by
presence of FCL. Figure (6) shows fluctuations
of generator bus angle deviation G1 in propor-
tion to time. The reason of choosing generator
G1 is that its bus angle deviation amount is
larger than other generators. Taking account
the figure, the amount of generator bus angle
deviation G1 for pre and post fault in system
stable conditions equal to 29 and 5.55 degree
respectively. The period of angle fluctuation
attenuation (tsG1) equals to 13 minus 6 sec-
onds. Also the maximum amount of this gener-
ator bus angle deviation (∆ƟG1Max) equals to
2.116 degree in this condition.
Fig. 5. Generator bus angle deviation-without FCL.

Signal Processing and Renewable Energy, June 2017 31
Fig. 6. Generator bus angle deviation curve G1 of region 1.
For studying the effect of type and amount
of FCL impedance on stability indicators, two
kinds of FCL which are resistive and inductive
are considered and the amounts of indicators
∆ƟG1Max and tsG1 taking account the resis-
tive amounts of FCL impedance are calculated.
Figures (7) and (8) and also chart (2) show the
result of test for different amounts of FCL im-
pedance.
Figure (7) shows that by increasing the im-
pedance for both types of FCL, first ∆ƟG1Max
indicator will decrease in a way that for resistive
FCL by considering R=7.25, reaches its mini
mum amount equals to 72.4 degree and for induc-
tive FCL by considering L=200mH and imped-
ance Z=i75.4 Ω reaches to 84.2 degree. But after
this amount, by increasing FCL impedance, the
process of ∆ƟG1Max reduction stops and starts
increasing that in R=16.5 Ω or L=470mH system
enters angular instability.
Rate of reduction and incensement the an-
gular fluctuation degradation (tsG1) in figure
(8) is approximately similar to diagram
∆ƟG1Max. So that approximately in that point
that we observe more reduction of ∆ƟG1Max,
less time tsG1 wills occur.
Fig. 7. The amount of ∆ƟG1Max taking account the amount of FCL impedance.
Fig. 8. Time of fluctuations degradation tsG1 taking account the FCL impedance.
72.4
84.8 84.2
0
20
40
60
80
100
120
140
160
0 20 40 60 80 100 120 140 160 180 200
Tim
e in
deg
ree
FCL impedance in ohm
∆ƟG1Max after fault occurence
اهمی خالص سلفی خالص
4.14.34
4.12 4.15
0
2
4
6
8
10
0 20 40 60 80 100 120 140 160 180 200
Tim
e in
se
con
d
FCL impedance in ohm
Maximum time of tsG1 after fault occurence
اهمی خالص سلفی خالص

32 Modaresi, Modaresi. Effects of Type and Amount of Fault Current Limiter Impedance on …
Table 2. Units for Magnetic Properties.
Resistive FCL
(Ohm)
∆ƟG1Max for
RFCL
tsG1 for
RFCL
Inductive FCL
(Ohm)
∆ƟG1Max for
XFCL
tsG1 for
XFCL
0 Inf Inf 0 Inf Inf
0.9 138.7 7.65 11.31 Inf Inf
1.5 112.7 6.14 12.06 138.7 7.65
2 103.2 6.25 15.08 120 6.95
2.5 98 5.72 18.85 109 6.6
3 93.5 4.1 28.27 97.5 5.9
4 85.5 4.18 37.70 91.2 5.35
5 80 6.3 49.01 86.5 4.12
6 74.4 6.35 56.55 84.8 4.15
7.25 72.4 4.34 75.40 84.2 5.73
8 73.2 4.35 94.25 90 6.32
9 75.5 4.42 113.1 98.5 6.72
10 79 4.46 132 108.5 6.9
12 92.5 6.41 150.8 121.5 7.14
15 123 7.19 169.7 137.7 7.73
16.2 140.5 8.05 175.3 146.2 8.39
16.5 Inf Inf 177.2 Inf Inf
Rate of reduction and incensement the an-
gular fluctuation degradation (tsG1) in figure
(8) is approximately similar to diagram
∆ƟG1Max. So that approximately in that point
that we observe more reduction of ∆ƟG1Max,
less time tsG1 wills occur.
Results of analysis, reveals two important
points. First, resistive FCL even in low
amounts of impedance can strongly cause sys-
tem stability but for guarantying system’s sta-
bility by an inductive FCL, higher impedance
is required. Resistive FCL can reach the least
amount of ∆ƟG1Max equals to 72.4 degree,
while by an inductive FCL in the best position
reaches to 84.2 degree that in comparison with
resistive FCL is worst.
Second, though FCLs can cause system sta-
bility, but if FCL impedance was higher that a
specific amount, not only couldn’t cause sys-
tem stability but also could cause system insta-
bility. Hence, taking account the higher amount
of FCL impedance, the more fault current re-
duction and in the impedances higher than FCL
angular instability may happen so, choosing the
amount of FCL impedance based on more fault
current reduction, can not necessarily lead to
optimum choice and in system stability subject
should be considered in FCL optimum imped-
ance calculation. Figures (9) and (10), show
angle fluctuation curve for first region genera-
tors G1 and G2 in the state of resistive imped-
ance equals to R=7.25 Ω and inductive imped-
ance equals to L=200mH and impedance equals
to Z=i75.4 Ω.
Fig. 9. Generator bus angle deviation with resis-
tive FCL R=7.25 Ω.
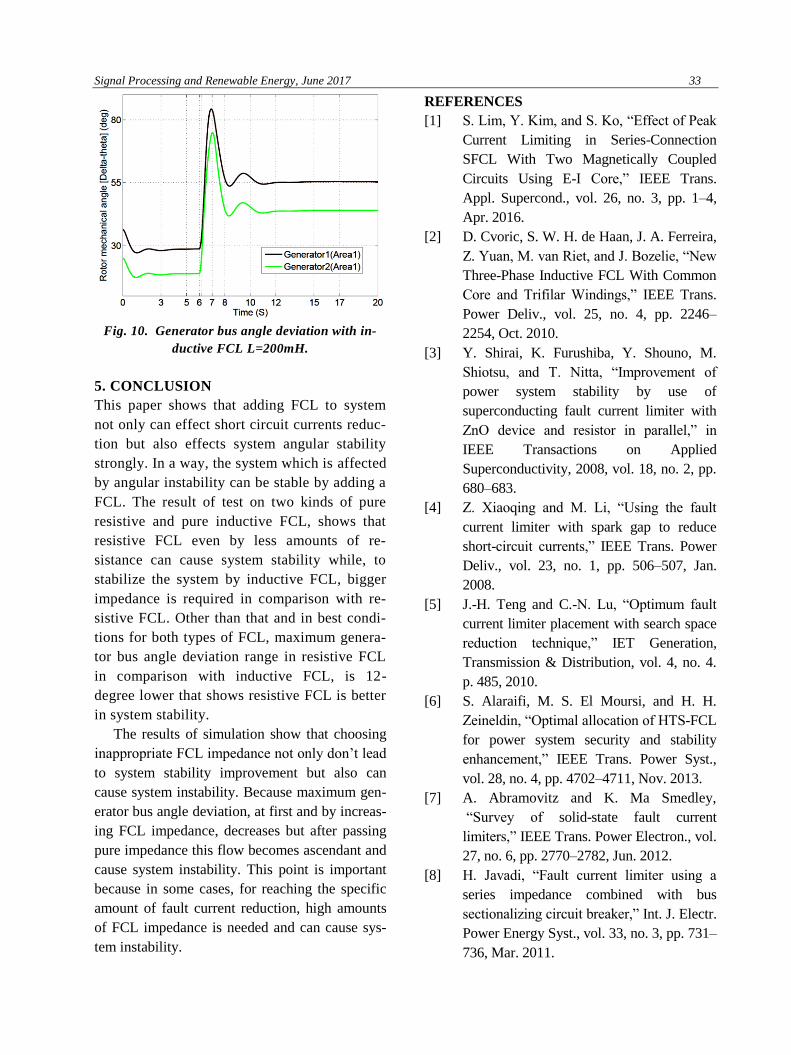
Signal Processing and Renewable Energy, June 2017 33
Fig. 10. Generator bus angle deviation with in-
ductive FCL L=200mH.
5. CONCLUSION
This paper shows that adding FCL to system
not only can effect short circuit currents reduc-
tion but also effects system angular stability
strongly. In a way, the system which is affected
by angular instability can be stable by adding a
FCL. The result of test on two kinds of pure
resistive and pure inductive FCL, shows that
resistive FCL even by less amounts of re-
sistance can cause system stability while, to
stabilize the system by inductive FCL, bigger
impedance is required in comparison with re-
sistive FCL. Other than that and in best condi-
tions for both types of FCL, maximum genera-
tor bus angle deviation range in resistive FCL
in comparison with inductive FCL, is 12-
degree lower that shows resistive FCL is better
in system stability.
The results of simulation show that choosing
inappropriate FCL impedance not only don’t lead
to system stability improvement but also can
cause system instability. Because maximum gen-
erator bus angle deviation, at first and by increas-
ing FCL impedance, decreases but after passing
pure impedance this flow becomes ascendant and
cause system instability. This point is important
because in some cases, for reaching the specific
amount of fault current reduction, high amounts
of FCL impedance is needed and can cause sys-
tem instability.
REFERENCES
[1] S. Lim, Y. Kim, and S. Ko, “Effect of Peak
Current Limiting in Series-Connection
SFCL With Two Magnetically Coupled
Circuits Using E-I Core,” IEEE Trans.
Appl. Supercond., vol. 26, no. 3, pp. 1–4,
Apr. 2016.
[2] D. Cvoric, S. W. H. de Haan, J. A. Ferreira,
Z. Yuan, M. van Riet, and J. Bozelie, “New
Three-Phase Inductive FCL With Common
Core and Trifilar Windings,” IEEE Trans.
Power Deliv., vol. 25, no. 4, pp. 2246–
2254, Oct. 2010.
[3] Y. Shirai, K. Furushiba, Y. Shouno, M.
Shiotsu, and T. Nitta, “Improvement of
power system stability by use of
superconducting fault current limiter with
ZnO device and resistor in parallel,” in
IEEE Transactions on Applied
Superconductivity, 2008, vol. 18, no. 2, pp.
680–683.
[4] Z. Xiaoqing and M. Li, “Using the fault
current limiter with spark gap to reduce
short-circuit currents,” IEEE Trans. Power
Deliv., vol. 23, no. 1, pp. 506–507, Jan.
2008.
[5] J.-H. Teng and C.-N. Lu, “Optimum fault
current limiter placement with search space
reduction technique,” IET Generation,
Transmission & Distribution, vol. 4, no. 4.
p. 485, 2010.
[6] S. Alaraifi, M. S. El Moursi, and H. H.
Zeineldin, “Optimal allocation of HTS-FCL
for power system security and stability
enhancement,” IEEE Trans. Power Syst.,
vol. 28, no. 4, pp. 4702–4711, Nov. 2013.
[7] A. Abramovitz and K. Ma Smedley,
“Survey of solid-state fault current
limiters,” IEEE Trans. Power Electron., vol.
27, no. 6, pp. 2770–2782, Jun. 2012.
[8] H. Javadi, “Fault current limiter using a
series impedance combined with bus
sectionalizing circuit breaker,” Int. J. Electr.
Power Energy Syst., vol. 33, no. 3, pp. 731–
736, Mar. 2011.

34 Modaresi, Modaresi. Effects of Type and Amount of Fault Current Limiter Impedance on …
[9] M. S. El Moursi and R. Hegazy, “Novel
technique for reducing the high fault
currents and enhancing the security of
ADWEA power system,” IEEE Trans.
Power Syst., vol. 28, no. 1, pp. 140–148,
Feb. 2013.
[10] S. B. Naderi, M. Jafari, and M. Tarafdar
Hagh, “Parallel-resonance-type fault current
limiter,” IEEE Trans. Ind. Electron., vol.
60, no. 7, pp. 2538–2546, Jul. 2013.
[11] Qingmin Li, Hongshun Liu, Jie Lou, and
Liang Zou, “Impact Research of Inductive
FCL on the Rate of Rise of Recovery
Voltage With Circuit Breakers,” IEEE
Trans. Power Deliv., vol. 23, no. 4, pp.
1978–1985, Oct. 2008.
[12] [G. Didier and J. Lévêque, “Influence of
fault type on the optimal location of
superconducting fault current limiter in
electrical power grid,” Int. J. Electr. Power
Energy Syst., vol. 56, pp. 279–285, Mar.
2014.
[13] G. Didier, C. H. Bonnard, T. Lubin, and J.
Lévêque, “Comparison between inductive
and resistive SFCL in terms of current
limitation and power system transient
stability,” Electr. Power Syst. Res., vol.
125, pp. 150–158, 2015.
[14] S. Henry and T. Baldwin, “Improvement of
power quality by means of fault current
limitation,” in Thirty-Sixth Southeastern
Symposium on System Theory, 2004.
Proceedings of the, 2004, pp. 280–284.
[15] A. Gyore, S. Semperger, L. Farkas, and I.
Vajda, “Improvement of Functionality and
Reliability by Inductive HTS Fault Current
Limiter Units,” IEEE Trans. Appiled
Supercond., vol. 15, no. 2, pp. 2086–2089,
Jun. 2005.
[16] S. M. Modaresi and H. Lesani, “Analysis of
the Effect of Location and Failure Rates of
Fault Current Limiters on Substations
Reliability,” Int. Trans. Electr. Energy
Syst., 2017.
[17] Y. Pan, M. Steurer, T. L. Baldwin, and P.
G. McLaren, “Impact of Waveform
Distorting Fault Current Limiters on
Previously Installed Overcurrent Relays,”
IEEE Trans. Power Deliv., vol. 23, no. 3,
pp. 1310–1318, Jul. 2008.
[18] S. Kozak, T. Janowski, G. Wojtasiewicz, J.
Kozak, B. Kondratowicz-Kucewicz, and M.
Majka, “The 15 kV Class Inductive SFCL,”
IEEE Trans. Appl. Supercond., vol. 20, no.
3, pp. 1203–1206, Jun. 2010.
[19] J. Skindhøj, J. Glatz-Reichenbach, and R.
Strümpler, “Repetitive current limiter based
on polymer PTC resistor,” IEEE Trans.
Power Deliv., vol. 13, no. 2, pp. 489–494,
1998.
[20] M. Steurer, K. Frohlich, W. Holaus, and K.
Kaltenegger, “A novel hybrid current-
limiting circuit breaker for medium voltage:
principle and test results,” IEEE Trans.
Power Deliv., vol. 18, no. 2, pp. 460–467,
Apr. 2003.