effects of the pandemic on oregon’s healthcare workforce
TRANSCRIPT

Effects of the Pandemic on Oregon’s Healthcare Workforce
November 2020
Prepared for The Oregon Health Authority and the Oregon Workforce and Talent Development Board
KOIN Center 222 SW Columbia Street
Suite 1600 Portland, OR 97201
503-222-6060

ECONorthwest 1
Background
The healthcare sector, in Oregon and nationally, has historically been relatively recession proof. Growing demands of an aging population and insurance-funded medical services have shielded the industry from the sharp revenue and employment declines seen in some other sectors in previous recessions. The current pandemic-driven recession has been different.
The large, initial impacts of the pandemic on revenues and employment in healthcare were somewhat counterintuitive. It would seem that a public health crisis should translate into higher demand for healthcare workers. But as Oregon and the nation prepared for the virus in early March, officials were concerned that infected patients could overwhelm hospital capacity. To preserve hospital beds and medical supplies, Governor Kate Brown suspended non-emergency, elective, and routine medical services on March 19, 2020.1 A regulatory shutdown of services led to abrupt decline in healthcare spending that persisted throughout the stay-at-home period. Fortunately, Oregon was spared the surge in cases that affected the Northeast U.S. during April-May.
A regulatory shutdown was only the beginning of the headwinds facing the industry and its workforce in 2020. When the Governor allowed the resumption of certain elective and non-urgent procedures beginning on May 1st, some patients and healthcare workers were concerned about seeking or providing care with the virus still in the background. Nursing homes and long-term care facilities in particular were—and are—extremely vulnerable to outbreaks. And as the reopening period continued, healthcare employers grappled with a challenge faced by employers in many other industries—the difficulty of securing full schedules from workers who are providing care for family members.
This issue brief examines the impact of the pandemic and recession on Oregon’s healthcare sector with a special focus on effects on the workforce. The brief begins with a discussion of high-level industry trends and then summarizes findings of a survey of Oregon healthcare providers.
Key healthcare sector trends
Healthcare spending: Precipitous decline followed by a partial rebound
The Governor’s stay-at-home order, and fear of the virus, led to an abrupt reduction in consumer spending generally and a disproportionate effect on healthcare spending. Aggregated and anonymized purchase data from consumer credit and debit card spending show that—relative to January levels—healthcare spending declined by more than 60 percent in April (see Figure 1). Spending began to recover gradually in May coincident with the Governor’s order to resume non-urgent, elective care. Much like the national trends, Oregon’s spending continued
1 https://www.oregon.gov/gov/admin/Pages/eo_20-22.aspx

ECONorthwest 2
to recover through mid-summer and leveled off at about a 20 percent reduction in the first half of October. Figure 1: Percent change in healthcare spending compared to January 2020
Source: Opportunity Insights Economic Tracker. Data source: Affinity Solutions. Spending is reported based on the ZIP code where the cardholder lives, not the ZIP code where transactions occurred. Industries are constructed by grouping merchant codes that are used by Affinity Solutions to identify the category of merchant and merchant activity. Analyses at the U.S. level show a wide range in spending reductions across provider types during February-April 2020: dental services (-31 percent), physician services (-21 percent), hospitals (-15 percent), medical laboratories (-13 percent), and home health (-12 percent).2
Telehealth offers important flexibility in the provision of primary care
Telehealth visits have offered an important way to provide services while keeping patients and providers safe during the pandemic. A study of U.S. Medicare beneficiaries reported that 43.5 percent of Medicare primary care visits were provided via telehealth in April—up from less than 1 percent in February3 (see Figure 2). Telehealth visits began to decline when stay-at-home orders ended in May but remained well above February’s levels into the beginning of June.
2 Peterson-KFF Health System Tracker, analysis of BEA and BLS data. https://www.healthsystemtracker.org/chart-collection/what-impact-has-the-coronavirus-pandemic-had-on-healthcare-employment/ 3 Assistant Secretary for Planning and Evaluation (ASPE). July 28, 2020. Issue brief: Medicare beneficiary use of telehealth visits: Early data from the start of the COVID-19 pandemic. https://aspe.hhs.gov/pdf-report/medicare-beneficiary-use-telehealth

ECONorthwest 3
Trends in telehealth visits—a large increase in April and gradual declines beginning in May—were similar for high-cost and dually-enrolled Medicare-Medicaid beneficiaries.
This flexible service allowed patients to receive critical diagnoses along with non-urgent service and mitigated the loss of revenue for some providers.
Figure 2: Primary care visits for Fee-for-Service Medicare beneficiaries (visits in millions per week)
Source: ASPE, “Medicare beneficiary use of telehealth visits: Early data from the start of the COVID-19 pandemic.” Medicare claims data up to June 3rd, available as of June 16.
An almost “V” shaped recovery for healthcare employment
Oregon reported 209,300 healthcare jobs in February.4 Employment fell slightly in March and again in April—an 8.2 percent decline, or more than 17,000 jobs, relative to February (see Figure 3). The rebound began with the sector’s May reopening, continued through July, and leveled off beginning in August. The September job total was 2,900 (1.4 percent) below the February level.
4 Current Employment Estimates (CES), Oregon Employment Department, QualityInfo.org

ECONorthwest 4
Figure 3: Change in healthcare employment relative to February 2020, Oregon
Source: Current Employment Estimates (CES), Oregon Employment Department, QualityInfo.org
Ambulatory care suffered the largest employment losses
The healthcare industry consists of three key sectors: ambulatory care, hospitals, and nursing and residential care facilities. The ambulatory care sector (e.g., dentist offices, medical and diagnostic laboratories, physician offices, outpatient care facilities) delivers the most non-urgent care and was the hardest hit (see Figure 4). Employment in the sector declined by 17 percent (15,900 jobs) in April, relative to February. By contrast, April employment was down 2 percent in hospitals and unchanged in nursing and residential care facilities.
U.S.-level analyses point to differential job impacts within the ambulatory care sector. During February-April, employment in dentist offices fell by more than half while jobs in offices of other/non-physician health practitioners declined by almost a quarter.5
By September, employment in Oregon’s ambulatory care sector had fully recovered and then some. Job totals in the hospital and nursing and residential care facility sectors are still below their February levels.
5 Peterson-KFF Health System Tracker, analysis of BEA and BLS data. https://www.healthsystemtracker.org/chart-collection/what-impact-has-the-coronavirus-pandemic-had-on-healthcare-employment/
-9%
-8%
-7%
-6%
-5%
-4%
-3%
-2%
-1%
0%February March April May June July August September

ECONorthwest 5
Figure 4: Change in healthcare employment relative to February 2020, healthcare subsectors, Oregon
Source: Current Employment Estimates (CES), Oregon Employment Department, QualityInfo.org
Unemployment insurance data suggest somewhat higher rates of job loss in non-metropolitan Oregon
An analysis of September’s continued claims for unemployment insurance for the healthcare and social assistance sector—relative to average employment levels in 2019—points to differential effects across the state (see Figure 5).6 The unemployed-to-2019-employment ratio equals 3.6 percent statewide, which is similar in magnitude to the job losses described above.
Five smaller counties—Columbia, Crook, Lincoln, Linn, and Polk—have ratios above 5 percent. Notably, two large Portland metro counties—Clackamas and Washington—have ratios above the state average. Oregon’s counties outside of metropolitan areas have average ratios of 4 percent—slightly higher than ratios in metro counties (3.6 percent).
6 The Oregon Employment Department (OED) tracks the prior industry of the unemployment insurance claimant. OED reports findings for the Health Care and Social Assistance sector, which extends beyond the healthcare sector and includes a variety of social and community services. In September 2020, jobs in the healthcare sector represented 79 percent of jobs in this larger sector.
-18%
-16%
-14%
-12%
-10%
-8%
-6%
-4%
-2%
0%
2%
February March April May June July August September
Ambulatory health care services Hospitals Nursing and residential care facilities

ECONorthwest 6
Figure 5: Continued unemployment insurance claims during September 2020 as a share of 2019 employment, healthcare and social assistance, Oregon counties
Source: Oregon Employment Department, Oregon Continued Claims for Unemployment Insurance, Monthly, by Place of Residence; Oregon Employment Department, QCEW (2019).
0%
1%
2%
3%
4%
5%
6%
7%
8%
9%
ColumbiaLin
nCro
ok
Linco
lnPolk
Coos
Tillamook
Was
hington
Clackam
as
Yamhill
Klamath
Morro
w
Oregon
Lane
Clatsop
Jose
phine
Multn
omah
Wall
owa
Mario
n
Douglas
Jack
son
Deschute
s
Bento
n
Umatilla
Was
co
Hood River
Union

ECONorthwest 7
Survey of healthcare employers and providers
In 2018, Oregon’s Workforce and Talent Development Board (WTDB) initiated a series of reports aimed at assessing the condition of Oregon’s workforce. One goal of the reports is to gain insights from employers on skill needs and in-demand occupations. Employer surveys have been a key method of collecting employers’ perspectives.
For this report, the WTDB partnered with the Oregon Health Authority (OHA) to assess workforce conditions in the healthcare sector during the early fall of 2020. ECONorthwest developed a 26-question survey instrument in collaboration with WTDB and OHA staff. The survey inquired about impacts of the pandemic and recession on providers’ operating capacity and abilities to retain, attract, and hire workers. The survey also asked respondents to anticipate workforce and training needs in the year ahead.
ECONorthwest contracted with the Lund Report, an Oregon-based healthcare news provider, to disseminate the survey. Lund sent the survey to more than 22,000 individuals, including healthcare providers, employers, and stakeholders who hold positions in a range of healthcare organizations (e.g., hospitals, federal health centers, healthcare and oral health clinics). Two-hundred seventy (270) respondents answered the survey’s initial question about the respondent’s organization. Subsequent questions generally attracted between 75 and 125 responses.
The types of organizations represented most frequently by respondents were behavioral health clinics/providers (26 percent), hospitals (21 percent), and medical clinics/providers (19 percent) (categories are not mutually exclusive). Almost 40 percent of respondents were care providers; 31 percent were administrators. The primary service geography for about three quarters of respondents was urban or urban/rural mix, and nearly half (45 percent) represented organizations with 300 or more employees.7 Respondents who represented Coordinated Care Organizations, policy organizations, or statewide professional organizations took a shortened version of the survey.8
Respondents are not necessarily a representative sample of Oregon’s healthcare providers or administrators, which readers should keep in mind as they review the findings. That said, the responses capture some timely reflections by a sizable number of healthcare professionals who took the time to complete the survey. Hopefully, these findings—together with other data and input from the profession—will help the WTDB and OHA better respond to the industry’s workforce challenges.
7 See the full survey results for more-complete information about respondents. 8 Questions 27-32 in the survey output.

ECONorthwest 8
Key findings from the survey
Operating capacity has been curbed by a variety of factors, led by the need to physically distance
The pandemic has hindered organizations’ abilities to do their work in multiple ways. Leading the list are physical limitations—the need to socially distance patients and employees, which constrains the number of in-person visits. Providers reported workforce issues along multiple dimensions—some employers couldn’t afford to maintain their preferred staffing level while others had resources but had encountered difficulty recruiting new workers. And more than 40 percent of respondents reported that incumbent employees were not available to work enough hours. Lastly, despite considerable attention since the beginning of the pandemic, a sizable minority of providers reported a lack of personal protective equipment (PPE) as an ongoing capacity constraint, and almost one third said the lack of other supplies is also a problem.
In the past month, was your organization’s operating capacity negatively affected by any of the following? Check all that apply.
19%
32%
41%
42%
44%
55%
55%
61%
0% 10% 20% 30% 40% 50% 60% 70%
Other
Availability of other supplies
Availability of employeesto work enough hours
Availability of PPE
Financial ability to maintainor increase staffing levels
Ability to recruit new employees
The need for physicaldistancing of patients
The need for physicaldistancing of employees

ECONorthwest 9
Providers report sizable, persistent reductions in revenue
Re-opening of facilities and clinics hasn’t translated into a full recovery. Providers reported a wide range of revenue impacts—measured in September 2020 relative to September 2019. Responses centered around a one-third reduction in revenues, but answers ranged from 0 to 100 percent reductions. Hospitals reported a 30 percent decline—a slightly lower rate than reported by Federally Qualified Health Centers and behavioral health and medical clinics and centers. That finding is consistent with the story evident in recent employment data, which points to disproportionate effects on providers of ambulatory, non-urgent care.
If your organization’s revenue is reduced because of pandemic-related reduction in patient demand, how much lower was September 2020 revenue compared to September 2019 revenue?
Average reduction for selected organization types
43%
37%
34%
30%
Federally Qualified Health Center
Behavioral health clinic/organization/provider
Medical clinic/organization/provider
Hospital

ECONorthwest 10
Providers don’t see a “V-shaped” recovery and face uncertainty
About one fifth of providers reported no change in their operating capacity since 2019. The other 80 percent of providers anticipated a slow or uncertain recovery. Among those who had experienced declines, the majority were either uncertain when operations would recover or anticipated a recovery in 2022 or later. Only a small share of respondents anticipated operational improvements before June 2021.
When do you think your organization’s operating capacity will return to levels from a year ago?
31%
18%
21%
8%
1%
20%
0% 5% 10% 15% 20% 25% 30% 35%
Unsure
Later; it will remain belowfor the foreseeable future
July – December 2021
January – June 2021
October – December 2020
Organization’s operating capacity has not decreased

ECONorthwest 11
Some providers anticipate additional staffing in the next year—led by a need for behavioral health providers
Despite the uncertainty, some providers saw a need for new staffing within the next year. Roughly two thirds of respondents anticipated needs for behavioral health providers, and half predicted hiring for nursing staff. Lower shares of respondents anticipated demand for additional non-clinical staff, medical assistants, and doctors.
A number of respondents suggested “supply” and “demand” challenges related to the behavioral health workforce. On the supply side, a number of respondents said insurance reimbursement rates, and ultimately compensation, were too low for providers relative to the nature of work and cost of securing a license. On the demand side, respondents noted that the pandemic-related recession, and associated layoffs and health concerns, were driving an increase in demand for behavioral health services.
Compared to one year ago, what staffing levels do you anticipate your organization needing one year from now?
I anticipate our organization needing more staff (by type) one year from now compared to one year ago
42%
41%
49%
41%
64%
Non-clinical staff
Medical assistants
Nursing staff
Doctors/physicians
Behavioral health providers
ECONorthwest 12
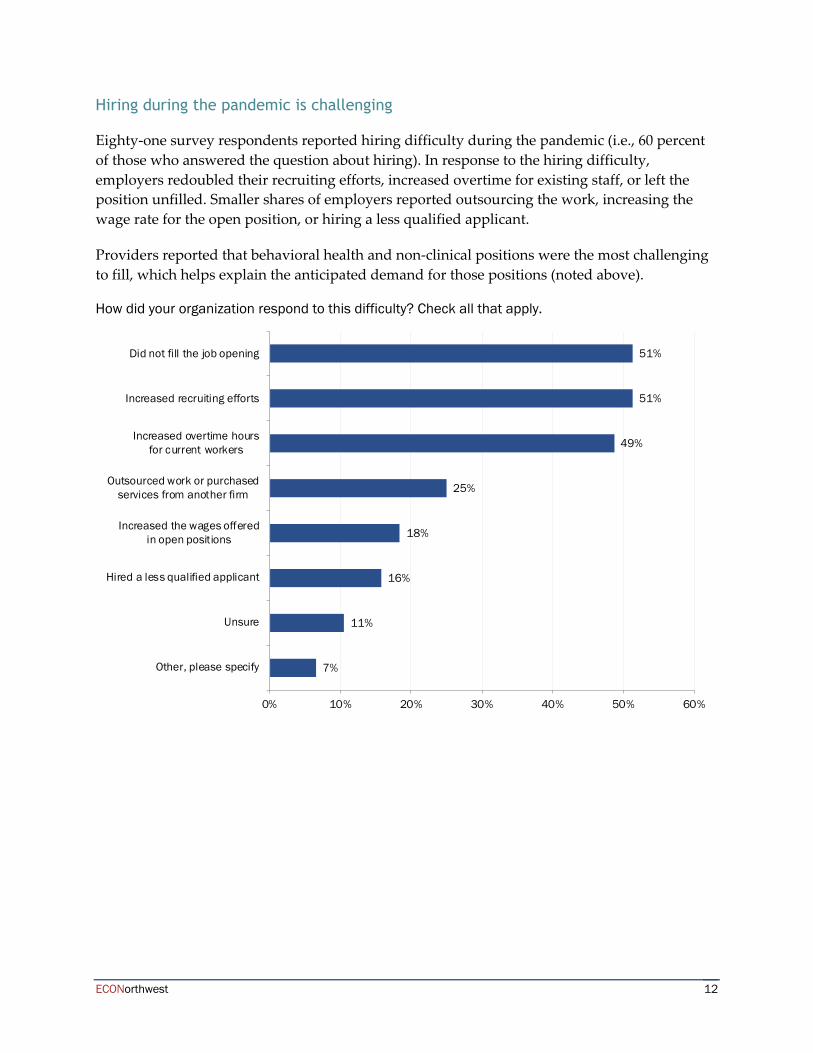
Hiring during the pandemic is challenging
Eighty-one survey respondents reported hiring difficulty during the pandemic (i.e., 60 percent of those who answered the question about hiring). In response to the hiring difficulty, employers redoubled their recruiting efforts, increased overtime for existing staff, or left the position unfilled. Smaller shares of employers reported outsourcing the work, increasing the wage rate for the open position, or hiring a less qualified applicant.
Providers reported that behavioral health and non-clinical positions were the most challenging to fill, which helps explain the anticipated demand for those positions (noted above).
How did your organization respond to this difficulty? Check all that apply.
7%
11%
16%
18%
25%
49%
51%
51%
0% 10% 20% 30% 40% 50% 60%
Other, please specify
Unsure
Hired a less qualified applicant
Increased the wages offeredin open positions
Outsourced work or purchasedservices from another firm
Increased overtime hoursfor current workers
Increased recruiting efforts
Did not fill the job opening

ECONorthwest 13
Demands at home and perceptions of an unsafe work environment drive staff departures
The need for caregiving was the leading cause of staff departures in recent months. The responses are consistent with national studies showing a decline in labor force participation among parents.9 But unlike some other industries, healthcare faces a second obstacle: the perception of an unsafe or challenging work environment. As one respondent put it, “We’re burned out and unsure of our own safety.”
What challenges have caused employees to leave? Check all that apply.
9 https://www.rand.org/blog/2020/10/sitting-it-out-or-pushed-out-women-are-leaving-the.html
7%
18%
18%
52%
56%
81%
0% 20% 40% 60% 80% 100%
Unsure
Other, please specify
Insufficient hours offered/available
Perception of an unsafework environment
Undesirable/challenging working conditionsrelated to COVID-19 restrictions or changes
to operating procedures (e.g., state regulationsfor PPE, physical distancing, cleaning/sanitizing)
Staff’s responsibilities at home (e.g., care for family members)

ECONorthwest 14
Employers see a need for more health professionals, especially behavioral health providers
Three quarters of respondents pointed to the need to train more behavioral health providers as “very important”, which is consistent with responses—discussed above—that indicated a current difficulty in filling positions and an anticipated need to hire in the next year. Across staff types, three quarters or more of respondents rated efforts to expand Oregon’s capacity to educate, train, and develop more health professionals and increase the size of the healthcare workforce as “important” or “very important.”
How important are efforts to expand Oregon’s capacity to educate, train, and develop more health professionals and increase the size of the healthcare workforce?
Share answering “Very important” for each staff type
34%
39%
56%
49%
76%
Non-clinical staff
Medical assistants
Nursing staff
Doctors/physicians
Behavioral health providers

ECONorthwest 15
Telehealth will continue to play an important role in maintaining access to primary care
During the COVID-19 pandemic, a decline in primary care in-person visits was partially substituted with an increase in telehealth visits. Seventy-eight respondents indicated that, on average, 45 percent of primary care visits that can be done effectively as telehealth visits instead of in-person visits. And, on average, 29 percent of primary care telehealth visits can be done as effectively by telephone (audio only) as by video. The increased use of telehealth services has not affected staffing needs at most respondents’ organizations. Most (83 percent) respondents agreed or strongly agreed that telehealth plays an important role in maintaining access to primary care and that strong demand for the service will continue after the pandemic ends.
Please assess your agreement with this statement: Telehealth plays an important role in maintaining access to primary care and strong demand for the service will continue after the pandemic ends.
60%
23%
15%
0%
2%
Strongly agree
Agree
Neutral
Disagree
Strongly disagree

ECONorthwest 16
Conclusion
The healthcare sector has faced unforeseen, extraordinary challenges in 2020. Major parts of the sector were shuttered during March-June in preparation for an initial pandemic wave that largely bypassed Oregon. Then re-opening came with critical, but complicated, physical distancing protocols. Demand for non-urgent services hasn’t returned to pre-pandemic levels, so providers are managing complicated service delivery along with reduced revenues. And now in the fourth quarter of 2020, infection rates are hitting all-time highs. A pandemic that is not under control affects industry subsectors differently. COVID-19 treatment and other emergency medical procedures keep hospitals and some clinics busy. But as in other industries, some consumers, in this case patients with non-urgent needs, will stay out of the market until rates of infection come down.
Challenges for the sector’s workforce are acute. Many occupations require work in close proximity to patients, and the nature of the virus and testing for it still leaves uncertainty for workers. In addition to the heightened job-related stressors, healthcare workers have experienced all the challenges faced by other industries: uncertain job security and the need to care for family members.
The job and survey data presented in this report help illustrate some of these challenges. The job data suggest the sector has approached a “V” shaped recovery. Despite lower revenues, providers are employing almost as many workers as they did before the pandemic. Survey responses provide further evidence that revenue is down and that the work is exceptionally challenging. And given that public health officials don’t see the pandemic ending in the next six months, the sector and its workers have a difficult road ahead.