effects of the antibiotics chlortetracycline and enrofloxacin on the anaerobic digestion in...
TRANSCRIPT
Effects of the Antibiotics Chlortetracycline and Enrofloxacinon the Anaerobic Digestion in Continuous Experiments
A. Bauer & J. Lizasoain & E. Nettmann & I. Bergmann &
K. Mundt & M. Klocke & M. Rincón & T. Amon &
G. Piringer
# Springer Science+Business Media New York 2014
Abstract Significant quantities of antibiotics are used in mod-ern livestock husbandry and are found in livestock waste. Suchwaste has been reported to exert inhibitory effects if used as asubstrate in biogas facilities. The goal of this study is to analyzethe inhibitory effect of the antibiotics chlortetracycline (CTC)and enrofloxacin (EFX) on biogas production with pig slurry.Antibiotic concentrations up to 8,000 mg kg−1 dry matter (DM)pig slurry were added in continuous fermentation tests. Impactson methane production and on the microbial community struc-ture were analyzed. The results clearly show that chlortetracy-cline and enrofloxacin negatively affect biogas production.Higher concentrations of antibiotics led to lower methane
production. The addition of 200 mg kg−1 DM of CTC orEFX reduced the specific methane yields up to 49 and 44 %,respectively. The microbial community did not show anychanges at this concentration. When chlortetracycline wasadded at a concentration of 8,000 mg kg−1 DM, the biodiversitychanged slightly compared to the control without antibiotics.
Keywords Antibiotics . Anaerobic digestion .
Chlortetracycline . Enrofloxacin .Methane
Introduction
The rising price of fossil fuels and the necessity of securingfuture energy supplies inspire a focus on a more intensive useof renewable energy resources. Biogas, which can make effi-cient use of diverse organic substances, even with high watercontent, can contribute to a larger share of renewables.Manure from livestock is frequently used as a substrate forbiogas production. Due to its high buffering capacity and itshigh nitrogen content, manure is usually co-digested withother input materials to increase the biogas yield and to reducethe nitrogen content of the mixed substrate [1–3]. The utiliza-tion of manure as a substrate for bioenergy production hasmany other advantages. First, manure does not compete withfood and feed production. Secondly, anaerobic digestion (AD)of animal manure for biogas production reduces greenhousegas emissions during the storage and land application phases[4]. Furthermore, it improves manure fertilizer qualities, re-ducing odors and pathogens [5].
In modern animal husbandry, a significant amount of anti-biotics is used to prevent infections. Winckler and Grafe [6]reported a consumption of over 14 t of sulfonamide in only sixadministrative regions in Germany. Apley et al. [8] estimatedthe chlortetracycline (CTC) used in swine production at ap-proximately 155 t in the USA. Excessive use of antibiotics in
Electronic supplementary material The online version of this article(doi:10.1007/s12155-014-9458-0) contains supplementary material,which is available to authorized users.
A. Bauer : J. Lizasoain :M. Rincón :G. PiringerDivision of Agricultural Engineering, University of NaturalResources and Applied Life Sciences, Konrad Lorenz Strasse 24,3430 Tulln, Austria
A. Bauer (*) : J. LizasoainAlpS-Gmbh, Centre for Climate Change Adaptation Technologies,Grabenweg 68, 6020 Innsbruck, Austriae-mail: [email protected]
E. NettmannLehrstuhl für Siedlungswasserwirtschaft und Umwelttechnik,Ruhr-Universität Bochum, Universitätstrasse 150,44801 Bochum, Germany
I. Bergmann :K. Mundt :M. KlockeAbt. Bioverfahrenstechnik, Leibniz-Institut für AgrartechnikPotsdam-Bornim e.V. (ATB), Max-Eyth-Allee 100,14469 Potsdam, Germany
T. AmonAbt. Technik in der Tierhaltung, Leibniz-Institut für AgrartechnikPotsdam-Bornim e.V. (ATB), Max-Eyth-Allee 100,14469 Potsdam, Germany
Bioenerg. Res.DOI 10.1007/s12155-014-9458-0

livestock husbandry leads to high concentrations excreted inmanure. Arikan et al. [9] showed that about 23 % of theoxytetracycline fed to cattle was excreted in the manure.Gans et al. [10] found widely varying concentrations of oxy-tetracycline in pig manure, ranging from 0.095 to 770mg kg−1
dry matter (DM). The antibiotics typically found in the ma-nure can also be detected in fermentation residues frommanure-fed biogas plants as well as in the soil [9–12]. Ganset al. [10] noted enrofloxacin (EFX) to be the second mostcommonly used antibiotic in animal husbandry in Austria.This antibiotic was found in seven out of 20 pig manuresamples at a concentration ranging from 0.02 to 1.4 mg kg−1
DM. The second widely used antibiotic in livestock produc-tion is chlortetracycline (CTC). The concentrations of thisantibiotic in pig manure samples have been reported to rangefrom 0.1 to 46 mg kg−1 DM [6, 13, 14].
Inhibitory effects of antibiotics on the biogas process havebeen the topic of several studies. Shimada et al. [15] investi-gated the effect of the antibiotic tylosin, commonly used inswine production, on the aerobic digestion of wastewater. Forconcentrations of 1.67 mg l−1 tylosin, the biogas process wasnot affected. However, a concentration of 167 mg l−1 tylosincaused a total inhibition of the process. Arikan et al. [9]reported a large decrease of biogas production from calvesmedicated with oxytetracycline. Sanz et al. [16] found a strongdecrease in biogas production from manure with chloram-phenicol content of 15–20 mg l−1 and complete inhibition ata concentration of 50 mg l−1. They also reported significantinhibition of anaerobic co-digestion of sewage sludge withmanure when CTC was present at a concentration of40 mg l−1. According to Sanz et al. [16], chloramphenicoland CTC could cause the complete inhibition of the acetoclasticmethanogenic archaea. Masse et al. [17] analyzed the effect ofdifferent antibiotics at 20 °C and found a significant reductionof the methane production when penicillin and tetracycline arepresent in manure slurries. In contrast to other similar studies,Lallai et al. [18] were not able to detect significant yieldreductions after the digestion of pig slurry with some common-ly used antibiotics in the treatment of pigs such as amoxicillintrihydrate, oxytetracycline hydrochloride, and thiamphenicol,even when their concentrations were up to 250 mg l−1.
However, in order to obtain reliable and longtime base dataon biogas yields and composition after AD when high concen-trations of veterinary antibiotics are present, continuous fermen-tation experiments are indispensable. The results obtained bycontinuous fermentation may be more comparable to the situ-ation in practice and more easily transferable to commercialplants. Hence, this study investigates the effects of two antibi-otics, CTC and EFX, on the biogas process in continuousfermentation tests. It can be assumed that the antibiotics inter-fere with the biomass-degrading microbiological community,whose structure was analyzed using molecular cultivation-independent approach.
Materials and Methods
Fermentation Setups
Two sequential, continuous fermentation tests (experiments 1and 2) were performed to evaluate the effect of the antibioticsEFX and CTC on biogas production and the microbialcommunity.
The inoculum utilized in both experiments was prepared3 months before the measuring period started (phase-denominated pretesting period), from a mixture composed ofinoculum from a biogas plant running on maize silage andfrom another running on pig slurry. As substrate, pig slurryfree of antibiotics was used and mixed with the inoculum in aratio of 1:2 (based on fresh matter). The mixture was incubat-ed and fed daily over a 3-month period with the correspondingorganic loading rate (OLR) until stable conditions wereachieved. Afterwards, the material was transferred into thefermentors, and after 7 days, the addition of antibiotics com-menced. This point is considered to be the beginning of eachtesting period.
The experiments were conducted according to VDI 4630[19]. The fermentation units consisted of 1l-volume fermen-tors connected to a gas-collecting tube. Biogas and methaneproduction was measured in norm liters (273 K and1,013 mbar) per cubic meter of fermentor volume (Nm3).The portable gas analyzer Dräger X-AM 7000 was used todetermine the biogas composition (CH4 and CO2). The fer-mentors were equipped with a magnetic mixer, which stirredthe fermentor content for 10 min every 30 min and a heatersystem set to 37.5 °C. Before adding the active ingredients,the DM content of each fermentor was measured so thatpotential deviations could be taken into consideration. Theantibiotics were dissolved with deionized water and added tothe fermentors in liquid form.
Experiment 1 consisted of four different concentrations ofEFX (Fluka Analytical, China) and CTC (Fluka Analytical,China), ranging from 40 to 8,000 mg kg−1 DM. Table 1 showsthe process parameters as measured and calculated during thetrials. The fermentors were fed manually with pig slurry withan average daily feed of 10.14 g (fresh weight), correspondingto an OLR of 0.47 kg volatile solid (VS)m−3 day−1 and ahydraulic retention time (HRT) of 98.6 days. According toHopfner et al. [20], the retention time in Austrian biogas plantslies between 60 and 120 days, although in 18 % of the plants,the retention time is more than 180 days. Altogether, the studyconsisted of eight different treatments and one control unit(antibiotic free). Fermentation of the variants was done intriplicate, comprising a total of 27 reactor vessels, which wererun simultaneously in a randomized way.
Secondly, experiment 2 was carried out based on the resultsfrom experiment 1 and focused on three lower EFX and CTCconcentrations, which ranged from 100 to 200 mg kg−1 DM.
Bioenerg. Res.
The average daily feed was 40.08 g (fresh weight), corre-sponding to an OLR of 0.80 kg VS m−3 day−1 of pig manure.This value was increased in order to shorten the HRT to25 days. The six different treatments and the control unit weretested in triplicate resulting in a total of 21 reactor vessels,which were also run simultaneously in a randomized way. Fordetermining the specific biogas and methane yields, the gasproduction of every reactor vessel has been calculated by theaverage of their daily yields. The final yields used in the studywere determined by the average of the three replicates.
Chemical Analyses
The chemical composition of the materials was determined byanalyzing the contents of DM, raw ash (XA), VS, as well astotal nitrogen (Ntotal) and ammonia (NH4). To analyze the DMcontent, each sample was dried in an oven at 105 °C untilconstant weight was reached, and it was expressed as a per-centage of fresh matter [21]. The XAwas analyzed by deter-mining the residue left after dry oxidation of the oven-driedmaterial in a muffle furnace at 550 °C. The VSwere calculatedby subtracting the XA content from the DM [22, 23]. Thenitrogen content was measured by digesting the sample usingconcentrated sulfuric acid in the presence of a catalyst. Then, asodium hydroxide solution was added to make the acidicsolution alkaline. The ammonia was distilled in a distillationunit type B-324 (Büchi, Switzerland) and was collected inboric acid. The excess was titrated with a standard solution ofsodium hydroxide [23].
Microbiological Analyses
For the analysis of microbial DNA (experiment 1), 500-mlsamples from the biogas fermentations were stored at −20 °C.
For microscopic analysis of microbial cells (experiment 2), thesamples were fixed first with 3.7 % formaldehyde accordingto a slightly modified protocol published by Daims et al. [24]and stored afterwards at −20 °C.
For cultivation-independent analyses of the microbial com-munity structures (experiment 1), total microbial genomicDNA (gDNA) was purified from the fermentor samples byenzymatic and chemical cell lysis and subsequent organicextraction according to Nettmann et al. [25]. The crudeDNA extract was purified via MicroSpin S-400 HRSephacryl matrix columns (GE Healthcare, Munich,Germany) according to Bergmann et al. [26]. Copy numbersof 16S ribosomal RNA (rRNA) genes (rrs) for bacteria andmajor taxons of methanogenic archaea were determined byDNA-based real-time quantitative polymerase chain reaction(qPCR) by applying a 5′ nuclease assay as previously pub-lished by Klocke et al. [27]. The following primer sets, orig-inally developed by Yu et al. [28], were applied: BAC (phy-lum bacteria), ARC (methanogenic archaea), MMB(Methanomicrobiales), MBT (Methanobacteriales), Msc(Methanosarcinaceae), and Mst (Methanosaetaceae). For thesample treated with 8,000 mg kg−1 DMEFX and the untreatedsample, two 16S rRNA gene libraries were constructed todetermine the community structure within the methanogenicarchaea. The definition of operational taxonomic units(OTUs) was based on individual fingerprints obtained fromamplified rDNA restriction analysis (ARDRA). For eachOTU, the nucleotide sequence of at least one clone of eachlibrary was analyzed. The taxonomic affiliation was deter-mined by phylogenetic analysis. Construction of libraries,ARDRA, sequencing, and subsequent data analysis were per-formed as previously published by Klocke et al. [27]. Allrespective results are available as a supplemental material tothis study. All determined nucleotide sequences have beendeposited in the database of the ENA EMBL-Bank with theaccession numbers HG934083–HG934098.
For microscopic analysis (experiment 2), an aliquot of100 μl of the fixed fermentor sample was washed with 1×phosphate-buffered saline and sonicated on ice as describedby Nettmann et al. [29] to facilitate the breakup of cell aggre-gates. In order to determine the total cell counts, the sampleswere stained with 4′,6′-diamidino-2-phenylindoline (DAPI).Fluorescent labelling of bacteria was obtained by fluorescentin situ hybridization (FISH) with the oligonucleotide probeEUB338 [30] labelled with dye Cy3. The second probe,Arc915 labelled with dye FLUOS [31], was used for FISHof methanogenic archaea. Microscopic analyses were con-ducted with a fluorescence microscope (BX51TF-5) fittedwith filters WU, Cy3, and NIBA (all Olympus Optical Co.Europa GmbH, Heidelberg, Germany). Further processing ofsamples, in situ hybridization of probes, setup of controls, cellcounting, and subsequent data analysis were performed aspublished by Nettmann et al. [29].
Table 1 Process parameters for experiments 1 and 2
Process parameters Unit Experiment 1 Experiment 2
Pretesting period Months 3 3
Testing period Days 34 44
Feed per day g FM day−1 10.14 40.08
Pig slurry
Dry matter % FM 4.73 3.80
Volatile solids % FM 3.14 2.50
Total nitrogen content % FM 0.50 0.37
Ammonia content % FM 0.37 0.24
Fermentor content
pH value 7.72 7.87
Organic loading rate kg VS m−3 day−1 0.47 0.80
Hydraulic retentiontime
Days 98.6 25.0
FM fresh matter
Bioenerg. Res.
Statistical Analyses
The study determined the AD parameters HRT and OLR.The HRT defines the average time a substrate spends in adigester. This time, specified in days, is calculated by takingthe ratio of total digester volume to daily volumetricfeed rate [32]. Tables and figures include means and stan-dard deviations of data. Differences in the methane yieldwere statistically analyzed (ANOVA) with SPSS version 21(IBM, Armonk, USA) by Duncan’s multiple range test(p<0.05). Regarding the microbiological study, all datawere statistically analyzed (ANOVA) with WinSTAT (R.Fitch Software; Staufen, Germany). Significant differenceswere determined by Duncan’s multiple range test (p<0.05).In figures, the mean variability of data was indicated by thestandard deviation.
Results and Discussion
Specific Biogas and Methane Yields
In experiment 1, gas production decreased significantly withincreasing antibiotic concentration (see Table 2). While thecontrol variant had a methane yield of 0.12 Nm3, the additionof increasing concentrations of CTC reduced the yields pro-gressively from 0.10 to 0.05 Nm3. The addition of EFX as anactive material produced a similar trend in the methane
production. Here, methane yields decreased gradually from0.09 to 0.06 Nm3 with increasing concentrations of antibi-otics. The specific methane yields reached reductions of 54and 48 %, respectively, when the maximum concentrations ofCTC and EFXwere added. Concentrations of 40mg kg−1 DMand higher for either of the two antibiotics lead to statisticallysignificant differences in the methane yields when comparedto the control sample. Additionally, a comparison betweenequal concentrations of CTC and EFX indicates that there isno significant difference between the impacts of CTC andEFX on methane yields. Linear regressions were computedbased on the log 10 scale of the five different inhibitor con-centrations and the biogas and methane yields on the originalscale (Table 3). Results show that the regressions of antibioticsCTC and EFX for biogas and methane yields are significantand follow a linear reduction in the gas yields when theconcentration of antibiotics is increased.
In experiment 2 (Table 4), lower antibiotic concentrationswere combined with a shorter HRT. The specific methaneyield achieved in the control samples was 0.24 Nm3, and theaddition of CTC altered the biogas production to values rang-ing from 0.14 to 0.12 lNkg
−1 VS, reaching a maximum spe-cific methane yield reduction of 49%.While the differences inmethane yield between the control and any of the three anti-biotic concentrations were statistically significant, the effectswithin the different antibiotic concentrations did not differsignificantly. Regarding the EFX trials, methane productiondecreased to values ranging between 0.15 and 0.13 Nm3,representing a reduction in methane yields up to 47 %. Asalready reported for CTC, the differences in the methane yieldbetween the control and the different antibiotic concentrationswere statistically significant, but no statistical differences werefound between the different antibiotic concentrations.
Similar results were found in other studies. For instance,Stone et al. [33] fermented swine manure slurry with820 mg kg−1 DM of CTC in a batch reactor. The resultingmethane gas yield was reduced by 28%, which compares wellwith the results of experiment 1. Sanz et al. [16] reported amethane gas yield inhibition of 20, 50, and 80 % during amesophilic anaerobic fermentation process of syntheticallyderived fatty acids, which were contaminated with 5, 40, and152 mg l−1 CTC, respectively. The authors also detected aninhibitory concentration IC50 of 40 mg l−1 for CTC duringanaerobic fermentation. No literature was found on the effectof EFX on the methane production by anaerobic digestion.
The substantial decrease in biogas and methane yieldsreported in the present study after the addition of the antibi-otics CTC and EFX may be caused by the strong interferencewith the bacterial community of biogas fermentations.Methane fermentation is a complex process, which can bedivided up into four phases of degradation (hydrolysis,acidogenesis, acetogenesis, and methanogenesis). Each phaseis carried out by different groups of microorganisms, which
Table 2 Effect of antibiotics on measured biogas and methane yields inexperiment 1
Variant Antibiotic concentration(mg kg−1 VS)
Gas yield from experiments(Nm3 m−3 fermentor volume)
Biogas Methane
Mean n SD Mean n SD
Control 0 0.19 (a) 3 0.008 0.12 (a) 3 0.003
CTC 40 0.16 (ab) 3 0.009 0.10 (b) 3 0.011
400 0.14 (bcd) 3 0.005 0.08 (bc) 3 0.002
4,000 0.13 (bcde) 3 0.023 0.07 (cd) 3 0.007
8,000 0.11 (e) 3 0.004 0.05 (d) 3 0.001
EFX 40 0.14 (bcd) 3 0.030 0.09 (b) 3 0.011
400 0.15 (bc) 3 0.022 0.09 (b) 3 0.008
4,000 0.12 (cde) 3 0.025 0.06 (cd) 3 0.008
8,000 0.12 (de) 3 0.007 0.06 (d) 3 0.005
The letters in parenthesis show the results of statistical analysis (Duncan’smultiple range test, p<0.05); different letters indicate significant differ-ences among the samples
VS volatile solid, n number of replicates, SD standard deviation, CTCchlortetracycline, EFX enrofloxacin
Bioenerg. Res.

partly stand in syntrophic interrelation. While bacteria per-form the first three stages, the last (methanation) is dominatedby a special group of microorganisms, the methanogenicarchaea. This group uses the products formed from the threeprevious steps of bacterial degradation, such as volatile fattyacids, short-chained alcohols, acetate, CO2, or H2 [32, 34], assubstrates. CTC and EFX have a broad inhibitory effectagainst both gram-positive and gram-negative bacteria, andeven if a direct inhibition of methanogenic archaea by theapplied antibiotics seems unlikely, a suppressed production ofmethanogenic substrates will cause a “starvation” of themethanogens, resulting in a substantial decrease in methaneproduction.
Chemical Analyses
DM and VS concentrations were analyzed in each sample inorder to examine whether different antibiotic concentrationsaffect the biomass in the system. In this study, the data showedlittle effect of the antibiotics on the DM andVS concentrations(Table 5). In experiment 1, the DM content (% fresh matter(FM)) ranged from 4.37 to 4.59 % when CTC was added andfrom 4.29 to 4.88 % FM when EFX was added. These valueswere similar to the concentration obtained without antibiotics,which had an average of 4.39% FM. In experiment 2, the DMconcentration after the addition of CTC and EFX ranged forboth antibiotics from 2.68 to 2.94 % FM, while the averageDM in the sample without antibiotics was slightly higher, witha DM content of 3.03% FM. The nitrogen contents (% FM) in
experiment 1 were 0.47 % (SD 0.01) for the control fermen-tors and 0.46 % (SD 0.01) for the fermentors containing CTCand EFX, while the ammonia content was 0.34% (SD 0.00) inthe fermentors with and without antibiotics. In experiment 2,the nitrogen concentrations were 0.26 % (SD 0.01) in thecontrol samples and 0.27 % (SD 0.01) in the samples withCTC and EFX. Ammonia concentrations were 0.17 % (SD0.01) in the control samples as well as in the samples contain-ing antibiotics. Therefore, no difference in nitrogen and am-monia composition could be detected between the control andthe fermentors containing antibiotics for experiments 1 and 2.
Microbiological Analyses
As a first attempt to examine the influence of these antibioticson the microbial community structure, a culture-independentapproach based on the determination of copy numbers for themicrobial 16S rRNA genes by real-time qPCR was per-formed. Surprisingly, the reduced biogas production andmethane emission after antibiotic treatment is not due tosubstantially altered microbial community structures(Table 6). The relative abundance of 16S rRNA genes formethanogenic archaea ranged between 1.2 and 3.2 % of thetotal 16S rRNA gene copy numbers. Predominantly, 16SrRNA genes for Methanobacteriales were detected, indicatinga prevalence of the hydrogenotrophic pathway ofmethanogenesis. Acetoclastic or mixotrophic methanogenssuch as Methanosaetaceae or Methanosarcinaceae were de-tected only in very small amounts.
Table 3 Results from the linearregression of the antibiotics CTCand EFX for biogas and methaneyields in experiment 1 (CTC,n=15; EFX, n=15)
Antibiotic Y variable Intercept SE p value Slope SE p value R2
CTC Biogas 0.188 0.006 <0.0001 −0.019 0.002 <0.0001 0.858
CTC Methane 0.118 0.004 <0.0001 −0.015 0.001 <0.0001 0.911
EFX Biogas 0.182 0.010 <0.0001 −0.017 0.004 0.0005 0.622
EFX Methane 0.115 0.007 <0.0001 −0.013 0.002 <0.0001 0.707
Table 4 Effect of antibiotics onmeasured biogas and methaneyields in experiment 2(lower antibiotics concentrations,shorter retention time)
The letters in parenthesis showthe results of statistical analysis(Duncan’s multiple range test,p<0.05); different letters indicatesignificant differences among thesamples. All further abbreviationsare as given in Table 2
Variant Antibiotic concentration(mg kg−1 VS)
Gas yield from experiments (Nm3 m−3 fermentor volume)
Biogas Methane
Mean n SD Mean n SD
Control 0 0.39 (a) 33 0.013 0.24 (a) 33 0.017
CTC 100 0.20 (b) 33 0.045 0.12 (b) 33 0.025
150 0.21 (b) 33 0.042 0.14 (b) 33 0.021
200 0.20 (b) 33 0.031 0.12 (b) 33 0.018
EFX 100 0.23 (b) 33 0.035 0.15 (b) 33 0.020
150 0.19 (b) 33 0.034 0.13 (b) 33 0.023
200 0.21 (b) 33 0.011 0.13 (b) 33 0.008
Bioenerg. Res.

The treatment with antibiotics had no significant effect onthe 16S rRNA gene copy numbers for fermentative bacteria(p<0.05). The relative amount of 16S rRNA genes remainedmore or less stable, independent of the added antibiotics.Interestingly, a significant reduction of 16S rRNA gene copynumbers for methanogenic archaea was found when
8,000 mg kg−1 DM CTC (p<0.05) was added. Compared tothe untreated control, less than half of copy numbers pernanogram of microbial gDNA were detected for totalArchaea, Methanobacteriales, and Methanosarcinales. Allother treatments had no obvious effect on the amount ofmethanogens as indicated by the abundance of respective16S rRNA gene copy numbers.
The analysis of the nucleotide sequence of the archaeal 16SrRNA genes, present in the fermentation treated with8,000 mg kg−1 DM EFX (Supplemental Material Table S1,Fig. S1) and the untreated control, support the above results;95 % (with EFX) and 98 % (without EFX) of analyzed 16SrRNA gene library sequences were affiliated to the genusMethanobacterium. Further, 4 % (with EFX) and 2 % (with-out EFX) were associated with the genusMethanobrevibacter.Both genera comprise exclusively hydrogenotrophicmethanogens. Acetoclastic methanogens of genusMethanosaeta were detected by only 1 % (with EFX) butwere not present in the library derived from the untreatedcontrols.
Additionally, no differences in the community structure ofthe antibiotic-treated sample and the untreated control weredetectable, neither in the archaeal diversity as indicated by theOTUs nor in their abundance as indicated by the relative clonenumbers in 16S rRNA gene libraries. In addition, no differ-ences were detected within the nucleotide sequence of thestudied 16S rRNA gene region between the same OTUsanalyzed in different libraries (data not shown). No variationin the archaeal community structure was detectable.
In conclusion, two explanations for these findings seem tobe possible: (i) the applied antibiotics are not only toxic orinhibitory to fermentative bacteria but also to methanogenicarchaea, or (ii) the decrease of substrates for methanogenesis
Table 5 Composition of the liquid phase of biogas fermentations
Variant Antibioticconcentration(mg kg−1 DM)
DM VS
% FM SD % FM SD
Experiment 1
Without antibiotics 0 4.39 0.02 2.91 0.02
CTC 40 4.59 0.08 2.89 0.06
400 4.48 0.41 2.64 0.27
4,000 4.37 0.13 2.74 0.10
8,000 4.48 0.41 2.64 0.27
EFX 40 4.29 0.46 2.84 0.31
400 4.67 0.10 3.06 0.08
4,000 4.88 0.08 3.28 0.05
8,000 4.67 0.10 3.06 0.08
Experiment 2
Without antibiotics 0 3.03 0.08 2.02 0.05
CTC 100 2.74 0.07 1.83 0.04
150 2.94 0.14 1.96 0.10
200 2.68 0.08 1.79 0.06
EFX 100 2.74 0.04 1.83 0.03
150 2.94 0.10 1.96 0.07
200 2.68 0.04 1.79 0.03
DM dry matter, VS volatile substances, FM fresh matter, SD standarddeviation, CTC chlortetracycline, EFX enrofloxacin
Table 6 Copy numbers for microbial 16S rRNA genes detected in 1 mg of microbial genomic DNA (gDNA) isolated from samples of experiment 1
Sample 16S rRNA gene copies ng−1 gDNA (mean ± SD)
Bacteria (BAC set) Archaea
Total (ARC set) Methanobacteriales(MBT set)
Methanosarcinales(Mst + Msc set)
Methanomicrobiales(MMB set)
Control (without antibiotics) 896,460 (a)±105,362 23,235 (a,c)±2,850 18,215 (a)±2,302 45 (a)±8 ND
CTC
4,000 mg kg−1 DM 1,167,094 (a)±277,524 13,796 (b,c)±2,757 12,107 (b,c)±355 36 (a,b)±13 ND
8,000 mg kg−1 DM 721,030 (a)±75,042 11,502 (b)±2,608 7,997 (b)±2,631 12 (b)±9 ND
EFX
4,000 mg kg−1 DM 831,237 (a)±232,122 24,757 (a)±2,960 13,954 (c)±619 48 (a)±13 ND
8,000 mg kg−1 DM 963,364 (a)±107,825 19,489 (a,b)±5,986 10,781 (b,c)±463 18 (a,b)±5 ND
The letters in parenthesis show the results of statistical analysis (Duncan’s multiple range test, p<0.05); different letters indicate significant differencesamong the samples
ND not detected. All further abbreviations are as given in Table 5
Bioenerg. Res.
leads to the starvation of methanogens. Both factors mightresult in unaltered bacteria to archaea ratios as observed in thisstudy.
Despite the obvious advantages of cultivation-independentapproaches for quantification of microbes, the analysis ofabundances based on the determination of the amount ofmicrobial 16S rRNA genes by qPCR can be biased by certainfactors, as reported by Bergmann et al. [26]. One point ofmajor influence is that DNA-based analyses do not distinguishbetween metabolically active and inactive microorganisms.
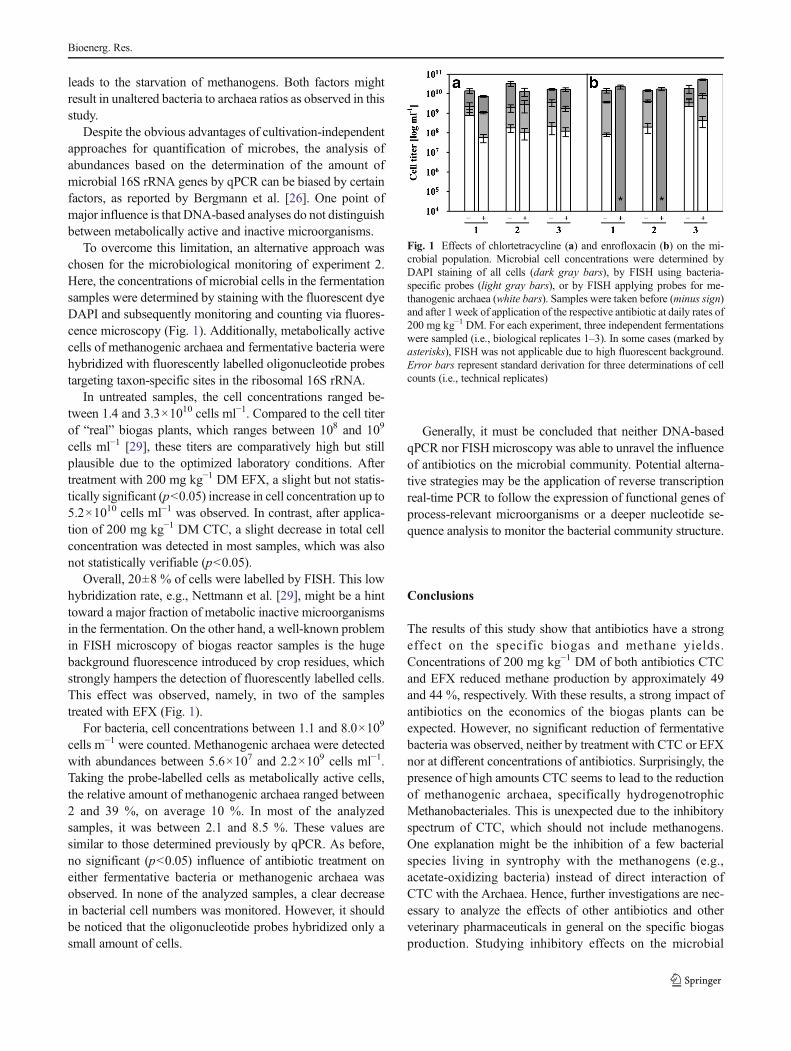
To overcome this limitation, an alternative approach waschosen for the microbiological monitoring of experiment 2.Here, the concentrations of microbial cells in the fermentationsamples were determined by staining with the fluorescent dyeDAPI and subsequently monitoring and counting via fluores-cence microscopy (Fig. 1). Additionally, metabolically activecells of methanogenic archaea and fermentative bacteria werehybridized with fluorescently labelled oligonucleotide probestargeting taxon-specific sites in the ribosomal 16S rRNA.
In untreated samples, the cell concentrations ranged be-tween 1.4 and 3.3×10¹⁰ cells ml−1. Compared to the cell titerof “real” biogas plants, which ranges between 108 and 109
cells ml−1 [29], these titers are comparatively high but stillplausible due to the optimized laboratory conditions. Aftertreatment with 200 mg kg−1 DM EFX, a slight but not statis-tically significant (p<0.05) increase in cell concentration up to5.2×1010 cells ml−1 was observed. In contrast, after applica-tion of 200 mg kg−1 DM CTC, a slight decrease in total cellconcentration was detected in most samples, which was alsonot statistically verifiable (p<0.05).
Overall, 20±8 % of cells were labelled by FISH. This lowhybridization rate, e.g., Nettmann et al. [29], might be a hinttoward a major fraction of metabolic inactive microorganismsin the fermentation. On the other hand, a well-known problemin FISH microscopy of biogas reactor samples is the hugebackground fluorescence introduced by crop residues, whichstrongly hampers the detection of fluorescently labelled cells.This effect was observed, namely, in two of the samplestreated with EFX (Fig. 1).
For bacteria, cell concentrations between 1.1 and 8.0×10⁹
cells m−1 were counted. Methanogenic archaea were detectedwith abundances between 5.6×10⁷ and 2.2×10⁹ cells ml−1.Taking the probe-labelled cells as metabolically active cells,the relative amount of methanogenic archaea ranged between2 and 39 %, on average 10 %. In most of the analyzedsamples, it was between 2.1 and 8.5 %. These values aresimilar to those determined previously by qPCR. As before,no significant (p<0.05) influence of antibiotic treatment oneither fermentative bacteria or methanogenic archaea wasobserved. In none of the analyzed samples, a clear decreasein bacterial cell numbers was monitored. However, it shouldbe noticed that the oligonucleotide probes hybridized only asmall amount of cells.
Generally, it must be concluded that neither DNA-basedqPCR nor FISH microscopy was able to unravel the influenceof antibiotics on the microbial community. Potential alterna-tive strategies may be the application of reverse transcriptionreal-time PCR to follow the expression of functional genes ofprocess-relevant microorganisms or a deeper nucleotide se-quence analysis to monitor the bacterial community structure.
Conclusions
The results of this study show that antibiotics have a strongeffect on the specific biogas and methane yields.Concentrations of 200 mg kg−1 DM of both antibiotics CTCand EFX reduced methane production by approximately 49and 44 %, respectively. With these results, a strong impact ofantibiotics on the economics of the biogas plants can beexpected. However, no significant reduction of fermentativebacteria was observed, neither by treatment with CTC or EFXnor at different concentrations of antibiotics. Surprisingly, thepresence of high amounts CTC seems to lead to the reductionof methanogenic archaea, specifically hydrogenotrophicMethanobacteriales. This is unexpected due to the inhibitoryspectrum of CTC, which should not include methanogens.One explanation might be the inhibition of a few bacterialspecies living in syntrophy with the methanogens (e.g.,acetate-oxidizing bacteria) instead of direct interaction ofCTC with the Archaea. Hence, further investigations are nec-essary to analyze the effects of other antibiotics and otherveterinary pharmaceuticals in general on the specific biogasproduction. Studying inhibitory effects on the microbial
Fig. 1 Effects of chlortetracycline (a) and enrofloxacin (b) on the mi-crobial population. Microbial cell concentrations were determined byDAPI staining of all cells (dark gray bars), by FISH using bacteria-specific probes (light gray bars), or by FISH applying probes for me-thanogenic archaea (white bars). Samples were taken before (minus sign)and after 1 week of application of the respective antibiotic at daily rates of200 mg kg−1 DM. For each experiment, three independent fermentationswere sampled (i.e., biological replicates 1–3). In some cases (marked byasterisks), FISH was not applicable due to high fluorescent background.Error bars represent standard derivation for three determinations of cellcounts (i.e., technical replicates)
Bioenerg. Res.

ecology in biogas fermentors, as well as potential adaptationprocesses, could deepen our understanding of possibly largeeconomic impacts of antibiotics and pharmaceuticals on bio-gas facilities.
Acknowledgments The authors would like to thank Dr. M. Casler forhis valuable suggestions to improve the quality of the paper. This projectwas financed by the Federal Ministry of Agriculture, Forestry, Environ-ment and Water Management (BMLFUW) and the nine Austrian prov-inces and Austrian Research Promotion Agency (FFG), who promote thisproject. E. N. and I. B. gratefully acknowledge the grant provided by theGerman Federal Ministry of Food and Agriculture (grant no. FNR22011804).
References
1. Weiland P (2006) Biomass digestion in agriculture: a successfulpathway for the energy production and waste treatment inGermany. Eng Life Sci 6(3):302–309
2. Appels L, Lauwers J, Degrve J, Helsen L, Lievens B,WillemsK, VanImpe J, Dewil R (2011) Anaerobic digestion in global bio-energyproduction: potential and research challenges. RenewSust Energ Rev15(9):4295–4301. doi:10.1016/j.rser.2011.07.121
3. Weiland P, VerstraeteW, Van Haandel A (2009) Biomass digestion tomethane in agriculture: a successful pathway for the energy produc-tion and waste treatment worldwide. In: Vandamme WSa EJ (ed)Biofuels. Wiley, Belgium, pp 171–195
4. Sommer SG, Petersen SO, Møller HB (2004) Algorithms for calcu-lating methane and nitrous oxide emissions from manure manage-ment. Nutr Cycl Agroecosyst 69(2):143–154. doi:10.1023/B:FRES.0000029678.25083.fa
5. Holm-Nielsen JB, Al Seadi T, Oleskowicz-Popiel P (2009) Thefuture of anaerobic digestion and biogas utilization. BioresourTechnol 100(22):5478–5484
6. Winckler C, Grafe A (2000) Characterization and recycling of wastefrom intensive farming considering different soils (Original title:Charakterisierung und Verwertung von Abfällen aus derMassentierhaltung unter Berücksichtigung verschiedener Böden);Forschungsbericht 29733911. Deutschland//Umweltbundesamt:Texte, vol 2000,44. Umweltbundesamt, Berlin
7. Mellon M, Benbrook C, Benbrook KL (2001) Hogging it: estimatesof antimicrobial abuse in livestock. Union of Concerned Scientists(UCS) Publications, Cambridge
8. ApleyMD, Bush EJ,Morrison RB, Singer RS, SnelsonH (2012)Useestimates of in-feed antimicrobials in swine production in the UnitedStates. Foodborne Pathog Dis 9(3):272–279. doi:10.1089/fpd.2011.0983
9. Arikan OA, Sikora LJ, Mulbry W, Khan SU, Rice C, Foster GD(2006) The fate and effect of oxytetracycline during the anaerobicdigestion of manure from therapeutically treated calves. ProcessBiochem 41(7):1637–1643. doi:10.1016/j.procbio.2006.03.010
10. Gans O, Pfundtner E, Winckler C, Bauer A (2010) Reduction ofveterinary antibiotics in agricultural soils by collocated biogas plants?(Original t i t le: Reduktion des Antibiotikaeintrages inlandwirtschaftlich genützten Böden durch Biogasanlagen?).Umweltbundesamt, Vienna
11. Gans O, Weiss S, Sitka A, Pfundtner E, Scheffknecht C, Scharf S(2008) Determination of selected veterinary antibiotics and quaterna-ry ammonium compounds in digestates of biogas plants in Austria.In: Fuchs G, Kupper T, Tamm L, Schenk K (eds) Compost anddigestate: sustainability, benefits, impacts for the environment andfor the plant production. CODIS 2008, Solothurn
12. Lindsey ME,Meyer M, Thurman EM (2001) Analysis of trace levelsof sulfonamide and tetracycline antimicrobials, in groundwater andsurface water using solid-phase extraction and liquidchromatography/mass spectrometry. Anal Chem 73(19):4640–4646
13. Martínez-Carballo E, González-Barreiro C, Scharf S, Gans O (2007)Environmental monitoring study of selected veterinary antibiotics inanimal manure and soils in Austria. Environ Pollut 148(2):570–579.doi:10.1016/j.envpol.2006.11.035
14. Choi E (2007) Piggery waste management: towards a sustainablefuture. IWA Publishing, London
15. Shimada T, Zilles JL, Morgenroth E, Raskin L (2008) Inhibitoryeffects of the macrolide antimicrobial tylosin on anaerobic treatment.Biotechnol Bioeng 101(1):73–82. doi:10.1002/bit.21864
16. Sanz JL, Rodriguez N, Amils R (1996) The action of antibiotics onthe anaerobic digestion process. Appl Microbiol Biotechnol 46(5–6):587–592
17. Masse DI, Lu D, Masse L, Droste RL (2000) Effect of antibiotics onpsychrophilic anaerobic digestion of swinemanure slurry in sequenc-ing batch reactors. Bioresour Technol 75(3):205–211
18. Lallai A,Mura G, Onnis N (2002) The effects of certain antibiotics onbiogas production in the anaerobic digestion of pig waste slurry.Bioresour Technol 82(2):205–208. doi:10.1016/S0960-8524(01)00162-6
19. VDI (2006) VDI 4630—fermentation of organic materials.Characterisation of substrate, sampling, collection of material data,fermentation tests. VDI Gesellschaft Energietechnik
20. Hopfner-Sixt K, Amon T, Walla C, Pötsch E, Amon B, MilovanovicD, Mayr H, Weichselbaum W (2007) Analysis and optimization ofnew biogas plants (Original title: Analyse und Optimierung neuerBiogasanlagen). Österreichische Forschungsfürderungsgesellschaft(FFG)
21. D.I.N (2001) Characterization of sludges—determination of dry res-idue and water content (Original title: Charakterisierung vonSchlämmen—Bestimmung des Trockenrückstandes und desWassergehalts); Deutsche Fassung EN 12880:2000
22. Sluiter A, Ruiz R, Scarlata C, Sluiter J, Templeton D (2008)Determination of extractives in biomass. Laboratory AnalyticalProcedure (LAP)
23. Naumann C, Bassler R (1993) The chemical analysis of animal feed(Original title: Die chemische Untersuchung von Futtermittel), 3rdedn. VDLUFA, Darmstadt
24. Daims H, Stoecker K, Wagner M (2005) Fluorescence in situhybridisation for the detection of prokaryotes. In: Science G (ed)Advanced methods in molecular microbial ecology. BIOS ScientificPublishers, Abingdon, pp 213–239
25. Nettmann E, Bergmann I, Mundt K, Linke B, Klocke M (2008)Archaea diversity within a commercial biogas plant utilizing herbalbiomass determined by 16S rDNA and mcrA analysis. J ApplMicrobiol 105(6):1835–1850. doi:10.1111/j.1365-2672.2008.03949.x
26. Bergmann I, Mundt K, Sontag M, Baumstark I, Nettmann E, KlockeM (2010) Influence of DNA isolation onQ-PCR-based quantificationof methanogenic Archaea in biogas fermenters. Syst Appl Microbiol33(2):78–84. doi:10.1016/j.syapm.2009.11.004
27. Klocke M, Nettmann E, Bergmann I, Mundt K, Souidi K, Mumme J,Linke B (2008) Characterization of the methanogenic Archaea withintwo-phase biogas reactor systems operated with plant biomass. SystAppl Microbiol 31(3):190–205. doi:10.1016/j.syapm.2008.02.003
28. Yu Y, Lee C, Kim J, Hwang S (2005) Group-specific primer andprobe sets to detect methanogenic communities using quantitativereal-time polymerase chain reaction. Biotechnol Bioeng 89(6):670–679. doi:10.1002/bit.20347
29. Nettmann E, Bergmann I, Pramschüfer S, Mundt K, Plogsties V,Herrmann C, KlockeM (2010) Polyphasic analyses of methanogenicarchaeal communities in agricultural biogas plants. Appl EnvironMicrobiol 76(8):2540–2548. doi:10.1128/AEM.01423-09
Bioenerg. Res.
30. Amann RI, Binder BJ, Olson RJ, Chisholm SW, Devereux R, StahlDA (1990) Combination of 16S rRNA-targeted oligonucleotideprobes with flow cytometry for analyzing mixed microbial popula-tions. Appl Environ Microbiol 56(6):1919–1925
31. Stahl D, Amann R (1991) Development and application of nucleicacid probes. In: Stackebrandt E, Goodfellow M (eds) Nucleic acidtechniques in bacterial systematics. Wiley, Chichester, pp 205–248
32. Deublein D, Steinhauser A (2008) Biogas from waste and renewableresources—an introduction. Wiley-VCH Verlag GmbH & Co.KGaA, Weinheim
33. Stone JJ, Clay SA, Spellman GM (2010) Tylosin and chlortetracy-cline effects during swine manure digestion: Influence of sodium
azide. Bioresour Technol 101(24):9515–9520. doi:10.1016/j.biortech.2010.07.116
34. Gujer WA, Zehnder AJB (1983) Conversion processes in anaerobicdigestion. Water Sci Technol 15:127–167
35. Schnürer A, Houwen FP, Svensson BH (1994)Mesophilic syntrophicacetate oxidation during methane formation by a triculture at highammonium concentration. Arch Microbiol 162(1–2):70–74. doi:10.1007/s002030050103
36. Tamura K, Peterson D, Peterson N, Stecher G, Nei M, Kumar S(2011) MEGA5: molecular evolutionary genetics analysis usingmaximum likelihood, evolutionary distance, and maximum parsimo-ny methods. Mol Biol Evol 28:2731–2739
Bioenerg. Res.