effects of stocking density and water exchange ... - longdom
TRANSCRIPT

Open Access
Volume 3 • Issue 7 • 1000152J Aquacult Res DevISSN: 2155-9546 JARD, an open access journal
Open Access
Gaber et al., J Aquacult Res Dev 2012, 3:7 DOI: 10.4172/2155-9546.1000152
Open Access
Keywords: Green tiger shrimp; Stocking density; Water exchangerate
IntroductionShrimp farming is one of the most profitable and fast-growing
segment of the aquaculture industry (Tacon, 2002) [1]. The world production of shrimp increased 250 folds during the last 35 years from 10,000 ton in 1970 to 2, 461, 000 tones in 2005 (FAO, 2002) [2]. The green tiger shrimp, Penaeus semisulcatus used in this experiment, which resembles giant tiger shrimp, P. monodon in geographical distribution in the world. It is tolerant to high salinity and females reach their minimum first sexual maturity 6 month age size at about 130 mm length or 6 months age [3]. It is easy to propagate in captivity with or without lateral eyestalk ablation [4]. Stocking density is a major factor that affects fish growth under farmed conditions [5,6]. Stocking density and therefore, the volume of water per fish is a significantly factor in determining production in earthen ponds. Increasing stocking density results in stress, which leads to enhanced energy requirements causing reduced growth and food utilization [7].
Consequently, identifying the optimum stocking density for a species may be a critical factor affecting growth and feed intake when shrimp cultured in earthen ponds. The level of water exchange rate appeared to influence size in shrimp. Shrimp received more food grow faster, matured at larger size, whereas shrimp that received less water exchange rate grow slowly, and matured at smaller size [6]. Little information is available concerning the effects of stocking density and water exchange rate under the earthen ponds rearing system condition. The major objective were to determine the combined effects of stocking density and water exchange rate on growth performance, food utilization, and finally the economic feasibility of green tiger shrimp as species suitable for earthen ponds culture in Egypt.
Materials and Methods Experimental system and management
The experiment was conducted in Shrimp and Fish International Company (SAFICO) in Sharm El Sheikh Resort, South Sinai, Egypt.
This farm is located in a protected area. Water source and the discharged water were monitored twice a weekly. Three stocking densities (5, 15 and 25 Post larvae of shrimp (PLs/m2) and two water exchange (WER) (10 and 20% daily) were tested. Therefore, we have six treatments in three replicates. Shrimp PLs were produced in the hatchery of the same farm using pond reared brood-stocks. The experiment was conducted in eighteen earthen ponds each of 2200 m2 water area (1.3 m water depth) with one paddlewheel (1hp) per pound. The inlet water is coming from the Red Sea (40-41 ppt salinity).
Shrimp meal, and soybean meal were added at 113 kg/ha as an organic fertilizer to improve natural productivity of the experimental ponds during the preparation period only (three weeks before stocking post-larval shrimp). The inorganic fertilizers were added weekly at 30 kg/ha of urea, 1.4 l/ha of phosphoric acid and 16.7 kg/ha of sodium silicate. The quantity of fertilizers was divided into 2-3 doses per week for the first three months. Then, the quantity was reduced to the half doses during the last three months. The nitrogen: phosphorus (N: P205). The concentration of silicate was 5 ppm. PLs with average weight of 4.5 mg were stocked in shrimp ponds simultaneously over a period of two weeks at night after pond preparation. Shrimps were fed on starter diet containing 52% protein during first 104 days, Table 1 and finishing diet containing 42% protein until the end of the experiment (205 days).
*Corresponding author: Gaber MM, National Institute of Oceanography and Fisheries, Cairo, Egypt P.O Box: 40, Shoubra, Cairo, Egypt, E-mail: [email protected]
Received July 12, 2012; Accepted September 04, 2012; Published September 24, 2012
Citation: Gaber MM, Omar EA, Abdel-Rahim M, Nour AM, Zaki MA, et al. (2012) Effects of Stocking Density and Water Exchange Rates on Growth Performance of Tiger Shrimp, Penaeus Semisulcatus Cultured in Earthen Ponds. J Aquacult Res Dev 3:152 doi:10.4172/2155-9546.1000152
Copyright: © 2012 Gaber MM, et al. This is an open-access article distributed under the terms of the Creative Commons Attribution License, which permits unrestricted use, distribution, and reproduction in any medium, provided the original author and source are credited.
AbstractThe trial was conducted in earthen pond with average initial weight of 4.5 ± 0.4 mg/PLs of green tiger shrimp, to examine the effect of three stocking density and two water exchange rate on growth performances, production traits and feed composition. Eighteen earthen ponds (2200 m2) were stocked with either, 5, 15 and 25 PLs/m3, and received either 10 or 20% of water exchange rate. The results revealed that, mean final weight (g/PLs), gain in weight (g/PLs), gain in weight %, SGR (% /day), feed conversion ratio, protein productive value (PPV), protein efficiency ratio (PER), fat gain and energy utilization were significantly (p≤0.01) the best at the lowest stocking density. While, total production exhibited significantly the opposite trend. There significant differences (P≤0.05) were found between water exchange rate in term of mean final weight (g/PLs), gain in weight (g/PLs), gain in weight %, SGR (%/day), feed conversion ratio, PPV, PER, fat gain and energy utilization.
From the above results and the economic information of these study it can be concluded that, stocking density of 15 PLs/m2 of green tiger shrimp and 20% water exchange rate exhibited the highest net profit and would seem to be the most desirable density and water exchange rate in the system studied.
Effects of Stocking Density and Water Exchange Rates on GrowthPerformance of Tiger Shrimp, Penaeus Semisulcatus Cultured in Earthen PondsGaber MM1*, Omar EA2, Abdel-Rahim M2, Nour AM2, Zaki MA2 and Srour TM2 1National Institute of Oceanography and Fisheries, Cairo, Egypt2Department of Animal and Fish Production, Faculty of Agriculture, Alexandria University, Egypt
Journal of AquacultureResearch & Development
Research Article
Jour
nal o
f Aqu
aculture Research &Developm
ent
ISSN: 2155-9546

Citation: Gaber MM, Omar EA, Abdel-Rahim M, Nour AM, Zaki MA, et al. (2012) Effects of Stocking Density and Water Exchange Rates on GrowthPerformance of Tiger Shrimp, Penaeus Semisulcatus Cultured in Earthen Ponds. J Aquacult Res Dev 3:152 doi:10.4172/2155-9546.1000152
Page 2 of 5
Volume 3 • Issue 7 • 1000152J Aquacult Res DevISSN: 2155-9546 JARD, an open access journal
Experimental diets
Diets were manufactured using a wet extruder (3 hp) producing 50 kg of wet pelleted feed per hour with exchangeable diameters depending on shrimp size. Then feeds were subjected to sunrays for almost 16-24 hours depending on the air temperature. Feed stability was around 2 hours. Proximate composition of the experimental diets was determined according to AOAC methods, while crude fiber in fish diets was determined according to methods of Bredon and Juko (1961) [8,9] . Nitrogen free extract (NFE) of diets was calculated by difference. Gross energy (GE) was calculated using the gross energy values for the macronutrients (23.4 kJ g-1 protein, 39.8 kJ g-1 fat and 17.2 kJ g-1 carbohydrate, fiber was not included in calculation). Feed ingredients and chemical composition for both two diets are shown in Table 1. Shrimp were sampled monthly to adjust feeding ratios, which were used [10,11]. Feeding rate was calculated for each pond separately. Feeding table assumed a weekly mortality rate of 1.2%. Feeding trays (4 trays/pond) were used to adjust the quantity of feed per meal every two days according to the actual consumed feed. Well-trained workers distributed fifty percent of the quantity of each meal on at least 50% of the pond area. The rest of the daily feed amount (50%) was added in the feeding trays. Feeding meals were 2, 3, and 4 per day during months 1-2, 3-4, and 5-10, respectively. Each pond was supported with a wooden water level indicator. Water exchange rate was performed and adjusted by lowering water level in shrimp ponds to the required level (during the morning hours) and then re-compensated (during the evening hours). Paddle wheels were operated 4, 6, 8, 10, 12, 14, and 14 hrs during months 1, 2, 3, 4, 5, 6 and 7-10, respectively.
Growth parameters
Bi-weekly samples of shrimp (60 PLs at least) were caught by cast net to estimate the periodical growth parameters, total biomass of shrimp and to adjust feeding quantity. At the termination of the experiment, representative samples of shrimp during the harvest were taken. Growth parameters, production and feed utilization were calculated as follows: SGR (% day-1)=100 (Ln final weight-Ln initial weight)/days. Gain in weight (g/PLs)=mean final body weight - mean initial body weight; Feed conversion ratio (FCR)=total dry feed fed (g)/total wet weight gain (g). Net profit was determined by the difference between the sale price of the shrimp after harvest and the costs of larvae and food [12].
Water quality parameters
Water temperature and dissolved oxygen were measured every other day using YSI model 58 oxygen meters (Yellow Springs Instrument Company, Yellow Springs, OH, USA). Salinity was measured daily using refractometer. Un- Ionized ammonia and nitrite were measured once weekly using a DREL 2000 spectrophotometer (Hach Co., Lovel and, CO). pH was monitored twice weekly using an electronic pH meter (pH pen. Fisher Scientific, Cincinnati, OH). During the 10 months feeding trial, the average water quality parameters (mean ± SD) were water temperature, 26.8 ± 0.2°C; dissolved oxygen, 6.2 ± 0.5 mgL-1; Un- Ionized ammonia 0.06 ± 0.03 mgL-1; nitrite, 0.05 ± 0.03 mgL-1; pH, 8.6 ± 0.16 and salinity 45.5 ± 0.2%.
Statistical analysis
Data were analyzed by two-way analysis of variance using the SAS General Linear Models procedure [13]. Significance between stocking density, between water exchange rate, and their interaction was determined using Duncan’s multiple range tests (Duncan 1955) [14]. Treatments effects were considered significant at (P<0.05). All percentage and ratio data were transformed to arcsin values prior to analysis (Zar, 1984) [15].
Results Water quality parameters
Changes of water temperature, dissolved oxygen, pH, nitrite and un-ionized ammonia are shown in Table 2. It was indicated that changes in dissolved oxygen and un-ionized ammonia due to
(a) As PLs stocking density increases, DO2 decreases and ammonia increases.
Ingredient % DietsStarter Finishing
Fish meal (72% C.P.) 51.2 40.0Wheat flour 20.3 22.3Fish meal (72% C.P.) 16.0 25.2Soybean meal (44%. C.P.) 5.0 5.0Yeast 1.2 1.2Dun fat* 2.5 2.5Cod liver oil 0.5 0.5Gelatin 1.5 1.5Soya lecithin 1.0 1.0Amino-vita sol** 0.3 0.3Potassium phosphate 0.5 0.5Chemical composition % (wet bases)Moisture
9.5 07.4
Crude protein 51.95 42.87Crude fat 9.10 09.12Nitrogen free extract (NFE) 8.39 19.31Crude fiber 0.53 00.38Ash 20.53 20.92P/E Ratio (mg protein/kcal energy) 116.00 88.11
* Dun fat is a marine powdered lipid.** Amino vita sol is a product composed of amino acids, vitamins and minerals. (Vitamin A 12,000,000 IU, Vitamin D3 3,200,000 IU, Vitamin E 3,200 mg, Calcium pantothonate 4,000 mg, Vitamin B1 2,000 mg, Vitamin B6 1,200 mg, Vitamin K3 800 mg, Vitamin C 4,000 mg, Lysine 2,000 mg, Folic acid 300 mg, Methionine 1,500 mg, Systeine 1,000, Threonine 1,500 mg, Tryptophan 1,500 mg, Arginine 800 mg, Glycine 700 mg, Histidine 500 mg, Leucine 400 mg, Isoleucine 900 mg, Phenylalanine 950 mg, Tyrosine 700 mg, Valine 850 mg, Calcium 3,000 mg, Phosphorus 1,500 mg, Magnesium 700 mg, Zinc 800 mg, Propel Glycol 60 mTable 1: Feed ingredients and chemical composition of shrimp diets used for rearing shrimp (P. semisulcatus) in earthen grow-out ponds under three stocking densities and two rates of water exchange.
Classification Temperature DO21 pH NH3
2 Salanity (ppt)SD51525
N.S.26.7 ± 0.426.9 ± 0.426.8 ± 0.4
**6.7 ± 0.1a
6.0 ± 0.1b
4.8 ± 0.2c
N.S.8.6 ± 0.28.6 ± 0.18.6 ± 0.3
**0.04 ± 0.001c
0.06 ± 0.001b
0.08 ± 0.002a
N.S45.5 ± 0.245.4 ± 0.145.6 ± 0.3
WER10%20%
N.S.27.0 ± 0.426.6 ± 0.4
**5.4 ± 0.2b
6.2 ± 0.1a
*8.7 ± 0.1b
8.6 ± 0.1a
*0.06 ± 0.003a
0.05 ± 0.004b
*46.2 ± 0.1a
44.7 ± 0.1b
SDxWER N.S. ** N.S. ** N.S.
Means (+SE) in the same column having the same superscripts are not significantly different (p<0.05).Significant level: N.S.=P>0.05, *=P≤0.05, ** P≤0.01. Water exchange rate=WER1DO2=Dissolved oxygen, 2NH3=Unionized AmmoniTable 2: Water temperature, water salinity, dissolved oxygen (DO2), pH and un-ionized ammonia (NH3) for earthen grow-out ponds stocked with shrimp (P.semisulcatus) post-larvae at three stocking densities and two rates of water exchange (WER).

Citation: Gaber MM, Omar EA, Abdel-Rahim M, Nour AM, Zaki MA, et al. (2012) Effects of Stocking Density and Water Exchange Rates on GrowthPerformance of Tiger Shrimp, Penaeus Semisulcatus Cultured in Earthen Ponds. J Aquacult Res Dev 3:152 doi:10.4172/2155-9546.1000152
Page 3 of 5
Volume 3 • Issue 7 • 1000152J Aquacult Res DevISSN: 2155-9546 JARD, an open access journal
(b) Higher water exchange rate (WER) led to higher DO2 and pH and lower ammonia.
(c) There were a significant interaction between PLs stocking density (SD) and WER for DO2 and ammonia.
Growth performance
The changes in mean body weight (g/PLs) of tiger shrimp stocked
at three densities and two-water exchange rate 10% or 20% during the period of the experiment (10 months) are shown in Figure 1. At the beginning of the experiment, mean weight were not significantly different among the densities at two-water exchange rate (P>0.05). The overall averages ± SD of tiger shrimp 4.5 ± 0.3 mg/PLs for weight .At the end of the experiment, the mean weight (Figure 1) ranged between 22.4+1.2 g at the lowest stocking density (5 PLs/m2) and 15.30+1.0 g at highest stocking density (25 PLs/m2). The mean weight was significantly (P<0.05) smaller at high densities than low densities Table 3. The overall data of total production, final individual weight, , gain in weight, and specific growth rate (SGR) for tiger shrimp reared at three stocking density and two water exchange rate for a period of 10 months in earthen pond are presented in Table 3. It can be concluded from this table, mean final weight, gain in weight, gain in weight %, and SGR were significantly (P≤0.05) the best at the lowest stocking density.
While, total production exhibited significantly the opposite trend. Harvests and production estimates increased with increasing stocking density.
At the end of the experiment, total production was 1045.1 ± 35.8 kg/ha at 5 PLs/m2 stocking density and 2073.3 ± 49.6 kg/ha at 15 PLs/m2 stocking density. Production was opposite to the individual weight during the growth period, that the individual weight decreased with the increasing stoking density (Figure 2 and Table 3), while total
0
5
10
15
20
25
30
initial 14 28 42 56 70 84 98 11
212
614
015
416
818
219
6
Growth period (days)
Ave
rage
shri
mp
wei
ght (
g)
5pcs20wer5pcs/10wer15pcs/20wer25pcs/20wer15pcs/10wer25pcs/10wer
Figure 1: Effect of three stocking densities (5, 15, and 25 pcs/m2) and two water exchange rates (WER) (10 and 20%) on growth of marine shrimp (Penaeus semisulcatus) cultured in earthen grow-out ponds.
200
400
600
800
1000
1200
1400
5 pls/m2 15 pls/m2 25 pls/m2Stocking denisty
Tota
l pro
duct
ion
Kg
/hec
tare
10 WER20 WER
10
12
14
16
18
20
22
24
26
5PLs/m3 15PLs/m3 25PLs/m3Stocking density (PLs/m3)
Fina
l shr
imp
wei
ght (
g)
10%WER20%WER
Figure 2: The relation between total production and stocking density of green tiger shrimp Received water exchange rate 10% or 20% (upper graph). The relation between final mean weight (g)/PLs and stocking density of green tiger shrimp either received water exchange rate 10% or 20% daily (lower graph).
Classifica-tion
Average body weight ADG1mg/PLs/day
SGR2%/DAY TP3 kg.ha4
Initial (mg) Final (mg)SD51525
N.S.4.5 ± 0.34.5 ± 0.24.5 ± 0.4
**22.4+1.2a
17.50+1.14b
15.30+1.0b
**109.3 ± 5.7a
85.9 ± 5.5b
74.6 ± 5.1b
*4.2+0.03a
4.1+0.03b
4.0+0.03b
*997.7+60.2b
1979.7+198a
2013.0 ± 451a
WER10%20%
N.S.4.5 ± 0.14.5 ± 0.7
**16.9+1.4b
19.9+1.5a
**82.8+6.7b
97.1+7.3a
**4.0+0.04b4.1+0.04a
**1260.5+137b
2066.5+206a
SDxWER N.S. ** ** * **
Means (+SE) in the same column having the same superscripts are not significantly different (p≥0.05). Significant level: N.S.=P>0.05, *=P≤0.05, ** P≤0.01.1 Average daily gain (ADG)=(Final wt. – Initial wt.) / period (days).2 Specific growth rate (SGR)=100 (ln Final wt--ln Initial wt.) / period (days).3 TP. kg/ha =total production=Total weight of shrimp in the pond at harvest (gm)/ Total area of pond (m2).×10000Table 3: Effect of stocking density (SD) and water exchange rate (WER) on growth performance of marine shrimp (Penaeus semisulcatus) post-larvae cultured in earthen ponds. Culture period was 205 days.
Classification FCR1 PPV (%)2 PER3 Fat Gain (g) Energy utiliza-tion (%)4
SD51525
**2.3+0.1c
2.9+0.1b
4.3+0.5a
**14.0+0.7a
10.3+0.6b
6.3+1.1c
**0.8+0.1a
0.7+0.1b
0.4+ 0.1c
*0.5+0.1a
0.4+0.1b
0.3+ 0.1c
**12.3+ 0.6a
9.2 + 0.5b
5.7+ 1.0c
WER10%20%
**3.5+0.5a
2.8+0.2b
**9.0+1.6b
11.4+1.3a
*0.6+0.1a
0.7+0.1b
*0.3+0.1b
0.4+0.1a
*8.1+ 1.4b
10.1+1.1a
SD x WER **4 * * * * *
Presented data are an average of three readings + S.E.Means (+S.E.) in the same column having the same superscripts (capital) are not significantly different (P<0.05). Significant level: N.S.=P>0.05, *=P≤0.05, ** P≤0.01.,1 Feed conversion ratio (FCR),2 Protein Productive Value (PPV %)=100×protein gained in shrimp body (gm)/ protein fed (gm).3 Protein Efficiency Ratio (PER)=Gain in the shrimp weight (gm)/ protein fed (gm).4 Energy Utilization (EU)=100×energy gained in shrimp / energy fed.Table 4: Effect of stocking density (SD) and water exchange rate (WER) on feed and nutrient utilization efficiency of marine shrimp (Penaeus semisulcatus) post-larvae cultured in earthen grow-out ponds.
Citation: Gaber MM, Omar EA, Abdel-Rahim M, Nour AM, Zaki MA, et al. (2012) Effects of Stocking Density and Water Exchange Rates on GrowthPerformance of Tiger Shrimp, Penaeus Semisulcatus Cultured in Earthen Ponds. J Aquacult Res Dev 3:152 doi:10.4172/2155-9546.1000152
Page 4 of 5
Volume 3 • Issue 7 • 1000152J Aquacult Res DevISSN: 2155-9546 JARD, an open access journal
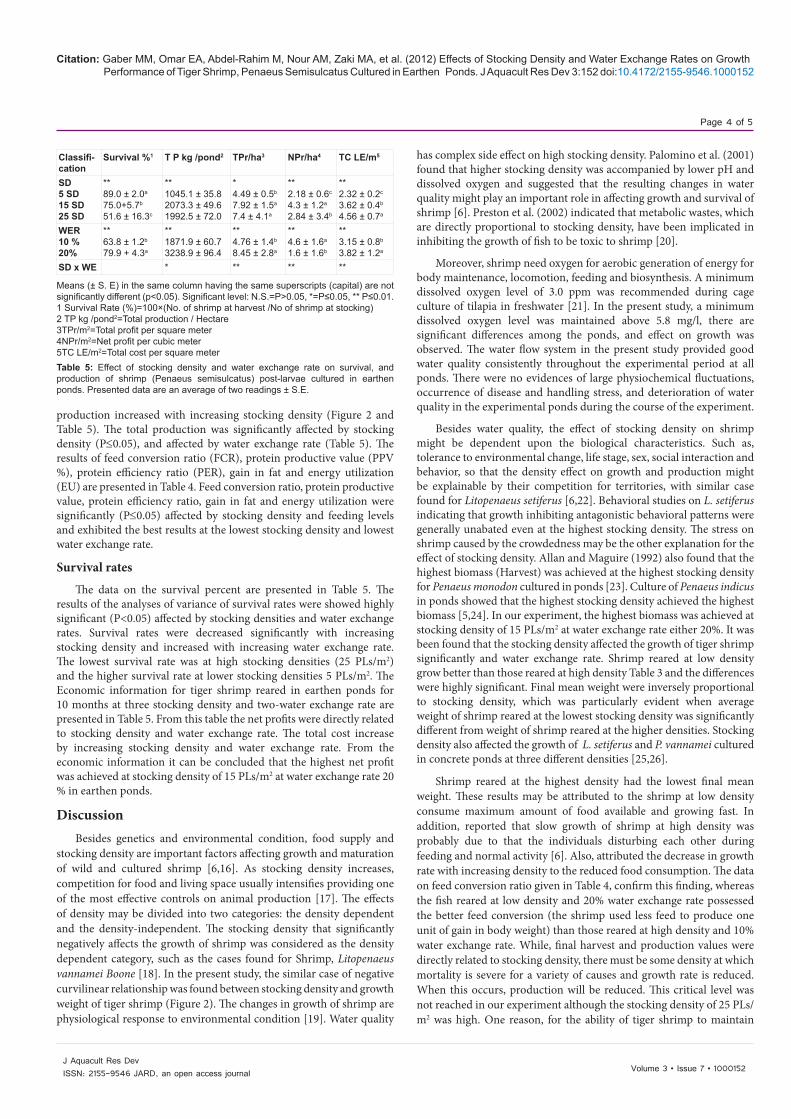
production increased with increasing stocking density (Figure 2 and Table 5). The total production was significantly affected by stocking density (P≤0.05), and affected by water exchange rate (Table 5). The results of feed conversion ratio (FCR), protein productive value (PPV %), protein efficiency ratio (PER), gain in fat and energy utilization (EU) are presented in Table 4. Feed conversion ratio, protein productive value, protein efficiency ratio, gain in fat and energy utilization were significantly (P≤0.05) affected by stocking density and feeding levels and exhibited the best results at the lowest stocking density and lowest water exchange rate.
Survival rates
The data on the survival percent are presented in Table 5. The results of the analyses of variance of survival rates were showed highly significant (P<0.05) affected by stocking densities and water exchange rates. Survival rates were decreased significantly with increasing stocking density and increased with increasing water exchange rate. The lowest survival rate was at high stocking densities (25 PLs/m2) and the higher survival rate at lower stocking densities 5 PLs/m2. The Economic information for tiger shrimp reared in earthen ponds for 10 months at three stocking density and two-water exchange rate are presented in Table 5. From this table the net profits were directly related to stocking density and water exchange rate. The total cost increase by increasing stocking density and water exchange rate. From the economic information it can be concluded that the highest net profit was achieved at stocking density of 15 PLs/m2 at water exchange rate 20 % in earthen ponds.
Discussion Besides genetics and environmental condition, food supply and
stocking density are important factors affecting growth and maturation of wild and cultured shrimp [6,16]. As stocking density increases, competition for food and living space usually intensifies providing one of the most effective controls on animal production [17]. The effects of density may be divided into two categories: the density dependent and the density-independent. The stocking density that significantly negatively affects the growth of shrimp was considered as the density dependent category, such as the cases found for Shrimp, Litopenaeus vannamei Boone [18]. In the present study, the similar case of negative curvilinear relationship was found between stocking density and growth weight of tiger shrimp (Figure 2). The changes in growth of shrimp are physiological response to environmental condition [19]. Water quality
has complex side effect on high stocking density. Palomino et al. (2001) found that higher stocking density was accompanied by lower pH and dissolved oxygen and suggested that the resulting changes in water quality might play an important role in affecting growth and survival of shrimp [6]. Preston et al. (2002) indicated that metabolic wastes, which are directly proportional to stocking density, have been implicated in inhibiting the growth of fish to be toxic to shrimp [20].
Moreover, shrimp need oxygen for aerobic generation of energy for body maintenance, locomotion, feeding and biosynthesis. A minimum dissolved oxygen level of 3.0 ppm was recommended during cage culture of tilapia in freshwater [21]. In the present study, a minimum dissolved oxygen level was maintained above 5.8 mg/l, there are significant differences among the ponds, and effect on growth was observed. The water flow system in the present study provided good water quality consistently throughout the experimental period at all ponds. There were no evidences of large physiochemical fluctuations, occurrence of disease and handling stress, and deterioration of water quality in the experimental ponds during the course of the experiment.
Besides water quality, the effect of stocking density on shrimp might be dependent upon the biological characteristics. Such as, tolerance to environmental change, life stage, sex, social interaction and behavior, so that the density effect on growth and production might be explainable by their competition for territories, with similar case found for Litopenaeus setiferus [6,22]. Behavioral studies on L. setiferus indicating that growth inhibiting antagonistic behavioral patterns were generally unabated even at the highest stocking density. The stress on shrimp caused by the crowdedness may be the other explanation for the effect of stocking density. Allan and Maguire (1992) also found that the highest biomass (Harvest) was achieved at the highest stocking density for Penaeus monodon cultured in ponds [23]. Culture of Penaeus indicus in ponds showed that the highest stocking density achieved the highest biomass [5,24]. In our experiment, the highest biomass was achieved at stocking density of 15 PLs/m2 at water exchange rate either 20%. It was been found that the stocking density affected the growth of tiger shrimp significantly and water exchange rate. Shrimp reared at low density grow better than those reared at high density Table 3 and the differences were highly significant. Final mean weight were inversely proportional to stocking density, which was particularly evident when average weight of shrimp reared at the lowest stocking density was significantly different from weight of shrimp reared at the higher densities. Stocking density also affected the growth of L. setiferus and P. vannamei cultured in concrete ponds at three different densities [25,26].
Shrimp reared at the highest density had the lowest final mean weight. These results may be attributed to the shrimp at low density consume maximum amount of food available and growing fast. In addition, reported that slow growth of shrimp at high density was probably due to that the individuals disturbing each other during feeding and normal activity [6]. Also, attributed the decrease in growth rate with increasing density to the reduced food consumption. The data on feed conversion ratio given in Table 4, confirm this finding, whereas the fish reared at low density and 20% water exchange rate possessed the better feed conversion (the shrimp used less feed to produce one unit of gain in body weight) than those reared at high density and 10% water exchange rate. While, final harvest and production values were directly related to stocking density, there must be some density at which mortality is severe for a variety of causes and growth rate is reduced. When this occurs, production will be reduced. This critical level was not reached in our experiment although the stocking density of 25 PLs/m2 was high. One reason, for the ability of tiger shrimp to maintain
Classifi-cation
Survival %1 T P kg /pond2 TPr/ha3 NPr/ha4 TC LE/m5
SD5 SD15 SD25 SD
**89.0 ± 2.0a
75.0+5.7b
51.6 ± 16.3c
**1045.1 ± 35.82073.3 ± 49.61992.5 ± 72.0
*4.49 ± 0.5b
7.92 ± 1.5a
7.4 ± 4.1a
**2.18 ± 0.6c
4.3 ± 1.2a
2.84 ± 3.4b
**2.32 ± 0.2c
3.62 ± 0.4b
4.56 ± 0.7a
WER10 %20%
**63.8 ± 1.2b
79.9 + 4.3a
**1871.9 ± 60.73238.9 ± 96.4
**4.76 ± 1.4b
8.45 ± 2.8a
**4.6 ± 1.6a
1.6 ± 1.6b
**3.15 ± 0.8b
3.82 ± 1.2a
SD x WE * ** ** **
Means (± S. E) in the same column having the same superscripts (capital) are not significantly different (p<0.05). Significant level: N.S.=P>0.05, *=P≤0.05, ** P≤0.01.1 Survival Rate (%)=100×(No. of shrimp at harvest /No of shrimp at stocking)2 TP kg /pond2=Total production / Hectare3TPr/m2=Total profit per square meter4NPr/m2=Net profit per cubic meter5TC LE/m2=Total cost per square meterTable 5: Effect of stocking density and water exchange rate on survival, and production of shrimp (Penaeus semisulcatus) post-larvae cultured in earthen ponds. Presented data are an average of two readings ± S.E.
Citation: Gaber MM, Omar EA, Abdel-Rahim M, Nour AM, Zaki MA, et al. (2012) Effects of Stocking Density and Water Exchange Rates on GrowthPerformance of Tiger Shrimp, Penaeus Semisulcatus Cultured in Earthen Ponds. J Aquacult Res Dev 3:152 doi:10.4172/2155-9546.1000152
Page 5 of 5
Volume 3 • Issue 7 • 1000152J Aquacult Res DevISSN: 2155-9546 JARD, an open access journal
high production levels when available oxygen present and unionized ammonia is reduced. Rearing densities of 15 PLs/m2 for tiger shrimp would seem to be the most desirable in the system studied. There was a strong trend for both production and final harvest to increase with increasing stocking density. These results are in agreement with those of reported that productions of shrimp culture are generally depended on the stocking density, and water exchange rate [6].
Therefore, the results of the present study showed that stocking density was positively correlated with total production per unit area (r=0.987) and negatively correlated with individual weight gain (r=0.997). The levels of water supply appeared to influence on size at first maturity in shrimp. Shrimp that received more water exchange rate grew faster and matured at larger size, whereas shrimp that received less water exchange rate grew slowly and matured at smaller sizes. Similar observations have been reported in a number of shrimp species [23,27,28]. Water exchange rate availability influenced the total percentage of mature shrimp in the population considerably, being highest in shrimp receiving highest level of water exchange rate and lowest in shrimp receiving lowest level of water exchange rate. In addition, water exchange rate supply influenced significantly the mean final weight and food conversion ration. In the present study, tiger shrimp received 20% water exchange rate had significantly the best final mean weight and feed conversion ratio compared with 10% water exchange rate. Allan and Maguire (1993) reported similar results for P. monodon [23]. They showed that growth rate and feed conversion ratio were clearly affected by water exchange rate but not by initial stocking density.
Finally, semi-intensive culture of tiger shrimp in earthen ponds with flow and supplemental continuous aeration significantly influenced by stocking density and water exchange rate. Growth and production of shrimp were significantly related to stocking density and water exchange rate. It can be concluded that, the best desirable stocking density was 15 PLs/m2 and 20% water exchange rate in the system studied which give the highest mean final weight, better feed conversion ratio, best production and economically had the highest net profit.
References
1. Tacon AGJ (2002) Thematic Review of Feeds and Feed Management Practices in Shrimp Aquaculture; In Report Prepared for the World Bank, NACA, WWF and FAO Consortium Program on Shrimp Farming and the Environment.
2. FAO (2002) FAO Fisheries Department, Fishery Information, Data and Statistics Unit. In FISHSTAT Plus: Universal software for fishery statistical time series. Version 2.30.
3. Kumlu M, Eroldogan OT, Aktas M (2000) Effects of temperature and salinity on larval growth, survival and development of Penaeus semisulcatus. Aquaculture 188: 167-173.
4. Aktas M, Kumlu M (1999) Gonadal maturation and spawning of Penaeusc semisulcatus (Penaeidae: Decapoda). Trop J Zool 23: 61-66.
5. Emmerson WD, Andrews B (1981) The Effect of Stocking Density on the Growth, Development and Survival of Penaeus indicus Milne Edwards Larvae. Aquaculture 23: 45-57.
6. Palomino G, Conteras F, Sanchez A, Rosas C (2001) Density and Water Exchange-Dependent Growth and Survival of Litopenaeus setiferus Postlarvae. J World Aquaculture Soc 32: 167-175.
7. Peterson EP, Walke MB (2001) Effect of speed on Taiwanese paddlewheel aeration. Aquacultural Engineering 26: 129-147.
8. AOAC (Association of Official Analytical Chemists) (1995) Official methods of analysis,16th edition, AOAC, Arlington, VA, USA.
9. Bredon RM, Juko CD (1961) A semi-micro technique for crude fiber determination. J Sci Food Agri 12: 196-201.
10. Davis DA, Arnold CR (2000) Replacement of Fish Meal in Practical Diets for the Pacific White Shrimp, Litopenaeus vannamei. Aquaculture 185: 291-298.
11. Forster I, Dominy W, Tacon AGJ (2002) The use of concentrates and other soy bproducts in shrimp feeds. In: Cruz-Suarez LE, Ricque- Marie D, Tapia-Salazar, Gaxiola-Corte MG, Simoes N, Advaces en Nutricion, USA.
12. Hengsawat K, Ward FJ, Jaruratjamorn P (1997) The effect of stocking density on yield, growth and mortality of African catfish {Glarias gariepinus Burchell 1822) cultured in cages. Aquaculture 152: 67-76.
13. Statistical Analysis System (1988) SAS/ STAT User’s Guide Release 6.03 edition. SAS Institute Inc Cary NC, USA.
14. Duncan AE (1955) Multiple range and multiple F tests. Biometrics 11: 1-42.
15. Zar JH (1984) Biostatistical Analysis, 2nd edn. Prentice-Hall International, Inc. Englewood Cliffs, New Jersey, USA.
16. Keys SJ (2002) Aspects of the Biology and Ecology of the Brown Tiger Prawn, Penaeus esculentus, Relevant to Aquaculture. Aquaculture 62: 1-10.
17. Huang WB, Chiu TS (1997) Effects of stocking density on survival, growth, size variation, and production of Tilapia fry. Aquaculture Res 28: 165-173.
18. Velasco M, Lawerence AL, Castille FL (1999) Effect of Variations in Daily Feeding Frequency and Ration Size on Growth of Shrimp Litopenaeus vannamei (Boone), in zero-water exchange culture tanks. Aquaculture 179: 141-148.
19. Coman GJ, Crocos PJ, Preston NP, Fielder D (2002) The Effects of Temperature on the Growth, Survival and Biomass of Different Families of Juvenile Penaeus japonicus Bate. Aquaculture 214: 185-199.
20. Preston NP, Rothlisberg PC, Burford MA, Jackson CJ (2002) The Environmental Management of Shrimp Farming in Australia. Report prepared under the World Bank, NACA, Australia.
21. Groth A, Focken U, Becker K (2001) Laboratory investigations on the influence of oxygen concentration in water on the feeding behaviour of Tiger shrimp (Penaeus monodon) In: Tagungsband. 14. Jahrestagung der Gesellschaft für Tropenökologie, Bremen, Germany.
22. Wyban JA, Lee CS, Sato VT, Sweeny JN, Richards JW (1987) Effect of stocking density on shrimp growth rates in manure-fertilized ponds. Aquaculture 61: 23-32.
23. Allan GL, Maguire GB (1993) The Effects of Water Exchange on Production of Metapenaeus macleayi and Water Quality in Experimental Pools. J World Aquaculture Soc 24: 321-328.
24. Lambregts JAD, Thacker SG, Griffin WL (1993) Economic Evaluation of Different Stocking Densities for Various Sized Shrimp Farms in Texas. J World Aquaculture Soc 24: 12-22.
25. Bartholomew WG, David RT, Claude EB (1999) Effect of water exchange on semi-intensive production of Penaeus vannamei. In: Green BW, Clifford HC, McNamara M, Montaño GM (Ed), V Central American Symposium on Aquaculture, 180-20 August 1999, San Pedro Sula, Honduras: 209-212.
26. Williams AS, Davis DA, Arnold CR (1996) Density-Dependent Growth and Survival of Penaeus setiferus and Penaeus vannamei in a Semi-Closed Recirculating System. J World Aquaculture Soc 27: 107-112.
27. Ani S, Noble A (1993) Laboratory Studies on Feeding and Water Exchange in the Culture of Penaeus indicus. H. Milne Edwards. CMFRI Sp. Pub 55: 58-65.
28. Otoshi CA, Montgomery AD, Look AM, Moss SM (2001) Effects of Diet and Water Source on the Nursery Production of Pacific White Shrimp Litopenaeus vannamei. J World Aquaculture Soc 32: 243-249.