effects of shock-tube cleanliness on hypersonic boundary
TRANSCRIPT
Technical NotesTECHNICAL NOTES are short manuscripts describing new developments or important results of a preliminary nature. These Notes should not exceed 2500
words (where a figure or table counts as 200 words). Following informal review by the Editors, they may be published within a few months of the date of receipt.
Style requirements are the same as for regular contributions (see inside back cover).
Effects of Shock-Tube Cleanliness on
Hypersonic Boundary Layer Transition
at High Enthalpy
Joseph S. Jewell∗
U.S. Air Force Research Laboratory, Wright–Patterson Air
Force Base, Ohio 45433
Nicholaus J. Parziale†
Stevens Institute of Technology, Hoboken, New Jersey 07030
Ivett A. Leyva‡
U.S. Air Force Office of Scientific Research, Arlington Air
Force Base, Virginia 22203
and
Joseph E. Shepherd§
California Institute of Technology, Pasadena, California
91125
DOI: 10.2514/1.J054897
I. Introduction
T HE prediction of a high-speed boundary-layer transition (BLT)
location is critical to hypersonic vehicle design; this is because
the increased skin friction and surface heating rate after transition
result in increased weight of the thermal protection system. Experi-
mental studies using hypervelocity wind tunnels are one component
of BLT research.
The freestream disturbances in supersonic and hypersonic wind
tunnels include acoustic waves, entropy inhomogeneity, and vortical
perturbations, in addition to microscale and macroscale particles [1].
These disturbances, in whatever form, can significantly influence
boundary-layer instability and transition-location measurements such
that confidence in the experimental measurements is compromised.
For this reason, transition researchers have made extensive efforts in
minimizing and characterizing freestream disturbance levels.
Hypersonic wind tunnels exist where there are low disturbancelevels, such as those at Purdue University [2–4] and Texas A&MUniversity [5,6]. Currently, the parameter space available to low-disturbance hypersonic wind tunnels does not permit the study of theinteraction of boundary-layer instability and thermochemistry, whichis important for accurately modeling realistic reentry flows; this isbecause low-disturbance hypersonic tunnels have a low-orderedkinetic energy, or total enthalpy, in the freestream relative to relevantchemical or vibrational energy levels.To study the effects of thermochemistry on BLT in a ground
test, the total enthalpy of the flow must be sufficiently high. Onesuch ground-test facility to generate “high-enthalpy” flows is thereflected-shock tunnel. In the past, researchers have used shocktunnels and reflected-shock tunnels to study BLT [7–13]. Morerecently, in the high-enthalpy reflected-shock tunnel at Gottingen,Germany (HEG), Laurence et al. [14–16] reported a schlieren-basedtechnique for the investigation of disturbances in hypervelocityboundary layers. In those reports, high-resolution and time-resolvedimages of the second-mode instability of a hypervelocity boundarylayer on a slender cone data were presented. At California Institute ofTechnology in the T5 reflected-shock tunnel, Germain and Hornung[17], Adam and Hornung [18], Rasheed et al. [19], Jewell et al. [20],and Parziale et al. [21] studied hypervelocity BLTon a slender cone;those researchers performed approximately 1000 experiments andmade significant progress in developing visualization and directmeasurement techniques. These diagnostic advances made possiblethe investigation of high-enthalpy effects on BLT in different gasesand hypervelocity BLT control by porous coatings. However, specialattention to potential particulate contamination in high-enthalpyimpulse facilities is required, relative to conventional “cold”hypersonic tunnels, because of the harsh conditions in the facilitybefore and after the test flow over the model.To reduce the effects of particulates of BLT on slender cones
[20–27], we devised a new cleaning and fill procedure for the shocktunnel, which is the subject of this Note. Possible sources of particlesinclude piston buffer material, piston brakes, test gas impurities, andthe Mylar secondary diaphragm. In particular, Parziale et al. [25]noted that experiments performed immediately after an experimentwhere the piston buffers shattered had less predictable noise profiles.With stringent cleaning of the shock tube, it was possible to mitigateparticulate contamination and repeatedly obtain transition at specifiedlocations through a careful selection of reservoir conditions.Analyses of the current data with standard linear stability methods
indicates that the transition location corresponds to second-modeamplification factors eN with N ≈ 8–12 at transition onset [20,26].These values, even those obtained before implementation of thecleaning regimen, are high compared to the more typical values ofN ≈ 5–6 usually characterizing a “noisy” tunnel [2]. Although thetransition N factors recorded early in the current test campaign werehigher than expected for a noisy tunnel, there was a larger thandesired scatter in results. One reason for a higher transition N factorfor the current data may be the mismatch between freestream noisespectrum and boundary-layer unstable frequencies for second-modedisturbances, whereas the relatively large scatter may result fromparticulate-induced bypass transition affecting some experiments.Parziale et al. [25] found that noise in the T5 freestreamwas relativelylow frequency compared with the most unstable boundary-layerfrequencies. This hypothesis was implicitly supported by the recentanalysis of Gronvall et al. [28], who found a transition onset value of
Presented as Paper 2015-1786 at the 53rd AIAA Aerospace SciencesMeeting, Kissimmee, FL, 5–9 January 2015; received 17 November 2015;revision received 30 June 2016; accepted for publication 4 July 2016;published online 14 September 2016. This material is declared a work of theU.S. Government and is not subject to copyright protection in the UnitedStates. Copies of this paper may be made for personal and internal use, oncondition that the copier pay the per-copy fee to the Copyright ClearanceCenter (CCC). All requests for copying and permission to reprint should besubmitted to CCC at www.copyright.com; employ the ISSN 0001-1452(print) or 1533-385X (online) to initiate your request.
*ResearchAerospace Engineer (NRCResearch Associate), AFRL/RQHF;[email protected]. Senior Member AIAA.
†Assistant Professor, Mechanical Engineering, Castle Point on Hudson.Member AIAA.
‡Program Officer, AFOSR/RTE. Associate Fellow AIAA.§Professor, Graduate Aeronautical Laboratories, 1200 E. California Blvd.,
MC 105-50. Senior Member AIAA.
Article in Advance / 1
AIAA JOURNAL
N ≈ 8 for the experiments of Tanno et al. [12], which were alsoperformed in a reflected-shock tunnel, although at lower enthalpythan the present study, and for a limited range of conditions, withunspecified cleaning procedures. At the start of the present testcampaign, before the implementation of the cleaning regimen, weencountered difficulty in achieving repeatable transition Reynoldsnumbers and N factors. Our hypothesis was that bypass transitionwas caused sporadically by particulate left over from prior experi-ments; thus, it became a focus to reduce particulate.Recently, Fedorov [22] examined receptivity to particulate-laden
flows, modeling the particulates as spherical solids impacting thesupersonic boundary layer, and making numerical estimates forparticulate-driven transition onset for various sizes and densities.Fedorov found that both the N factor and the transition Reynoldsnumber were strongly influenced by particle characteristics, in-cluding size and number density. For computations with a 14 deghalf-angle sharp wedge at Mach 4 in the standard atmosphere at20 km, the transition onset N factor dropped from 12 for particles ofradius of 5 μm to 7 for particles with a radius of 50 μm; this providesthe motivation to minimize particulates in the freestream, which isapparent for ground tests of BLT in impulse facilities.Examples of data from experiments before and after the cleaning
regimen was instituted are presented, and these results are compared.Then, a statistical analysis of transitionReynolds number is presentedto quantify the change in repeatability of the experiment.
II. Facility
All measurements are made in T5, which is the free-piston-drivenreflected-shock tunnel at the California Institute of Technology. T5 isdesigned to simulate flow conditions and aerodynamics of hyper-velocity vehicles at total enthalpies up to 25 MJ∕kg and freestreamvelocities of up to 6000 m∕s. During each T5 experiment, a piston-compressed helium/argon driver ruptures a scored stainless-steelprimary diaphragm. Following the primary diaphragm rupture, ashock wave propagates in the shock tube; is reflected off the endwall,breaking the secondary diaphragm; and reprocesses the test gas,which is then expanded through a converging–diverging contourednozzle to ∼Mach 5.5 in the test section [24,26,29].Themeasured primary shock speed and reservoir pressure are used
to compute the reservoir conditions for each test. Thermochemicalequilibrium calculations are performed using Cantera [30] with theShock and Detonation Toolbox [31], using thermodynamic datafound valid for the high-temperature conditions in T5 [32,33]. Thetest gas reaches its highest temperature in the stagnation region. Forthe 74 tests comprising the present dataset, the calculated reservoirtemperature ranged from 3380 to 6930 K, with the mean and medianboth 5510 K. The cone mean flow was computed with the STABLsoftware suite, as described by Johnson [34] and Johnson et al. [35],and recently applied by Wagnild [36]. Boundary-layer profiles andedge properties were extracted from the mean flow solutions duringpostprocessing.
III. Shock-Tube Fill Gas Quality and CleaningProcedure
Experience with testing in T5 revealed an opportunity to increasethe quality of the flow over the model. Improvement was achieved byusing higher-quality gas to fill the shock tube and cleaning the shocktube more thoroughly between experiments. The most repeatableresults were obtained with the “ALPHAGAZ” grade of Air Liquideproducts.¶
Even after changing to research quality test gas, we found itdifficult to repeatedly specify a transition location with a choice ofrun conditions.We hypothesized that this was due to the particulatesin the shock tube left over from the previous run. However, thelack of a comprehensive test series carried out after changing
to higher-quality gas, but before extensive particulate reductionefforts, precluded conclusively separating the effects of highertest gas quality from the effects of the improved cleaningprocedure. Experience in other facilities has shown that particulatecontamination is very effective at promoting transition [3]. Tominimize particulates, the cleaning procedure between eachoperational cycle was changed to 1) clean the shock-tube end with aScotch-Brite pad; 2) clean the shock-tube end with acetone on amop; 3) pass four shop towels rolled into a cylinder and drag themthrough the shock tube, with the outermost towel being misted withacetone; 4) repeat step 3 until the outermost towel does not becomedirty after a pass through the shock tube (as many as 20 times); and5) repeat step 3with the outer towelmistedwith isopropyl alcohol toremove any remaining acetone residue. The nozzle and nozzlethroat were cleaned by hand with Kimwipes using the samesequence of solvents.The region at the end of the shock tube in a reflected-shock tunnel
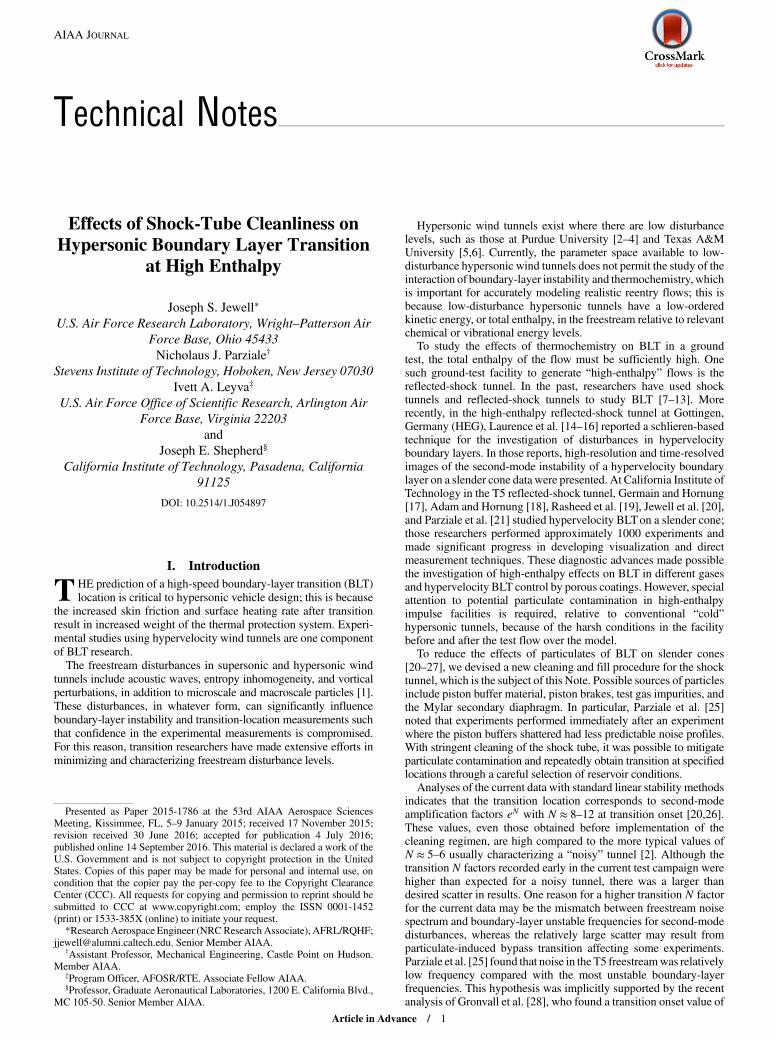
is an additional area of concern with respect to shot-to-shot variation.In T5, this region comprised a copper insert and sleeve, shown in adetailed view in Fig. 1. Taylor and Hornung [37] noted that wallroughness in the reflected-shock region could increase the shockbifurcation asymptotic height, which was the distance above thesidewall within which wall effects were important behind a reflectedshock wave. This behavior was undesirable because of the inducednonuniformity of the reservoir gas and decreased test time due todriver gas contamination of the reservoir gas [38].After completing the cleaning, the copper insert and copper sleeve
had a smooth finish. The roughness of the 90-mm-diam shock tubewas estimated to be less than 25 μm. Throughout the test campaign,the copper insert and sleeve were maintained in this condition toavoid the detrimental effects of shock bifurcation as much aspossible.
IV. FLDI and Heat-Flux Measurements Examples:With and Without Cleaning
In this section, we present two examples of heat-flux and focusedlaser differential interferometry (FLDI) data: experiment 2769performed with the cleaning procedure explained in this Note, andexperiment 2702 performed without adequately cleaning T5.The focused laser differential interferometry is an optical tech-
nique, developed by Smeets [39] and recently used in T5 [21,27],which permits the high-speed and nonintrusive interrogation ofsmall-amplitude density perturbations within a small sensitive regionof the beam pathwhile rejecting perturbations outside of the sensitiveregion, including those resulting from the nozzle shear layer. Theeffect of cleaning on transition location and repeatability is examinedin a series of tests using the FLDI to measure disturbances within theboundary on a 5 deg half-angle smooth cone at a zero angle of attack.The FLDI is located at a fixed point relative to the cone, and thereservoir conditions are changed to adjust theReynolds number at theFLDI probe volume. Previous test data and numerical simulations oftunnel performance enable carrying out the testing at specifiedReynolds numbers and total enthalpy. For conditions with a suffi-ciently low Reynolds number, laminar response would be expectedbased on past heat-flux measurements. However, in some instanceswhere laminar flow was expected, boundary-layer instability mea-surements revealed that a sporadic and initially inexplicable period of
Fig. 1 Copper sleeve and insert at the shock-tube end.
¶The relative O2 (oxygen) to N2 (nitrogen) balance for ALPHAGAZ air istighter (�0.5% by partial pressure) than lower-grade gas, and the totalhydrocarbons are specified to be less than 0.05 ppm.
2 Article in Advance / TECHNICAL NOTES

broadband response would pass through the probe volume of the
focused laser differential interferometer.
To illustrate these events, spectrograms (arbitrary units of power
spectral density) of two runs at similar run conditions are compared
in Figs. 2a and 2b. In Fig. 2a, we present a spectrogram of the FLDI
data from experiment 2702, which was performed before the
implementation of the new cleaning procedure. The spectrogram
shows a sporadic and large swath of broadband response, followed
by a period where minimal disturbances are detected, and followed
by a period of narrowband response. The FLDI data show contrast
to the data recorded after the new cleaning-procedure implemen-
tation: for example, data from experiment 2769. We present a
spectrogram for experiment 2769 in Fig. 2b, which shows no
broadband response and only a series of stochastic but sensible
narrowband peaks.
The hypersonic quiet tunnel currently represents the state-of-the-
art facility class in terms of disturbance environment. Quiet tunnel
design and operation includes careful particulate mitigation, which
is partially motivated by preserving the mirrorlike finish on the
nozzle wall necessary to preserve low acoustic disturbance levels
by preventing nozzle wall boundary-layer transition [40]. The
FLDI data in Fig. 2b, recorded after the T5 cleaning procedure
was implemented, exhibit a narrowband response at distinct
frequencies associated with the second mode. This is qualitatively
similar to the spectrograms of a slender-body hypersonic boundary-
layer instability obtained in a low-disturbance facility by Hofferth
et al. [5].
The FLDI measurements provide detailed spectral data enabling
the narrow-band versus broadband characterization of boundary-
layer disturbances; however, these data are limited spatially to the
FLDI probe volume. Heat-flux measurements are performed to
provide data to assess the effect of cleaning on the entire surface of the
model, which enables the tracking of large turbulent spots suspected
to have been caused by particulate in the shock tube before running
the experiment.
The model is a smooth 5 deg half-angle aluminum cone 1 m in
length, similar to that used in a number of previous experimental
studies in T5, and is composed of three sections: a nominally sharp
tip (radius less than 0.175 mm) fabricated of molybdenum; an
interchangeable midsection (in the present experiments, this section
is a smooth, solid piece of plastic); and the main body, which is
instrumentedwith a total of 80 flush-mounted annular thermocouples
evenly spaced at 20 lengthwise locations beginning at 221 mm from
the tip of the cone, with each row located 38 mm from the last.
This sensor spacing corresponds to uncertainty estimates in the
edge Reynolds number at transition onset from �9.34 × 10⁴ to
�4.80 × 10⁵, and in reference Reynolds number at transition onset
from�6.00 × 10⁴ to�3.33 × 10⁵. Heat flux on the cone is obtainedfrom the thermocouples, which are of a design first used by
Sanderson [41] and Sanderson and Sturtevant [42]. These thermo-
couples have a response time on the order of a fewmicroseconds and
have been successfully used for boundary-layer transition onset
determination (i.e., the most forward departure of the non-
dimensionalized heat flux from an appropriate laminar correlation) as
was more fully described in the works of Adam and Hornung [18],
Rasheed et al. [19], and Jewell et al. [20], as well as for tracking the
propagation of turbulent spots by Jewell et al. [23]. Time- and
spatially-resolved heat-flux data allow the presentation of a “movie”
of heat flux over the entire instrumented surface of the cone by
interpolating the processed thermocouple signals.
In Fig. 3, we present several heat-flux frames from the test time of
experiment 2702, which corresponds to the FLDI result shown in
Fig. 2a and is performed before the new cleaning-procedure imple-
mentation. A turbulent spot is observed (first frame, top left, marked
with an arrow) at 0.075ms intervals covering a total time of 0.375ms,
and propagates downstream and eventually off the end of the cone in
the subsequent three frames. The location of the FLDI is markedwith
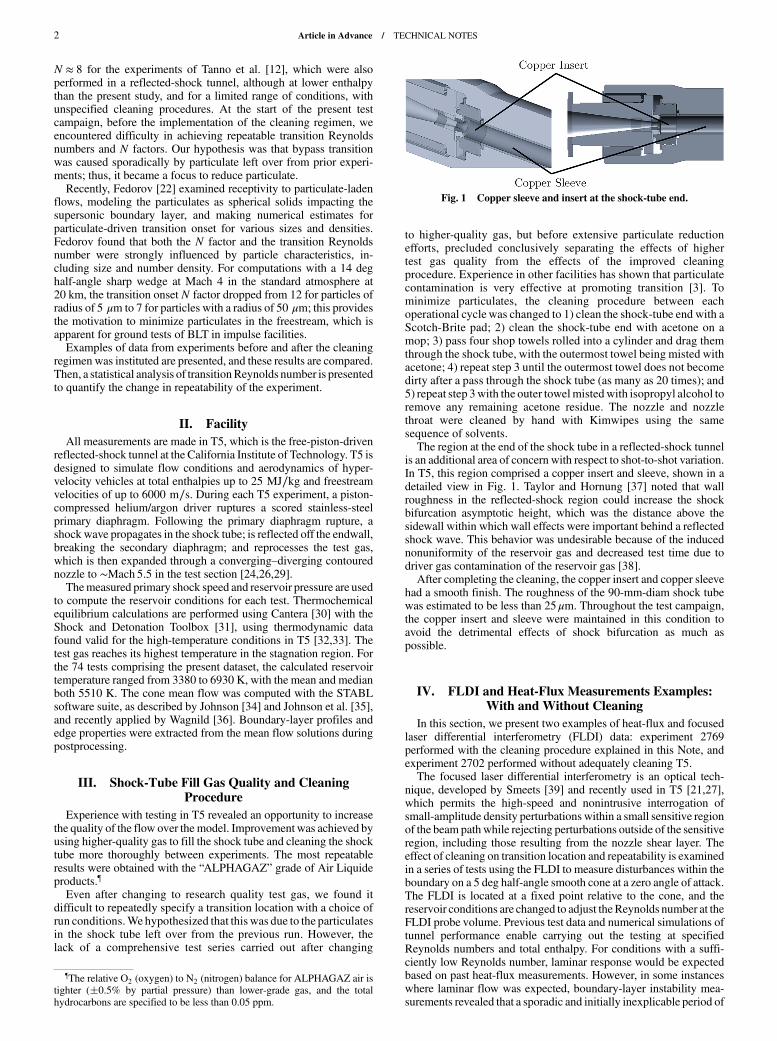
an “X” at 665 mm from the tip. In addition, Fig. 4 presents several
heat-flux frames from the test time of experiment 2769, which
correspond to the FLDI result shown in Fig. 2b and are performed
0.2 0.4 0.6 0.8 1
– 0.2
0
0.2
Cone surface coordinate (m)
0
Time = 1.215 ms
5
Time = 1.290 ms Time = 1.365 ms
Time = 1.440 ms Time = 1.515 ms Time = 1.590 ms
Fig. 3 Heat-flux spatial distributions, test 2702. A turbulent spot is observed and propagates downstream. “X” indicates FLDI location.
a) b)Fig. 2 Power spectral density of FLDI output as a function of time. Darker shading indicates larger amplitude. BBR is broadband response, and NBR is
narrowband response.
Article in Advance / TECHNICAL NOTES 3
following cleaning-procedure implementation 2769. Althoughintermittent turbulent flow is observed near the end of the cone, nopropagating turbulent bursts are visible during the experiment. Thelocation of the FLDI is marked with an “X” at 718 mm from the tip.The boundary-layer edge conditions for these two shots are recordedin Table 1.In test 2702 with a dirty shock tube, a turbulent spot is observed to
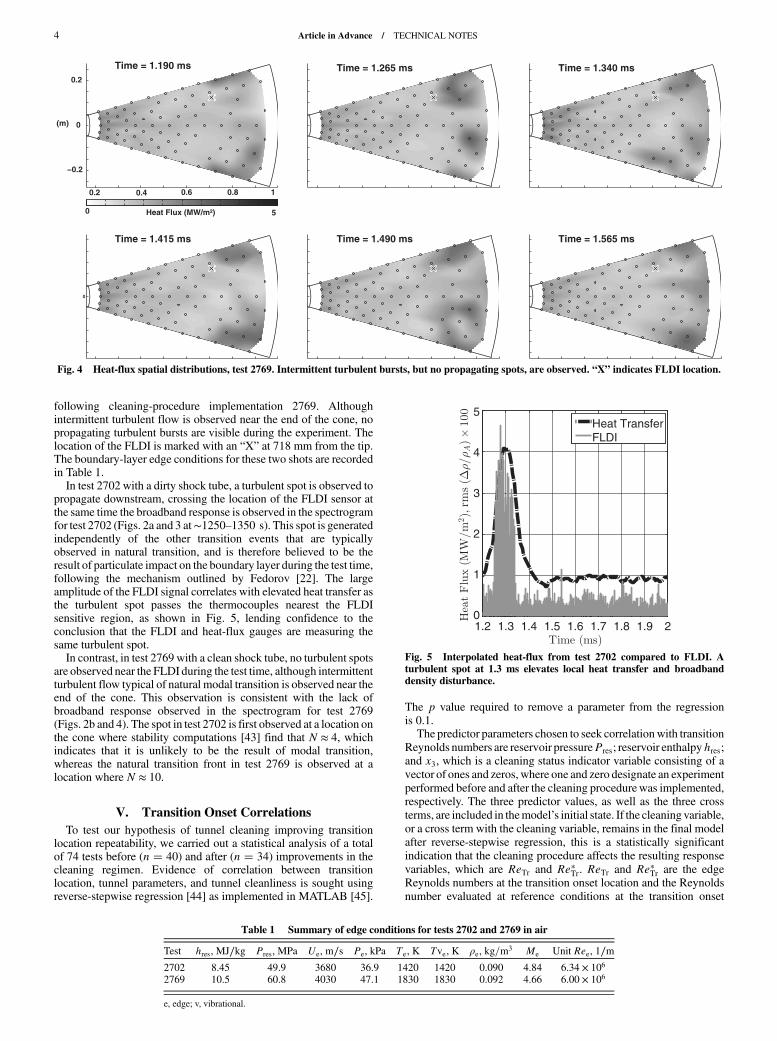
propagate downstream, crossing the location of the FLDI sensor atthe same time the broadband response is observed in the spectrogramfor test 2702 (Figs. 2a and 3 at∼1250–1350 s). This spot is generatedindependently of the other transition events that are typicallyobserved in natural transition, and is therefore believed to be theresult of particulate impact on the boundary layer during the test time,following the mechanism outlined by Fedorov [22]. The largeamplitude of the FLDI signal correlates with elevated heat transfer asthe turbulent spot passes the thermocouples nearest the FLDIsensitive region, as shown in Fig. 5, lending confidence to theconclusion that the FLDI and heat-flux gauges are measuring thesame turbulent spot.In contrast, in test 2769 with a clean shock tube, no turbulent spots
are observed near the FLDI during the test time, although intermittentturbulent flow typical of natural modal transition is observed near theend of the cone. This observation is consistent with the lack ofbroadband response observed in the spectrogram for test 2769(Figs. 2b and 4). The spot in test 2702 is first observed at a location onthe cone where stability computations [43] find that N ≈ 4, whichindicates that it is unlikely to be the result of modal transition,whereas the natural transition front in test 2769 is observed at alocation where N ≈ 10.
V. Transition Onset Correlations
To test our hypothesis of tunnel cleaning improving transitionlocation repeatability, we carried out a statistical analysis of a totalof 74 tests before (n � 40) and after (n � 34) improvements in thecleaning regimen. Evidence of correlation between transitionlocation, tunnel parameters, and tunnel cleanliness is sought usingreverse-stepwise regression [44] as implemented in MATLAB [45].
The p value required to remove a parameter from the regressionis 0.1.The predictor parameters chosen to seek correlationwith transition
Reynolds numbers are reservoir pressurePres; reservoir enthalpyhres;and x3, which is a cleaning status indicator variable consisting of a
vector of ones and zeros, where one and zero designate an experiment
performed before and after the cleaning procedurewas implemented,respectively. The three predictor values, as well as the three cross
terms, are included in themodel’s initial state. If the cleaning variable,
or a cross term with the cleaning variable, remains in the final modelafter reverse-stepwise regression, this is a statistically significant
indication that the cleaning procedure affects the resulting response
variables, which are ReTr and Re�Tr. ReTr and Re�Tr are the edgeReynolds numbers at the transition onset location and the Reynolds
number evaluated at reference conditions at the transition onset
Time = 1.190 ms
5 Heat Flux (MW/m²)
(m)
0.2
0
−0.2
0
0.2 0.4 0.6 0.8 1
Time = 1.265 ms Time = 1.340 ms
0
Time = 1.415 ms Time = 1.490 ms Time = 1.565 ms
Fig. 4 Heat-flux spatial distributions, test 2769. Intermittent turbulent bursts, but no propagating spots, are observed. “X” indicates FLDI location.
Table 1 Summary of edge conditions for tests 2702 and 2769 in air
Test hres,MJ∕kg Pres, MPa Ue, m∕s Pe, kPa Te, K Tve, K ρe, kg=m3 Me Unit Ree, 1∕m
2702 8.45 49.9 3680 36.9 1420 1420 0.090 4.84 6.34 × 10⁶
2769 10.5 60.8 4030 47.1 1830 1830 0.092 4.66 6.00 × 10⁶
e, edge; v, vibrational.
1.2 1.3 1.4 1.5 1.6 1.7 1.8 1.9 2
1
0
2
3
4
5Heat TransferFLDI
Fig. 5 Interpolated heat-flux from test 2702 compared to FLDI. Aturbulent spot at 1.3 ms elevates local heat transfer and broadbanddensity disturbance.
4 Article in Advance / TECHNICAL NOTES

location, respectively. Stepwise regression is performed twice: oncewith each transition Reynolds number as the response variable.The reverse-stepwise regressionmodel forReTr retainedPres, hres,
and x3, as well as thePres · x3 andhres · x3 cross terms, indicating thatthe null hypothesis of a zero coefficient is rejected for pressure,enthalpy, and tunnel cleanliness. The rearward-stepwise regressionmodel for Re�Tr retained Pres, hres x3, and the hres · x3 cross term,indicating that the null hypothesis of a zero coefficient is rejected forpressure, enthalpy, and tunnel cleanliness. In both cases, the pressureand enthalpy cross term is excluded from the final model, whichindicates that reasonable linear models for both transition Reynoldsnumbers may be constructed using only the pressure and enthalpyparameters if the data are divided into precleaning regimen and post-cleaning regimen data subsets to eliminate the influence of x3 and thetwo x3 cross terms.The coefficient of determination of correlation between the tunnel
parameters and the transition Reynolds number was used as a metricof repeatability within each data subset. A higher coefficient ofdetermination indicates higher repeatability. Jewell et al. [26,46]showed that the tunnel parameters hres (reservoir enthalpy) and Pres
(reservoir pressure) could be used as predictor variables to constructstatistically significant linear models of the transition Reynoldsnumber ReTr for both the present datasets and the historical T5transition data ofGermain andHornung [17] andAdam andHornung[18] for air,CO2, andN2. In the present work, only air transition dataare considered. These linear models take the form
ReTr�Pres; hres� � Reintercept � CPresPres � Chreshres
Here, the constant coefficients that define the regression plane,CPres
, Chres , and the Reynolds number intercept are computed viamultivariable-linear regression as implemented in MATLAB. Thecomplete model results for the data acquired before the implemen-tation of new shock-tube cleaning procedures are recorded in Table 2,and the results for the data acquired after the implementation of thecleaning procedures are recorded in Table 3. Both the ReTr and Re
�Tr
models have normally distributed errors, and each set of residualsexhibits limited heteroskedasticity.The position of the best-fit Reynolds number plane computed
relative to the hres-Pres plane (i.e, the intercept) is 5.90 × 10⁵ for thedirty tunnel data and 1.83 × 10⁶ for the clean tunnel data. The largerintercept value for the clean results is an indication that the tunnelcleaning procedure tends to increase the transition onset Reynoldsnumber. Moreover, the clean tunnel results show less dispersion thanthe dirty results, which is consistent with the stochastic effect thatwould be expected in dirty flow from an unknown and probablyinconsistent variation in particle size and number density. Linear
regression analysis performed using the tunnel parameters, reservoirenthalpy hres, and reservoir pressure Pres, as the predictor variablesand the edge Reynolds number at the transition onset location ReTras the response variable had a modeled R2 value of 0.50 for theexperiments before cleaning procedure implementation and an R2
value of 0.80 subsequent to the implementation of the cleaningprocedure. When the same regression analysis is performed usingthe Reynolds number calculated at reference conditions at thetransition onset location Re�Tr, R
2 � 0.70 before cleaning procedureimplementation and R2 � 0.86 subsequently.Transition onset measurements, the full details of which were
described by Jewell [26] and Jewell and Shepherd [43], were moreconsistent in experiments after the shock-tube cleaning proceduresdescribed in Sec. III were implemented (n � 34) than in those prior(n � 40). Reservoir temperatures were similar for each subset of thedata. The 34 tests after the implementation of the cleaning procedurehad calculated reservoir temperatures ranging from 3380 to 6410 K,with a median of 5520 K and a mean of 5490 K. The 40 tests beforethe implementation of the cleaning procedure had calculatedreservoir temperatures ranging from 4010 to 6930 K, with a medianof 5510 K and a mean of 5520 K.
VI. Conclusions
It was shown that an improved cleaning procedure in ahypervelocity shock tunnel improves the repeatability of transitionmeasurements, demonstrating the need for researchers using impulsefacilities for hypervelocity boundary-layer instability and transitionresearch to operate the facility in a manner least likely to introduceparticulate to the test flow.FLDI (boundary-layer density disturbances) and heat transfer
(surface-mounted heat transfer thermocouples) results were com-pared before and after a stringent cleaning regimenwas implemented.Before the implementation of the cleaning regimen, unpredictableturbulent spots were observed in both FLDI and thermocouple data atlocations uncharacteristic of natural transition; it is believed that it islikely these turbulent spots are the result of bypass transition initiatedby particulate striking the model surface.A statistical analysis of the correlation of tunnel parameters to
transition location indicates that the coefficient of determination wassignificantly increased after the implementation of the cleaningregimen. This increase in the coefficient of determination is consis-tent with more repeatable transition locations and flow quality. Thenew cleaning regimen makes it possible to systematically charac-terize transition locations on the test article in a repeatable manner bycarefully selecting run conditions.R2 values forReTr,Re
�Tr, and theN
factor increase significantly with the introduction of a more stringentcleaning procedure. This ability to repeat transition locations
Table 2 Multivariable linear regression analyses with ReTr(R2 � 0.50) and Re�Tr (R
2 � 0.70) as the response variables for“dirty” tunnel results (n � 40) acquired before the
implementation of the new cleaning regimena
ReTr Re�TrReintercept 5.90 × 10⁵ −1.38 × 10⁶b
p value 0.37394 0.00834Standard error 6.55 × 10⁵ 4.95 × 10⁵
CPres4.82 × 104b 3.54 × 10⁴b
p value 2.18 × 10⁻⁴ 2.99 × 10⁻⁴
Standard error 1.18 × 10⁴ 8.87 × 10³
Chres 9.18 × 10⁵ 2.98 × 10⁵b
p value 0.34578 2.12 × 10⁻⁴
Standard error 9.61 × 10⁴ 7.26 × 10⁴
Model F statistic 18.4 43.4Model p value 2.82 × 10⁻⁶ 1.99 × 10⁻¹⁰
aWe use a significance level of 5% (i.e., requiring a p value less than 0.05 to
reject the null hypothesis that a given coefficient is zero).bCoefficients found to be statistically significant under this criterion.
Table 3 Multivariable linear regression analyses withReTr (R
2 � 0.80) and Re�Tr (R2 � 0.86) as the response
variables for “clean” tunnel results (n � 34) acquiredafter the implementation of the new cleaning regimen
ReTr Re�TrReintercept 1.83 × 10⁶ a −1.08 × 10⁵
p value 6.86 × 10⁻⁵ 0.73991Standard error 3.99 × 10⁵ 3.23 × 10⁵
CPres7.20 × 104 a 3.54 × 10⁴ a
p value 2.30 × 10⁻¹⁰ 1.29 × 10⁻⁹
Standard error 7.84 × 10³ 6.34 × 10³
Chres −2.01 × 10⁵ a 3.39 × 10⁴
p value 0.00718 0.55180Standard error 6.97 × 10⁴ 5.64 × 10⁴
Model F statistic 61.9 95.1Model p value 1.49 × 10⁻¹¹ 5.94 × 10⁻¹⁴
aCoefficients found to be statistically significant (p < 0.05).
Article in Advance / TECHNICAL NOTES 5
facilitates fundamental hypervelocity boundary-layer stability andtransition research.The measurement of the time and size distribution of particulate
matter in shock tunnel experiments warrants further study, and itcould aid in future experimental–computational comparisons.
Acknowledgments
This work was an activity that was part of the National Center forHypersonic Laminar-Turbulent Research, sponsored by the“Integrated Theoretical, Computational, and Experimental Studiesfor Transition Estimation andControl” project, supported by theU.S.Air Force Office of Scientific Research and NASA (FA9552-09-1-0341). Additionally, this work was part of the “Transition Delay inHypervelocity Boundary Layers byMeans ofCO2/Acoustic Interac-tions” project, sponsored by the U.S. Air Force Office of ScientificResearch (FA9550-10-1-0491). J. S. Jewell received additional sup-port from the National Defense Science and Engineering GraduateFellowship, the Jack Kent Cooke Foundation, and the NationalResearch Council Research Associateship. The authors would like tothank Bahram Valiferdowsi (California Institute of Technology) forhelp running T5, Ross Wagnild (Sandia National Laboratories) forhelp with the program to compute the run conditions, and ElizabethJewell (University of Michigan) for statistical advice.
References
[1] Bushnell, D., “Notes on Initial Disturbance Fields for the TransitionProblem,” Instability and Transition, edited by Hussaini, M., and Voigt,R., ICASE/NASA LaRC Series, Springer, New York, 1990, pp. 217–232.
[2] Schneider, S. P., “Effects of High-Speed Tunnel Noise on Laminar-Turbulent Transition,” Journal of Spacecraft and Rockets, Vol. 38,No. 3, 2001, pp. 323–333.doi:10.2514/2.3705
[3] Schneider, S. P., “Hypersonic Laminar-Turbulent Transition on CircularCones and Scramjet Forebodies,” Progress in Aerospace Sciences,Vol. 40, Nos. 1–2, 2004, pp. 1–50.doi:10.1016/j.paerosci.2003.11.001
[4] Schneider, S. P., “Development of Hypersonic Quiet Tunnels,” Journalof Spacecraft and Rockets, Vol. 45, No. 4, 2008, pp. 641–664.doi:10.2514/1.34489
[5] Hofferth, J. W., Humble, R. A., Floryan, D. C., and Saric, W. S., “High-Bandwidth Optical Measurements of the Second-Mode Instability in aMach 6 Quiet Tunnel,” 51st AIAA Aerospace Sciences Meeting
Including the New Horizons Forum and Aerospace Exposition, AIAAPaper 2013-0378, 2013.
[6] Kocian, T. S., Perez, E., Oliviero, N. B., Kuehl, J. J., and Reed, H. L.,“Hypersonic Stability Analysis of a Flared Cone,” 51st AIAA Aerospace
Sciences Meeting Including the New Horizons Forum and Aerospace
Exposition, AIAA Paper 2013-0667, 2013.[7] Stetson, K. F., and Rushton, G. H., “Shock Tunnel Investigation of
Boundary-Layer Transition at M � 5.5,” AIAA Journal, Vol. 5, No. 5,1967, pp. 899–906.doi:10.2514/3.4098
[8] Mee, D. J., “Boundary-Layer Transition Measurements in Hyper-velocity Flows in a Shock Tunnel,” AIAA Journal, Vol. 40, No. 8, 2002,pp. 1542–1548.doi:10.2514/2.1851
[9] Holden, M. S., Wadhams, T. P., and Candler, G. V., “ExperimentalStudies in the LENS Shock Tunnel and Expansion Tunnel to ExamineReal-Gas Effects in Hypervelocity Flows,” 42nd AIAA Aerospace
Sciences Meeting and Exhibit, AIAA Paper 2004-0916, 2004.[10] Wadhams, T. P., Mundy, E., MacLean, M. G., and Holden, M. S.,
“Ground Test Studies of the HIFIRE-1 Transition Experiment, Part 1:Experimental Results,” Journal of Spacecraft and Rockets, Vol. 45,No. 6, 2008, pp. 1134–1148.doi:10.2514/1.38338
[11] MacLean,M.,Wadhams,T.,Holden,M., and Johnson,H., “GroundTestStudies of the HIFiRE-1 Transition Experiment, Part 2: ComputationalAnalysis,” Journal of Spacecraft and Rockets, Vol. 45, No. 6, 2008,pp. 1149–1164.doi:10.2514/1.37693
[12] Tanno, H., Komura, T., Sato, K., Itoh, K., Takahashi, M., and Fujii, K.,“Measurements of Hypersonic Boundary Layer Transition on ConeModels in the Free-Piston Shock Tunnel HIEST,” 47th AIAA Aerospace
Sciences Meeting Including the New Horizons Forum and Aerospace
Exposition, AIAA Paper 2009-0781, 2009.[13] Fujii, K., Noriaki, H., Tadao, K., Shoichi, T., Muneyoshi, N., Yukihiro,
I., Akihiro, N., and Hiroshi, O., “AMeasurement of Instability Wave inthe Hypersonic Boundary Layer on a Sharp Cone,” 41st AIAA Fluid
Dynamics Conference and Exhibit, AIAA Paper 2011-3871, 2011.[14] Laurence, S. J., Wagner, A., Hannemann, K., Wartemann, V., Lüdeke,
H., Tanno, H., and Itoh, K., “Time-Resolved Visualization of InstabilityWaves in a Hypersonic Boundary Layer,” AIAA Journal, Vol. 50, No. 1,2012, pp. 243–246.doi:10.2514/1.J051112
[15] Laurence, S., Wagner, A., and Hannemann, K., “Schlieren-BasedTechniques for Investigating Instability Development and Transition ina Hypersonic Boundary Layer,” Experiments in Fluids, Vol. 55, No. 8,2014, Paper 1782.doi:10.1007/s00348-014-1782-9
[16] Laurence, S. J., Wagner, A., Ozawa, H., Schramm, J. M., andHannemann, K., “Visualization of a Hypersonic Boundary-LayerTransition on a Slender Cone,” 19th AIAA International Space Planes
and Hypersonic Systems and Technologies Conference, AIAA Paper2014-3110, 2014.
[17] Germain, P. D., and Hornung, H. G., “Transition on a Slender Cone inHypervelocity Flow,” Experiments in Fluids, Vol. 22, No. 3, 1997,pp. 183–190.doi:10.1007/s003480050036
[18] Adam, P. H., and Hornung, H. G., “Enthalpy Effects on HypervelocityBoundary-Layer Transition: Ground Test and Flight Data,” Journal ofSpacecraft and Rockets, Vol. 34, No. 5, 1997, pp. 614–619.doi:10.2514/2.3278
[19] Rasheed, A., Hornung, H. G., Fedorov, A. V., and Malmuth, N. D.,“Experiments on PassiveHypervelocity Boundary-Layer ControlUsingan Ultrasonically Absorptive Surface,” AIAA Journal, Vol. 40, No. 3,March 2002, pp. 481–489.doi:10.2514/2.1671
[20] Jewell, J. S.,Wagnild, R.M., Leyva, I. A., Candler, G. V., and Shepherd,J. E., “TransitionWithin aHypervelocityBoundaryLayer on a 5-DegreeHalf-Angle Cone inAir∕CO2 Mixtures,” 51st AIAAAerospace Sciences
Meeting Including the NewHorizons Forum andAerospace Exposition,AIAA Paper 2013-0523, 2013.
[21] Parziale, N. J., Shepherd, J. E., and Hornung, H. G., “DifferentialInterferometric Measurement of Instability in a Hypervelocity Bound-ary Layer,” AIAA Journal, Vol. 51, No. 3, 2013, pp. 750–754.doi:10.2514/1.J052013
[22] Fedorov, A. V., “Receptivity of a Supersonic Boundary Layer toSolid Particulates,” Journal of Fluid Mechanics, Vol. 737, Dec. 2013,pp. 105–131.doi:10.1017/jfm.2013.564
[23] Jewell, J. S., Parziale, N. J., Leyva, I. A., Shepherd, J. E., and Hornung,H. G., “Turbulent Spot Observations Within a Hypervelocity BoundaryLayer on a 5-Degree Half-Angle Cone,” 42nd AIAA Fluid Dynamics
Conference and Exhibit, AIAA Paper 2012-3062, 2012.[24] Parziale, N. J., “Slender-BodyHypervelocity Boundary-Layer Instability,”
Ph.D. Thesis, California Inst. of Technology, Pasadena, CA, 2013.[25] Parziale, N. J., Shepherd, J. E., and Hornung, H. G., “Free-Stream
Density Perturbations in a Reflected-Shock Tunnel,” Experiments in
Fluids, Vol. 55, No. 2, 2014, pp. 1–10.doi:10.1007/s00348-014-1665-0
[26] Jewell, J. S., “Boundary-Layer Transition on a Slender Cone inHypervelocity Flow with Real Gas Effects,” Ph.D. Thesis, CaliforniaInst. of Technology, Pasadena, CA, 2014.
[27] Parziale, N. J., Shepherd, J. E., and Hornung, H. G., “Observations ofHypervelocity Boundary-Layer Instability,” Journal of Fluid
Mechanics, Vol. 781, Oct. 2015, pp. 87–112.doi:10.1017/jfm.2015.489
[28] Gronvall, J. E., Johnson, H. B., and Candler, G. V., “Boundary-LayerStability Analysis of High Enthalpy Shock Tunnel TransitionExperiments,” Journal of Spacecraft and Rockets, Vol. 51, No. 2,2014, pp. 455–467.doi:10.2514/1.A32577
[29] Hornung, H. G., “Performance Data of the New Free-Piston ShockTunnel at GALCIT,” 17th AIAAAerospaceGround TestingConference,AIAA Paper 1992-3943, 1992.
[30] Goodwin, D. G., “An Open-Source, Extensible Software Suitefor CVD Process Simulation,” Proceedings of CVD XVI and EuroCVD
Fourteen, edited by Allendorf, M., Maury, F., and Teyssandier, F., TheElectrochemical Soc., Inc., Pennington, NJ, 2003, pp. 155–162.
[31] Browne, S., Ziegler, J., and Shepherd, J. E., “Numerical SolutionMethods for Shock and Detonation Jump Conditions,” California Inst.of Technology GALCIT-TR-FM2006.006, Pasadena, CA, 2006.
6 Article in Advance / TECHNICAL NOTES
[32] Gordon, S., and McBride, B., “Thermodynamic Data to 20000 K forMonatomic Gases,” NASA Rept. TP-1999-208523, 1999.
[33] McBride, B. J., Zehe,M. J., and Gordon, S., “NASAGlenn Coefficientsfor Calculating Thermodynamic Properties of Individual Species,”NASA Rept. TP-2002-211556, 2002.
[34] Johnson, H. B., “Thermochemical Interactions in Hypersonic BoundaryLayerStability,”Ph.D.Thesis,Univ. ofMinnesota,Minneapolis,MN,2000.
[35] Johnson, H. B., Seipp, T. G., and Candler, G. V., “Numerical Study ofHypersonic Reacting Boundary Layer Transition on Cones,” Physics ofFluids, Vol. 10, No. 10, 1998, pp. 2676–2685.doi:10.1063/1.869781
[36] Wagnild, R. M., “High Enthalpy Effects on Two Boundary LayerDisturbances in Supersonic and Hypersonic Flow,” Ph.D. Thesis, Univ.of Minnesota, Minneapolis, MN, 2012.
[37] Taylor, J. R., and Hornung, H. G., “Real Gas and Wall RoughnessEffects on the Bifurcation of the ShockReflected from the EndWall of aTube,” Shock Tubes and Shock Waves: Proceedings of the 13th
International Symposium on Shock Waves, State Univ. of New YorkPress, Albany, NY, 1981, pp. 262–270.
[38] Davies, L., and Wilson, J. L., “Influence of Reflected Shock andBoundary-Layer Interaction on Shock-Tube Flows,” Physics of Fluids,Vol. 12, No. 5, 1969, Paper I-37.doi:10.1063/1.1692625
[39] Smeets,G., “Laser Interferometer forHighSensitivityMeasurements onTransient Phase Objects,” IEEE Transactions on Aerospace and
Electronic Systems, Vol. AES-8, No. 2, 1972, pp. 186–190.doi:10.1109/TAES.1972.309488
[40] Wilkinson, S. P., Anders, S. G., Chen, F.-J., and Beckwith, I. E.,“Supersonic and Hypersonic Quiet Tunnel Technology at NASALangley,” 17th Aerospace Ground Testing Conference, AIAA Paper1992-3908, 1992.
[41] Sanderson, S. R., “ShockWave Interaction in Hypervelocity Flow,” Ph.D. Thesis, California Inst. of Technology, Pasadena, CA, 1995.
[42] Sanderson, S. R., and Sturtevant, B., “TransientHeat FluxMeasurementUsing a Surface Junction Thermocouple,” Review of Scientific
Instruments, Vol. 73, No. 7, 2002, pp. 2781–2787.doi:10.1063/1.1484255
[43] Jewell, J. S., and Shepherd, J. E., “T5 Conditions Report: Shots 2526–2823,” California Inst. of Technology, GALCIT TR FM2014.002,Pasadena, CA, June 2014.
[44] Draper, N. R., and Smith, H., Applied Regression Analysis, John Wiley& Sons, London, 1998.
[45] “Matlab v. 8.1.0.604 (R2013a), Linear Model Documentation Page,”MathWorks, Natick, MA, 2013.
[46] Jewell, J. S., Shepherd, J. E., and Leyva, I. A., “Shock Tunnel Operationand Correlation of Boundary Layer Transition on a Cone inHypervelocity Flow,”Proceedings of the 29th International Symposiumon ShockWaves, Springer International, Cham, Switzerland, July 2013,pp. 723–728.
A. NaguibAssociate Editor
Article in Advance / TECHNICAL NOTES 7