effects of rust deposition at the axial seal pin …
TRANSCRIPT

The Pennsylvania State University
The Graduate School
Department of Mechanical and Nuclear Engineering
EFFECTS OF RUST DEPOSITION AT THE
AXIAL SEAL PIN BETWEEN TWO BLADES
A Thesis in
Mechanical Engineering
by
Duane L. Breneman
© 2011 by Duane L. Breneman
Submitted in Partial Fulfillment
of the Requirements
for the Degree of
Master of Science
December 2011
ii
The thesis of Duane L. Breneman was reviewed and approved* by the following:
Karen A. Thole
Head of the Department of Mechanical and Nuclear Engineering
Professor of Mechanical Engineering
Thesis Advisor
Daniel C. Haworth
Professor-In-Charge of MNE Graduate Programs
Professor of Mechanical Engineering
Horacio Perez-Blanco
Professor of Mechanical Engineering
*Signatures are on file in the Graduate School.

iii
ABSTRACT
Rust deposits in the gap associated with the axial seal pin between two turbine blades
can inhibit the vibration dampening of the pin, which can ultimately result in premature failure of
components. This study investigated mechanisms leading to rust deposition in the axial seal pin
between two blades. An initial particle characterization study revealed that one of the
dominating effects on rust deposition is centrifugal forces. Rotation compacts rust particles
significantly, doubling their bulk density when spun at engine representative forces. Static and
rotating test facilities were developed to flow compressed air and particles through full-scale
engine hardware and test coupons representative of the axial seal pin geometry. Rust was
injected at ambient temperatures and engine-realistic pressure ratios. Reductions in flow were
measured to be as high as 74%. In static tests, increasing the pressure ratio increased flow
blockage for a given rust amount, whereas in rotating tests, flow blockage was independent of
pressure ratio. The amount of blockage was highly sensitive to the geometry of associated area
near the axial seal pin particularly under rotating conditions.

iv
TABLE OF CONTENTS
LIST OF TABLES ......................................................................................................................... vi LIST OF FIGURES ...................................................................................................................... vii ACKNOWLEDGEMENTS ............................................................................................................ x NOMENCLATURE ...................................................................................................................... xi Chapter 1. INTRODUCTION .................................................................................................... 1
Chapter 2. RELEVANT PAST STUDIES ................................................................................. 3 2.1 Mechanisms for Particle Delivery and Deposition .......................................................... 3 2.2 Previous Gas Turbine Deposition Studies ........................................................................ 3 2.3 Uniqueness of the Present Study ...................................................................................... 7
Chapter 3. EXPERIMENTAL FACILITY AND METHODOLOGY ....................................... 9
3.1 Creation of Representative Particle Samples ................................................................... 9
3.2 Particle Heating Tests and Procedures ........................................................................... 12
3.3 Particle Centrifuge Tests and Procedures....................................................................... 15 3.4 Test Facilities ................................................................................................................. 17
3.5 Description of Engine Hardware and Flow Area ........................................................... 25 3.6 Description of Rotating Test Coupons ........................................................................... 30
3.7 Data Analysis ................................................................................................................. 34 3.8 Procedure for Static Tests .............................................................................................. 41 3.9 Procedure for Rotating Tests .......................................................................................... 44
3.10 Comparison of Static Baseline and Predicted Flow Functions................................... 46 3.11 Comparison of Static and Rotating Baseline Flow Functions .................................... 52
3.12 Derivation of Test Matrices ........................................................................................ 53 3.13 Uncertainty Analysis .................................................................................................. 56
Chapter 4. RESULTS FROM STATIC TESTS ....................................................................... 58 4.1 Effect of Heating ............................................................................................................ 58
4.2 Effect of Centrifugal Forces ........................................................................................... 62 4.3 Effect of Rust Injection on Engine Hardware ................................................................ 64
Chapter 5. RESULTS FROM ROTATING TESTS ................................................................. 79
5.1 Rust Deposition .............................................................................................................. 79
5.2 Flow Blockage................................................................................................................ 84 Chapter 6. CONCLUSIONS..................................................................................................... 88 REFERENCES ............................................................................................................................. 91 Appendix A. CALCULATIONS FOR STATIC TESTS ............................................................. 94
Nomenclature ............................................................................................................................ 94
Flow Function Calculation ........................................................................................................ 94 Blockage Calculation ................................................................................................................ 96
References ................................................................................................................................. 97 Appendix B. CALCULATIONS FOR ROTATING TESTS ...................................................... 98
Nomenclature ............................................................................................................................ 98 Overview ................................................................................................................................... 98 Chamber Differential Pressure Correction ................................................................................ 99
Appendix C. UNCERTAINTY ANALYSIS FOR STATIC TESTS ........................................ 102 Nomenclature .......................................................................................................................... 102 Flow Function Uncertainty ..................................................................................................... 102

v
Reduction in Flow Function Uncertainty ................................................................................ 105
References ............................................................................................................................... 107 Appendix D. UNCERTAINTY ANALYSIS FOR ROTATING TESTS .................................. 108
Nomenclature .......................................................................................................................... 108
Flow Function Uncertainty ..................................................................................................... 109 Reduction in Flow Function Uncertainty ................................................................................ 113 References ............................................................................................................................... 113
Appendix E. ENGINEERING DRAWINGS ............................................................................. 114

vi
LIST OF TABLES
Table 3.1. Elemental Compositions of Turbine Samples and Representative Laboratory Particle
Mixtures ........................................................................................................................................ 10 Table 3.2. Metal Oxide Mixture 5 Composition .......................................................................... 10 Table 3.3. Elemental Compositions of Samples from Field-Run Blade ...................................... 12 Table 3.4. Particle Heating Test Matrix ....................................................................................... 13
Table 3.5. Particle Centrifuging Test Matrix ............................................................................... 16 Table 3.6. Static Test Facility Cross-sectional Flow Areas ......................................................... 18 Table 3.7. Centrifugal Acceleration in Engine and Rotating Test Facility .................................. 21 Table 3.8. Surface Finishes of Engine Hardware and Plunge-EDM Samples ............................. 34 Table 3.13. Test Matrix for Static Tests ...................................................................................... 54
Table 3.14. Test Matrix for Rotating Tests .................................................................................. 55
Table 3.15. Parameter Nominal Values and Uncertainties for Static Tests ................................. 56
Table 3.16. Parameter Nominal Values and Uncertainties for Tests at Ω = 0.002 ...................... 57 Table 3.17. Parameter Nominal Values and Uncertainties for Tests at Ω = 1 ............................. 57
Table 4.1. Particle Heating Tests for Samples of Various Compositions .................................... 59 Table 4.2. Particle Heating Tests for Engine Representative Compositions ............................... 60
Table 4.3. Particle Centrifuging Tests ......................................................................................... 63

vii
LIST OF FIGURES
Figure 1.1. Two adjacent turbine blades with air leakage at the axial seal pin. ............................ 2 Figure 3.1. The mixture 5 size distribution included the range of particle sizes found in Payne
Creek CT1. .................................................................................................................................... 11 Figure 3.2. Particle sample locations on the field-run blade........................................................ 12 Figure 3.3. Comparison of particle composition before and after heating in the kiln. ................ 14
Figure 3.4. Metal oxide particles shown while being heated in the kiln. .................................... 15 Figure 3.5. Metal oxide particles shown after being heated in the kiln and cooling to room
temperature (same samples as in Figure 3.4). ............................................................................... 15 Figure 3.6. Centrifuge tube containing a particle sample. ........................................................... 16 Figure 3.7. A schematic of the static test facility used for rust injection studies......................... 17
Figure 3.8. The static test chamber was designed to contain two turbine blades in a configuration
representative of their positions in an engine rotor. ...................................................................... 19
Figure 3.9. A schematic of the rotating test facility used for rust injection studies..................... 21 Figure 3.10. Top view of rotating chamber with lid removed. .................................................... 24
Figure 3.11. Particle diffuser plate position relative to test coupon. ........................................... 24 Figure 3.12. Two blades from the first row of a land-based gas turbine engine. ........................ 26
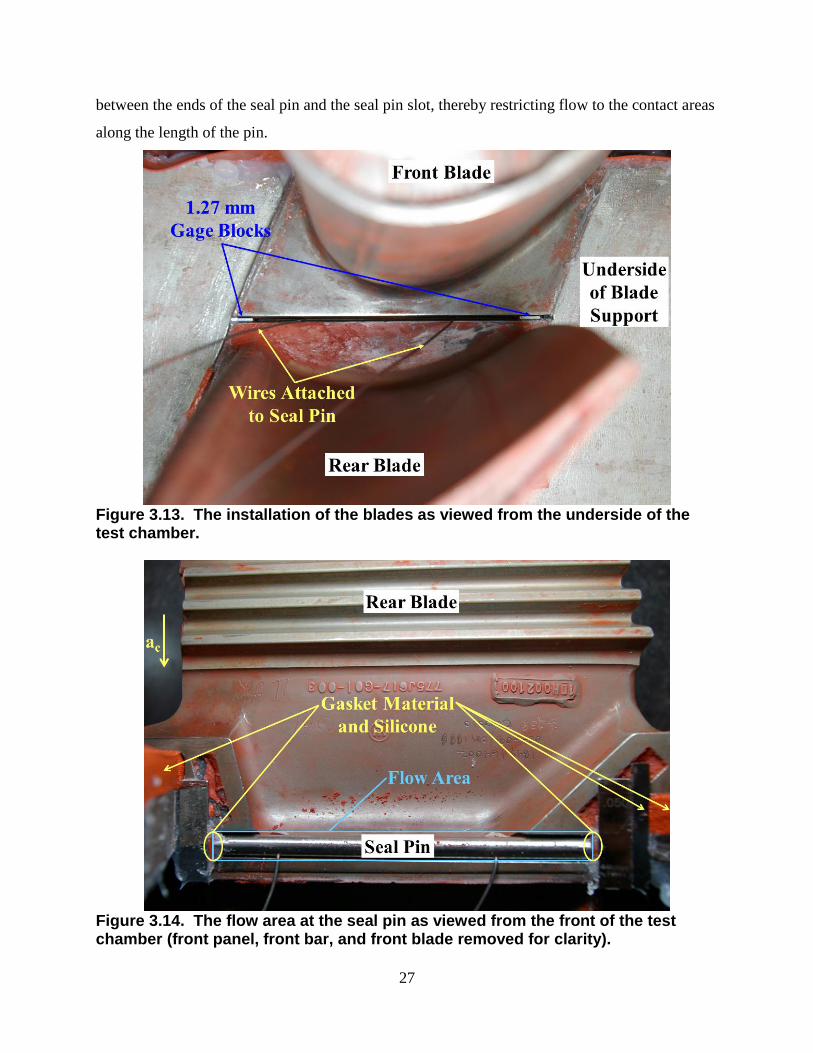
Figure 3.13. The installation of the blades as viewed from the underside of the test chamber. .. 27 Figure 3.14. The flow area at the seal pin as viewed from the front of the test chamber (front
panel, front bar, and front blade removed for clarity). .................................................................. 27
Figure 3.15. The seal pin clearance consisted of two clearance gaps between the seal pin and
rear and front blade platforms (side cross-sectional view). .......................................................... 28
Figure 3.16. Data from multiple test chamber assemblies were compared to show consistency in
the flow area. ................................................................................................................................. 29
Figure 3.17. The section of the engine hardware used to create the rotating test coupon
(dimensions in mm). ..................................................................................................................... 30
Figure 3.18. Coupon 1 had a lip near the seal pin contact area, while coupon 2 had the lip
removed for a smooth transition. .................................................................................................. 32 Figure 3.19. Three-dimensional optical profilometry surface plot for engine hardware. ............ 33
Figure 3.20. Three-dimensional optical profilometry surface plot for plunge-EDM sample 4. .. 33
Figure 3.21. The seal pin flow area may be approximated as a nozzle downstream of a large
reservoir. ....................................................................................................................................... 35 Figure 3.22. The predicted flow function versus pressure ratio curve for the assumed seal pin
flow area and discharge coefficient. ............................................................................................. 39 Figure 3.23. Baseline flow function for clean engine hardware. ................................................. 41
Figure 3.24. Blocked flow conditions reached steady values shortly after injecting rust particles
(shown for rust mass of 0.23 g). ................................................................................................... 43
Figure 3.25. Blockage was measured in terms of a reduction in flow function evaluated at the
blocked pressure ratio (zoomed view shown). .............................................................................. 44 Figure 3.26. Flow function for flow through a single coupon 1 at Ω = 0.002. ............................ 45 Figure 3.27. Baseline flow functions for coupons 1 and 2 at Ω = 0.002 and Ω = 1 with three
identical coupons open to flow. .................................................................................................... 46
Figure 3.28. Predicted flow function and experimental curve fit flow function for clean engine
hardware, static tests. .................................................................................................................... 47

viii
Figure 3.29. The ratio of experimental to predicted flow functions varied with pressure ratio for
the static tests. ............................................................................................................................... 48 Figure 3.30. Flow of gas through a nozzle with a non-ideal entrance condition; low and high
pressure ratio cases [28]. ............................................................................................................... 49
Figure 3.31. Effective seal pin flow area as a function of pressure ratio for engine hardware. .. 52 Figure 3.32. Comparison of scaled rotating coupon flow function with full-scale static engine
hardware. ....................................................................................................................................... 53 Figure 4.1. Metal oxide particles shown initially and at various temperatures during heating
(Sample numbers correspond to test numbers in Table 4.1.). ....................................................... 59
Figure 4.2. Visual comparison of unheated mixture 5 particles (left) with particles heated to
850°C (right), scale in inches. ....................................................................................................... 61 Figure 4.3. Size distributions for unheated and heated particles. Particle size tests were
performed at ambient conditions following heating. .................................................................... 62
Figure 4.4. Size distributions for particles heated for varying lengths time. ............................... 62 Figure 4.5. Centrifuged particles shown before and after removal from the centrifuge tube. ..... 64
Figure 4.6. Rust deposits on the rear face of the front blade after injecting 0.23 g of rust. ......... 65 Figure 4.7. Rust deposits on the front face of the rear blade after injecting 0.23 g of rust; shown
after removing the seal pin. ........................................................................................................... 65 Figure 4.8. Blockage versus injected rust mass for three pressure ratios. ................................... 66 Figure 4.9. Blockage versus rust mass to air mass flow rate ratio for three pressure ratios. ....... 67
Figure 4.10. Comparison of single-quantity and cumulative rust injection tests performed at a
pressure ratio of 1.15..................................................................................................................... 68
Figure 4.11. Blockage versus pressure ratio for various injected rust masses. ............................ 69 Figure 4.12. Larger particles deposited upstream of the seal pin in the large flow area between
the seal pin and the root. ............................................................................................................... 71
Figure 4.13. Very small particles deposited at the narrowest flow area where the seal pin
contacted the front blade. .............................................................................................................. 71 Figure 4.14. Deposition sample locations for ESEM particle size analysis. ............................... 72 Figure 4.15. ESEM images of rust particles at 500x magnification; sample numbers correspond
with labels in Figure 4.14.............................................................................................................. 73 Figure 4.16. An ESEM image divided into 9 cells with particles encircled for size analysis. .... 74
Figure 4.17. Histograms of particle sizes from deposition samples; sample numbers correspond
with locations given in Figure 4.14............................................................................................... 75
Figure 4.18. Test chamber positions for rust injection testing and disassembly. ........................ 76 Figure 4.19. Maximum blockage test for cumulative total rust injection of 5.3 g at a pressure
ratio of 1.15. .................................................................................................................................. 77 Figure 5.1. Rust deposition locations inside the rotating chamber. ............................................. 80 Figure 5.2. Rust deposition by location for coupon 1, PRrot = 1.6, Ω = 0.002. ........................... 80
Figure 5.3. Rust deposition by location for coupon 1, PRrot = 1.6, Ω = 1. .................................. 81 Figure 5.4. Rust deposition in coupon 1 after at test performed at Ω = 1, PRrot = 1.6 (outward
radial view). .................................................................................................................................. 81 Figure 5.5. Rust deposition in coupon 1 after tests performed at PRrot = 1.6 (scale in inches). .. 82 Figure 5.6. Rust deposition in coupon 2 after tests performed at PRrot = 1.6 (scalen in inches). 83 Figure 5.7. Rust deposition in coupon 1 after rust injection test at Ω = 1 compared with a blade
removed from field service (seal pins removed) [1]. .................................................................... 84 Figure 5.8. Flow blockage as a function of deposited rust mass, coupon 1, Ω = 0.002. ............. 85

ix
Figure 5.9. Flow blockage as a function of deposited rust mass, coupons 1 and 2, Ω = 0.002 and
Ω = 1, PRrot = 1.6. ......................................................................................................................... 86 Figure 5.10. Coupon 1 before and after removal of rust deposited on trailing contoured surface.
....................................................................................................................................................... 87
Figure 6.1. Original blade platform design and proposed modification. ..................................... 90

x
ACKNOWLEDGEMENTS
There are many individuals who made the work presented in this thesis possible. First
and foremost, I want thank my advisor, Karen, for all of her efforts in providing this research
opportunity and for supporting me through the graduate program. Her technical expertise and
optimism were invaluable as we worked through research challenges together. I am also
especially grateful to Mike, our research associate, for his technical advice and support. It was a
pleasure working with so many great lab mates. Robert, Jason, Seth, Alan, Molly, Steve L.,
Greg, Steve W., Nick, Amy, Jeff, Ken, and Katie – I will miss working with you all. I will
especially miss running with Robert, Jason, Seth, and Greg. I want to credit Phil and the folks at
Engineering Shop Services for all of their skilled machining work on this project. I am also
grateful to our undergraduate assistants, Brian and Chris, for their help. Finally, I want to thank
Siemens Energy for providing funding for this work. It was a pleasure working with Vince and
Kok-Mun, the project monitors.
Many people also supported me in a relational sense throughout this project. I am
extremely grateful to my wife, Stephanie, for her love and encouragement as she walked along
side me through graduate school. I am thankful for my parents’ unwavering care and support.
My brother, Kyle, and sister-in-law Danielle encouraged me many times through their phone
calls and emails. I am grateful for the listening ear I often found in my friend Jim Charles. I am
also thankful for many friends who made State College a brighter place with their hospitality and
friendship. I was especially blessed through friendships with Robert and Ariel, Eric and Ruth,
Luke and Hannah, Kiron and Rachel, and the people of University Mennonite Church. Finally, I
give thanks to God for His love and gift of salvation. The peace and hope available through His
son Jesus Christ sustains eternally.
xi
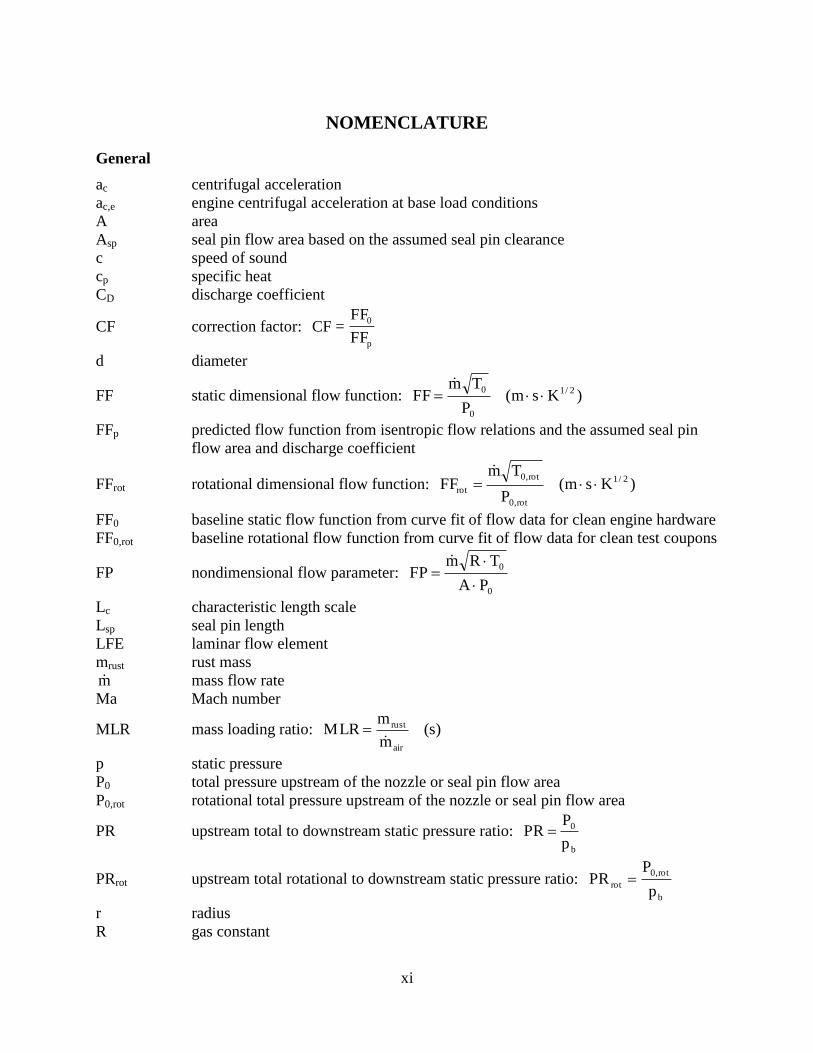
NOMENCLATURE
General
ac centrifugal acceleration
ac,e engine centrifugal acceleration at base load conditions
A area
Asp seal pin flow area based on the assumed seal pin clearance
c speed of sound
cp specific heat
CD discharge coefficient
CF correction factor: p
0
FF
FF=CF
d diameter
FF static dimensional flow function: )Ksm(P
TmFF 2/1
0
0
FFp predicted flow function from isentropic flow relations and the assumed seal pin
flow area and discharge coefficient
FFrot rotational dimensional flow function: )Ksm(P
TmFF 2/1
rot,0
rot,0
rot
FF0 baseline static flow function from curve fit of flow data for clean engine hardware
FF0,rot baseline rotational flow function from curve fit of flow data for clean test coupons
FP nondimensional flow parameter: 0
0
PA
TRmFP
Lc characteristic length scale
Lsp seal pin length
LFE laminar flow element
mrust rust mass
m mass flow rate
Ma Mach number
MLR mass loading ratio: )s(m
mMLR
air
rust
p static pressure
P0 total pressure upstream of the nozzle or seal pin flow area
P0,rot rotational total pressure upstream of the nozzle or seal pin flow area
PR upstream total to downstream static pressure ratio: b
0
p
PPR
PRrot upstream total rotational to downstream static pressure ratio: b
rot,0
rotp
PPR
r radius
R gas constant

xii
Rq root-mean-square average surface height relative to the mean
Re Reynolds number
RFF reduction in flow function evaluated at blocked pressure ratio:
PR0FF
FF1RFF
Stk Stokes number: f
pStk
T temperature
T0 total temperature upstream of the nozzle or seal pin flow area
Trot rotational temperature
T0,rot rotational total temperature upstream of the nozzle or seal pin flow area
tsp assumed seal pin clearance for one-dimensional analysis
v velocity
Greek
γ ratio of specific heats
µ dynamic viscosity
ρ density
ρl bulk density before centrifuging
ρc bulk density after centrifuging
τ time scale
ω rotating speed
Ω centrifugal acceleration relative to engine: e,c
c
a
a
Subscripts
b evaluated downstream of the nozzle or seal pin flow area
f fluid
p particle
r radial component
th evaluated at the nozzle throat or seal pin flow area
1
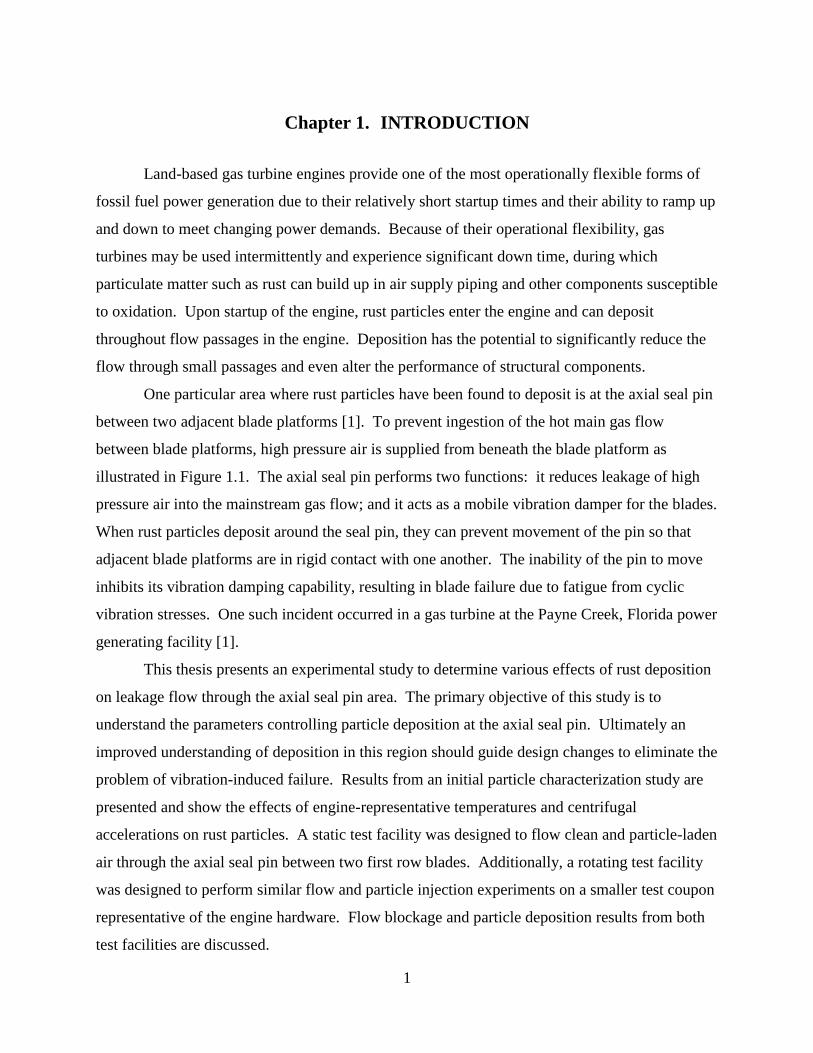
Chapter 1. INTRODUCTION
Land-based gas turbine engines provide one of the most operationally flexible forms of
fossil fuel power generation due to their relatively short startup times and their ability to ramp up
and down to meet changing power demands. Because of their operational flexibility, gas
turbines may be used intermittently and experience significant down time, during which
particulate matter such as rust can build up in air supply piping and other components susceptible
to oxidation. Upon startup of the engine, rust particles enter the engine and can deposit
throughout flow passages in the engine. Deposition has the potential to significantly reduce the
flow through small passages and even alter the performance of structural components.
One particular area where rust particles have been found to deposit is at the axial seal pin
between two adjacent blade platforms [1]. To prevent ingestion of the hot main gas flow
between blade platforms, high pressure air is supplied from beneath the blade platform as
illustrated in Figure 1.1. The axial seal pin performs two functions: it reduces leakage of high
pressure air into the mainstream gas flow; and it acts as a mobile vibration damper for the blades.
When rust particles deposit around the seal pin, they can prevent movement of the pin so that
adjacent blade platforms are in rigid contact with one another. The inability of the pin to move
inhibits its vibration damping capability, resulting in blade failure due to fatigue from cyclic
vibration stresses. One such incident occurred in a gas turbine at the Payne Creek, Florida power
generating facility [1].
This thesis presents an experimental study to determine various effects of rust deposition
on leakage flow through the axial seal pin area. The primary objective of this study is to
understand the parameters controlling particle deposition at the axial seal pin. Ultimately an
improved understanding of deposition in this region should guide design changes to eliminate the
problem of vibration-induced failure. Results from an initial particle characterization study are
presented and show the effects of engine-representative temperatures and centrifugal
accelerations on rust particles. A static test facility was designed to flow clean and particle-laden
air through the axial seal pin between two first row blades. Additionally, a rotating test facility
was designed to perform similar flow and particle injection experiments on a smaller test coupon
representative of the engine hardware. Flow blockage and particle deposition results from both
test facilities are discussed.

2
Figure 1.1. Two adjacent turbine blades with air leakage at the axial seal pin.

3
Chapter 2. RELEVANT PAST STUDIES
Problems common to both aerospace and land-based gas turbines include erosion and
deposition due to particle ingestion, which have been the subject of many previous studies. In
propulsion turbines, where filtration is impractical due to size and weight restrictions, sand and
volcanic ash have caused severe engine component wear and engine shutdowns while flying
through particulate-laden clouds from volcanic eruptions [2-4]. Land-based engines face
problems such as cooling hole blockage due to ingestion of particles from piping, casings, and
rotor hardware and combustion of heavy oils and synthetic fuels. While land-based engines have
large filters upstream of the air intake, test results show that particles with sizes sufficient to
block cooling holes still enter the engine internal air system [5]. This chapter provides some
general background on mechanisms of deposition as well as a review of past deposition studies.
Finally, the uniqueness of the present study is discussed.
2.1 Mechanisms for Particle Delivery and Deposition
Since the focus of this study is on particle deposition, it is important to understand what
mechanisms cause particles to approach and adhere to a surface. For particles larger than 1 μm
moving as a disperse phase in a continuous medium, inertial effects are the dominant deposition
mechanism. As fluid velocity or particle size is increased, particles are less responsive to bends
in the flow streamlines, resulting in impaction with surfaces. Whether or not a particle adheres
to a surface depends in part on the particle size and velocity. Van der Waals forces become
important near a surface and drive particle adhesion. These forces are due to instantaneous
dipoles created from shifts in the electron clouds around atomic nuclei, and their attractive
strength is measured in terms of interaction energy. Very near a surface, the interaction energy
becomes infinite, resulting in deposition of small particles that come within one particle radius of
the surface [6]. Larger particles or particles with a high velocity may rebound if their inertia
exceeds the attractive van der Waals force. Particles investigated in this study were larger than 1
μm, so inertial effects were anticipated to dominate particle behavior.
2.2 Previous Gas Turbine Deposition Studies
Early studies of particle behavior in gas turbines focused on the effects of particles in the
main gas flow path with initial motivation provided by engine failures during encounters with
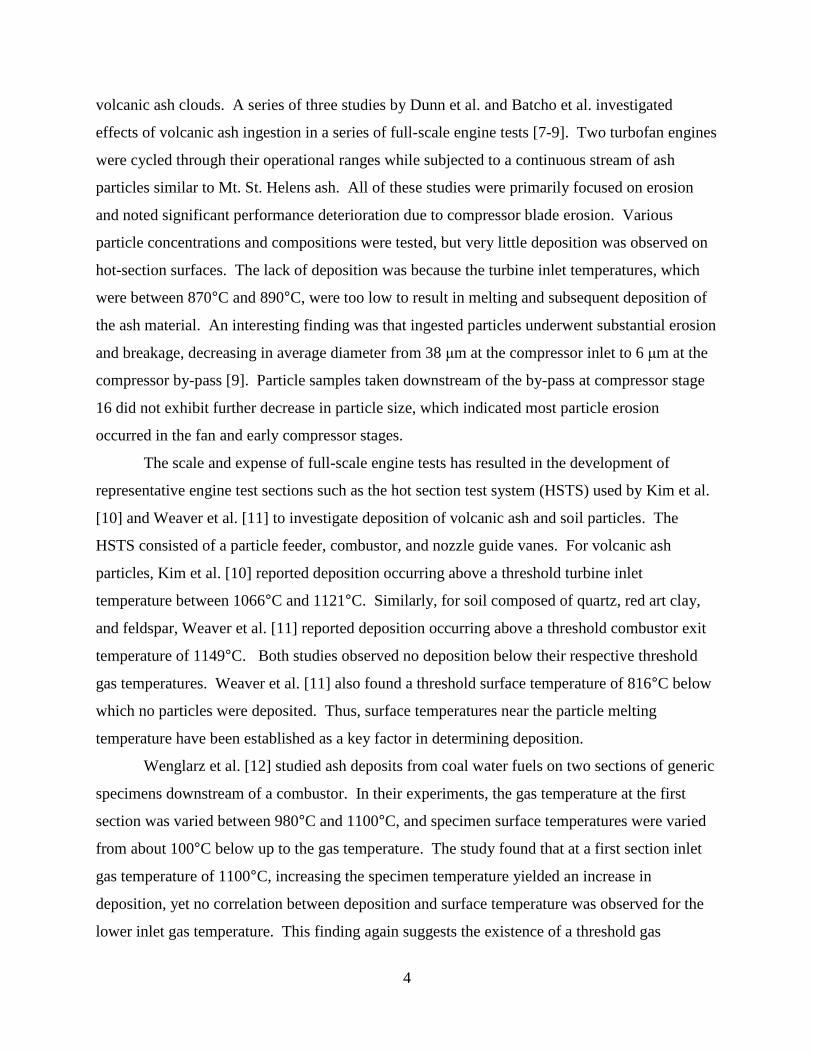
4
volcanic ash clouds. A series of three studies by Dunn et al. and Batcho et al. investigated
effects of volcanic ash ingestion in a series of full-scale engine tests [7-9]. Two turbofan engines
were cycled through their operational ranges while subjected to a continuous stream of ash
particles similar to Mt. St. Helens ash. All of these studies were primarily focused on erosion
and noted significant performance deterioration due to compressor blade erosion. Various
particle concentrations and compositions were tested, but very little deposition was observed on
hot-section surfaces. The lack of deposition was because the turbine inlet temperatures, which
were between 870°C and 890°C, were too low to result in melting and subsequent deposition of
the ash material. An interesting finding was that ingested particles underwent substantial erosion
and breakage, decreasing in average diameter from 38 μm at the compressor inlet to 6 μm at the
compressor by-pass [9]. Particle samples taken downstream of the by-pass at compressor stage
16 did not exhibit further decrease in particle size, which indicated most particle erosion
occurred in the fan and early compressor stages.
The scale and expense of full-scale engine tests has resulted in the development of
representative engine test sections such as the hot section test system (HSTS) used by Kim et al.
[10] and Weaver et al. [11] to investigate deposition of volcanic ash and soil particles. The
HSTS consisted of a particle feeder, combustor, and nozzle guide vanes. For volcanic ash
particles, Kim et al. [10] reported deposition occurring above a threshold turbine inlet
temperature between 1066°C and 1121°C. Similarly, for soil composed of quartz, red art clay,
and feldspar, Weaver et al. [11] reported deposition occurring above a threshold combustor exit
temperature of 1149°C. Both studies observed no deposition below their respective threshold
gas temperatures. Weaver et al. [11] also found a threshold surface temperature of 816°C below
which no particles were deposited. Thus, surface temperatures near the particle melting
temperature have been established as a key factor in determining deposition.
Wenglarz et al. [12] studied ash deposits from coal water fuels on two sections of generic
specimens downstream of a combustor. In their experiments, the gas temperature at the first
section was varied between 980°C and 1100°C, and specimen surface temperatures were varied
from about 100°C below up to the gas temperature. The study found that at a first section inlet
gas temperature of 1100°C, increasing the specimen temperature yielded an increase in
deposition, yet no correlation between deposition and surface temperature was observed for the
lower inlet gas temperature. This finding again suggests the existence of a threshold gas

5
temperature above which particles soften, thus promoting deposition. The authors noted a
reported ash fusion temperature of 1170°C from the ASTM cone test may overestimate the
particle softening temperature due to the testing method. In any case, both the gas and specimen
temperatures reported in this study were in the neighborhood of the particle softening
temperature.
To compare characteristics of deposition formed over several hours in an experimental
setting with deposition formed on actual engine components over thousands of operating hours,
Jensen et al. [13] created an accelerated deposition test facility. Their facility flowed particle-
laden gas at temperatures up to 1200˚C over test coupons representative of engine blade and
vane surfaces. Through a detailed chemical and structural analysis of deposits, Jensen et al. [13]
concluded their facility was able to create engine-representative depositions by matching total
particle mass loading to typical engine conditions. Their results also showed the existence of a
threshold deposition temperature between 900˚C and 1100˚C, but the authors cautioned this
result may have been specific to their test facility since actual turbine components experience
deposits with gas temperatures less than 900˚C.
In 2006, Hamed et al. [14] wrote a thorough review of past studies on erosion and
deposition, which includes some of those previously mentioned. Their review covers the effects
of temperature, particle size, particle composition, surface composition, impact velocity and
angle, and coefficient of restitution. Also, a discussion of deposition mechanisms is provided.
All of the studies covered in their review focused on particle effects in the compressor or turbine
main gas path.
Investigations of particle deposition in cooling flow paths are of particular relevance to
the present study. Walsh et al. [15] performed an early study of particle deposition in internal
film-cooling passages and developed a method for characterizing deposition in terms of flow
blockage. They injected masses of sand into flow through a test coupon and measured blockage
in terms of a reduction in dimensionless flow parameter at a particular pressure ratio. Tests were
performed on cylindrical test coupons representative of film cooling holes on the leading edge of
an airfoil. Several interesting results were found in these tests. After injecting a lump mass of
sand, a step decrease in flow parameter and a step increase in pressure ratio were observed.
Blockages up to 11% reduction in flow parameter (RFP) were measured, and blockage increased
for heated tests as compared with ambient temperature tests. For engine-representative coolant

6
and metal temperatures, blockage was shown to increase strongly with metal temperature, and a
dramatic increase in blockage was observed when metal temperature increased above about
1000°C. Blockage also decreased with increasing pressure ratio and increased with particle
diameter. Finally, blockage increased with the mass of sand injected for all pressure ratios.
Following the method by Walsh et al. [15], Land et al. [16] and Cardwell et al. [17]
investigated sand deposition and blockage in double-wall geometries with impingement- and
film-cooling holes similar to those found in the blade outer air seal and combustor liner. Their
double-wall test coupon had one wall of impingement-cooling holes angled at 90° to the surface
followed by a second wall of film-cooling holes set at a 30° angle to the surface. Sand particles
injected into the coupons were composed primarily of quartz (SiO2) and aluminum oxide (Al2O3)
with traces of other metal oxide compounds.
Land et al. [16] studied the effects of injected sand quantity, sand particle size, pressure
ratio, alignment of impingement- and film-cooling holes, and wall spacing. They measured
blockages ranging from 3% to 80% RFP. Blockage was shown to increase with the mass of sand
injected and with sand particle size, particularly for particles larger than 150 μm. An increase in
blockage with pressure ratio was observed for pressure ratios of 1.02 to 1.1 and was attributed to
particles depositing in the impingement-cooling holes. Blockage decreased as pressure ratio was
increased from 1.1 to 1.7 because higher velocities carried the particles through the impingement
holes and resulted in particle breakage between the two walls. The resulting smaller particles
were more likely to flow through the film-cooling holes, thus reducing blockage. Finally, an
optimal wall spacing that minimized blockage was determined.
Cardwell et al. [17] investigated effects of parameters including pressure ratio, coolant
and surface temperature, hole alignment, and mass of injected sand particles. Similar to the
results in [16], they found blockage increased with pressure ratio. The increase in blockage was
attributed to increasingly ballistic particle behavior as pressure ratio, and, by extension, velocity
in the holes was increased. Ballistic particles unable to follow turning of the flow were more
likely to impact the surface, thus increasing the probability of deposition and blockage.
Blockage was also found to increase most strongly with the coupon surface temperature, with the
most notable increase in blockage occurring when the metal temperature was increased from
871°C to 982°C. This metal temperature is comparable with the threshold temperatures noted in
other studies [10-13]. Cardwell et al. [17] also noted coupons with unaligned impingement- and

7
film-cooling holes experienced less blockage due to the benefit of particle breakage within the
coupon.
Several previous experimental and computational studies have focused on methods for
removing particulates from coolant flow such as cyclone filtration. Schneider et al. [18] studied
cyclone particle separation in flow through a representative rotating turbine disk cooling system
with a blade root. Moving from the rotor disk cavity inlet to the blade root, they observed a
decrease in size of deposited particles by a factor of 10, which was attributed to a decrease in
cyclone collection efficiency for smaller particle sizes and an increase in the number of smaller
particles due to breakage. Friedlander [6] notes that particle collection efficiency reaches a
minimum for the size range of 0.1 to 1 μm, the intermediate region where neither diffusion nor
inertial effects dominate particle motion. For the case of a cyclone separator, a later study by
Schneider et al. [19] found the particle collection efficiency decreased substantially for particles
less than 10 μm diameter, thus illustrating the challenge of mechanically separating small
particles. Through comparisons of computational and experimental particle collection,
Schneider et al. [20] showed that particle shape may significantly influence drag forces on
particles. They found a correlation proposed by Haider and Levenspiel [21] was necessary to
account for the non-spherical shape of their test particles.
2.3 Uniqueness of the Present Study
Several studies of sand-laden flow through internal flow geometries have given insight
into blockage of coolant passages and methods of particle collection. To the author’s
knowledge, no previous studies have investigated rust particle ingestion and deposition. Since
rust, which is mostly iron oxide, differs considerably from sand, comprised mainly of silicon
dioxide, effects of rust particle ingestion may differ from those previously reported for sand. For
example, the density of rust is about 5200 kg/m3, which is nearly twice that of sand, about 2650
kg/m3. This density difference may cause rust particles of a given size to exhibit more inertial
behavior than similarly sized sand particles. In addition, rust particles are softer than sand and
are therefore more easily crushed, which could influence particle behavior on impact with a solid
surface.
Most internal flow geometries for which sand blockage was studied had minimum flow
areas in the shape of a cylindrical channel. In contrast, the present study investigates rust particle
deposition at the axial seal pin between two blades, which has a comparatively smaller flow area

8
created by surface roughness at the locations of seal pin-blade platform contact. This study
provides opportunity to further investigate blockage trends observed in several studies following
the method in [15] to determine their dependence on geometry. Finally, the inclusion of rotation
yielding engine-representative centrifugal acceleration makes possible the investigation of the
effects of centrifugal forces on flow and particle deposition.

9
Chapter 3. EXPERIMENTAL FACILITY AND METHODOLOGY
The first three sections of this chapter describe the particle characterization study that
was performed in preparation for simulating engine-representative particle deposition in the
laboratory. Various particle mixtures were created and compared with particle samples taken
from field-run gas turbines. Basic tests were also performed to determine the importance of
engine conditions including elevated temperature and centrifugal acceleration.
The latter sections of this chapter describe two test facilities that were designed for rust
injection in engine hardware and two hardware-representative test coupons. A static test facility
was designed to investigate the flow behavior and particle deposition at the axial seal pin
between two full-scale gas turbine blades. A smaller-scale rotating test facility was designed to
investigate the effects of rotation on flow and particle deposition in two test coupons similar to
the axial seal pin flow area. Provided in this section are descriptions of the test facilities, engine
hardware, representative test coupons, and their flow areas along with a derivation of the
dimensional flow functions used in the data analysis. Flow through clean engine hardware and
the test coupons is compared with a one-dimensional prediction, and a correction factor to the
prediction is provided. The procedures for flow and particle injection tests are outlined, and the
test matrices are presented. Finally, an estimation of parameter uncertainty is provided. Results
from the particle characterization and particle injection tests are discussed in Chapters 4 and 5.
3.1 Creation of Representative Particle Samples
The sponsor obtained many samples of particle deposits from the rotor air cooler piping
and the engine internal air system of two turbines at the Payne Creek power generating facility,
namely turbines CT1 and CT2 [1]. The samples were composed of metal oxide compounds.
Excluding oxygen, of the elements present in the samples, the six most commonly found in all of
the samples were aluminum, calcium, iron, zinc, silicon, and chromium. Mass normalized
elemental compositions for the averages of all samples taken in each turbine are given in Table
3.1. Also shown in Table 3.1 are five mixtures of metal oxide compounds made in the laboratory
to represent the range of particle compositions found in CT1 and CT2.

10
Table 3.1. Elemental Compositions of Turbine Samples and Representative Laboratory Particle Mixtures
Mass % Al Ca Fe Zn Si Cr
Payne Creek CT1 5.12 5.39 63.2 11.5 14.1 0.67
Payne Creek CT2 1.42 7.29 77.8 10.9 0.55 2.11
Mixture 1 3.06 6.57 72.6 11.3 6.46 0.00
Mixture 2 3.01 6.47 71.5 11.2 6.36 1.49
Mixture 3 30.7 25.9 21.0 18.2 1.99 2.27
Mixture 4 3.17 25.6 28.7 24.5 14.3 3.74
Mixture 5 0.93 0.32 86.3 10.2 1.02 1.26
Mixture 5 was an average of the elemental compositions from samples taken nearest to
the row one blades in CT1 and CT2 and was most representative of particles deposited near the
seal pin. This mixture was composed primarily of red iron oxide and zinc oxide and was used to
perform the particle injection tests in this study. Shown in Table 3.2, commercial powders were
purchased and mixed together to produce the desired composition. The melting points of the
metal oxide compounds were all above 1500°C.
Table 3.2. Metal Oxide Mixture 5 Composition
Manufacturer Product
Listed Size
(μm)
Mass
%
Melting Point
(°C)
Sigma Aldrich Red Iron (III) Oxide, Fe2O3 powder 86.3 1538
Aldrich Zinc Oxide, ZnO powder 10.2 1975
Sigma Aldrich Chromium (III) Oxide, Cr2O3 50 1.26 2435
Aldrich Silicon Dioxide, SiO2 < 78 1.02 1610
Aldrich
Aluminum Oxide Powder,
Al2O3 < 10 0.93 2040
Sigma Aldrich Calcium Oxide, CaO powder 0.32 2614
The particle size distribution for a sample from CT1 had a median diameter of 19 μm and
included particles ranging in size from submicron to 200 μm. The mixture 5 particle size
distribution was measured from a dry sample by laser diffraction and was found to have a
median diameter of 20 μm with particles ranging from submicron to about 1000 μm. The dry
laser diffraction technique was also used to characterize the particle sizes of field-run engine

11
particle samples. From Figure 3.1, it is evident that mixture 5 spanned the size distribution of
particles found in CT1 and also contained some larger particles. The percent of total particles
shown is defined as the number of particles within a particular size range divided by the total
number of particles counted. As noted in previous literature, the laser diffraction method
involves some preprocessing that breaks up large conglomerations of particles and thus may give
a somewhat smaller size distribution than what would have been observed for the unprocessed
particles [15].
0
1
2
3
4
5
6
7
8
0.1 1 10 100 1000
Payne Creek CT1
mixture 5
% of Total
Particles
Particle Diameter (m)
Figure 3.1. The mixture 5 size distribution included the range of particle sizes found in Payne Creek CT1.
Additional particle composition analysis was performed on samples taken from a field-
run blade. As depicted in Figure 3.2, samples were taken from the root and from the contoured
area between the root and the seal pin slot and are subsequently referred to as root and contour,
respectively. Shown in Table 3.3 are the elemental compositions of the field-run blade samples,
which were similar to the Payne Creek turbine samples in that they contained primarily iron and
zinc. Notable differences are the presence of sulfur and nickel in the root and contour samples.

12
These elements were found in some of the Payne Creek samples but were not among the six
most commonly present elements.
Figure 3.2. Particle sample locations on the field-run blade.
Table 3.3. Elemental Compositions of Samples from Field-Run Blade
Mass % Al Ca Cr Fe K Ni S Si Zn
Root 5.69 3.75 2.65 45.9 1.68 5.05 18.7 10.2 6.49
Contour 1.62 2.65 1.90 38.7 0.56 9.60 4.59 3.76 36.6
3.2 Particle Heating Tests and Procedures
A test matrix, shown in Table 3.4, was created to determine the effects of heating on
particle samples including sand, various metal oxide compounds, and previously discussed metal
oxide mixtures representative of samples from field-run turbines. Temperatures selected for
these tests ranged from 538°C to 1093°C in order to approximately span the temperature range
from the row one engine coolant at 478°C to the row one blade root at 850°C [22,23]. Particles
were placed in a kiln and brought to the target temperature at a rate of 222°C/hr. The exposure
time was measured from the time at which the kiln reached the target temperature.

13
Table 3.4. Particle Heating Test Matrix
Sample Composition
Kiln
Temperature
(°C)
Exposure Time
(min.)
100% Sand 1010 0
100% Black Fe2O3 538 - 1093 0 - 30
100% Red Fe2O3 538 - 1052 0 - 30
100% Al2O3 816 0
50% Red Fe2O3, 50% Black Fe2O3 538 - 1093 30
90% Red Fe2O3, 10% Al2O3 538 - 1093 0 - 30
90% Black Fe2O3, 10% Al2O3 1052 0
45% Red Fe2O3, 45% Black Fe2O3,
10% Al2O3 1052 0
Mixture 1 816 - 1093 0 - 120
Mixture 2
850 0 - 120 Mixture 3
Mixture 4
Mixture 5
While heating in the kiln, particles were placed on ceramic blocks and exposed to the
atmosphere for prolonged periods, raising concern over particle contamination. To check for
sample contamination, unheated and heated samples were analyzed using an environmental
scanning electron microscope (ESEM) and the energy dispersive X-ray spectroscopy (EDS)
technique. Results shown in Figure 3.3 show the same elements were present before and after
heating, which indicates the heating process did not contaminate the samples.

14
0
50
100
150
200
250
300
350
2 4 6 8 10
unheated
heated to 850oC
Counts
keV
mixture 5 particles
C
O
Fe
Zn
Si
Fe
Fe
ZnZn
Figure 3.3. Comparison of particle composition before and after heating in the kiln.
Results for the particle characterization study included both visual observation and
particle size analysis. Sample appearance observations were made both at elevated temperatures
and subsequently after samples cooled to ambient conditions. From a comparison of Figure 3.4
and Figure 3.5, it can be observed that conglomeration and color changes occurring at elevated
temperatures remained after the samples cooled back to room temperature. The persistence of
these appearance changes after samples cooled indicated that chemical and physical changes
occurring in the samples during heating were permanent.

15
Figure 3.4. Metal oxide particles shown while being heated in the kiln.
Figure 3.5. Metal oxide particles shown after being heated in the kiln and cooling to room temperature (same samples as in Figure 3.4).
3.3 Particle Centrifuge Tests and Procedures
Shown in Table 3.5, a test matrix was created to investigate the effects of engine-
representative centrifugal acceleration on particle samples. For the gas turbine considered, the
first row platform radius, which is just above the axial seal pin slot, is 856 mm. Using this radius
and the base load engine speed of 3600 rpm, the engine centrifugal acceleration was calculated
using Equation 3.1 to be 12,400 times gravitational acceleration. The centrifugal acceleration in

16
rotating tests was defined relative to the engine by the parameter Ω, defined in Equation 3.2,
where ac,e represents the engine centrifugal acceleration at 3600 rpm. Centrifugal accelerations
selected for testing were 12,100 and 75,500 times gravitational acceleration, which correspond
respectively with Ω = 1 and Ω = 6.1. Samples of both pure red iron oxide and mixture 5 particles
were included in the test matrix to check for any effects from the additional trace metal oxide
compounds present in mixture 5. Finally, unheated and previously heated samples were included
to check for any combined effects from heating and centrifuging.
Table 3.5. Particle Centrifuging Test Matrix
2
c ra (3.1)
e,c
c
a
a (3.2)
Particle samples were spun at ambient temperature in a Beckman Coulter Avanti J-25
centrifuge using the JA-25.50 rotor. Capped clear plastic tubes, as shown in Figure 3.6, were
used to contain the particles and fit into the centrifuge rotor at an angle 34˚ from the axis of
rotation. The outer radius of a tube from the axis of rotation was 108 mm, so rotating speeds of
10,000 and 25,000 rpm were required to generate the relative centrifugal accelerations listed in
Table 3.5. All centrifuged samples were spun for 20 minutes.
Figure 3.6. Centrifuge tube containing a particle sample.
Sample Ω mrust (g) Prior Heat Treatment
100%
Fe2O3 1 10 none, 150˚C for 4 hr.
Mixture 5 1 – 6.1 5 - 30 none, 850˚C for 0 - 120 min.

17
3.4 Test Facilities
Two test facilities were used in this study, one static and one rotating. Shown
schematically in Figure 3.7, the static test facility was designed to flow compressed air through
engine hardware at laboratory ambient temperatures. This test facility also provided for injecting
rust particles into the air upstream of the engine hardware. Main components of the static test
facility included a compressed air supply, laminar flow element, upstream and downstream test
chambers containing the engine hardware, a gravity-feed particle injection system, and upstream
and downstream filters.
Figure 3.7. A schematic of the static test facility used for rust injection studies.
Compressed air from a remote compressor was supplied to the static test facility at
approximately 410 kPa gage and 22°C. At the inlet to the test facility, a pressure regulating
valve was used to set the upstream air pressure. A filter was installed just downstream of the
valve to prevent dirt from entering the downstream instrumentation and engine hardware. A
laminar flow element (LFE) with a maximum flow rate capacity of 750 cm3/s (for air at standard
temperature and pressure of 21°C and 101 kPa, respectively) was used to measure the volume
flow rate of air through the supply pipe. The flow rate required for the experiment varied from
60 cm3/s to 400 cm
3/s at standard conditions. At least 10 pipe diameters of straight pipe length

18
were provided directly upstream and downstream of the LFE in accordance with the LFE
manual. Gage pressure was measured at the LFE inlet, and temperature was measured upstream
of the LFE with an E-type thermocouple inserted into the air supply piping through a tee fitting.
In conjunction with the measured atmospheric pressure, these measurements were used to
calculate the air density, which was multiplied by the actual volume flow rate to obtain the mass
flow rate through the engine hardware.
Compressed air entered the top of the upstream chamber through a tee fitting. Also
connected to the tee fitting and directly above the upstream test chamber was the particle feed
supply. This supply consisted of an approximately 20 cm-long pipe sealed at the top with a pipe
cap and connected at the bottom to a ball valve. The sealed cap was removed to load particles
into the pipe and then subsequently replaced. When the valve was opened, particles were
released into the flow due to gravity with no additional air leakage. Downstream of the tee
fitting, air flowed into the upstream chamber, which as shown in Table 3.6, acted as a plenum
due to its large cross-sectional area relative to the estimated seal pin flow area. Thus, the
absolute pressure transducer connected to the upstream chamber measured the upstream total air
pressure. Just upstream of the chamber a second E-type thermocouple was used to measure the
air temperature. This temperature in conjunction with the air mass flow rate and upstream total
pressure was used to calculate the flow function. A differential pressure transducer measured the
pressure drop across the seal pin flow area, which allowed the pressure ratio across the engine
hardware to be calculated. Air passed through the engine hardware and the downstream chamber
before being exhausted to the laboratory atmosphere through a minimum efficiency reporting
value (MERV) 11 filter, which captured rust particles during blockage tests. The downstream
chamber was at approximately atmospheric conditions for all tests performed.
Table 3.6. Static Test Facility Cross-sectional Flow Areas
Component Cross Sectional Area Area (mm2)
Area Ratio (A/Asp)
Seal Pin Gap, Asp 2.80*
Air Inlet Pipe 200 71
Upstream Chamber Plenum 61800 22000
*based on assumed seal pin clearance

19
A model of the static test chamber is shown in Figure 3.8 with the front panel removed
for clarity. The outside of the test chamber was constructed of 12.7 mm thick type 304 stainless
steel with 12.7 mm thick polycarbonate front and rear panels. The panels were fastened together
with bolts and sealed at their joints with clear room temperature vulcanizing (RTV) silicone.
Referred to as the blade support, a 25 mm thick stainless steel block with was machined to fit
around the platforms of two blades installed side-by-side as they would be in the engine rotor.
Attached to the front of the blade support was a rigid bar (front bar) used to exert a compressive
force on the blade platforms and gasket material in the horizontal direction. Polycarbonate
clamps (side clamps) on either side of the blades were used to exert a compressive force on the
blades and gasket material in the vertical direction. Normally only the front panel, front bar, and
side clamps were removed for disassembly and cleaning of the blades and test chamber.
Figure 3.8. The static test chamber was designed to contain two turbine blades in a configuration representative of their positions in an engine rotor.

20
A constant effort was made to insure a hermetic seal throughout the upstream air supply
piping, at the seams of the test chamber panels, and at the interface between the blade platforms
and the blade support. RTV silicone was used to seal the front bar and the front panel. Leak
checks at pipe unions, chamber panel seams, and the interface between the blades and blade
support were regularly performed by brushing foamy soap and water solution and checking for
bubbles. Further details of sealing at the interface between the blades and the blade support are
provided in Section 3.5.
A second test facility, shown schematically in Figure 3.9, was designed to flow
compressed air and rust particles through rotating test coupons representative of engine
hardware. Components of the rotating test facility were similar to the static facility with the
addition of a variable-speed centrifuge modified to spin the test coupons and a rotary coupling
for the air supply. The rotating facility was capable of matching the centrifugal acceleration in a
gas turbine, about 12,400 times gravitational acceleration. A comparison between the engine and
rotating test facility is provided in Table 3.7, where the radii are for the distance to the radially-
outermost face of the blade platform. In the rotating test facility, a speed of 10,300 rpm was
required to match the engine centrifugal acceleration (Ω = 1).

21
Figure 3.9. A schematic of the rotating test facility used for rust injection studies.
Table 3.7. Centrifugal Acceleration in Engine and Rotating Test Facility
ω (rpm) r (mm) ac (m/s2) Ω
Engine 3600 856 122000 1
Rotating
Test Facility
500 105
287 0.002
10300 122000 1
Only the pressurized chamber and test coupons rotated while all of the upstream piping
and instrumentation remained static. A rotary coupling with a seal made of tungsten carbide and
graphite was used to form a sealed union between the static components and the rotating
chamber. The connection of the rotary coupling to the spinning container was varied depending
on the rotating speed. A simplified installation was used for low speed tests, whereas for high
speed tests some modifications were necessary to reduce vibration. For tests performed at Ω =

22
0.002, the rotary coupling was threaded into the chamber lid and sealed with an o-ring. The only
support provided to the rotary coupling was that provided by the attached upstream piping. To
reduce vibration for tests at Ω = 1, an 83-mm long section of flexible tubing was used to connect
between the rotary coupling and a modified chamber lid with a hose barb. The tube was made of
Tygon material and had inner and outer diameters of 12.7 mm and 19 mm, respectively.
Symmetric pinch-type tube clamps were used to connect the tubing to the rotary coupling and the
hose barb on the lid. In this high speed configuration, the rotary coupling was rigidly mounted to
the centrifuge lid such that it aligned with the axis of rotation of the spinning chamber.
Upstream of the rotary coupling, the air supply, particle feed system, and instrumentation
were similar to the static test facility. The particle injection system consisted of a vertical 20 cm-
long pipe with a sealed cap at the top and a ball valve at the bottom. The sealed pipe cap was
later replaced with a second ball valve so particles could be more efficiently loaded into the feed
pipe. Air and particles were initially combined in a tee fitting upstream of the rotary coupling.
Later on for testing at Ω = 1, the particle feed tube was extended inside the air supply pipe
through the center of the rotary coupling, terminating inside the rotating chamber. This
modification was necessary to prevent particles from damaging the mechanical seal in the rotary
coupling and to more effectively deliver particles to the test coupons. A section of stainless steel
tube with an outer diameter of 4.8 mm was used to extend the particle feed tube.
From the tee fitting for the air and particle supplies, air and particles passed through a 30
cm-long flexible nylon tube to the top of a second tee fitting, which was connected to the top of
the rotary coupling. Through the side of the second tee fitting, two type-E thermocouples and
two small stainless steel tubes for pressure measurement were inserted into the inside of the
rotating chamber. The pressure measurement tubes and thermocouples were tied together with
thread and bent at a right angle to pass through the center of the rotary coupling and the chamber
lid without contacting rotating components. Upstream of the second tee fitting, the stainless steel
tubes were connected to flexible tubing, which exited the pressurized piping system along with
the thermocouples through a compression fitting. From this point the tubes were connected
through a manifold to an absolute pressure transducer. As in the static test facility, the measured
upstream total pressure was used in conjunction with the measured air mass flow rate and
temperature to calculate the flow function. The use of flexible tubing for the air and particle
supply pipe and the pressure taps was necessary to permit small horizontal displacement of the

23
rotary coupling during rotation. At Ω = 1, excessive heating due to friction and the extension of
the particle feed tube through the rotary coupling made it necessary to move the pressure taps
and thermocouples inside the chamber further upstream. The pressure tap was moved to the tee
fitting just above the rotary coupling, and the thermocouple at the inlet to the LFE was used as
the upstream total temperature. Errors in the upstream total pressure measurement resulting from
moving the pressure tap were determined to be negligible. The pressure drop through the
upstream pipe nipple and rotary coupling was estimated to be about 0.1 in. H2O, or about 0.04%
of the differential pressure across the test coupons. Additionally, the dynamic pressure at the
upstream measurement location was about 0.01% of the total pressure.
Inside the rotating chamber, a horizontal circular plate with curved vertical walls was
installed to direct particles into the test coupons. Shown in Figure 3.10, two similar versions of
the particle diffuser plate were created, one for low speed tests, and a second, more structurally
robust version for high speed tests. As shown schematically in Figure 3.11, the bottom of the
plate was at approximately the mid-height of the test coupons and extended from the center of
the chamber out to the openings in the test coupons. Curved vertical walls 25 mm in height were
attached to the top of the plate such that they directed particles into the openings in the test
coupons. The top of the walls was just above the end of the extended particle feed tube to
prevent particles from diffusing radially outward before reaching the parts.
To provide containment in the event of accidental liberation of rotating components, the
rotating chamber was entirely contained inside the metal-encased centrifuge housing and a
cylindrical ballistic shield made of 12.7 mm thick steel. A Hall effect sensor was mounted onto
the ballistic shield to monitor the rotating speed. Also mounted flush with the inside of the
ballistic shield were four downstream pressure taps, each spaced at 90° around the circumference
and centered vertically with the test coupons. A differential pressure transducer was connected
between these pressure taps and the upstream chamber pressure taps, and the differential pressure
in conjunction with the upstream chamber pressure was used to calculate the pressure ratio
across the test coupons. Since high rotating speeds generated a pressure gradient between these
downstream pressure taps and the exits of the test coupons, a correction was applied when
calculating the pressure ratio. Calculation details and nominal values for this correction are
provided in Appendix B.

24
Figure 3.10. Top view of rotating chamber with lid removed.
Figure 3.11. Particle diffuser plate position relative to test coupon.
As shown in Figure 3.10, the rotating chamber was designed to be symmetric about its
axis of rotation with three ports through the side wall. To improve balance and increase testing
efficiency, three identical test coupons were installed in these ports. Special care was taken to
maintain symmetry during machining of the chamber so that dynamic balancing was
unnecessary. The chamber, lid, and test coupons were all made of 7075 aluminum due to its
machinability and high strength-to-weight ratio. O-ring seals were used at the interfaces of the

25
lid and test coupons with the chamber walls. Each set of three test coupons was made to close
tolerances such that the masses of the test coupons in a given set were approximately equal.
Prior to flow testing, the test chamber was assembled with gasket material filling the
simulated platform gaps in the test coupons. In this configuration, a pressure leak test showed
the container was hermetically sealed. Periodic pressure leak tests were also performed on the
rotary coupling under non-rotating conditions, and these tests showed the rotary coupling was
also hermetically sealed. As in with the static test facility, leak checks with soap bubbles were
periodically performed on upstream connectors and pipe fittings.
A Sorvall model RC2-B floor centrifuge was modified to provide the high-speed rotating
drive and containment shroud for the rotating chamber. The centrifuge had a variable-speed
drive with a maximum speed of 20,000 rpm. For the rotating test facility, the maximum rotating
speed was about 10,300 rpm, corresponding with Ω = 1. A hole was cut out in the centrifuge lid
to permit the air and particle supply pipe and instrumentation to be connected to the rotating
chamber and to provide an exhaust to the laboratory atmosphere. During particle injection tests,
this hole was covered with fabric filter material to contain rust particles inside the centrifuge.
3.5 Description of Engine Hardware and Flow Area
For the tests performed in the static test facility, two complete blades from the first row
of a land-based gas turbine engine were used. Shown in Figure 3.12, the blades were identical in
style, but one was new and the other was exposed to field service. Both blade platforms were in
good condition with the exception of a small crack at the seal pin slot on the field service blade.
This crack was sealed with silicone prior to testing. The platform style of the blades was similar
to that of the failed blades in [1] and is referred to as the slotted design. Also used in this study
was an axial seal pin, which measured 6.35 mm in diameter and 110 mm in length and was
chamfered slightly on each end.

26
Figure 3.12. Two blades from the first row of a land-based gas turbine engine.
The two blades were installed side by side as shown in Figure 3.13, and a consistent
platform gap of 1.27 mm was maintained with gage blocks placed at each end of the seal pin.
This gap is representative of the engine cold-build gap as reported in [1]. The blades and test
chamber were sealed with gasket material and silicone such that the flow was restricted to the
area along the length of the axial seal pin. Epoxy was applied between the gage blocks and the
rear blade to maintain their position and create a seal. For the majority of tests performed, the
gage blocks were not sealed where they contacted the front blade platform. Later flow tests
performed with silicone applied between the gage blocks and the front blade platform confirmed
that flow leakage between the gage blocks and the front blade platform was negligible and did
not influence the flow test results. Since the seal pin was slightly shorter than the length of the
slot to allow for free movement of the pin, there was potential for flow to leak around the ends of
the seal pin. As shown in Figure 3.14, gasket material and silicone were used to seal the areas
27
between the ends of the seal pin and the seal pin slot, thereby restricting flow to the contact areas
along the length of the pin.
Figure 3.13. The installation of the blades as viewed from the underside of the test chamber.
Figure 3.14. The flow area at the seal pin as viewed from the front of the test chamber (front panel, front bar, and front blade removed for clarity).

28
A cross-section of the seal pin and front and rear blade platforms is shown schematically
in Figure 3.15. The flow area consisted of two clearances where the seal pin made imperfect
contact with the slotted rear blade and flat front blade platform surfaces. Due to manufacturing
techniques, each of these contacting surfaces had a rough surface finish, which created small
gaps at the contact areas and allowed leakage of air along the length of the seal pin. The small
sizes of these clearances made them impractical to measure, so their value was estimated. A
one-dimensional analysis was performed using the two clearances lumped together into what is
referred to as the seal pin clearance (tsp) for the purpose of estimating the seal pin flow area. A
seal pin clearance of 0.0254 mm was assumed. Taken with the known seal pin length (Lsp) of
110 mm, this clearance was used in Equation 3.3 to calculate an assumed flow area (Asp) of 2.80
mm2.
spspsp LtA (3.3)
Figure 3.15. The seal pin clearance consisted of two clearance gaps between the seal pin and rear and front blade platforms (side cross-sectional view).
As it was previously shown in Figure 3.14, a combination of silicone rubber gasket
material and RTV silicone was used to seal between the blade platforms and the test chamber
blade support piece. Initially, the test chamber was assembled with a piece of gasket material
installed between the two blade platforms and shown to be sealed by a pressure test. During
testing, however, it was not possible to perform a pressure leak test due to the inherent leakage

29
area at the seal pin. A detailed multi-step procedure was followed throughout the disassembly
and reassembly process to insure consistent installation of the blades, seal pin, gage blocks, and
gasket material in the test chamber. As shown in Figure 3.16, repetition of the baseline flow
function versus pressure ratio curve for multiple assemblies gave confidence that the assembly
method was consistent and created a hermetic seal between the blade platforms and the blade
support. A derivation of the flow function is provided in Section 3.7.
0
1E-8
2E-8
3E-8
4E-8
5E-8
6E-8
7E-8
Assembly 1
2
3
4
5
Baseline Curve Fit
FF0
(m-s-K1/2
)
PR
Figure 3.16. Data from multiple test chamber assemblies were compared to show consistency in the flow area.
During engine operation, rotation of the blades induces centrifugal acceleration acting in
the outward radial direction, or downward as viewed in Figure 3.14. This acceleration would
normally exert an outward radial force on the axial seal pin, causing it to contact the radial
outermost edge of the seal pin slot. Since experiments were performed on static blades, it was
necessary to replicate this force through other means in order to achieve an engine-representative
leakage flow area. To preserve the original engine hardware, a smooth 6.35 mm diameter
stainless steel rod was machined to length and chamfered on the ends similar to the axial seal
pin. Two 1 mm diameter holes were drilled in the pin, and 0.98 mm wire was threaded through
the holes and bent to secure the wire in the holes. Epoxy was applied to the upstream ends of the
wires to prevent air leakage through the holes in the pin. The wires passed through the blade

30
platform gap, as shown in Figure 3.13, and were kept in tension with a clamp on the airfoil side
of the blades.
3.6 Description of Rotating Test Coupons
To reduce the size and mass of the rotating components, test coupons were made to
represent a section of the blade platform including the seal pin slot and some of the contoured
surface between the seal pin slot and the root. Shown in Figure 3.17, the test coupon section was
27.9 mm wide, which is about one-fourth of the full-scale seal pin slot length. Each test coupon
consisted of two separable halves representative of two adjacent blade platforms. Except for the
area along the length of the seal pin, the coupon halves were sealed with silicone along their
mating faces before being bolted together for installation in the rotating chamber. To represent
the engine hardware cold-build conditions, the test coupons were designed to maintain a 1.27
mm platform gap between the two halves along the length of the seal pin [1].
Figure 3.17. The section of the engine hardware used to create the rotating test coupon (dimensions in mm).
Shown in Figure 3.18, two test coupons were used in the rotating test facility and are
hereafter referred to as coupon 1 and coupon 2. The direction of rotation was representative of
engine conditions with the slotted half leading and the flat half following. Both coupons used
the same design for the flat half, which was created from a coordinate-measuring machine
(CMM) scan of the flat side of the engine hardware blade platform. The difference in the two
coupons was confined to the slotted half. A CMM scan of the slotted side of the blade platform
31
was used to create the slotted half of coupon 1. Like the slotted engine hardware, coupon 1
included a lip upstream of the seal pin contact area. To create coupon 2, the lip in coupon 1 was
removed, yielding a smooth surface transition upstream of the seal pin contact area. Detailed
drawings of the two test coupons are provided in Appendix E.
As discussed in Section 3.5, the flow area in the engine hardware was created from
imperfect contact between the smooth seal pin and the rough seal pin slot surfaces. It was
therefore important to replicate in the test coupon the surface finish of the engine hardware at the
seal pin slot. Based on a previous study, the plunge-electrical discharge machining (EDM)
technique was determined to be best suited for creating a rough surface on the test coupon
similar to that of the engine hardware [24]. Several different samples of test coupon material
were machined by plunge-EDM and compared with the engine hardware. Three-dimensional
surface profiles of the engine hardware and plunge-EDM samples were measured using a Wyko
NT1100 optical profilometer. The surface profiles for the engine hardware and the most similar
EDM sample are shown in Figure 3.19 and Figure 3.20, respectively. Comparison of the two
surface plots shows that, while both the engine hardware and the EDM sample exhibited similar
variation from the mean surface height, the peaks of the engine hardware slot surface were
relatively more rounded and smooth. This difference was most likely caused by wear to the
engine hardware surface during field service.
Results from the optical profilometry measurement also included numerical surface finish
parameters, which are provided in Table 3.8. Parameter values are given on a 95% confidence
interval based on multiple measurement locations on each surface. Area-averaged parameters
represent the average over the lateral measurement area (227 µm by 299 µm), while two-
dimensional trace parameters represent the average from a series of linear cuts taken across the
measured surface profile. Both parameters yielded the RMS surface roughness (Rq), which
represents the root-mean-square average surface height relative to the mean [25]. Peak-to-valley
spacing was also determined from the two-dimensional trace data. For a particular two-
dimensional trace, this parameter represents the lateral spacing from the highest peak to the
lowest valley. The height above surface parameter was determined from the volume required to
submerge the surface to its highest peak divided by the measurement surface area. As such, the
height above surface represents the average distance between the surface and a plane contacting
the highest peak and parallel to the plane of mean surface height.

32
Figure 3.18. Coupon 1 had a lip near the seal pin contact area, while coupon 2 had the lip removed for a smooth transition.

33
Figure 3.19. Three-dimensional optical profilometry surface plot for engine hardware.
Figure 3.20. Three-dimensional optical profilometry surface plot for plunge-EDM sample 4.

34
Table 3.8. Surface Finishes of Engine Hardware and Plunge-EDM Samples
Surface Analysis Type Peak-to-Valley
Spacing (µm) Rq (μm)
Height Above
Surface (μm)
Engine
Hardware, Seal
Pin Slot
Area Average N/A 6.8 ± 2.8 14.6 ± 5.9
2-D Trace 147 ± 54 6.7 ± 3.0 N/A
Plunge-EDM
Sample 1
Area Average N/A 10.1 ± 1.1 20.8 ± 2.6
2-D Trace 126 ± 16 9.4 ± 1.0 N/A
Plunge-EDM
Sample 2
Area Average N/A 7.8 ± 0.6 14.3 ± 1.6
2-D Trace 116 ± 19 7.8 ± 0.5 N/A
Plunge-EDM
Sample 3
Area Average N/A 16.8 ± 3.7 32.4 ± 10.6
2-D Trace 118 ± 14 15.0 ± 2.2 N/A
Plunge-EDM
Sample 4
Area Average N/A 16.0 ± 2.4 33.6 ± 7.7
2-D Trace 132 ± 11 14.1 ± 2.6 N/A
Surface profilometry parameters and visual inspection of magnified areas larger than
those sampled during optical profilometry measurements were used to compare the EDM
surfaces to the engine hardware. All of the plunge-EDM samples lacked the wear that was
evident on the engine hardware, so their surface finishes were all somewhat different from the
engine hardware. The surface finish of sample 4 was selected for replication in the rotating test
coupons as a balance between matching the surface roughness height and the lateral spacing of
surface roughness elements to the engine hardware. While other EDM samples were better
matches of the engine hardware in terms of the Rq and height above surface parameters, they
exhibited closer lateral spacing of surface roughness elements.
In order to match the forces at the seal pin contact area due to the centrifugal force, it was
important to match the seal pin density to that of the engine hardware. Seal pins for the test
coupons were machined from Inconel X-750, the same material used for the engine hardware.
The test coupon seal pins were machined and ground to a smooth finish. They measured 6.35
mm diameter by 27.9 mm long, about one-fourth of the engine hardware seal pin length.
3.7 Data Analysis
Flow of gas through a nozzle or diffuser can be approximated as one-dimensional,
isentropic flow of an ideal gas, which permits definition of a non-dimensional flow parameter
that can be used to predict the flow through a nozzle or diffuser if the upstream total to
downstream static pressure ratio (P0/pb) is known. For the tests under consideration in this study,

35
the experimental setup consisted of a relatively large upstream plenum followed by a narrow
flow area at the seal pin, which in a simplified sense, are analogous to the upstream reservoir and
nozzle shown in Figure 3.21. Following is a derivation of the non-dimensional flow parameter
for the case of one-dimensional isentropic flow of an ideal gas through a nozzle with a large
upstream reservoir. Nomenclature corresponds with that shown in Figure 3.21.
Figure 3.21. The seal pin flow area may be approximated as a nozzle downstream of a large reservoir.
The mass flow rate through the nozzle is defined in Equation 3.4, where the density ρ,
speed of sound c, Mach number Ma, and cross sectional area A are all evaluated at the throat, the
narrowest cross-sectional area of the nozzle.
thththth AMacm (3.4)
For isentropic flow of an ideal gas, the relationship between Mach number and
downstream static to upstream total pressure ratio (pth/P0) is given by Equation 3.5.
1
2
th0
th
Ma2
11
1
P
p
(3.5)
Rearranging Equation 3.5 yields Equation 3.6, a more convenient expression for the
Mach number as a function of pressure ratio.
2
1
1
th
0
th1
21
p
PMa
(3.6)

36
In addition, the relationship between Mach number and static to total temperature ratio
(Tth/T0) is given by Equation 3.7.
2
th0
th
Ma2
11
1
T
T
(3.7)
Equation 3.8 holds for isentropic flow of an ideal gas.
ttanconsp
(3.8)
Using Equation 3.8 and the ideal gas equation of state, the throat density may be written
as in Equation 3.9. Because the upstream chamber is a reservoir with large cross-sectional area
relative to the throat area, the gas velocity in the upstream chamber is negligible, and static and
total conditions are approximately equivalent.
0
0
1
0
th
thTR
P
P
p
(3.9)
Making use of Equation 3.7, the speed of sound at the throat may be written as in
Equation 3.10.
2
1
2
th
0
th
Ma2
11
TRc
(3.10)
With some intermediate algebra, Equation 3.4 may now be manipulated to yield the non-
dimensional flow parameter FP, given in Equation 3.11.
2
1
1
0
th
2
0
th
th0
0
)1(
2
P
p
P
p
AP
TRmFP
(3.11)
For subsonic conditions at the nozzle throat, the throat pressure pth is equal to the outlet
back pressure pb. Consider the nozzle operating with a constant upstream total pressure and a
variable static back pressure. As the back pressure is decreased, the mass flow rate and throat
Mach number increase up to the point of choking, when the throat Mach number is one and the

37
back pressure is at the critical value pb*. From Equation 3.5, the choked condition can be shown
to occur at the critical pressure ratio of 0.528, as shown in Equation 3.12.
528.0P
*p
0
b (3.12)
For the present study, the pressure ratio is defined as the upstream total pressure divided
by the downstream back pressure, which is the inverse of Equation 3.12. The critical pressure
ratio (PR*) then becomes 1.89, as shown in Equation 3.13.
89.1*p
P*PR
b
0 (3.13)
For an upstream total to downstream back pressure ratio less than or equal to the critical
value given in Equation 3.13, the throat Mach number is less than or equal to one, which means
the fluid velocity at the throat is at most equal to the speed of sound. Pressure waves are
therefore able to propagate throughout the flow, so there are no discontinuities in pressure and
the throat pressure (pth) is equal to the back pressure (pb). Thus, for subsonic flow, the flow
parameter may be rewritten in terms of the downstream back to upstream total pressure ratio, as
shown in Equation 3.14.
2
1
1
0
b
2
0
b
th0
0
)1(
2
P
p
P
p
AP
TRmFP
(3.14)
Continuing to hold the upstream total pressure constant, further reduction of the back
pressure below what is required to achieve the critical pressure ratio results in choked nozzle
operation, when the fluid speed is sonic in the throat (Math = 1). At or above the critical pressure
ratio, pressure waves are unable to propagate upstream against the sonic throat velocity. The
throat static pressure remains at pb* and is greater than the back pressure pb, resulting in a
pressure discontinuity at the nozzle exit. The upstream conditions are therefore insensitive to
further reduction in back pressure, and the mass flow rate reaches its maximum at the critical
pressure ratio. For the present study, the pressure ratio was such that throat conditions were
always subsonic.
The expression in Equation 3.14 shows the mass flow rate is dependent on the gas total
temperature, upstream total pressure, pressure ratio, and flow area. Various forms of this flow
parameter are commonly used, and often the area and gas constant terms are excluded from the

38
left-hand side. A dimensional form of the flow parameter is given in Equation 3.15 and hereafter
referred to as the flow function to distinguish it from the non-dimensional form. The units used
for the flow function are m-s-K1/2
.
)Ksm()1(R
2
P
p
P
pA
P
TmFF 2/1
2
1
1
0
b
2
0
b
th
0
0
(3.15)
Flow through the static engine hardware was characterized in terms of the flow function,
defined as the mass flow rate times the square root of the upstream total temperature divided by
the upstream total pressure. The flow function is specific to a particular flow area since the area
term has been excluded from the left-hand side. Thus, a change in area such as that resulting
from particle blockage results in a change in flow function.
For a particular flow area, it is possible to generate a theoretical curve of isentropic flow
function versus pressure ratio. To predict nozzle flow behavior, the discharge coefficient (CD) is
needed to account for non-isentropic effects, multi-dimensional flow effects, and the effective
reduction in flow area due to the boundary layer thickness. The discharge coefficient is less than
unity and is multiplied by the isentropic flow function. A constant discharge coefficient of 0.816
was assumed based on a one-dimensional engine analysis [26]. The assumed values for
discharge coefficient and seal pin flow area were used in Equation 3.16 to generate a curve of
predicted flow function versus pressure ratio, shown in Figure 3.22. As the pressure ratio
increases, the predicted flow function initially increases and reaches a maximum value at the
critical pressure ratio of 1.89 due to choking.
2
1
1
0
b
2
0
b
spDp)1(R
2
P
p
P
pACFF
(3.16)

39
0
2E-8
4E-8
6E-8
8E-8
1E-7
1 1.2 1.4 1.6 1.8 2
predicted, Equation 3.16
FFp
(m-s-K1/2
)
PR
Figure 3.22. The predicted flow function versus pressure ratio curve for the assumed seal pin flow area and discharge coefficient.
The flow function given in Equation 3.15 was derived for a static orifice or nozzle. For
the case of a rotating nozzle, Maeng et al. [27] have shown experimentally there is additional
energy imparted to the flow through transfer of angular momentum from the nozzle. An energy
balance performed on a control volume including a rotating nozzle and its surroundings yields
Equation 3.17, where the left-hand side represents the work done on the fluid element due to
rotation, r is radius of the nozzle about the axis of rotation, and vth is the fluid velocity at the
throat of the nozzle.
0p
2
th
bp
2
Tc2
vTc
2
)r(
(3.17)
Recognizing that the fluid velocity has both radial and circumferential components,
Equation 3.17 can be rewritten in terms of the radial throat velocity component (vth,r) as Equation
3.18. In the present rotating study, the seal pin flow area was oriented such that its axis was in
the radial direction, so the radial component of the nozzle throat velocity represents the fluid
velocity at the nozzle throat in the rotating reference frame.
)TT(c2)r(v th0p
22
r,th (3.18)

40
It is convenient to define a rotational temperature (Trot) as in Equation 3.19.
p
2
rotc2
)r(T
(3.19)
Using Equation 3.19, expressions for rotational total temperature (T0,rot) rotational total
pressure (P0,rot) may be written as in Equations 3.20 and 3.21, respectively.
rot0rot,0 TTT (3.20)
1
0
rot
0rot,0T
T1PP
(3.21)
With the assumption of isentropic flow, a more general form of the flow function suitable
for both rotating and static conditions can be derived from Equations 3.20 and 3.21 and is given
in Equation 3.22. This expression is hereafter referred to as the rotational flow function and
denoted FFrot. Comparing Equation 3.20 with Equation 3.15, it is evident that the rotational flow
function reduces to the static flow function for the non-rotating case (ω = 0).
)Ksm()1(R
2
T
T1
P
p
T
T1
P
pA
P
TmFF 2/1
2
1
1
1
0
rot
1
0
b
0
rot
2
0
b
th
rot,0
rot,0
rot
(3.22)
It is also convenient to define a rotational pressure ratio (PRrot) as in Equation 3.23,
which reduces to the pressure ratio used in the static analysis for the non-rotating case.
1
0
rot
b
0
rotT
T1
p
PPR
(3.23)
Making use of Equation 3.23, the rotational flow function given in Equation 3.22 can be
written in a more compact form as in Equation 3.24. Flow through the rotating test coupons was
characterized in terms of this rotational flow function and the rotational pressure ratio given in
Equation 3.23. Details of the flow function and pressure ratio calculations are provided in
Appendices A and B.
)Ksm()1(R
2
PR
1
PR
1A
P
TmFF 2/1
2
1
1
rot
2
rot
th
rot,0
rot,0
rot
(3.24)

41
3.8 Procedure for Static Tests
The previously described static test facility was used to measure air flow through the seal
pin flow area for clean engine hardware and after particle injection. All tests were performed at
laboratory ambient temperatures. Shown in Figure 3.23, a curve fit of flow function versus
pressure ratio was generated for clean engine hardware for two purposes: 1) to experimentally
characterize flow through the seal pin flow area, and 2) to establish a baseline flow function for
checking the assembly and measuring flow reduction. This flow function is subsequently
referred to as the baseline flow function and denoted by FF0. The test chamber and engine
hardware were assembled and disassembled several times, and the experimental flow function
data were averaged to generate the baseline flow function curve. Original experimental data are
for test chamber assemblies performed with no silicone applied between the gage blocks and
front blade platform, while retest experimental data are for assemblies performed 8 months later
with silicone applied between the gage blocks and front blade platform. The baseline curve fit
was generated from the original experimental data. Since the retest data matches well with the
baseline flow function curve, the absence of silicone between the gage blocks and the front blade
platform did not have a significant effect on the results. In other words, any flow leakage
between the gage blocks and front blade platform was negligible. The curve fit equation used for
the static baseline flow function is provided in Appendix A.
0
1E-8
2E-8
3E-8
4E-8
5E-8
6E-8
7E-8
1 1.2 1.4 1.6 1.8 2
Original Experimental Data
Retest Experimental Data
Baseline Curve Fit
FF0
(m-s-K1/2
)
PR
Figure 3.23. Baseline flow function for clean engine hardware.

42
Before each test, the flow area around the seal pin was thoroughly cleaned using a
combination of blowing with compressed air, brushing, and cleaning with liquid solution.
Additionally, the flow function was measured at one or more pressure ratios and was required to
match the clean baseline curve to insure a consistent and leak-free assembly. If the measured
flow function did not match the baseline curve, there were three likely causes: 1) variation in
assembly of the blades and seal pin, 2) a leak in the test chamber or piping, or 3) deposited rust
particles remaining at the seal pin flow area from a previous test.
After matching the baseline flow function, a particle injection test proceeded as follows.
The particles were heated in an oven at 200°C for at least 2 hours to insure they were dry and of
consistent moisture content. Particles were then removed from the oven and allowed to cool to
ambient conditions. Recalling Figure 3.7, the desired mass of particles was measured and
poured into the particle feed piping with the ball valve in the closed position, and the feed pipe
cap was reinstalled and sealed with pipe thread tape. After setting the desired pressure ratio and
allowing the air flow through the test chamber to reach steady conditions, the ball valve was
opened, releasing particles into the flow. As shown in Figure 3.24, releasing a given mass of
particles into the flow yielded a step decrease in flow function and a slight change in pressure
ratio, both of which remained constant with time several seconds after particle injection.

43
0
5E-9
1E-8
1.5E-8
2E-8
2.5E-8
3E-8
1.1
1.15
1.2
1.25
1.3
0 40 80 120
FF
PR
FF
(m-s-K1/2
)PR
Time (s)
Particle Injection
Figure 3.24. Blocked flow conditions reached steady values shortly after injecting rust particles (shown for rust mass of 0.23 g).
After particle injection, most of the rust particles were entrained in the flow and either
passed through the seal pin gap or deposited on the seal pin and blade platform surfaces. Very
few particles were found on the upstream chamber surfaces upon disassembly. Blockage due to
particle deposition at the seal pin flow area was measured as a percent reduction in flow function
(RFF) following the method described in [15]. The terms clean and blocked refer to pre- and
post-particle injection conditions, respectively. The reduction in flow function is defined in
Equation 3.25 and was measured as the difference between the blocked flow function and the
baseline flow function (FF0) evaluated at the blocked pressure ratio. The reduction in flow
function is shown schematically in Figure 3.25 for a particular blockage test. See Appendix A
for details of the flow function and blockage calculations from experimentally measured
parameters.
PR0FF
FF1RFF (3.25)

44
1E-8
1.5E-8
2E-8
2.5E-8
3E-8
3.5E-8
1.14 1.145 1.15 1.155 1.16
Baseline Curve
Clean Check Point
FF0
FF
FF
(m-s-K1/2
)
PR
RFF
Figure 3.25. Blockage was measured in terms of a reduction in flow function evaluated at the blocked pressure ratio (zoomed view shown).
3.9 Procedure for Rotating Tests
Rust injection tests in the rotating test facility were performed with three identical test
coupons open to flow and particle deposition; therefore flow blockage measured in each test was
considered an average of the blockage in three parts. For coupon 1, the clean flow function was
measured over a range of pressure ratios at Ω = 0.002, first for each coupon individually and then
for all three coupons open to flow simultaneously. Multiple assemblies of the test coupons and
seal pins were performed to show the baseline flow function was repeatable. As shown in Figure
3.26, the baseline flow function for each coupon was similar and matched the one-third-scale
flow function for flow through all three coupons. It was necessary to scale the data for all three
coupons open to flow because the flow function was not normalized by the flow area.
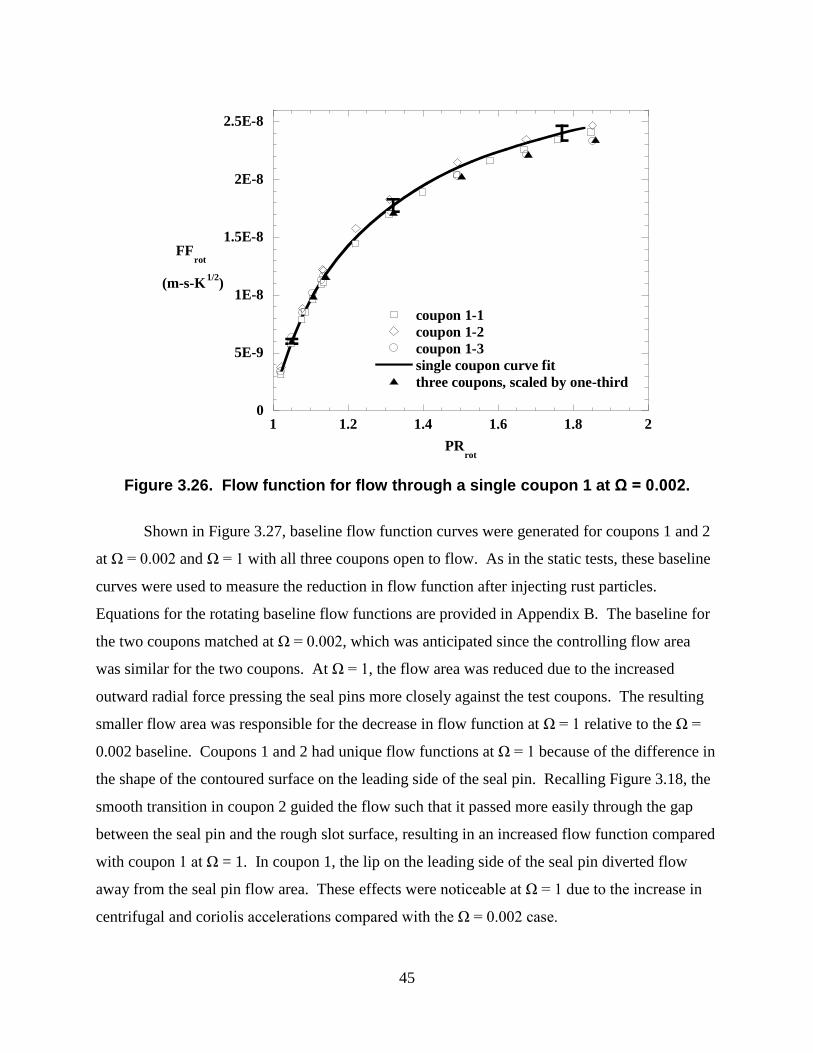
45
0
5E-9
1E-8
1.5E-8
2E-8
2.5E-8
1 1.2 1.4 1.6 1.8 2
coupon 1-1
coupon 1-2
coupon 1-3
single coupon curve fit
three coupons, scaled by one-third
FFrot
(m-s-K1/2
)
PRrot
Figure 3.26. Flow function for flow through a single coupon 1 at Ω = 0.002.
Shown in Figure 3.27, baseline flow function curves were generated for coupons 1 and 2
at Ω = 0.002 and Ω = 1 with all three coupons open to flow. As in the static tests, these baseline
curves were used to measure the reduction in flow function after injecting rust particles.
Equations for the rotating baseline flow functions are provided in Appendix B. The baseline for
the two coupons matched at Ω = 0.002, which was anticipated since the controlling flow area
was similar for the two coupons. At Ω = 1, the flow area was reduced due to the increased
outward radial force pressing the seal pins more closely against the test coupons. The resulting
smaller flow area was responsible for the decrease in flow function at Ω = 1 relative to the Ω =
0.002 baseline. Coupons 1 and 2 had unique flow functions at Ω = 1 because of the difference in
the shape of the contoured surface on the leading side of the seal pin. Recalling Figure 3.18, the
smooth transition in coupon 2 guided the flow such that it passed more easily through the gap
between the seal pin and the rough slot surface, resulting in an increased flow function compared
with coupon 1 at Ω = 1. In coupon 1, the lip on the leading side of the seal pin diverted flow
away from the seal pin flow area. These effects were noticeable at Ω = 1 due to the increase in
centrifugal and coriolis accelerations compared with the Ω = 0.002 case.

46
0
1E-8
2E-8
3E-8
4E-8
5E-8
6E-8
7E-8
8E-8
1 1.2 1.4 1.6 1.8 2 2.2
coupon 1, = 0.002
coupon 2, = 0.002
baseline
coupon 2, = 1
baseline
coupon 1, = 1
baseline
FF0,rot
(m-s-K1/2
)
PRrot
Figure 3.27. Baseline flow functions for coupons 1 and 2 at Ω = 0.002 and Ω = 1 with three identical coupons open to flow.
3.10 Comparison of Static Baseline and Predicted Flow Functions
As may be observed in Figure 3.28, the baseline and predicted flow function curves for
static engine hardware do not match. One reason for the discrepancy is that the predicted flow
function is based on assumed values for the flow area and discharge coefficient, as shown in
Equation 3.16. If the assumed constant values for flow area and discharge coefficient were
incorrect, the ratio of baseline to predicted flow function would be expected to be a constant
value other than unity for all pressure ratios. Figure 3.29 illustrates the ratio of baseline to
predicted flow function increases with pressure ratio from about 0.3 to 0.6 for pressure ratios
ranging from 1.05 to 1.8, which implies either the flow area or the discharge coefficient varied
with pressure ratio in the experiment. Since the flow area was fixed at a constant value
regardless of pressure ratio, the increase in the ratio of flow functions with pressure ratio is
attributed to variation in loss mechanisms with pressure ratio.
Recall that the discharge coefficient is used to account for losses due to non-isentropic
effects, multi-dimensional flow effects, and reduction of the effective flow area due to boundary
layer thickness; therefore variation in the discharge coefficient corresponds with variation in the
relative magnitude of these physical loss mechanisms. For a typical nozzle with a well-designed

47
entrance, gradients in the radial direction outside the boundary layer are generally small and the
assumption of one-dimensional flow holds. Additionally, the magnitude of the reduction in
effective flow area due to boundary layer thickness is small relative to the large core of inviscid
flow outside the boundary layer, so a typical nozzle operating at Reynolds numbers greater than
105 has a relatively constant discharge coefficient slightly less than unity over a range of flow
conditions. The seal pin flow area is different from a typical nozzle in two key ways: 1) the
entrance condition to the seal pin flow area varies from that of a well-designed nozzle; and 2) the
seal pin flow area is much smaller than that of a typical nozzle. A closer look at the flow physics
is necessary to understand why these differences cause the discharge coefficient to increase with
pressure ratio.
0
2E-8
4E-8
6E-8
8E-8
1E-7
1 1.2 1.4 1.6 1.8 2
Predicted, Equation 3.16
Experimental Data
Baseline Curve Fit (FF0)
FF
(m-s-K1/2
)
PR
Figure 3.28. Predicted flow function and experimental curve fit flow function for clean engine hardware, static tests.

48
0
0.2
0.4
0.6
0.8
1
1 1.2 1.4 1.6 1.8 2
CF=
FF0/FF
p
PR
Figure 3.29. The ratio of experimental to predicted flow functions varied with pressure ratio for the static tests.
The effect of a non-ideal nozzle entrance condition is illustrated on the left-hand side of
Figure 3.30. If the inlet angle θ becomes too large, the flow gains momentum in the y-direction,
resulting in multi-dimensional flow that narrows at some point beyond the exit plane of the
nozzle. This narrowest flow area is called the vena contracta and may be considerably smaller
than the throat area depending on the entrance condition. The vena contracta acts as an
aerodynamic throat and reduces the flow rate from the anticipated value for isentropic flow based
on the nozzle throat area, resulting in a larger than anticipated discharge coefficient.
Furthermore, as discussed in [28-30], the area of the vena contracta increases with pressure ratio.
This effect can be seen in Figure 3.30 by comparing the left and right schematics, which
correspond to the low and high pressure ratio cases, respectively. Experimental results presented
in [28] show that the area of the vena contracta increases most dramatically up to the critical
pressure ratio and continues to increase until a pressure ratio of about P0/pb = 4.0 is reached. A
nozzle with a non-ideal entrance condition is therefore not fully choked at the critical pressure
ratio P0/pb* = 1.89.
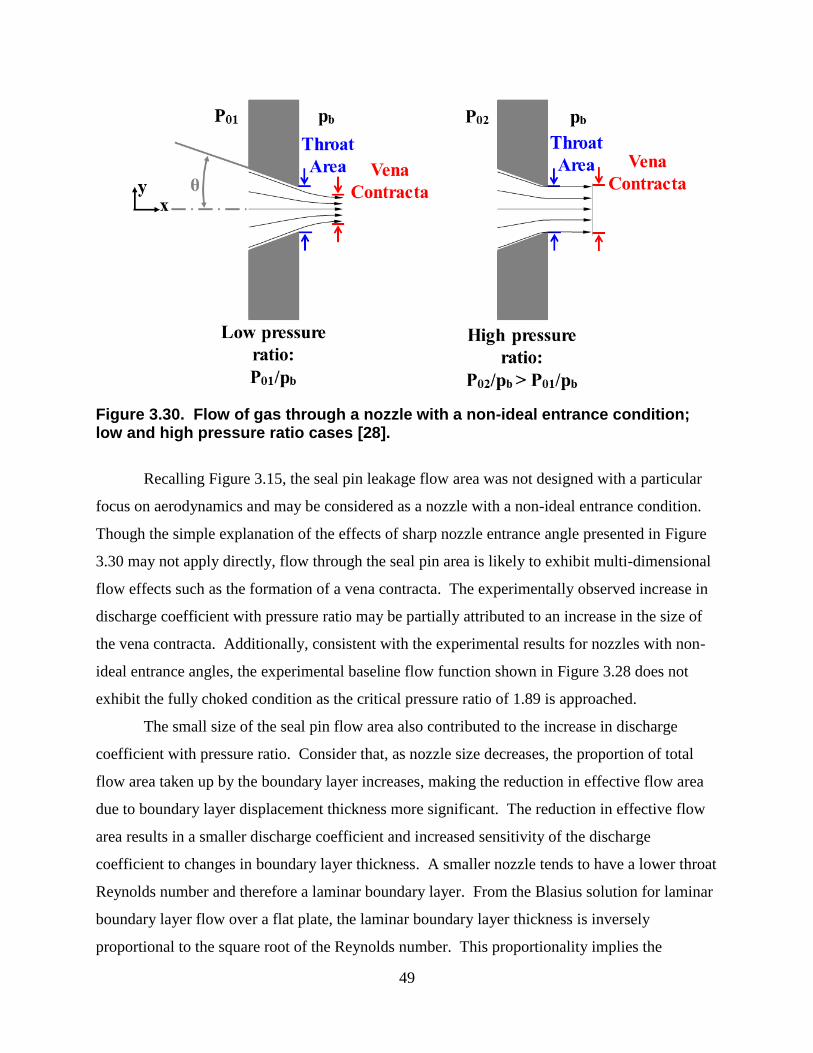
49
Figure 3.30. Flow of gas through a nozzle with a non-ideal entrance condition; low and high pressure ratio cases [28].
Recalling Figure 3.15, the seal pin leakage flow area was not designed with a particular
focus on aerodynamics and may be considered as a nozzle with a non-ideal entrance condition.
Though the simple explanation of the effects of sharp nozzle entrance angle presented in Figure
3.30 may not apply directly, flow through the seal pin area is likely to exhibit multi-dimensional
flow effects such as the formation of a vena contracta. The experimentally observed increase in
discharge coefficient with pressure ratio may be partially attributed to an increase in the size of
the vena contracta. Additionally, consistent with the experimental results for nozzles with non-
ideal entrance angles, the experimental baseline flow function shown in Figure 3.28 does not
exhibit the fully choked condition as the critical pressure ratio of 1.89 is approached.
The small size of the seal pin flow area also contributed to the increase in discharge
coefficient with pressure ratio. Consider that, as nozzle size decreases, the proportion of total
flow area taken up by the boundary layer increases, making the reduction in effective flow area
due to boundary layer displacement thickness more significant. The reduction in effective flow
area results in a smaller discharge coefficient and increased sensitivity of the discharge
coefficient to changes in boundary layer thickness. A smaller nozzle tends to have a lower throat
Reynolds number and therefore a laminar boundary layer. From the Blasius solution for laminar
boundary layer flow over a flat plate, the laminar boundary layer thickness is inversely
proportional to the square root of the Reynolds number. This proportionality implies the

50
boundary layer thickness in a small nozzle must decrease with increasing Reynolds number,
resulting in an increase in discharge coefficient to reflect the larger effective flow area outside
the boundary layer.
Several experimental studies of small-diameter nozzles and orifices also reported
variation of the discharge coefficient with either Reynolds number based on throat diameter or
pressure ratio. An early study of compressible flow by Voss et al. [31] captured the variation in
discharge coefficient for nozzle diameters less than 6.35 mm. They found the discharge
coefficient decreased with Reynolds number, with the steepest decrease occurring for Re < 105,
but it was evident that the Reynolds number was not the only controlling parameter. Previously
discussed multi-dimensional effects that are dependent on pressure ratio also contributed to the
decrease in discharge coefficient. Later studies further investigated compressible flow through
even smaller diameter nozzles and orifices. For nozzles ranging from 0.259 mm to 2.39 mm
diameter with a critical throat Mach number, Tang and Fenn [32] showed that the discharge
coefficient decreased strongly with the throat Reynolds number, particularly for Re < 104.
Kayser and Shambaugh [33] investigated subsonic compressible flow through orifices and
converging nozzles ranging from 0.9 to 1.9 mm diameter. They found the discharge coefficient
may correlate well with either the throat Reynolds number or the upstream total to downstream
static pressure ratio depending on the design of the nozzle or orifice. For rounded or elliptical
entry nozzles, they found the discharge coefficient dropped off sharply with Reynolds number
for Re < 20,000.
For the present experiment, both the throat Reynolds number and Mach number varied
with pressure ratio. The throat Mach number was calculated using Equation 2.4. Recalling
Figure 3.15, the throat Reynolds number based on hydraulic diameter was calculated from
Equation 3.26 for one of the two gaps between the seal pin and adjacent blade platforms. This
calculation assumed the clearance gap was negligible compared to the seal pin length when
calculating the wetted perimeter. Additionally, the assumption was made that the mass flow rate
divided evenly between the two seal pin contact areas shown in Figure 3.15.
spL
mRe
(3.26)
Over the range of pressure ratios from 1.05 to 1.8, the throat Reynolds number and Mach
number varied from 30 to 300 and from 0.26 to 0.96, respectively. Since this Reynolds number

51
range is within the laminar flow regime, the trend of rapidly decreasing discharge coefficient
with Reynolds number that was observed in [32] and [33] was expected. Recalling Figure 3.29,
this trend is consistent with the observed decrease in the ratio of experimental to predicted flow
function with pressure ratio.
At a particular pressure ratio, the ratio of flow functions given in Figure 3.29 may be used
as a correction factor (CF) and multiplied by the predicted flow function as in Equation 3.27 to
yield the flow function based on the experimental data. Furthermore, for a given upstream total
temperature and total pressure, the mass flow rate through the seal pin flow area may be
determined from the corrected flow function as shown in Equation 3.28.
pFFCFFF (3.27)
0
0
T
PFFm (3.28)
Alternatively, it is possible to back-calculate from experimental data the value of the
discharge coefficient multiplied by the area (CD A), commonly referred to as the effective flow
area, using Equation 3.29. The discharge coefficient and area cannot be isolated from one
another in the experimental data analysis since the small size of the seal pin flow area did not
permit its independent measurement. The resulting curve of effective flow area versus pressure
ratio is given in Figure 3.31.
RFP
FFACD (3.29)

52
0
0.5
1
1.5
1.1 1.2 1.3 1.4 1.5 1.6 1.7 1.8
CD*A
(mm2)
PR
Figure 3.31. Effective seal pin flow area as a function of pressure ratio for engine hardware.
3.11 Comparison of Static and Rotating Baseline Flow Functions
The experimentally measured flow functions from the static and rotating tests are
compared in Figure 3.32. Since the seal pin length in each test coupon part was nominally one-
fourth of the engine hardware seal pin length, the baseline flow function curve for flow through
three identical test coupons was scaled by a factor of four-thirds to correct for the smaller flow
area. It is appropriate to compare the Ω = 0.002 data with the static data since the effect of
rotation for the Ω = 0.002 case was relatively small. Recalling Table 3.8, the rotating coupons
had seal pin slots machined similarly to plunge-EDM sample 4, which exhibited increased
surface roughness compared with the engine hardware seal pin slot. The increased surface
roughness widened the flow area between the slot and the seal pin, resulting in an increased flow
function for the Ω = 0.002 tests relative to the static tests.
Also included in Figure 3.32 is a prediction based on one-dimensional analysis for flow
through the coupons. Recalling Equation 3.3, the seal pin clearance tsp was approximated as 33.6
μm, which was the height above surface parameter given in Table 3.8 for plunge-EDM sample 4.
The engine hardware seal pin length of 110 mm was used, yielding a seal pin flow area Asp =
3.70 mm2. A discharge coefficient of 0.6 was used since the seal pin flow area was previously
shown to exhibit multi-dimensional flow effects similar to a sharp-edged orifice [34]. As with

53
the static tests, the one-dimensional approximation did not exactly match the experimental data.
This discrepancy was largely due to losses resulting from the small size of the flow area and
multi-dimensional flow effects, neither of which was accounted for in the one-dimensional
approximation. In addition, the height above surface parameter used to calculate the flow area
for the predicted curve was only an approximation. Recalling Figure 3.15, this parameter did not
account for the gap between the seal pin and the trailing (flat) half of the test coupon, and the
parameter was measured on a sample machined similarly to the test coupon slot surface but not
on the actual test coupon.
0
2E-8
4E-8
6E-8
8E-8
1E-7
1 1.2 1.4 1.6 1.8 2
= 0.002, scaled by 4/3
= 0.002, predicted
static engine hardware
static baseline
FFrot
(m-s-K1/2
)
PRrot
Figure 3.32. Comparison of scaled rotating coupon flow function with full-scale static engine hardware.
3.12 Derivation of Test Matrices
A test matrix for the static engine hardware tests, shown in Table 3.9, was developed to
investigate the effects of injecting various amounts of rust at pressure ratios representative of
engine conditions. Based on engine coolant and main gas flow pressures typical for gas turbine
blades, the pressure ratio across the axial seal pin is expected to vary between 1.05 and 1.6 along
the length of the pin. Three pressure ratios spanning this range, namely 1.05, 1.15, and 1.6, were
selected for testing.

54
Rust amounts for each pressure ratio were chosen around mean mass loading ratio (rust
mass divided by air mass flow rate) of 0.50 s based on the mass loading ratio of sand (sand mass
divided by air mass flow rate) found in [15] through particle injection experiments to yield
blockages similar to what was observed in field-run jet engine hardware. Though there is no
expected direct correlation between sand ingestion in jet engines and rust ingestion in land-based
engines, the data from sand testing with jet engine hardware was referenced as a base for the
current test matrix since no quantitative information regarding rust particle ingestion in land-
based turbines was available. While a concentration ratio such as the rust mass flow to air mass
flow rate would have been preferable due to its dimensionless form, the method of near
instantaneous injection of a mass of rust particles made defining the particle flow rate
impractical.
Table 3.9. Test Matrix for Static Tests
PR mrust (g) MLR = mrust / airm (s)
1.05
0.018 0.25
0.039 0.54
0.054 0.75
0.13 1.8
0.23 3.2
1.15
0.039 0.22
0.089 0.5
0.13 0.72
0.23 1.3
5.3 N/A
1.6
0.039 0.08
0.13 0.27
0.23 0.5
0.35 0.75
An additional static rust injection test was performed in which a total of 5.3 g of rust was
cumulatively injected in several smaller quantities. The purpose of this test was twofold: 1) to
attempt a complete blockage of the seal pin flow area; and 2) to compare the blockage effects for
a given rust mass injected as a single amount with those for the same mass injected cumulatively
in several smaller amounts.

55
Shown in Table 3.10, a second test matrix was developed for the rotating study to
investigate the effects of rotating speed and flow geometry on rust deposition and flow blockage.
Ω = 1 corresponds with matching the centrifugal acceleration in the engine. Tests were
performed at pressure ratios of 1.15, 1.6, and 1.8. Injecting rust amounts with a mass loading
ratio of about 0.5 s resulted in negligible flow blockage, so the rust amounts were increased to
yield flow blockage similar to what was observed in the static tests. The mass loading ratio for
the rotating tests ranged from 0.6 to 28 s at Ω = 0.002. At Ω = 1, the mass loading ratio varied
from 6.1 to 26 s for coupon 1 and from 3.5 to 15 s for coupon 2.
Table 3.10. Test Matrix for Rotating Tests
Coupon Ω PRrot mrust (g)
1 0.002 (500 rpm)
1.15 8.0
1.6 8.0
1.8 8.0
1 (10,300 rpm) 1.6 8.0
2 0.002 (500 rpm)
1.6 8.0
1 (10,300 rpm) 8.0
Each particle injection test for a given pressure ratio and injected rust mass was repeated
a minimum of three times to insure repeatability of the blockage. After performing a 25-test
repeatability study, Walsh et al. [15] concluded three repetitions of each test optimized testing
efficiency and yielded repeatable reductions in flow function to within 7%. For the static tests, a
15-case repeatability study performed for PR = 1.15 and mrust = 0.089 g showed three repetitions
of each test yielded reductions in flow function to within 9%. In the rotating facility, each rust
injection test measured the flow blockage through three identical test coupons. For statistical
analysis, the flow blockage from each test in the rotating facility was considered to be an average
of three tests. Analysis of 9 rotating tests (3 tests of 3 parts each) indicated the reduction in flow
function was repeatable to within 7%. The rotating tests analyzed were for coupon 2 at Ω =
0.002, with 8.0 g total injected rust at PRrot = 1.6. All repeatability results are reported for a 95%
confidence interval.

56
3.13 Uncertainty Analysis
Uncertainty analysis of experimentally measured parameters was performed using the
partial derivative method as described by Beckwith et al. [35]. Results shown in Table 3.11 give
nominal parameter values and their respective uncertainties for the static tests. Uncertainty in
flow function was 2.1% to 3.1% and was mainly driven by bias uncertainties in the pressure and
temperature measurements at the LFE. For pressure ratios of 1.05, 1.15, and 1.6, uncertainties in
the reduction in flow function were 23%, 10%, and 3.9%, respectively. Both the flow function
and reduction in flow function uncertainties increased as pressure ratio decreased due to the
constant instrument bias uncertainties relative to the smaller nominal values of FF and RFF. For
PR = 1.15, the measurement uncertainty of 10% was greater than the previously discussed 9%
uncertainty due to measurement repeatability, so therefore performing three repetitions of each
test was sufficient to minimize uncertainty for the given measurement equipment. Further details
of the static uncertainty calculations are provided in Appendix C.
Table 3.11. Parameter Nominal Values and Uncertainties for Static Tests
Range
% of
Measured
Value
Range
% of
Measured
Value
Range
% of
Measured
Value
PR 1.05 ± 0.001 0.09 1.15 ± 0.003 0.25 1.59 ± 0.011 0.69
m (kg/s)
7.15E-05 ±
1.70E-06 2.4
1.77E-04 ±
3.42E-06 1.9
4.63E-04 ±
7.02E-06 1.5
FF (m-s-K1/2
)
1.21E-08 ±
3.74E-10 3.1
2.74E-08 ±
7.28E-10 2.7
5.19E-08 ±
1.09E-09 2.1
RFF 13% ± 3.1% 23 22% ± 2.3% 10 37% ± 1.4% 3.9
mrust (g)
0.039 ±
0.001 2.6
0.089 ±
0.001 1.1
0.232 ±
0.001 0.43
Uncertainties of parameters in the rotating study are provided for Ω = 0.002 and Ω = 1
tests in Table 3.12 and Table 3.13, respectively. At Ω = 0.002, the parameter nominal values for
coupons 1 and 2 were similar since both the baseline flow function and the reduction in flow
function were similar for both coupons. Uncertainty in the flow function was 2.6% to 3.2% and
was driven primarily by the bias uncertainty in the temperature measurement at the LFE.
Uncertainty for the reduction in flow function varied from 6.1% to 32% and decreased with
increasing flow blockage. For tests performed at Ω = 0.002 and PRrot = 1.6, the measurement
uncertainty for the reduction in flow function was 9%. Compared with the repeatability of 7%,
this uncertainty indicates performing three tests with three identical test coupons each was

57
sufficient to minimize uncertainty within the limitations of the equipment. Further details of the
uncertainty analysis for the rotating tests are provided in Appendix D.
Table 3.12. Parameter Nominal Values and Uncertainties for Tests at Ω = 0.002
Range
% of
Measured
Value
Range
% of
Measured
Value
Range
% of
Measured
Value
ω (rpm) 514 ± 3 0.5 518 ± 3 0.5 501 ± 3 0.6
PRrot 1.14 ± 0.02 1.6 1.60 ± 0.02 1.1 1.80 ± 0.02 1.0
FFrot (m-s-K1/2
) 3.64E-08 ±
1.18E-09 3.2
6.48E-08 ±
1.78E-09 2.8
6.94E-08 ±
1.81E-09 2.6
RFF 21% ± 6.6% 32 24% ± 2.2% 9.2 17% ± 2.2% 13
mrust (g) 8.034 ±
0.003 0.04
8.014 ±
0.002 0.03
8.013 ±
0.002 0.03
Table 3.13. Parameter Nominal Values and Uncertainties for Tests at Ω = 1 Coupon 1 Coupon 2
Range
% of
Measured
Value
Range
% of
Measured
Value
ω (rpm) 10342 ± 2 0.02 10302 ± 2 0.02
PRrot 1.61 ± 0.02 1.3 1.61 ± 0.02 1.3
FFrot (m-s-K1/2
) 3.20E-08 ± 9.48E-10 3.0 5.22E-08 ± 1.53E-09 2.9
RFF 22% ± 2.6% 12 35% ± 2.1% 6.1
mrust (g) 8.017 ± 0.002 0.02 8.009 ± 0.002 0.02

58
Chapter 4. RESULTS FROM STATIC TESTS
This chapter includes results from the particle characterization study and from tests
performed using the static test facility. From the particle characterization study, the effects of
separate particle heating and centrifuging experiments are presented. Results from the static test
facility include tests with clean air flow and tests with rust particle-laden flow. An assessment of
the sensitivity to the rust injection method is included along with a general description of
observed rust deposition. Results from particle injection tests are presented, and the effects of
rust mass, mass loading ratio, and pressure ratio are discussed. An additional particle injection
test designed to achieve the maximum possible blockage is also discussed.
4.1 Effect of Heating
Particles of various compositions were heated in a kiln to observe the influence of turbine
representative temperatures, and the effects of particle composition and temperature were
assessed. Summarized in Table 4.1, a first series of heated tests was performed on oxide
compounds comprised of sand (SiO2), black iron oxide (Fe2O3), red iron oxide (Fe2O3), and
aluminum oxide (Al2O3).
Independent of composition, particles conglomerated and began turning darker in color at
approximately 950°C. Red iron oxide particles turned black between 954°C and 1093°C, which
indicated a phase change. As noted in tests 2e and 3e, both red and black iron oxide became
brittle above 954°C, probably as a result of particles beginning to melt. Figure 4.1 illustrates the
observed changes to particles of various mixtures including red and black iron oxide. The most
noticeable changes occurred for red iron oxide, which tended to form the largest clumps and
underwent a color change from bright red to brown/grey after being heated to 1040°C. When
particles conglomerated during heating, it was possible to break up the agglomerations after the
particles cooled to room temperature.

59
Table 4.1. Particle Heating Tests for Samples of Various Compositions
Sample Composition Test
Kiln
Temperature
(°C)
Exposure
Time
(min.)
Observations
100% Sand 1 1010 0 Conglomerated, darker
100% Black Fe2O3
2a 538 30 Unchanged
2b 816 0 Unchanged
2c 816 30 Did not cling to surface, darker
2d 954 30 Began forming clumps, darker
2e 1093 30 Conglomerated, completely black, brittle
100% Red Fe2O3
3a 538 30 Unchanged
3b 816 30 Unchanged
3c 954 30 Began forming clumps, slightly darker, did not
cling to surface
3d 1093 30 Black
3e 1052 0 Conglomerated, dull black, brittle
100% Al2O3 4 816 0 Unchanged
50% Red Fe2O3, 50%
Black Fe2O3
5a 538 30 Unchanged
5b 816 30 Clings less to surface
5c 954 30 Began forming clumps, darker, did not cling to
surface
5d 1093 30 Sample contaminated
90% Red Fe2O3, 10%
Al2O3
6a 538 30 Unchanged
6b 816 30 Unchanged
6c 954 30 Darker, clings less to surface
6d 1052 0 Conglomerated, somewhat red, brittle, more dense
6e 1093 30 Turned dark red
90% Black Fe2O3,
10% Al2O3 7 1052 0 Conglomerated, black, speckled
45% Red Fe2O3, 45%
Black Fe2O3, 10%
Al2O3
8 1052 0 Conglomerated, dull black, speckled
Figure 4.1. Metal oxide particles shown initially and at various temperatures during heating (Sample numbers correspond to test numbers in Table 4.1.).

60
A second series of heated tests, summarized in Table 4.2, was performed on metal oxide
mixtures that were representative of particle compositions found in field-run turbines (recall
Table 3.1). These tests investigated the effects of particle composition, temperature, and
exposure time. For mixtures 1 and 2, conglomeration and color change were observed at
temperatures above 816°C and 850°C, respectively, however, mixtures 3, 4, and 5 exhibited
negligible changes in appearance when heated to 850°C and exposed for various time periods.
Mixture 5 particles are shown in Figure 4.2 before and after heating to 850°C.
Table 4.2. Particle Heating Tests for Engine Representative Compositions
Sample Test
Kiln
Temperature
(°C)
Exposure
Time
(min.)
Observations
Mixture 1
9a Ambient N/A Red powder, clingy
9b 954 0 Datum
9c 954 30 Increased clumping
9d 954 60 Increased clumping
9e 954 120 Increased clumping
9f 816 0 Datum
9g 816 30 Orange/red
9h 816 60 Unchanged from 9g
9i 816 120 Unchanged from 9g
9j 1093 0 Minor conglomeration, brown/red
9k 1093 30 Increased conglomeration, dark brown
9m 1093 60 Increased conglomeration, dark brown/black
9n 1093 120 Increased conglomeration, black
Mixture 2
10a Ambient N/A Red powder, clingy
10b 850 0 Orange/red
10c 850 30 Increased conglomeration, orange/red
10d 850 60 Increased conglomeration, orange/red
10e 850 120 Increased conglomeration, orange/red
Mixture 3
11a Ambient N/A Pink powder, clingy
11b 850 0 Slightly increased conglomeration, light brown
11c 850 30 Unchanged from 11b
11d 850 60 Unchanged from 11b
11e 850 120 Unchanged from 11b
Mixture 4
12a Ambient N/A Pink powder, clingy
12b 850 0 Light brown
12c 850 30 Unchanged from 12b
12d 850 60 Unchanged from 12b
12e 850 120 Unchanged from 12b
Mixture 5
13a Ambient N/A Very red (iron oxide predominates the colors)
13b 850 0 Slightly deeper red
13c 850 30 Unchanged from 13b
13d 850 60 Unchanged from 13b
13e 850 120 Unchanged from 13b

61
Figure 4.2. Visual comparison of unheated mixture 5 particles (left) with particles heated to 850°C (right), scale in inches.
To investigate the effects of temperature and exposure time on a micro scale, particle size
analysis by laser diffraction was performed on unheated and heated samples of mixture 5
particles. Shown in Figure 4.3, particle size was found to increase considerably with heating
temperature, particularly from 850°C to 950°C. While the unheated particle size distribution
contained particles ranging from submicron to nearly 1000 μm, the volume percentage of
particles larger than 100 μm was greatly increased for the sample heated to 950°C. Particle size
was also found to increase slightly with heating time. In mixture 5 samples heated to 850°C,
varying the heating time from 0 to 120 minutes yielded a small right-ward shift in the particle
size distribution, shown in Figure 4.4. Particles located at the center of the sample required more
time to heat to the kiln temperature and thus only experienced the effects of increased
temperature after a longer heating time.

62
0
2
4
6
8
10
12
0.1 1 10 100 1000
unheated
850oC
950oC
% of Total
Particles
Particle Diameter (m)
mixture 5 particles
Figure 4.3. Size distributions for unheated and heated particles. Particle size tests were performed at ambient conditions following heating.
0
1
2
3
4
5
6
0.1 1 10 100 1000
0 minutes
30
60
120
% of Total
Particles
Particle Diameter (m)
mixture 5 particles
T = 850oC
Figure 4.4. Size distributions for particles heated for varying lengths time.
4.2 Effect of Centrifugal Forces
A summary of the centrifuge tests is provided in Table 4.3. The major finding from the
centrifuge tests was that particles conglomerated into a lumped mass and adhered to the outer
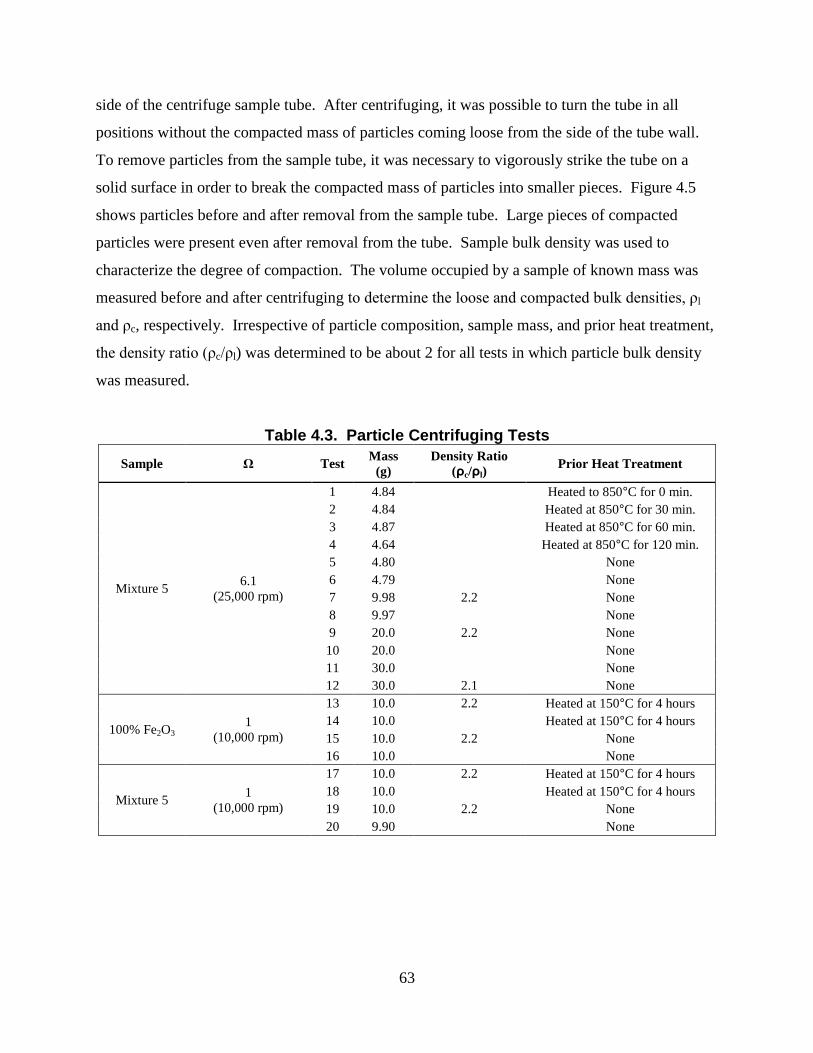
63
side of the centrifuge sample tube. After centrifuging, it was possible to turn the tube in all
positions without the compacted mass of particles coming loose from the side of the tube wall.
To remove particles from the sample tube, it was necessary to vigorously strike the tube on a
solid surface in order to break the compacted mass of particles into smaller pieces. Figure 4.5
shows particles before and after removal from the sample tube. Large pieces of compacted
particles were present even after removal from the tube. Sample bulk density was used to
characterize the degree of compaction. The volume occupied by a sample of known mass was
measured before and after centrifuging to determine the loose and compacted bulk densities, ρl
and ρc, respectively. Irrespective of particle composition, sample mass, and prior heat treatment,
the density ratio (ρc/ρl) was determined to be about 2 for all tests in which particle bulk density
was measured.
Table 4.3. Particle Centrifuging Tests
Sample Ω Test Mass
(g)
Density Ratio
(ρc/ρl) Prior Heat Treatment
Mixture 5 6.1
(25,000 rpm)
1 4.84 Heated to 850°C for 0 min.
2 4.84 Heated at 850°C for 30 min.
3 4.87 Heated at 850°C for 60 min.
4 4.64 Heated at 850°C for 120 min.
5 4.80 None
6 4.79 None
7 9.98 2.2 None
8 9.97 None
9 20.0 2.2 None
10 20.0 None
11 30.0 None
12 30.0 2.1 None
100% Fe2O3 1
(10,000 rpm)
13 10.0 2.2 Heated at 150°C for 4 hours
14 10.0 Heated at 150°C for 4 hours
15 10.0 2.2 None
16 10.0 None
Mixture 5 1
(10,000 rpm)
17 10.0 2.2 Heated at 150°C for 4 hours
18 10.0 Heated at 150°C for 4 hours
19 10.0 2.2 None
20 9.90 None
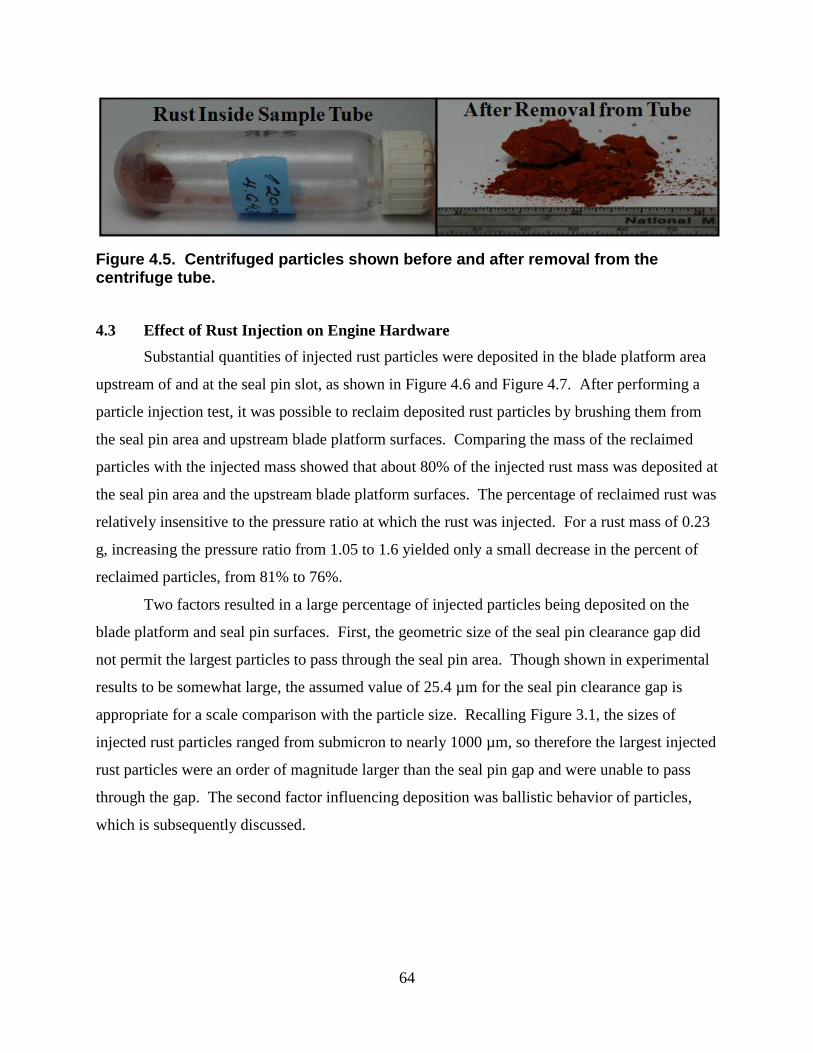
64
Figure 4.5. Centrifuged particles shown before and after removal from the centrifuge tube.
4.3 Effect of Rust Injection on Engine Hardware
Substantial quantities of injected rust particles were deposited in the blade platform area
upstream of and at the seal pin slot, as shown in Figure 4.6 and Figure 4.7. After performing a
particle injection test, it was possible to reclaim deposited rust particles by brushing them from
the seal pin area and upstream blade platform surfaces. Comparing the mass of the reclaimed
particles with the injected mass showed that about 80% of the injected rust mass was deposited at
the seal pin area and the upstream blade platform surfaces. The percentage of reclaimed rust was
relatively insensitive to the pressure ratio at which the rust was injected. For a rust mass of 0.23
g, increasing the pressure ratio from 1.05 to 1.6 yielded only a small decrease in the percent of
reclaimed particles, from 81% to 76%.
Two factors resulted in a large percentage of injected particles being deposited on the
blade platform and seal pin surfaces. First, the geometric size of the seal pin clearance gap did
not permit the largest particles to pass through the seal pin area. Though shown in experimental
results to be somewhat large, the assumed value of 25.4 µm for the seal pin clearance gap is
appropriate for a scale comparison with the particle size. Recalling Figure 3.1, the sizes of
injected rust particles ranged from submicron to nearly 1000 µm, so therefore the largest injected
rust particles were an order of magnitude larger than the seal pin gap and were unable to pass
through the gap. The second factor influencing deposition was ballistic behavior of particles,
which is subsequently discussed.
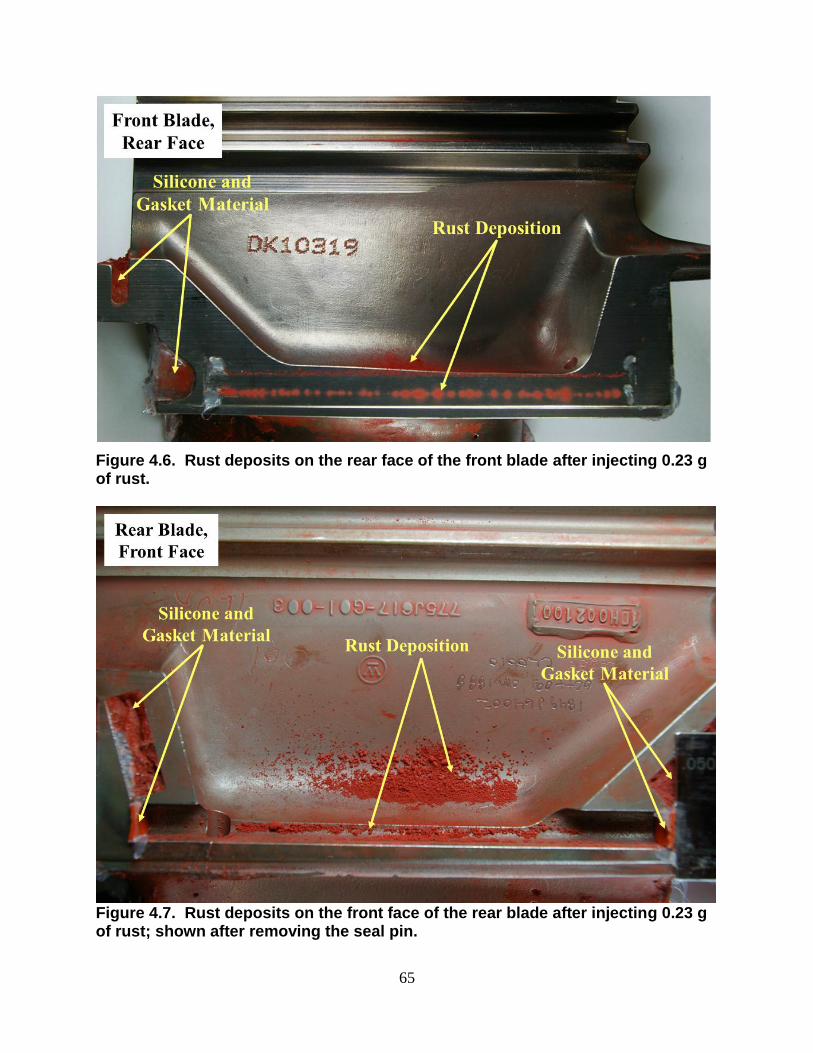
65
Figure 4.6. Rust deposits on the rear face of the front blade after injecting 0.23 g of rust.
Figure 4.7. Rust deposits on the front face of the rear blade after injecting 0.23 g of rust; shown after removing the seal pin.

66
Results from particle injection experiments were analyzed in several different ways to
examine the effects of rust amount, mass loading ratio, and pressure ratio on flow blockage. The
effects of rust amount and mass loading ratio for three pressure ratios are shown in Figure 4.8
and Figure 4.9, respectively. Blockage ranged from 5% to 43% RFF and increased with total
injected rust mass and with mass loading ratio for injected rust masses ranging from 0.018 g to
0.35 g and mass loading ratios ranging from 0.08 s to 3.2 s. As the injected rust mass was
increased, more particles were available for inertial impaction and deposition in the seal pin area,
resulting in greater reduction in the flow area and increased blockage.
0
10
20
30
40
50
0 0.05 0.1 0.15 0.2 0.25 0.3 0.35 0.4
PR = 1.6
1.15
1.05
RFF
(%)
mrust
(g)
Figure 4.8. Blockage versus injected rust mass for three pressure ratios.
Recall that the mass loading ratio is defined as the ratio of injected rust mass to air mass
flow rate and as such is proportional to the particle concentration. Since the air mass flow rate
was constant for clean conditions at a given pressure ratio, an increase in mass loading ratio
corresponded directly to an increase in rust mass. It was therefore not possible to completely
isolate the effect of increasing rust mass from that of increasing mass loading ratio, and the
similarity in the trends shown in Figure 4.8 with those in Figure 4.9 was anticipated.

67
0
10
20
30
40
50
0 0.5 1 1.5 2 2.5 3 3.5
PR = 1.6
1.15
1.05
RFF
(%)
MLR (s)
Figure 4.9. Blockage versus rust mass to air mass flow rate ratio for three pressure ratios.
As noted in Chapter 1, rust deposition in an engine typically occurs over a short period of
time after engine startup. Upon engine startup, the concentration of rust is initially a maximum
and gradually decreases with time as rust particles are removed from the cooling air flow and
deposited in the engine or in filters [5]. The experiments considered here all involved injecting a
quantity of rust particles almost instantaneously into air flow through the seal pin area and thus
were not exactly representative of the decaying particle concentration experienced in an engine.
To determine whether blockage at the seal pin area is sensitive to the rust delivery
method, two types of tests were performed for comparison of rust delivery methods. In the first
type of test, several rust amounts totaling a given mass were injected cumulatively, and blockage
was measured after each successive rust injection. The second type of test involved injecting the
same given rust mass as a single quantity and subsequently measuring the blockage. Figure 4.10
shows the comparison between these two types of tests. When uncertainty is taken into account,
cumulative and single-quantity rust injection yielded similar blockages for the same total injected
rust mass. This finding indicates blockage was strongly dependent on the total injected particle
mass, and therefore the deposition and blockage observed in experiments is representative of that

68
occurring in an engine even though the means of particle ingestion were different. Previous
deposition studies by Kim et al. [10] and Cardwell et al. [17] also reported blockage was
dependent on the total mass of particles injected.
0
10
20
30
40
50
0 0.05 0.1 0.15 0.2 0.25 0.3
cumulative test
single-quantity tests
RFF
(%)
mrust
(g)
Figure 4.10. Comparison of single-quantity and cumulative rust injection tests performed at a pressure ratio of 1.15.
As shown in Figure 4.11, blockage increased with pressure ratio for a given rust amount.
It was previously noted that inertial effects dominate the motion of particles larger than about 1
µm. The increased fluid velocities associated with higher pressure ratios inhibited the particles’
ability to follow the flow streamlines, resulting in more impacts with the engine hardware which
lead to increased deposition and greater flow blockage. Following is a discussion on interactions
between disperse particles moving in a continuous fluid medium that gives further insight into
the effect of increasing the pressure ratio.

69
0
10
20
30
40
50
1 1.1 1.2 1.3 1.4 1.5 1.6
0.347g
0.232g
0.127g
0.089g
0.054g
0.039g
0.018g
RFF
(%)
PR
Figure 4.11. Blockage versus pressure ratio for various injected rust masses.
To understand why blockage increased with pressure ratio, it is useful to consider the
non-dimensional Stokes number (Stk). The Stokes number is defined in Equation 4.1 as the
particle time scale (τp) divided by the fluid time scale (τf).
f
pStk
(4.1)
As described in [36], the Stokes number is a measure of a particle’s responsiveness to
changes in direction of the fluid motion. In this sense, a small Stokes number (Stk < 1) implies a
relatively small particle time scale, which means particles will tend to follow flow streamlines
around bends. On the other hand, a large Stokes number (Stk > 1) implies a relatively large
particle time scale. Particles with large Stokes numbers will tend to be insensitive to major
changes in the flow direction, and their behavior is ballistic.
The particle time scale and fluid time scale are defined by Equations 4.2 and 4.3,
respectively. It may be observed from Equation 4.2 that, for a given particle size, the particle
time scale remains constant. Since the present set of experiments utilized a single particle size
distribution, the particle time scale was constant in an average sense.
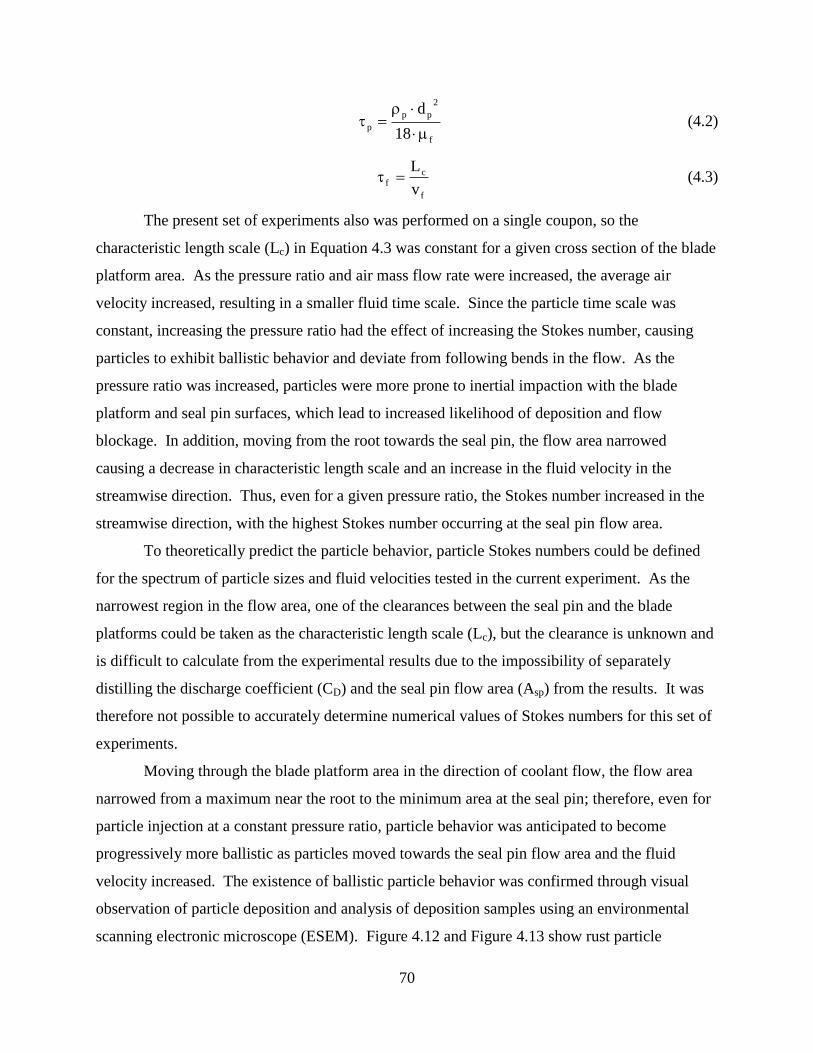
70
f
2
pp
p18
d
(4.2)
f
c
fv
L (4.3)
The present set of experiments also was performed on a single coupon, so the
characteristic length scale (Lc) in Equation 4.3 was constant for a given cross section of the blade
platform area. As the pressure ratio and air mass flow rate were increased, the average air
velocity increased, resulting in a smaller fluid time scale. Since the particle time scale was
constant, increasing the pressure ratio had the effect of increasing the Stokes number, causing
particles to exhibit ballistic behavior and deviate from following bends in the flow. As the
pressure ratio was increased, particles were more prone to inertial impaction with the blade
platform and seal pin surfaces, which lead to increased likelihood of deposition and flow
blockage. In addition, moving from the root towards the seal pin, the flow area narrowed
causing a decrease in characteristic length scale and an increase in the fluid velocity in the
streamwise direction. Thus, even for a given pressure ratio, the Stokes number increased in the
streamwise direction, with the highest Stokes number occurring at the seal pin flow area.
To theoretically predict the particle behavior, particle Stokes numbers could be defined
for the spectrum of particle sizes and fluid velocities tested in the current experiment. As the
narrowest region in the flow area, one of the clearances between the seal pin and the blade
platforms could be taken as the characteristic length scale (Lc), but the clearance is unknown and
is difficult to calculate from the experimental results due to the impossibility of separately
distilling the discharge coefficient (CD) and the seal pin flow area (Asp) from the results. It was
therefore not possible to accurately determine numerical values of Stokes numbers for this set of
experiments.
Moving through the blade platform area in the direction of coolant flow, the flow area
narrowed from a maximum near the root to the minimum area at the seal pin; therefore, even for
particle injection at a constant pressure ratio, particle behavior was anticipated to become
progressively more ballistic as particles moved towards the seal pin flow area and the fluid
velocity increased. The existence of ballistic particle behavior was confirmed through visual
observation of particle deposition and analysis of deposition samples using an environmental
scanning electronic microscope (ESEM). Figure 4.12 and Figure 4.13 show rust particle

71
deposition on the rear blade and front blade (as labeled in Figure 3.13), respectively, as they
were disassembled after performing a particle injection test. By visual inspection, it was
observed that the largest particles were only present at the larger flow area between the seal pin
and the root. Furthermore, the smallest particles, appearing as a finely ground powder, were
only present at the narrowest flow area where the seal pin contacted the front blade platform.
Figure 4.12. Larger particles deposited upstream of the seal pin in the large flow area between the seal pin and the root.
Figure 4.13. Very small particles deposited at the narrowest flow area where the seal pin contacted the front blade.
Particle size analysis was performed on ESEM particle images to further investigate the
visually observed variation in particle size with deposition location. To obtain statistical particle
size information such as the particle size distribution, analysis using a method such as laser
diffraction is preferred over ESEM; however, the small quantities of deposited particles in many
locations were insufficient for analysis with laser diffraction, so the ESEM technique was
selected because it allows for analysis of very small sample sizes. As shown in Figure 4.14,

72
deposition samples were taken from various locations on the front blade, rear blade, and seal pin
for ESEM analysis.
Figure 4.14. Deposition sample locations for ESEM particle size analysis.
Several observations can be made from visual comparisons of the magnified particle
images shown in Figure 4.15. Moving from left to right, top to bottom, the images in Figure
4.15 are ordered approximately with the flow path from the larger flow area near the root to the
narrowest flow area at the seal pin. It is evident that particle sizes and shapes in sample 4 most
closely resemble the pre-injection mixture 5 particles, and samples 2 and 3 have intermediately-
sized particles. Particles in samples 5 and 1 are not only smaller, but have relatively smooth,
rounded edges compared with the sharp, jagged edges of particles in the upstream and pre-
injection samples. This shape difference indicates significant particle erosion occurred as
particles moved through the blade platform area and thus supports the hypothesis that particles
were ballistic and tended to impact surfaces at bends in the flow path.

73
Figure 4.15. ESEM images of rust particles at 500x magnification; sample numbers correspond with labels in Figure 4.14.
A semi-quantitative analysis of particle size was performed using the ESEM images
shown in Figure 4.15. Each image was divided into an evenly spaced 3 by 3 grid for a total of 9
cells. From each cell, the most clearly defined particle was encircled, and the particle size was
determined from the diameter of the circle using the image scale. An example of the particle
sizing method is shown in Figure 4.16.

74
Figure 4.16. An ESEM image divided into 9 cells with particles encircled for size analysis.
As shown in Figure 4.17, the resulting particle sizes were plotted in histograms for each
deposition sample. The largest particles (> 100 µm) were present only in the pre-injection
particles and in sample 4 from the rear blade contour. Downstream samples from the seal pin
slot, seal pin, and seal pin contact area (samples 3, 5, and 1, respectively) had no particles larger
than 100 µm. Absence of large particles in the downstream samples from the narrowest flow
areas suggests that large particles impacted with upstream surfaces and either were deposited or
rebounded. Particle erosion and breakage occurred for the rebounding particles so that,
progressing from the root towards the seal pin, sizes of suspended particles became increasingly
smaller.
Recalling Figure 4.14, samples 4 and 2 were from similar locations on the rear and front
blades, respectively. One might expect, then, that particle sizes for these samples would have
been relatively similar. As shown in Figure 4.17, sample 2 from the front blade did not contain
particle sizes larger than 100 µm, which were present in sample 4 from the rear blade. The
absence of larger particles in the front blade sample was a result of the method used to
disassemble the test chamber. As shown in Figure 4.18, during disassembly the test chamber
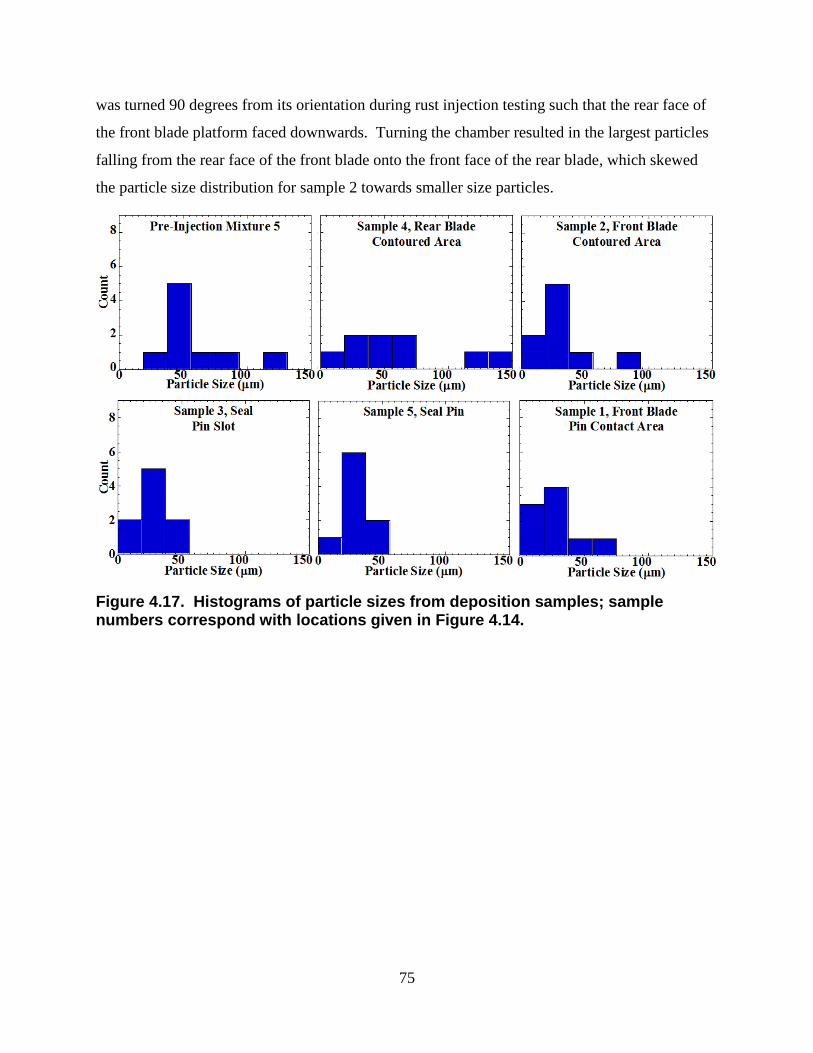
75
was turned 90 degrees from its orientation during rust injection testing such that the rear face of
the front blade platform faced downwards. Turning the chamber resulted in the largest particles
falling from the rear face of the front blade onto the front face of the rear blade, which skewed
the particle size distribution for sample 2 towards smaller size particles.
Figure 4.17. Histograms of particle sizes from deposition samples; sample numbers correspond with locations given in Figure 4.14.

76
Figure 4.18. Test chamber positions for rust injection testing and disassembly.
The observed increase in blockage with pressure ratio is opposite to the trends found in
previous studies [15-17]. For pressure ratios greater than about 1.1, these studies found that
blockage decreased with increasing pressure ratio. The explanation for their results was that the
increased flow velocities at higher pressure ratios caused particle erosion and breakage and
helped to force particles through the cooling hole geometries. Though particle erosion and
breakage occurred in the present study and increased with pressure ratio, the size of the flow area
was much smaller, so many of the broken and eroded particles were still too large to pass
through the seal pin flow area and thus were deposited, causing blockage. The variation in
blockage trends with pressure ratio suggests that the shape and size of the flow geometry play a
significant role in determining the blockage characteristics. A particle blockage trend for a
particular flow geometry may be applicable to other flow geometries provided the geometries are
similar in size and shape and the particulate matter is of similar size.
Rust amounts for particle injection tests were selected based on the sand mass loading
ratio found to yield blockages representative of field-run conditions in jet engine hardware. It is
possible that actual quantities of rust flowing through land-based engine hardware are greater
than those specified in the test matrix. To investigate effects of injecting larger amounts of rust,
an additional blockage test was performed in which quantities of rust particles were cumulatively

77
injected into engine hardware until a maximum blockage was achieved. This test was performed
at a pressure ratio of 1.15, and the results are shown in Figure 4.19. Ultimately a maximum
blockage of 74% was achieved for a total injected rust mass of 5.3 g (MLR = 30 s).
0
20
40
60
80
100
0 1 2 3 4 5 6
RFF
(%)
Total Injected Rust Mass (g)
Figure 4.19. Maximum blockage test for cumulative total rust injection of 5.3 g at a pressure ratio of 1.15.
Similar to the blockage curves shown in Figure 4.8 and Figure 4.9, the blockage curve
from this experiment clearly exhibits the trend of diminishing blockage with each additional rust
injection. To understand why blockage diminished with each successive rust injection, consider
the effects of blockage on the air and particle flow. As blockage of the flow area increases, the
mass flow rate of air is reduced, decreasing the fluid velocity everywhere in the blade platform
area. Lower fluid velocities correspond to an increase in the fluid time scale and thus a decrease
in the Stokes number, so particles are better able to follow the flow and less likely to deposit on
surfaces and cause additional blockage. In summary, as blockage of the flow area increases,
suspended particles are less likely to impact surfaces and cause further blockage, which results in
diminishing blockage with each successive rust amount injected. It has also been noted that a
significant percentage (about 80%) of injected particles remained trapped at or upstream of the
seal pin gap area. The presence of particles lying upstream of the seal pin effectively altered the
geometric shape of the blade platform area and the surface conditions to which subsequently

78
injected particles were exposed, which also played a role in diminishing the blockage with
successive rust mass injections. Finally, a 100% blockage was not achievable simply from rust
injection, which is understandable since conglomerations of rust particles are porous.

79
Chapter 5. RESULTS FROM ROTATING TESTS
Results from rust injection tests performed in the rotating test facility are presented in this
chapter. Tests were performed on a rotating coupon, called coupon 1, made to represent a
section of the full-scale engine hardware tested in the static test facility. A second rotating
coupon was also tested. Called coupon 2, this coupon was also representative of the full-scale
hardware but incorporated a different shape on the surface leading into the seal pin slot. Recall
Figure 3.18 for a schematic of the rotating test coupons. The effects of pressure ratio and
rotation were investigated, with some tests performed at a low rotating speed (Ω = 0.002) and
others performed at conditions matching the engine centrifugal acceleration (Ω = 1).
5.1 Rust Deposition
Significant quantities of rust particles deposited in the test coupons. In contrast with the
static test facility, a measurable amount of rust also deposited in the particle feed pipe and on
surfaces upstream of the test coupons. See Figure 5.1 for locations of the rust deposition inside
the chamber. After each rust injection test, rust particles were removed from the test facility by
tapping, brushing, and blowing with compressed air. The mass and location of collected
particles was recorded. Generally more than 95% of the total injected rust mass was collected
from the particle feed pipe, diffuser plate, chamber walls and coupon flanges, and from inside the
test coupons. Deposition inside the test coupons included all rust deposited on the contoured
surfaces leading into the seal pin slot and rust surrounding the seal pin. Very little rust passed
through the test coupons to the atmospheric downstream chamber.
For coupon 1, the distribution of rust is given for multiple tests at PRrot = 1.6 in Figure
5.2 and Figure 5.3, for Ω = 0.002 and Ω = 1, respectively. For tests at Ω = 0.002, rust particles
depositing in the test coupons divided nearly evenly among the three coupons. This result was
expected since the flow through each coupon was similar and the particle diffuser plate was
relatively symmetric. A similar fraction of the total injected rust entered the test coupons at Ω =
1, however, the rust deposited predominantly in one or two of the coupons. This trend indicated
that, at high rotating speeds, particles were more sensitive to slight asymmetry in the diffuser
plate or variation in installation of the diffuser plate.

80
Figure 5.1. Rust deposition locations inside the rotating chamber.
0
20
40
60
80
100
Test 1 Test 2 Test 3
missing rust
particle feed
chamber
diffuser plate
coupon 1-1
coupon 1-2
coupon 1-3
% of Total
Injected
Rust
Figure 5.2. Rust deposition by location for coupon 1, PRrot = 1.6, Ω = 0.002.

81
0
20
40
60
80
100
Test 1 Test 2 Test 3 Test 4 Test 5
missing rust
particle feed
chamber
diffuser plate
coupon 1-1
coupon 1-2
coupon 1-3
% of Total
Injected
Rust
Figure 5.3. Rust deposition by location for coupon 1, PRrot = 1.6, Ω = 1.
Rust particles initially deposited on the trailing contoured surface leading into the seal pin
contact area. As more rust was injected, the deposit grew towards the seal pin and leading
contoured surface and in some cases covered part of the seal pin. The more rust deposited in a
part, the more it surrounded the seal pin and deposited in the seal pin slot, which can be seen in
Figure 5.4.
Figure 5.4. Rust deposition in coupon 1 after at test performed at Ω = 1, PRrot = 1.6 (outward radial view).

82
Comparison of Figure 5.5 with Figure 5.6 illustrates similarity in the pattern of the rust
deposition for both coupons at Ω = 0.002 and Ω = 1, however certain aspects of the deposition
were affected by the increased centrifugal acceleration at Ω = 1. In both coupons, surfaces
leading the seal pin were relatively clean at Ω = 0.002 but were coated with a thin layer of very
fine rust particles at Ω = 1. Inside the spinning chamber, the motion of the air was similar to that
of a solid body rotating at the speed of the chamber. Particles entering this air were subjected to
forces due to centrifugal and coriolis accelerations. The rotation accelerated larger, more
massive particles radially outward so rapidly that the coriolis acceleration had little effect in
increasing their circumferential velocity. Smaller particles, on the other hand, were less-rapidly
accelerated in the outward radial direction such that there was more time for the coriolis
acceleration to increase their circumferential velocity towards that of the fluid. In addition,
smaller particles tended to follow the flow more readily since the time scale for their momentum
change was much shorter. For these reasons, only the smaller particles deposited on the leading
surfaces while the larger particles formed the bulk of the deposition on the trailing surfaces.
Figure 5.5. Rust deposition in coupon 1 after tests performed at PRrot = 1.6 (scale in inches).

83
Due to the increased centrifugal acceleration at Ω = 1, the particles compacted to form
hardened conglomerations as large as 12 mm, which is illustrated in on the right-hand side of
Figure 5.5 and Figure 5.6. After tests at Ω = 0.002, deposited particles were relatively loose and
could be easily removed from the parts by gentle tapping and brushing. At Ω = 1, vigorous
tapping and brushing was required to remove particles from the parts, and large conglomerations
of particles remained even after being removed. Recalling Figure 4.5, this effect was similar to
what was observed in initial experiments where particles were spun in a sample tube at Ω = 1.
Figure 5.6. Rust deposition in coupon 2 after tests performed at PRrot = 1.6 (scalen in inches).
Though it was difficult to remove the seal pin without disturbing deposition on the rough
slot surface, at Ω = 1 particles were sufficiently compacted so that some of the rust remained on
the slot surface after removing the seal pin. Deposition on the rough slot surface of coupon 1
appeared similar to what was observed on a blade removed from field service, as shown in

84
Figure 5.7. The similarity of deposition on coupon 1 and the field service hardware was
anticipated since coupon 1 was similar in shape to the engine hardware.
Figure 5.7. Rust deposition in coupon 1 after rust injection test at Ω = 1 compared with a blade removed from field service (seal pins removed) [1].
5.2 Flow Blockage
To investigate the effect of pressure ratio under rotating conditions, rust was injected at
pressure ratios of 1.15, 1.6, and 1.8 for coupon 1 at Ω = 0.002. Results for these tests are
provided in Figure 5.8, where the deposited rust mass is based on the proportion of total injected
rust found in the test coupons at the end of the test and thus excludes rust deposited elsewhere in
the test facility. Flow blockage was independent of pressure ratio. This finding is in contrast
with the results from the static testing, for which blockage increased with pressure ratio due to
increasingly ballistic particle behavior. Ballistic particle behavior was also observed in the
rotating tests, however the centrifugal forces governed this behavior, dominating any effect from
the increased fluid velocity at higher pressure ratios.

85
0
5
10
15
20
25
30
0 1 2 3 4 5 6 7
PRrot
= 1.15
1.6
1.8
RFF
(%)
Deposited Rust Mass (g)
Figure 5.8. Flow blockage as a function of deposited rust mass, coupon 1, Ω = 0.002.
As shown in Figure 5.9, flow blockage was similar for coupons 1 and 2 at Ω = 0.002 and
for coupon 1 at Ω = 1. There was a considerable increase in blockage for coupon 2 at Ω = 1.
Recall from Figure 3.27 that, although coupons 1 and 2 were created to have identical flow areas,
coupon 2 exhibited an increased baseline flow function curve over all pressure ratios. This
increase in flow function was a result of the smooth transition into the seal pin slot, which acted
to reduce flow losses and more effectively pump fluid through the gap between the pin and the
rough slot surface. Similarly, when rust particles were injected, this smooth transition directed
particles into the contact area between the seal pin and the rough slot surface. At Ω = 1, the
coriolis acceleration delivered smaller particles to the leading side of the pin, resulting in
significantly increased blockage for coupon 2. In coupon 1, the lip at the leading edge of the seal
pin slot acted to shield the contact area between the pin and the slot from small particles
delivered to the leading side of the seal pin at Ω = 1. For this reason, coupon 1 exhibited less
flow blockage at Ω = 1 relative to coupon 2.

86
0
10
20
30
40
50
0 1 2 3 4 5 6 7 8
coupon 1, = 0.002
coupon 1, = 1
coupon 2, = 0.002
coupon 2, = 1
engine hardware, static
RFF
(%)
Deposited Rust Mass (g)
Figure 5.9. Flow blockage as a function of deposited rust mass, coupons 1 and 2, Ω = 0.002 and Ω = 1, PRrot = 1.6.
The range of flow blockage for the static tests is shown on the mantissa of Figure 5.9 for
reference. As discussed in Section 3.12, the injected rust mass was dramatically increased in the
rotating tests in order to obtain flow blockage comparable to the static tests. More rust was
required in the rotating tests since deposition began primarily on the trailing contoured surface.
In contrast, the absence of rotation in the static tests resulted in particles depositing more closely
to the seal pin contact areas. One test was performed in the rotating study to determine how
much of the rust deposited in the test coupons was contributing to the flow blockage. Flow
blockage was measured after rust was injected in coupon 1 at Ω = 0.002. The three test coupons
were then removed from the chamber, and particles not immediately near the seal pin were
removed from the parts, taking care not to disturb the seal pin and particles deposited nearby.
One test coupon is shown in Figure 5.10 before and after removal of particles not immediately
near the seal pin. The test coupons were then reinstalled in the chamber, and flow blockage was
again measured at Ω = 0.002. The flow blockage remained constant after the removal of 96% of
the rust particles deposited inside the part. This finding indicated that only particles depositing at
the seal pin contact area caused flow blockage. For consistency, however, flow blockage results
were reported in terms of the entire rust mass deposited in the parts.

87
Figure 5.10. Coupon 1 before and after removal of rust deposited on trailing contoured surface.

88
Chapter 6. CONCLUSIONS
Rust deposition at the axial seal pin was investigated through particle injection
experiments performed on static blades from a gas turbine and on rotating coupons similar to a
section of the blades. Early on in this study, rust particles composed primarily of red iron oxide
were characterized in separate experiments at temperatures and centrifugal accelerations
representative of gas turbine conditions. Rust particles were unaffected in their physical
appearance and size distribution when heated up to 850˚C, the first row blade root temperature.
After spinning at 12,100 times gravitation acceleration, conditions representative of the turbine,
rust particles exhibited significant compaction to twice their loose bulk density. These findings
indicated that, for particles entrained in air flow near the axial seal pin, centrifugal acceleration
plays a significant role in deposition while the effect of temperature is minimal.
In the static test facility, a predicted flow function based on one-dimensional isentropic
flow relations was found to under-predict the flow function over pressure ratios ranging from
1.05 to 1.8. The mismatch between the predicted and measured flow functions was partially a
result of using an assumed flow area for the predicted flow function but also reflected the
limitations of one-dimensional analysis in modeling flow losses. In the experimental data, the
choking behavior seen in the one-dimensional analysis was not observed as the pressure ratio
neared the critical value of 1.89. This trend indicated that viscous losses and multi-dimensional
flow effects were significant and varied with pressure ratio due to the non-ideal entrance and the
small size of the flow area. The constant discharge coefficient included in the one-dimensional
analysis was not sufficient to account for the losses in the seal pin flow area. From these results,
it can be concluded that one-dimensional analysis does not accurately model the physics of flow
through very small and uniquely shaped flow geometries such as the area around the axial seal
pin.
Rust injection experiments performed in the static facility yielded flow blockages up to
74%, showing that particle deposition plays a significant role in reducing coolant flow at the
axial seal pin. The pressure ratio strongly influenced deposition under non-rotating conditions.
Increasing the pressure ratio from 1.05 to 1.6 increased the flow blockage by 15% to 20% for the
larger rust masses tested. Particle breakage and erosion were observed in rust deposits, which
indicated many particles tended to impact surfaces due to their inability to follow flow

89
streamlines. Visual observation and ESEM particle size analysis revealed that only the smallest
particles were deposited in the narrowest flow areas at the seal pin, which underscores the
challenge of preventing particle deposition in the seal pin slot since the smallest particles are the
most difficult to filter from the cooling air.
For rotating tests performed even at very low centrifugal acceleration relative to engine
conditions, the effect of pressure ratio was negligible. At Ω = 0.002, flow blockage was similar
for pressure ratios of 1.15, 1.6, and 1.8. Rotation caused particles to initially build up on the
trailing contoured surface of the test coupons and then gradually move towards the seal pin as the
deposit grew. Because of this effect, the mass loading ratio was increased from about 0.5 s in the
static tests to as much as 28 s in the rotating tests to yield comparable flow blockage. Both
coupons 1 and 2 exhibited similar flow blockages up to about 25% for rust injected at Ω = 0.002.
Tests performed on the rotating test coupons at Ω = 1 were most representative of turbine
conditions and provided an improved understanding of particle behavior at the seal pin. At Ω =
1, particles were compacted into large conglomerations with the potential to inhibit motion of the
seal pin. Additionally, the increased coriolis acceleration delivered smaller particles to the
region leading the seal pin. For this reason, the smooth transition incorporated into coupon 2
resulted in increased flow blockage at Ω = 1 as smaller particles and air were more easily
directed into the flow area between the seal pin and the rough slot surface. The smooth transition
in coupon 2 was designed to eliminate the possibility of particles hanging up between the leading
edge of the seal pin and the blade platform, however the increase in flow blockage indicated that
more particles deposited on the leading side of the seal pin. Clearly this effect was opposite of
the design goal to reduce particle deposition near the seal pin.
Based on the results from rotating tests, an alternative blade platform design is proposed
in Figure 6.1, in which cross-sectional views of the seal pin and blade platforms are shown. The
original design is the same as the engine hardware tested in the static facility and coupon 1 tested
in the rotating facility. The proposed modification is the extension of the blade platform surface
around the leading side of the seal pin, creating a more circuitous flow path to decrease the
likelihood of particles being delivered to the leading side of the seal pin. Since rotating tests
have indicated the dominance of ballistic particle motion in the outward radial direction, it is
anticipated that, with the proposed modification, particles would be unable to follow the flow
path to the leading side of the seal pin. The effect of this modification on particle deposition and

90
flow blockage should be experimentally analyzed prior to implementation. Computational
analysis could also be performed in conjunction with experiments to improve understanding of
the flow and particle behavior.
Figure 6.1. Original blade platform design and proposed modification.

91
REFERENCES
[1] Mount, Jonathan, “STG6-5000F Turbine Row 1 Blade Liberation,” Siemens TR-05161,
Siemens Power Generation, 2005.
[2] Blong, R.J. Volcanic Hazards, A Sourcebook on the Effects of Explosions. Sydney:
Academic Press Australia, 1984.
[3] Brantley, Steven R. The Eruption of Redoubt Volcano, Alaska, December 14, 1989 – August
31, 1990. Washington: U.S. Government Printing Office, 1990.
[4] Katili, J.A., and Adjat Sudradjat. Galunggung, The 1982 – 1983 Eruption. Indonesia:
Volcanological Survey of Indonesia, 1984.
[5] Dovali, Francisco, “Rotor Air System Particulate Testing at AEC Vann Unit 2,” Siemens
EC-06171, Siemens Power Generation, 2006.
[6] Friedlander, Sheldon. K. Smoke, Dust, and Haze: Fundamentals of Aerosol Dynamics.
New York: Oxford University Press, 2000.
[7] Dunn, M.G., C. Padova, J.E. Moller, and R.M. Adams, “Performance Deterioration of a
Turbofan and a Turbojet Engine Upon Exposure to a Dust Environment,” Journal of
Engineering for Gas Turbines and Power, vol. 109, July, pp. 336-343, 1987.
[8] Batcho, P.F., J.C. Moller, C. Padova, and M.G. Dunn, “Interpretation of Gas Turbine
Response Due to Dust Ingestion,” Journal of Engineering for Gas Turbines and
Power, vol. 109, July, pp. 344-352, 1987.
[9] Dunn, M.G., C. Padova, and R.M. Adams, “Operation of Gas Turbine Engines in Dust-
Laden Environments,” presented at AGARD-Advanced Technology of Aero Engine
Components, Paris, May 4-8, 1987.
[10] Kim, J., M.J. Dunn, A.J. Baran, D.P. Wade, and E.L. Tremba, “Deposition of Volcanic
Materials in the Hot Sections of Gas Turbine Engines,” Journal of Engineering for Gas
Turbines and Power, vol. 115, pp. 641-651, 1993.
[11] Weaver, M.M., M.G. Dunn, and T. Heffernan, “Experimental Determination of the
Influence of Foreign Particle Ingestion on the Behavior of Hot-Section Components
Including Lamilloy,” 96-GT-337.

92
[12] Wenglarz, R.A. and R.G. Fox, Jr., “Physical Aspects of Deposition from Coal-Water Fuels
under Gas Turbine Conditions,” Journal of Engineering for Gas Turbines and Power,
vol. 112, pp. 9-14, 1990.
[13] Jensen, Jared W., Sean W. Squire, Jeffrey P. Bons, and Thomas H. Fletcher, “Simulated
Land-Based Turbine Deposits Generated in an Accelerated Deposition Facility,”
Journal of Turbomachinery, vol. 127, pp. 462-470, 2005.
[14] Hamed, A. and W. Tabakoff, “Erosion and Deposition in Turbomachinery,” Journal of
Propulsion and Power, vol. 22, no. 2, Mar.-Apr., pp. 350-360, 2006.
[15] Walsh, W.S., K.A. Thole, Chris Joe, “Effects of Sand Ingestion on the Blockage of Film-
Cooling Holes,” GT2006-90067.
[16] Land, Camron C., Karen A. Thole, and Chris Joe, “Considerations of a Double-Wall
Cooling Design to Reduce Sand Blockage,” Journal of Turbomachinery, vol. 132, no.
3, pp. 031011-1 - 031011-8, 2010.
[17] Cardwell, N.D., K.A. Thole, S.W. Burd, 2008, “Investigation of Sand Blocking within
Impingement and Film Cooling Holes,” GT2008-51351.
[18] Schneider, O., H.J. Dohmen, and A.W. Reichert, “Experimental Analysis of Dust
Separation in the Internal Cooling Air System of Gas Turbines,” GT2002-30240.
[19] Schneider, O., H.J. Dohmen, F.-K. Benra, and D. Brillert, “Investigations of Dust
Separation in the Internal Cooling Air System of Gas Turbines,” GT2003-38393.
[20] Schneider, O., H.J. Dohmen, F.-K. Benra, and D. Brillert, “Dust Separation in a Gas
Turbine Pre-Swirl Cooling Air System: A Parameter Variation,” GT2004-53048.
[21] Haider, A. and O. Levenspiel, “Drag Coefficient and Terminal Velocity on Non-Spherical
Particles,” Powder Technology, vol. 58, pp. 63-70, 1989.
[22] Laurello, Vincent. (2009, June 26). RE: Rust Characterization Meeting - Notes and
Presentation File [personal email].
[23] Santisteban, Vanessa. (2009, September 15). RE: Siemens Rust Characterization Project -
Table of Parameters [personal email].
[24] Weaver, S.A., “Heat Transfer and Pressure Drop Augmentation in Micro Channels with Pin
Fins,” M.S. Thesis, The Pennsylvania State University, University Park, PA, 2010.
[25] “Wyko Surface Profilers Technical Reference Manual,” Veeco Metrology Group.

93
[26] Tham, Kok-Mun. (2010, May 19). RE: Rust Characterization Meeting Follow-up [personal
email].
[27] Maeng, D.J., J.S. Lee, R. Jakoby, S. Kim, and S. Wittig, “Characteristics of Discharge
Coefficient in a Rotating Disk System,” Journal of Engineering for Gas Turbines and
Power, vol. 121, October, pp. 663-669, 1999.
[28] Zucrow, Maurice J., and Joe D. Hoffman. Gas Dynamics, Vol. 1. New York, John Wiley,
1976.
[29] Compressed Gas Handbook, NASA Office of Technology Utilization, Scientific and
Technical Information Division, Washington, D.C., 1969.
[30] Engineering Sciences Data Unit, “Pressure losses across orifice plates, perforated plates,
and thick orifice plates in ducts,” Item no. 81039, London: Engineering Sciences Data
Unit, 1981.
[31] Voss, L.R., and R.N. Hollyer, Jr., “Nozzles for Air Flow Measurement,” The Review of
Scientific Instruments, vol. 34, no. 1, pp. 70-74, 1963.
[32] Tang, S.P. and J.B. Fenn, “Experimental Determination of the Discharge Coefficients for
Critical Flow through and Axisymmetric Nozzle,” AIAA Journal, vol. 16, no. 1, pp. 41-
46, 1978.
[33] Kayser, John C. and Robert L. Shambaugh, “Discharge Coefficients for Compressible Flow
through Small-Diameter Orifices and Convergent Nozzles,” Chemical Engineering
Science, vol. 46, no. 7, pp. 1697-1711, 1991.
[34] White, Frank M. Fluid Mechanics, 3rd ed. New York: McGraw Hill, 1994.
[35] Beckwith, Thomas G., Roy D. Marangoni, and John H. Lienhard V. Mechanical
Measurements, Fifth Ed. New York: Addison Wesley, 1993.
[36] Crowe, Clayton T., and Efstathios E. Michaelides. Multiphase Flow Handbook. Taylor
and Francis Group, 2006.

94
Appendix A. CALCULATIONS FOR STATIC TESTS
Nomenclature
General
Ai LFE calibration constants, i = 0,1,2
DP differential pressure
FF flow function: 0
0
P
TmFF
FF0 baseline static flow function from curve fit of flow data for clean engine hardware
LFE laminar flow element
mi coefficient for baseline flow function curve fit, i = 0,1,2,3…
m mass flow rate
P0 total pressure upstream of the nozzle or seal pin flow area
p static pressure
PR pressure ratio: b
0
p
PPR
R gas constant
RFF reduction in flow function evaluated at blocked pressure ratio:
PR0FF
FF1RFF
T0 total temperature upstream of the nozzle or seal pin flow area
T temperature
V volumetric flow rate
Subscripts
atm atmospheric
b evaluated at the downstream chamber
sp evaluated across the seal pin flow area in the test chamber
g gage pressure
LFE evaluated upstream of the LFE
std standard parameter; Tstd = 21˚C, pstd = 101 kPa
0 total parameter evaluated at the upstream chamber (except when used with FF)
Greek
µ dynamic viscosity
ρ density
Flow Function Calculation
The fundamental measured parameters for the experiment were TLFE, pLFE, patm, DPLFE,
T0, P0, and DPsp. Recall Figure 3.7 for a schematic of the static test facility. These measured
parameters were used to calculate the flow function (FF) and pressure ratio (PR) for each test.

95
Air temperatures upstream of the LFE (TLFE) and at the chamber inlet (T0) were measured using
E-type thermocouples. The air dynamic viscosity (µ) was calculated in micropoise using
Equation A.1, which requires TLFE in ˚F.
8.1
67.459T4.110
8.1
67.459T58.14
LFE
2
3
LFE
(A.1)
The upstream gage pressure at the LFE (pLFE,g) was measured using an Omegadyne
PX309-100G5V gage pressure transducer rated for 0-690 kPa gage (0-100 PSIG). Atmospheric
pressure (patm) measured with a Setra model 370 barometer was added to the LFE upstream gage
pressure to obtain the absolute upstream LFE pressure (pLFE). The air density upstream of the
LFE (ρLFE) was calculated from the ideal gas relation as shown in Equation A.2.
LFE
LFE
LFETR
p
(A.2)
The air volumetric flow rate was measured using a Meriam Instrument LFE rated for a
maximum air flow rate of 750 cm3/s (1.6 SCFM) at standard conditions. Standard temperature
and pressure were defined as 21˚C (70˚F) and 101 kPa (14.7 PSIA), respectively. Differential
pressure across the LFE was measured using a variable-diaphragm Validyne model DP103
differential pressure transducer. The diaphragm was selected based on the volume flow rate and
differential pressure range for a particular test.
As provided in the LFE manual [1], Equation A.3 was used to calculate the actual air
volumetric flow rate at the LFE ( LFEV ) with units of actual ft3/min, where density (ρLFE) has
units of lb/ft3, differential pressure (DPLFE) has units of in. H2O at 4˚C, and viscosities (µLFE and
µstd) have units of micropoise. The LFE calibration coefficients (A0, A1, and A2) are given in
Table A.1.
LFE
std
LFE
LFE
2
2
LFE
LFELFE22
LFE
LFELFE10LFE
DPDPA
DPAAV (A.3)
Table A.1. Laminar Flow Element Calibration Coefficients
A0 3.70704E01
A1 -9.58300E04
A2 1.01032E08
96
The air mass flow rate ( m ) was then calculated from the density (ρLFE) and actual
volume flow rate ( LFEV ) using Equation A.4.
LFELFE Vm (A.4)
The upstream chamber total pressure (P0) was measured using an Omegadyne model
PX319-100A5V absolute pressure transducer rated for 0-690 kPa (0-100 PSIA). The upstream
chamber was sufficiently large to be considered as a plenum, so the measured static pressure was
equal to the total pressure. Ultimately the mass flow rate ( m ), upstream chamber total
temperature (T0), and upstream chamber total pressure (P0) were used to calculate the
dimensional flow function (FF) given by Equation A.5. The flow function was reported with
units of m-s-K1/2
.
0
0
P
TmFF
(A.5)
The seal pin differential pressure (DPsp) was measured using a variable-diaphragm
Validyne model DP15 differential pressure transducer. The diaphragm was selected based on the
pressure ratio for a particular test. The upstream total to downstream static pressure ratio (PR)
was calculated using Equation A.6.
b
0
sp0
0
p
P
DPP
PPR
(A.6)
Blockage Calculation
The reduction in flow function (RFF) was calculated using Equation A.7, where both the
clean baseline (FF0) and blocked flow functions were evaluated at the blocked pressure ratio.
PR0FF
FF1RFF (A.7)
Recalling Figure 3.25, injecting rust particles resulted in a decrease in flow function (FF)
accompanied by a slight change in pressure ratio (PR). Due to the dependency of flow function
on pressure ratio, a polynomial curve fit of flow function versus pressure ratio for clean baseline
conditions was used to evaluate the clean flow function (FF0) at the blocked pressure ratio. This
baseline flow function was calculated using Equation A.8, for which the coefficients for are
provided in Table A.2.

97
6
6
5
5
4
4
3
3
2
2100 PRmPRmPRmPRmPRmPRmmFF (A.8)
Table A.2. Coefficients for Static Baseline Flow Function
m0 1.196024E-06
m1 -8.112001E-06
m2 1.812999E-05
m3 -1.935233E-05
m4 1.093568E-05
m5 -3.166676E-06
m6 3.710954E-07
References
[1] Meriam Process Technologies, “Laminar Flow Elements Installation and Operation
Instructions,” File No. 501:440-11.

98
Appendix B. CALCULATIONS FOR ROTATING TESTS
Nomenclature
General
DP differential pressure
mi coefficient for baseline flow function curve fit, i = 0,1,2,3…
P0 total pressure upstream of the nozzle or seal pin flow area
p static pressure
PRrot rotational pressure ratio
r rotating chamber outer radius
R gas constant
Trot rotational temperature
T temperature
v velocity
Subscripts
b evaluated just downstream of the test coupons
w measured at the inside diameter of the ballistic wall
sp evaluated across the seal pin flow area in the rotating chamber
0 total parameter upstream of the rotating chamber
Greek
ω rotational speed
ρ density
Overview
For the rotating tests, the measurement equipment and fundamental measured parameters
were the same as for the static tests except for the addition of the rotational speed measurement.
Recall Figure 3.9 for a schematic of the rotating test facility. As discussed in Section 3.7,
however, rotational forms of the flow function and pressure ratio were used to account for
additional energy imparted to the flow due to centrifugal acceleration. A mathematical
correction was applied to the measured differential pressure across the rotating chamber to
account for the pressure difference between the downstream pressure taps in the ballistic wall
and the exit of the test coupons. The calculation of the chamber differential pressure is provided
in the following section.
The reduction in flow function was calculated as in Equation A.7 using the rotational
forms of the flow function and pressure ratio. Similar to the static tests, polynomial curve fit
equations were used to calculate the baseline flow function for evaluating flow blockage at a

99
constant pressure ratio. The baseline flow function for Ω = 0.002 was calculated using Equation
B.1, for which coefficients are provided in Table B.1. Equation B.2 was used to calculate the
baseline flow function for Ω = 1, with coefficients for coupons 1 and 2 provided in Tables B.2
and B.3, respectively.
3
rot3
2
rot2rot10rot,0 PRmPRmPRmmFF
6
rot6
5
rot5
4
rot4 PRmPRmPRm (B.1)
Table B.1. Baseline Flow Function Coefficients for Coupons 1 and 2, Ω = 0.002
m0 -5.168309E-06
m1 2.058363E-05
m2 -3.422925E-05
m3 3.040276E-05
m4 -1.517089E-05
m5 4.026809E-06
m6 -4.438244E-07
4
rot4
3
rot3
2
rot2rot10rot,0 PRmPRmPRmPRmmFF (B.2)
Table B.2. Baseline Flow Function Coefficients for Coupon 1, Ω = 1
m0 -3.879101E-07
m1 8.166895E-07
m2 -6.173690E-07
m3 2.141787E-07
m4 -2.830932E-08
Table B.3. Baseline Flow Function Coefficients for Coupon 2, Ω = 1
m0 -5.926693E-07
m1 1.232554E-06
m2 -9.050933E-07
m3 3.028602E-07
m4 -3.846552E-08
Chamber Differential Pressure Correction
The downstream pressure tap used to measure differential pressure across the test
coupons was installed flush with the inside diameter of the ballistic wall, about 8 cm radially
100
outward from the outer diameter of the chamber and the exit of test coupons. It was therefore
necessary to correct for the pressure difference between the measured pressure at the ballistic
wall (pw) and the desired back pressure at the exit to the test coupons (pb). Flow outside the
rotating chamber was assumed to behave as a free vortex for which the Bernoulli equation can be
applied everywhere. The Bernoulli equation written for locations just downstream of the test
coupons and at the ballistic is given in Equation B.3. The no-slip condition was assumed,
resulting in the circumferential velocity matching that of the ballistic wall and the chamber outer
diameter at each respective location. Incompressible flow with constant density was also
assumed.
b
w
2
b
b
b p
2
vp
(B.3)
Rewriting the circumferential velocity at the test coupon exit in terms of the container
outside radius (r) and rotating speed (ω) and solving for the pressure at the test coupon exit
yields Equation B.4.
2
bwb r2
1pp (B.4)
The downstream density was approximated from the ideal gas relation as in Equation
B.5.
w
w
bTR
p
(B.5)
Recall that chamber differential pressure transducer was connected on the high side to the
pressure tap just upstream of the rotary coupling and on the low side to the pressure tap at the
ballistic wall. In this configuration, the differential pressure between the chamber upstream and
the ballistic wall (DPw) was measured as given in Equation B.6.
w0w pPDP (B.6)
The desired differential pressure was the differential pressure across the test coupon seal
pins (DPsp), which was calculated using Equation B.7. Nominal values for the correction term in
Equation B.7 are provided in Table B.4.
2
bwsp r2
1DPDP (B.7)

101
Table B.4. Pressure Correction Nominal Values
Pressure Correction, 1/2·ρ(r·ω)2
Ω PRrot Nominal Value
(kPa) % of DPw
0.002
1.15 0.018 0.12
1.6 0.016 0.03
1.8 0.016 0.02
1
1.3 7.3 58
1.6 7.3 19
2.1 7.3 8.7
The rotational pressure ratio across the test coupons was then calculated from Equation
B.8, where P0 and T0 are, respectively, the measured upstream total pressure and temperature.
Recall Equation 3.19 for the definition of the rotational temperature (Trot).
1
0
rot
sp0
0rot
T
T1
DPP
PPR
(B.8)

102
Appendix C. UNCERTAINTY ANALYSIS FOR STATIC TESTS
Nomenclature
General
DP differential pressure
FF flow function: 0
0
P
TmFF
FF0 baseline static flow function from curve fit of flow data for clean engine hardware
LFE laminar flow element
m mass flow rate
mrust rust mass
MLR rust mass loading ratio: m
mMLR rust
P0 total pressure upstream of the nozzle or seal pin flow area
p static pressure
PR pressure ratio: b
0
p
PPR
RFF reduction in flow function evaluated at blocked pressure ratio:
PR0FF
FF1RFF
T0 total temperature upstream of the nozzle or seal pin flow area
T temperature
Ubi bias uncertainty
Up precision uncertainty
U total parameter uncertainty, various subscripts
Subscripts
atm atmospheric
b evaluated at the downstream chamber
g gage pressure
LFE evaluated upstream of the LFE
sp evaluated across the seal pin flow area in the test chamber
Flow Function Uncertainty
An uncertainty analysis was performed for the flow function (FF), which was calculated
from experimental data as shown in Equation C.1. The functional dependence of flow function
on measured parameters is given in Equation C.2 for a given flow area. Details of the mass flow
rate ( m ) calculation can be found in Appendix A.
0
0
P
TmFF
(C.1)

103
)T,T,DP,P,p,p(fFF 0LFELFE0g,LFEatm (C.2)
Measurement error includes bias error, which causes the measured value to vary from the
actual value by a fixed amount for all measurements, and precision error, which causes variation
in the measured value for repeated measurements of the same actual value. When accounting for
the uncertainty of a measured value, bias and precision errors are considered, respectively, as the
bias uncertainty (Ubi) and precision uncertainty (Up). The total uncertainty (U) for a measured
value was determined from Equation C.3. From this point forward, all uncertainties represent
total uncertainties.
2
p
2
bi UUU (C.3)
The partial derivative method as described in [1] was used to determine propagation of
uncertainty from the measured parameters to the overall flow function uncertainty (UFF), which
is given in Equation C.4. The overall flow function uncertainty was previously reported in Table
3.11.
2
0P
0
2
g,pLFE
g,LFE
2
patm
atm
FF UP
FFU
p
FFU
p
FFU
2
1
2
0T
0
2
TLFE
LFE
2
DPLFE
LFE
UT
FFU
T
FFU
DP
FF
(C.4)
Parameter uncertainties and the overall flow function uncertainty (UFF) were calculated at
three pressure ratios, namely PR = 1.05, 1.15, and 1.6. The relative contribution of each
measured parameter towards the overall flow function uncertainty is given in Figure C.1 for
these three pressure ratios. The gage pressure upstream of the LFE (pLFE,g), the total upstream
chamber pressure (P0), and the LFE upstream temperature (TLFE) measurements were the largest
contributors to the overall flow function uncertainty. The uncertainties of all the measured
parameters were driven by the instrument bias uncertainties. For each measured parameter used
to calculate the flow function, the same instrument was used for all tests, resulting in a constant
bias uncertainty. Increasing the pressure ratio (and thus pLFE,g, P0, and DPLFE) diminished the
proportion of bias uncertainty to the measured value and thus reduced the relative contributions
of pLFE, P0, and DPLFE to the overall flow function uncertainty. The LFE upstream temperature
(TLFE) and chamber upstream temperature (T0) were approximately constant for all experiments,

104
and therefore their relative contributions to overall flow function uncertainty increased with
pressure ratio because of the diminishing contributions of pLFE, P0, and DPLFE. Compared with
T0, TLFE contributed significantly more to the total flow function uncertainty due to its use in a
squared term when calculating the actual air volume flow rate.
0
10
20
30
40
50
patm
pLFE,g
P0
DPLFE
TLFE
T0
PR = 1.05
1.15
1.6
% Contribution
to Overall
FF Uncertainty
Figure C.1. Relative contributions of measured parameters to the overall flow function uncertainty.
Tables C.1, C.2, and C.3 summarize parameter uncertainties and their relative
contributions to the overall flow function uncertainty (UFF) for particular tests at each of the three
pressure ratios studied.
Table C.1. Flow Function Parameter Uncertainties for PR = 1.05
Parameter Value Uncertainty Units % Contribution to UFF
patm 97.6 ± 0.022 kPa 0.005
pLFE,g 4.27 ± 1.72 kPa 30
P0 102 ± 1.72 kPa 30
DPLFE 0.165 ± 0.002 kPa 18
TLFE 29.4 ± 1.70 ˚C 21
T0 29.1 ± 1.70 ˚C 0.83
FF 1.21E-08 ± 3.74E-10 m-s-K1/2

105
Table C.2. Flow Function Parameter Uncertainties for PR = 1.15
Parameter Value Uncertainty Units % Contribution to UFF
patm 97.6 ± 0.022 kPa 0.005
pLFE,g 14.48 ± 1.72 kPa 33
P0 113 ± 1.72 kPa 33
DPLFE 0.376 ± 0.002 kPa 4.7
TLFE 30.2 ± 1.70 ˚C 28
T0 30.3 ± 1.70 ˚C 1.1
FF 2.74E-08 ± 7.28E-10 m-s-K1/2
Table C.3. Flow Function Parameter Uncertainties for PR = 1.6
Parameter Value Uncertainty Units % Contribution to UFF
patm 97.6 ± 0.022 kPa 0.004
pLFE,g 58.4 ± 1.72 kPa 26
P0 156 ± 1.72 kPa 28
DPLFE 0.734 ± 0.002 kPa 1.9
TLFE 33.1 ± 1.70 ˚C 42
T0 32.4 ± 1.70 ˚C 1.7
FF 5.19E-08 ± 1.09E-09 m-s-K1/2
Reduction in Flow Function Uncertainty
An uncertainty analysis was also performed on the pressure ratio (PR) and reduction in
flow function (RFF), defined in Equations C.5 and C.6, respectively. The functional dependence
of RFF on the flow function at blocked conditions and measured parameters chamber upstream
pressure (P0) and seal pin differential pressure (DPsp) is given in Equation C.7.
sp0
0
DPP
PPR
(C.5)
PR0FF
FF1RFF (C.6)
)DP,P,FF(fRFF sp0 (C.7)
Uncertainty for the pressure ratio (UPR) and reduction in flow function (URFF) were
calculated using the partial derivative method as given in Equations C.8 and C.9, respectively.

106
Uncertainty values for pressure ratio and reduction in flow function were previously reported in
Table 3.11.
2
DPsp
sp
2
0P
0
PR UDP
PRU
P
PRU
(C.8)
2
DPsp
sp
2
0P
0
2
FFRFF UDP
RFFU
P
RFFU
FF
RFFU
(C.9)
The relative contributions of the flow function (FF), upstream chamber pressure (P0), and
chamber differential chamber pressure (DPsp), all evaluated at blocked conditions, to the overall
RFF uncertainty are given in Figure C.2 for the cases of PR = 1.05, 1.15, and 1.6. For all three
cases, the main contributor to the RFF uncertainty was the uncertainty in the flow function
measured at blocked conditions. Contributions to uncertainty of FF measured at blocked
conditions are similar to those given for FF in Figure C.1.
0
20
40
60
80
100
FF P0
DPsp
PR = 1.05
1.15
1.6
% Contribution
to Overall
RFF Uncertainty
Figure C.2. Relative contributions of parameters to the overall reduction in flow function uncertainty.
Tables C.4, C.5, and C.6 summarize the parameter nominal values used in the RFF
uncertainty calculation along with their uncertainties for blockage tests performed at PR = 1.05,

107
1.15, and 1.6, respectively. Holding the mass loading ratio (MLR) constant, the uncertainty in
RFF decreased with increasing pressure ratio due to the decrease in FF uncertainty as a
percentage of the nominal FF value. Furthermore, as the pressure ratio was increased, the
increase in nominal RFF value decreased the RFF uncertainty as a percentage of the nominal
RFF value.
Table C.4. Reduction in Flow Function Parameter Uncertainties for PR = 1.05
mrust = 0.039 g, MLR = 0.50 s
Parameter Value Uncertainty Units % Contribution to URFF
FF 1.03E-08 ± 3.30E-10 m-s-K1/2
82
P0 102 ± 1.72 kPa 15
DPsp 4.76 ± 0.034 kPa 2.7
RFF 13.3 ± 3.1 %
Table C.5. Reduction in Flow Function Parameter Uncertainties for PR = 1.15
mrust = 0.089 g, MLR = 0.50 s
Parameter Value Uncertainty Units % Contribution to URFF
FF 2.12E-08 ± 5.72E-10 m-s-K1/2
84
P0 112 ± 1.72 kPa 16
DPsp 14.5 ± 0.002 kPa 0.001
RFF 21.9 ± 2.3 %
Table C.6. Reduction in Flow Function Parameter Uncertainties for PR = 1.6
mrust = 0.232 g, MLR = 0.50 s
Parameter Value Uncertainty Units % Contribution to URFF
FF 3.27E-08 ± 7.01E-10 m-s-K1/2
92
P0 156 ± 1.72 kPa 7.5
DPsp 58.57 ± 0.218 kPa 0.86
RFF 36.5 ± 1.4 %
References
[1] Beckwith, Thomas G., Roy D. Marangoni, and John H. Lienhard V. Mechanical
Measurements, Fifth Ed. New York: Addison Wesley, 1993.

108
Appendix D. UNCERTAINTY ANALYSIS FOR ROTATING TESTS
Nomenclature
General
ac centrifugal acceleration
ac,e engine centrifugal acceleration at base load conditions
DP differential pressure
FFrot rotational dimensional flow function: )Ksm(P
TmFF 2/1
rot,0
rot,0
rot
FF0,rot baseline rotational flow function from curve fit of flow data for clean test coupons
LFE laminar flow element
m mass flow rate
P0 total pressure upstream of the nozzle or seal pin flow area
P0,rot rotational total pressure upstream of the nozzle or seal pin flow area
p static pressure
PRrot upstream total rotational to downstream static pressure ratio: b
rot,0
rotp
PPR
RFF reduction in flow function evaluated at blocked pressure ratio:
PRrotrot,0
rot
FF
FF1RFF
T0 total temperature upstream of the nozzle or seal pin flow area
Trot rotational temperature
T0,rot rotational total temperature upstream of the nozzle or seal pin flow area
T temperature
U total parameter uncertainty, various subscripts
Subscripts
atm atmospheric
g gage pressure
LFE evaluated upstream of the LFE
sp evaluated across the seal pin flow area in the test chamber
Greek
γ ratio of specific heats
ω rotating speed
Ω centrifugal acceleration relative to engine: e,c
c
a
a

109
Flow Function Uncertainty
An uncertainty analysis was performed for the rotational flow function (FFrot), which was
calculated using Equation D.1. Equations for the upstream rotational total temperature (T0,rot)
and pressure (P0,rot) were previously provided in Section 3.7. Details of the mass flow rate ( m )
calculation were provided in Appendix A. The functional dependence of FFrot on measured
parameters is given in Equation D.2.
rot,0
rot,0
rotP
TmFF
(D.1)
),T,T,DP,P,p,p(fFF 0LFELFE0g,LFEatmrot (D.2)
The partial derivative method described in [1] was used to determine the propagation of
uncertainty from the measured parameters to the calculated values. The overall uncertainty for
the rotational flow function (UFFrot) was calculated using Equation D.3. Values for the UFFrot
were previously provided in Table 3.12 and Table 3.13, respectively, for Ω = 0.002 and Ω = 1.
2
0P
0
rot
2
g,pLFE
g,LFE
rot
2
patm
atm
rot
FFrot UP
FFU
p
FFU
p
FFU
2
1
2
rot
2
0T
0
rot
2
TLFE
LFE
rot
2
DPLFE
LFE
rot UFF
UT
FFU
T
FFU
DP
FF
(D.3)
Parameter uncertainties and the overall rotational flow function uncertainty (UFFrot) were
calculated for Ω = 0.002 at PRrot = 1.15, 1.6, and 1.8 and for Ω = 1 for both coupons. The
contributions of each parameter uncertainty to UFFrot are given in Figure D.1 and Figure D.2 for
Ω = 0.002 and Ω = 1, respectively. Uncertainty in the temperature measured just upstream of the
LFE (TLFE) was the main contributor to UFFrot. Similar to the trend observed in the static tests,
the increased pressure ratios and mass flow rates tested in the rotating facility diminished the
relative contributions of the uncertainty in the LFE gage pressure (pLFE,g) and the upstream total
pressure (P0) while the relative contribution of TLFE increased since the temperature was
approximately constant.

110
0
10
20
30
40
50
60
70
80
patm
pLFE,g
P0
DPLFE
TLFE
T0
PRrot
= 1.15
1.6
1.8
% Contribution
to Overall
FFrot
Uncertainty
Figure D.1. Relative contributions of the measured parameters to the rotational flow function uncertainty for Ω = 0.002.
0
10
20
30
40
50
60
70
80
patm
pLFE,g
P0
DPLFE
TLFE
T0
geometry 1
geometry 2
% Contribution
to Overall
FFrot
Uncertainty
Figure D.2. Relative contributions of the measured parameters to the rotational flow function uncertainty for Ω = 1, PRrot = 1.6.

111
Tables D.1, D.2, and D.3 summarize the uncertainties of parameters used to calculate the
flow function for Ω = 0.002 at rotational pressure ratios of 1.15, 1.6, and 1.8, respectively.
Tables D.4 and D.5 summarize the uncertainties of parameters used to calculate the flow
function for Ω = 1 for coupon 1 and 2, respectively.
Table D.1. Flow Function Parameter Uncertainties for Ω = 0.002, PRrot = 1.15
Parameter Value Uncertainty Units % Contribution to UFFrot
patm 97.8 ± 0.022 kPa 0.004
pLFE,g 13.7 ± 1.72 kPa 22
P0 111 ± 1.72 kPa 23
DPLFE 0.467 ± 0.003 kPa 5.0
TLFE 21.4 ± 1.70 ˚C 49
T0 25.5 ± 1.70 ˚C 0.77
ω 553 ± 3 rpm 2E-07
FFrot 3.64E-08 ± 1.18E-09 m-s-K1/2
Table D.2. Flow Function Parameter Uncertainties for Ω = 0.002, PRrot = 1.6
Parameter Value Uncertainty Units % Contribution to UFFrot
patm 96.9 ± 0.022 kPa 0.002
pLFE,g 59.3 ± 1.72 kPa 15
P0 155 ± 1.72 kPa 16
DPLFE 0.845 ± 0.003 kPa 2.0
TLFE 21.6 ± 1.70 ˚C 66
T0 25.3 ± 1.70 ˚C 1.1
ω 518 ± 3 rpm 3E-07
FFrot 6.48E-08 ± 1.78E-09 m-s-K1/2

112
Table D.3. Flow Function Parameter Uncertainties for Ω = 0.002, PRrot = 1.8
Parameter Value Uncertainty Units % Contribution to UFFrot
patm 96.7 ± 0.022 kPa 0.002
pLFE,g 78.3 ± 1.72 kPa 13
P0 174 ± 1.72 kPa 14
DPLFE 0.925 ± 0.003 kPa 1.9
TLFE 23.6 ± 1.70 ˚C 70
T0 26.4 ± 1.70 ˚C 1.2
ω 501 ± 3 rpm 3E-07
FFrot 6.94E-08 ± 1.81E-09 m-s-K1/2
Table D.4. Flow Function Parameter Uncertainties for Coupon 1, Ω = 1, PRrot = 1.6
Parameter Value Uncertainty Units % Contribution to UFFrot
patm 97.9 ± 0.022 kPa 0.003
pLFE,g 39.7 ± 1.72 kPa 17
P0 137 ± 1.72 kPa 18
DPLFE 0.441 ± 0.003 kPa 6.7
TLFE 23.1 ± 1.70 ˚C 57
T0 23.1 ± 1.70 ˚C 1.1
ω 10342 ± 2 rpm 3E-05
FFrot 3.20E-08 ± 9.48E-10 m-s-K1/2
Table D.5. Flow Function Parameter Uncertainties for Coupon 2, Ω = 1, PRrot = 1.6
Parameter Value Uncertainty Units % Contribution to UFFrot
patm 97.6 ± 0.022 kPa 0.003
pLFE,g 39.2 ± 1.72 kPa 18
P0 137 ± 1.72 kPa 19
DPLFE 0.712 ± 0.003 kPa 2.6
TLFE 20.3 ± 1.70 ˚C 60
T0 20.3 ± 1.70 ˚C 1.2
ω 10302 ± 2 rpm 4E-05
FFrot 5.22E-08 ± 1.53E-09 m-s-K1/2

113
Reduction in Flow Function Uncertainty
An uncertainty analysis was also performed on the rotational pressure ratio (PRrot) and
reduction in flow function (RFF), defined in Equations D.4 and D.5, respectively. The
functional dependence of the rotational pressure ratio on the measured parameters P0, T0, and ω
and on the corrected seal pin differential pressure DPsp is given in Equation D.6. The functional
dependence of RFF on the blocked and baseline rotational flow functions is given in Equation
D.7.
1
0
rot
sp0
0rot
T
T1
DPP
PPR
(D.4)
PRrotrot,0
rot
FF
FF1RFF (D.5)
)DP,,T,P(fPR sp00rot (D.6)
)FF,FF(fRFF rot,0rot (D.7)
Uncertainties for the rotational pressure ratio (UPRrot) and the reduction in flow function
(URFF) were calculated using the partial derivative method as in Equations D.8 and D.9,
respectively. Uncertainty values for pressure ratio and reduction in flow function were
previously reported in Table 3.12 for Ω = 0.002 and Table 3.13 for Ω = 1.
2
DPsp
sp
rot
2
rot
2
0T
0
rot
2
0P
0
rotPRrot U
DP
PRU
PRU
T
PRU
P
PRU
(D.8)
2
rot,0FF
rot,0
2
FFrot
rot
RFF UFF
RFFU
FF
RFFU
(D.9)
Parameter uncertainties and the overall reduction in flow function uncertainty (URFF)
were calculated for Ω = 0.002 at PRrot = 1.15, 1.6, and 1.8 and for Ω = 1 for both coupons. As in
the static tests, uncertainty in the reduction in flow function was mainly driven by the uncertainty
in the flow function at blocked conditions.
References
[1] Beckwith, Thomas G., Roy D. Marangoni, and John H. Lienhard V. Mechanical
Measurements, Fifth Ed. New York: Addison Wesley, 1993.

114
Appendix E. ENGINEERING DRAWINGS

115

116

117

118

119

120

121

122

123

124
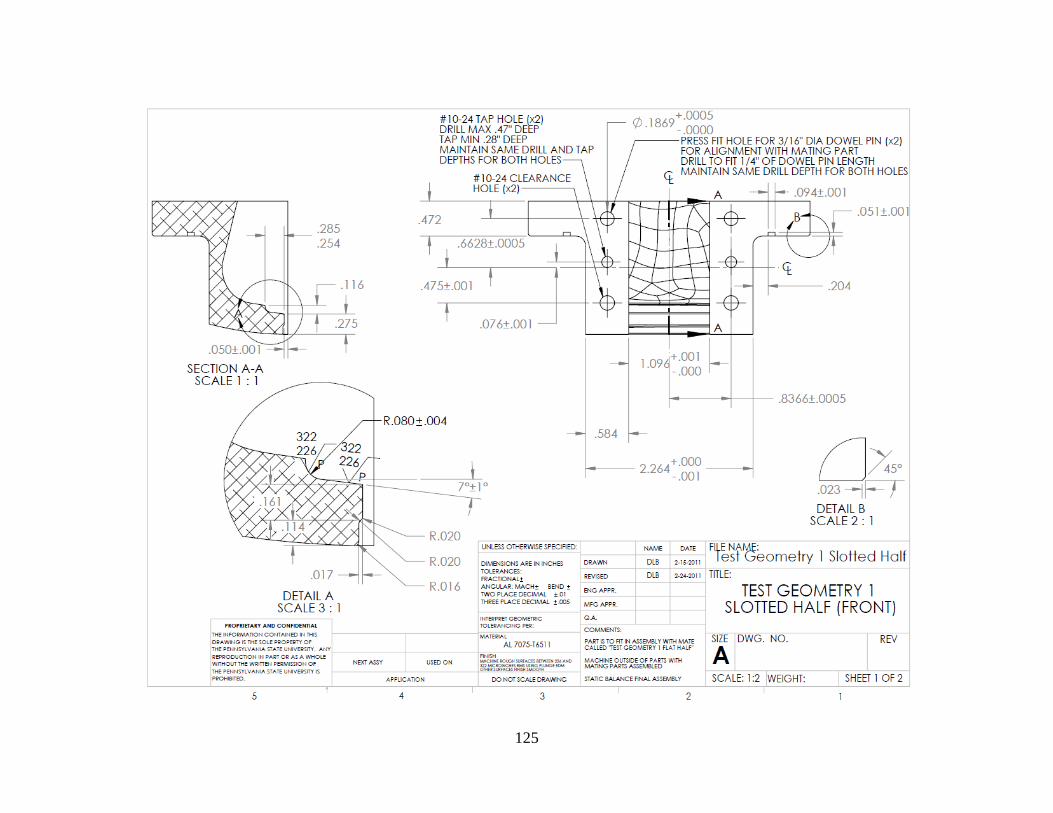
125

126

127

128

129

130