effects of regulated deficit irrigation (rdi) on fruit yield, quality, and physiology of...
TRANSCRIPT

Effects of Regulated Deficit Irrigation (RDI) on Fruit Yield,
Quality and Physiology of Smith’s Early Navel Orange Trees
Presenter: Emily Wieber
Committee Members:
Dr. Jochen Schenk, Dr. Joel Abraham, & Dr. Darren Sandquist
UCR Advisors:
Dr. Peggy Mauk & Dr. Mary Lu Arpaia

Outline 2
• Introduction
→ Hypotheses
→ Citrus reproductive cycle
• Methods
→ Layout of field equipment and
irrigation
→ Fruit quality (internal and external )
and yield measurements
→ WUE, Plant Physiology, SI
• Results
→ Effects of RDI on fruit quality
(Table 2-3)
→ Effects of fruit position on fruit
quality (Table 4-5)
→A summary of the effects of RDI
(Table 6)
→ Fruit size distribution & correlation
between yield and Canopy (Fig. 2)
→ Correlation between yield, WUE
and Irrigation (Fig. 3)
→A summary of the irrigation, plant-
based and weather-based parameters
(Table 7)
→An overview of plant-based and
weather-based parameters (Fig. 4)
During phase IIA (Fig.5)
During phase IIB (Fig. 6)
During phase III (Fig. 7)
→ Signal Intensity (Fig. 8), signal to
noise ratio (Table 8)
→ Correlation among plant-based
parameters (Fig. 9)
→ Correlation between plant-based
parameters to weather-based
parameters (Fig. 10)
• Discussion
• Conclusion
• Citation

Hypotheses & Citrus Reproductive Cycle3
Phase I Phase IIA Phase IIB Phase III
Flowering Early Fruit Growth Late Fruit Growth Fruit Ripening
Dec16 - May15 May16 - Jul15 Jul16 - Oct15 Oct16 - Dec15
Treatment
Control 100% ETc 100% ETc 100% ETc 100% ETc
RDI1 100% ETc 25% ETc 100% ETc 100% ETc
RDI2 100% ETc 100% ETc 100% ETc 75% ETc
RDI3 100% ETc 25% ETc 100% ETc 75% ETc
I. Navel orange trees can withstand a moderate irrigation reduction (25%
ETc) during phase IIA and (75% ETc) during phase III without
compromising fruit yield and quality
II. Sap flow (SF) is more sensitive indicator of the onset of plant water stress
than MDS
Table1: Citrus Reproductive Cycle & RDI Application (Goldhamer & Salinas 2000)

Dendrometer Sap Flow Sensor
Methods: Layout of Field Equipment and Irrigation4

Minolta Inc. (2007)
Methods: Quality and Yield Measurements5
f
Fig. 1 Three-dimensional color solid: lightness (ranging from
light, lower value to dark, higher value), chroma (color intensity,
ranging from dull, lower value to dark, higher value), and hue
(angle value, ranging from green, lower value to red, higher value)
• Fruit Quality: Internal and External
→ % juice wt. to fruit wt.,
→ Soluble solids concentration (SSC)
→ Titratable acid (TA)
→ BrimA = SSC – 4TA (sweetness)
→ Ratio of SSC to TA (maturity)
→ Rind thickness & texture
→ Color (lightness, chroma, & hue)
• Yield
→ Avg. fruit weight per tree (kg tree-1)
→Avg. number of fruit per tree
→ Percentage of fruit per tree based on
three size categories (L - XL, M, XS - S)
Inte
rnal
Exte
rnal

Methods: Measured WUE, Plant Physiology & SI6
f
• Water Use Efficiency:
Agricultural (kg m-3) vs. financial ($ fruit $ water-1)
WUEagr =Yield
Irrigation+Rainvs. WUEf =
Profits
Investment
• Plant Physiological Responses
→ Ψstem, SF, & MDS
→ Use to calculate signal intensity (aka water stress indicator)
• Signal Intensity (SI)
for (Ψstem & MDS) =RDI1+RDI3
Control
Signal Intensity
for (SF) = Control
RDI1+RDI3
Results: Effects of RDI on Fruit Quality7
f
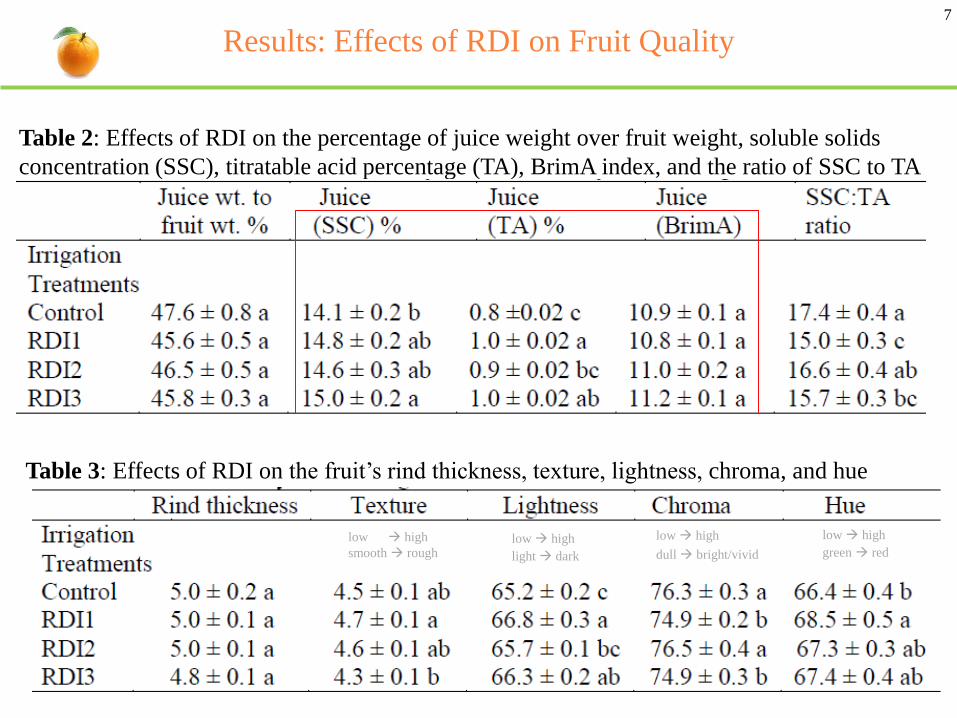
Table 2: Effects of RDI on the percentage of juice weight over fruit weight, soluble solids
concentration (SSC), titratable acid percentage (TA), BrimA index, and the ratio of SSC to TA
Table 3: Effects of RDI on the fruit’s rind thickness, texture, lightness, chroma, and hue
low high
light dark
low high
dull bright/vivid
low high
green red
low high
smooth rough

Results: Effects of the Fruit Position on Fruit Quality8
f
Table 4: Effects of the fruit position (north vs. south) on the percentage of juice
weight to fruit weight, soluble solids concentration (SSC), titratable acid
percentage (TA), BrimA index, and the ratio of SSC to TA
Table 5: Effects of the fruit position on rind thickness, texture, color lightness,
chroma, and hue
low high
light dark
low high
green red
low high
smooth rough
low high
dull bright/vivid

Table 6: Summary of the Effects of RDI on Yield, Cost, Profits, WUEagr & WUEf
9
f
Results: Table 6 Effects of RDI on Yield, Cost, Profits, and WUE &
Fig. 2 A) Fruit Weight Distribution & B) Correlation between yield and canopy
Fig.2: A) Distribution of Fruit Size and B) Correlation between Yield and Tree Canopy
XS - S: 63.5 - 74.9
M: 75 - 80
L - XL: 81 - 88
Fruit Size (mm)
Control RDI1 RDI2 RDI3
Irrigation Treatments
0
10
20
30
40
50
60
70
80
90
100
Perc
ent
of
Fru
it p
er T
ree
in T
hre
e S
ize
Cat
ego
ries
aa
bb
b
a
ab
a
a
aa
a
A) B)

Results: Fig.3 Correlation between Yield, WUEagr and WUEf to Irrigation &
Table 2: Summary of Irrigation, Plant-based and Weather-based Parameters
10
Table 7: Summary of irrigation, plant-based and weather-based parameters from phase IIA to III
R² = 0.73
20
30
40
50
1200 1400 1600
Aver
age
Yie
ld (
kg)
ETc and Rain (mm)
A) Yield and Irrigation
R² = 0.37
0.50
0.75
1.00
1200 1400 1600W
UE
agr
(kg m
-3)
ETc and Rain (mm)
B) WUEagr and Irrigation
R² = 0.43
20
30
40
1200 1400 1600
WU
Ef ($
fruit
/$w
ater
)
ETc and Rain (mm)
C) WUEf and Irrigation Fig. 3: Correlation between yield, WUEagr, and WUEf to irrigation

Results: Fig. 4 Overview of A) Irrigation &
B) Morning and Midday stem
11
0
50
100
150
200
250
ET
can
d R
ain
(m
m)
A) ETc and Rain Control
RDI1
RDI2
RDI3
-3.0
-2.5
-2.0
-1.5
-1.0
-0.5
0.0
0.5
24-May 23-Jun 23-Jul 22-Aug 21-Sep 21-Oct 20-Nov 20-Dec
st
em (
MP
a)
Date in 2014
B) Morning (7 am) and Midday (12 pm) stem
Morning
Midday

Results: Fig. 4 Overview of Plant-based and Weather-based Parameters12
0
10
20
30
40
50
60
Dai
ly A
ver
age
SF
(g/h
) C) Daily Average SF
0.00
0.05
0.10
0.15
0.20
MD
S (
mm
)
D) MDS
0
10
20
30
40
0
100
200
300
400
500
24-May 24-Jun 24-Jul 24-Aug 24-Sep 24-Oct 24-Nov 24-Dec
Aver
age
Air
Tem
per
ture
(oC
)
Sola
r R
adia
tion (
W m
-2)
Date in 2014
E) Solar Radiation, Temperature, and Precipitation
Water Stress
No Water Stress

Results: Fig. 5 During May 24th to May 31st 2014 (Phase IIA)13
f
0
50
100
150
Sap
Flo
w (
g h
-1) A) SF
0.00
0.05
0.10
0.15
0.20
MD
S (
mm
)
B) MDS
0
10
20
30
40
0
500
1000
1500
Air
Tem
per
ature
(0C
)
Sola
r R
adia
tion (
W m
-2)
Date and Time
C) Solar Radiation, Temperature, and Precipitation
Water Stress
No Water Stress

Results: Fig. 6 During Sep 29th to Oct 4th 2014 (Phase IIB)14
f
0
20
40
60
Sap
Flo
w (
g h
-1)
A) SF
0.00
0.05
0.10
0.15
0.20
MD
S (
mm
)
B) MDS
0
10
20
30
40
0
500
1000
1500
9/29/14
100
9/29/14
1300
9/30/14
100
9/30/14
1300
10/1/14
100
10/1/14
1300
10/2/14
100
10/2/14
1300
10/3/14
100
10/3/14
1300
10/4/14
100
10/4/14
1300
Air
Tem
per
ature
(oC
)
Sola
r R
adia
tion (
W m
-2)
Date and Time
C) Solar Radiation, Temperature, and Precipitation
Water Stress
No Water Stress

Results: Fig. 7 During Nov 30th to Dec 5th 2014 (Phase III)15
f
0
20
40
60
Sap
Flo
w (
g h
-1)
A) SF
0.00
0.05
0.10
0.15
0.20
MD
S (
mm
)
B) MDS
0
10
20
30
40
0
500
1000
1500
Air
Tem
per
ature
(oC
)
Sola
r R
adia
tion (
W m
-2) C) Solar Radiation, Temperature, and Precipitation
Date and Time
Water Stress
No Water Stress

Results: Signal Intensity (SI) among Three Plant-based Parameters
& Fig.9: Correlation between SF and MDS to Midday stem
16
0.0
0.5
1.0
1.5
2.0
2.5
Sig
nal
In
ten
sity
Date in 2014
Fig. 8 Signal Intensity from May 16th to Dec 12th, 2014
Table 8: Mean signal intensity, mean noise, and signal
to noise ratio from May 24th to Jun 13th, 2014
y = -6.80x - 0.71
r² = 0.16
p_value = 0.89
0
10
20
30
40
-2.5 -1.5 -0.5 0.5
Dai
ly A
ver
age
Sap
Flo
w (
g h
-1) A) SF and Midday stem
Control
RDI1
RDI2
RDI3
y = -0.03x + 0.02
r² = 0.21
p_value = 0.31
0
0.05
0.1
0.15
0.2
-2.5 -1.5 -0.5 0.5
MD
S (
mm
)
Midday stem (MPa)
B) MDS and Midday stem
Fig.9: Correlation between SF and MDS to
Midday stem

Results: Fig. 10: Correlation between Plant-based Parameters
to Weather-Based Parameters
17
f
y = -0.0062x - 0.64
r² = 0.36
p_value = 0.23
-3
-2
-1
0
0 50 100 150 200 250
Mid
day
st
em(M
Pa)
A) Midday stem and ETo
y = 1.88x - 0.05
r² = 0.44
p_value = 0.99
0
5
10
15
20
25
0 2 4 6 8 10
Dai
ly A
ver
age
SF
(g h
-1) B) SF and ETo
y = 0.01x + 0.05
r² = 0.21
p_value = 0.00
0.00
0.05
0.10
0.15
0.20
0 2 4 6 8 10
MD
S (
mm
)
ETo (mm day-1)
C) MDS and ETo
y = -0.73x - 0.67
r² = 0.12
p_value = 0.55
-3
-2
-1
0
0 0.5 1 1.5 2 2.5
Mid
day
st
em(M
Pa) D) Midday stem and VPD
y = 2.22x + 6.64
r² = 0.03
p_value = 0.00
0
5
10
15
20
25
0 0.5 1 1.5 2 2.5
Dai
ly A
ver
age
SF
(g h
-1) E) SF and VPD
y = 0.03x + 0.05
r² = 0.11
p_value = 0.00
0.00
0.05
0.10
0.15
0.20
0 0.5 1 1.5 2 2.5
MD
S (
mm
)
VPD (kPa)
F) MDS and VPD

Discussion 18
f
I. Effects of RDI on Fruit Yield and Quality• Severe RDI (25% ETc) imposed during the early fruit growth would reduce
fruit size at harvest (Goldhamer & Salinas 2000)
• RDI had similar gross yields, fruit load, and packable cartons (e.g. Fancy and
Choice fruit) as the control (Goldhamer & Salinas 2000)
• RDI resulted in equal or higher fruit quality (e.g. SSC and TA values) when
compared to the control (Kallsen et al. 2011), which was due to the fruit’s
osmotic adjustments(Yakushiki et al. 1996)
II. Determining Non-Destructive Plant-Based Measures• The trends in SF and MDS data were highly variable and opposite to what
were expected, which made them difficult to differentiate the effects of RDI
• In order to show distinguishable patterns in SF and MDS across treatments, it
might have required at least ten sensors or more to off-set the variations, which
could be unrealistic for growers to use the equipment for irrigation scheduling
• SF heaters easily got overheated, which contributed to the variation in SF
patterns across treatments
Conclusion19
f
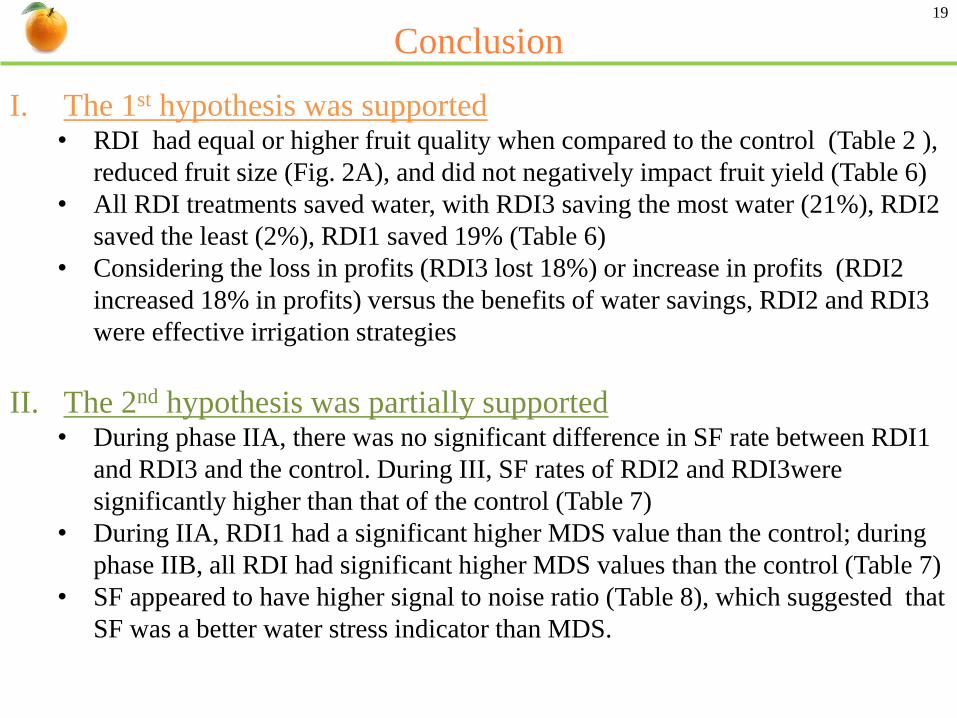
I. The 1st hypothesis was supported• RDI had equal or higher fruit quality when compared to the control (Table 2 ),
reduced fruit size (Fig. 2A), and did not negatively impact fruit yield (Table 6)
• All RDI treatments saved water, with RDI3 saving the most water (21%), RDI2
saved the least (2%), RDI1 saved 19% (Table 6)
• Considering the loss in profits (RDI3 lost 18%) or increase in profits (RDI2
increased 18% in profits) versus the benefits of water savings, RDI2 and RDI3
were effective irrigation strategies
II. The 2nd hypothesis was partially supported • During phase IIA, there was no significant difference in SF rate between RDI1
and RDI3 and the control. During III, SF rates of RDI2 and RDI3were
significantly higher than that of the control (Table 7)
• During IIA, RDI1 had a significant higher MDS value than the control; during
phase IIB, all RDI had significant higher MDS values than the control (Table 7)
• SF appeared to have higher signal to noise ratio (Table 8), which suggested that
SF was a better water stress indicator than MDS.

Citation20
f
1) Goldhamer, D.A. & Salinas, M. (2000) Evaluation of regulated deficit irrigation
on mature orange trees grown under high evaporative demand. In: Proceedings of
the International Society of Citriculture IX Congress, Orlando, FL, 227-231.
2) Kallsen, C. E., Sanden, B., & Arpaia, M. L. (2011) Early navel orange fruit yield,
quality, and maturity in response to late-season water stress. HortScience, 46,
1163-1169.
3) Minolta, K. (2007). Precise color communication. Kónica Minolta Sensing. Inc.
Japan.
4) Yakushiji, H., Nonami, H., Fukuyama, T., Ono, S., Takagi, N., Hashimoto, Y.
(1996) Sugar accumulation enhanced by osmoregulation in Satsuma mandarin
fruit. Journal of the American Society for Horticultural Science, 121, 466-472.