effects of rapamycin on the early development of … · 2017-02-14 · effects of rapamycin on the...
TRANSCRIPT

EFFECTS OF RAPAMYCIN ON THE EARLY DEVELOPMENT
OF ZEBRAFISH (Danio rerio)
A THESIS SUBMITTED TO
THE DEPARTMENT OF MOLECULAR BIOLOGY AND GENETICS
AND THE INSTITUTE OF ENGINEERING AND SCIENCE OF
BILKENT UNIVERSITY
IN PARTIAL FULFILMENT OF THE REQUIREMENTS
FOR THE DEGREE OF MASTER OF SCIENCE
BY
CEM KUŞÇU
JULY 2004

TO MY FAMILY, TO MY NEPHEW (GÖRKEM),
AND TO THE KONU LABORATORY

ii
ABSTRACT
EFFECTS OF RAPAMYCIN ON THE EARLY DEVELOPMENT OF ZEBRAFISH (Danio rerio)
Cem KUŞÇU
M.Sc. in Molecular Biology & Genetics
Supervisor: Dr. Özlen KONU JULY 2004, 77 pages
Rapamycin, isolated from the soil bacteria Streptomyces hygroscopicus as an antibiotic,
previously was shown to have negative effects on the immune system, cancer
development, and cell cycle using different model organisms. Specific effects of
rapamycin on the TOR protein activity also was determined by these previous studies.
In general, TOR is a kinase that play an important role in the transmission of the signals
from growth factors and amino acids to proteins involved in translation processes. In
spite of the increasing popularity of zebrafish (Danio rerio) as a model organism in the
developmental biological studies, no previous study about the effects of rapamycin on
zebrafish exists in the literature. In the present thesis, zebrafish TOR (DrTOR) gene
structure was first characterized in silico and then compared in terms of its homology
with the mammalian TORs at the cDNA and protein levels. Expression of DrTOR was
shown at different embryonic/larval stages and in different tissue samples. Furthermore,
different doses of rapamycin were given to the embryos during the early developmental
time (2, 3, 4, 5 dpf). Based on the morphometric analyses, rapamycin concentrations
greater than 1 µM caused a significant reduction in the larval size. Additionally, 20 µM
rapamycin significantly and completely abolished any larval growth supposed to take
place during this time period. In the 20 µM rapamycin experiment, also a retardation in
the pigment cell (melanocyte) and cranial cartilage development was observed.
Expression profiles of the mitfA and DrTOR were analyzed by using the real-time RT-
PCR. While DrTOR expression was upregulated (3.5 fold) by 20 µM rapamycin, mitfA
expression was downregulated (% 40). Finally, a siRNA designed against the TOR gene
was tested for its inhibitory activity when given to embryos in a solution.
iii
ÖZET RAPAMYCIN’IN ZEBRA BALIĞININ (Danio rerio) ERKEN GELİŞİM
DÖNEMİNDEKİ ETKİLERİ
Cem KUŞÇU
Master Tezi, Moleküler Biyoloji ve Genetik Bölümü Tez Yöneticisi: Dr. Özlen KONU
Temmuz 2004, 77 sayfa
Streptomyces hygroscopicus adlı toprak bakterisinden izole edilmiş olan rapamycin,
hücre bölünmesi, bağışıklık sistemi ve kanserli hücrelerin gelişimi üzerinde olumsuz
etkilere sahip olduğu değişik model organizmalar üzerinde gösterilmiş bir antibiyotiktir.
Rapamycinin TOR proteininin aktivitesi üzerindeki özgün etkileri de yapılan bu
çalışmalar sonucu belirlenmiştir. TOR proteini, genel olarak, hücre içerisinde amino
asitlerden ve büyüme hormanlarından gelen sinyallerin translasyon mekanizmasında
öncül rol oynayan proteinlere iletilmesinde görevli bir kinazdır. Zebrabalığı (Danio
rerio) özellikle gelişim biyolojisinde yaygın olarak kullanılan bir model organizma
olmasına rağmen, rapamycin’in zebrabalığı üzerindeki etkilerine dair bir çalışma
literatürde henüz yer almamaktadır. Bu tez çalışmasında öncelikli olarak zebrabalığı
TOR (DrTOR) geninin in silico (biyoinformatiksel) gen sekansı bulunmuş ve daha sonra
cDNA ve protein seviyesinde diğer memeli TOR sekansları ile homoloji karşılaştırması
yapılmıştır. DrTOR geninin embriyonik/larval dönemlerde ve erişkin balığın farklı
dokularında ifade edildiği gösterilmiştir. Rapamycin erken gelişim döneminde (2., 3., 4.,
5. gün) farklı konsantrasyonlarda verilmiştir. Morfometrik incelemelere dayanarak, 1
µM’dan yüksek konsantrasyonların larvaların boylarında küçülmeye sebep olduğu
gösterilmiştir. 20 µM lık dozun ise larvaların boylarında gerçekleşmesi gereken
büyümeyi tümüyle durduğu istatiksel yöntemler kullanılarak tespit edilmiştir. 20 µM
rapamycin verilen embriyoların pigment hücreleri (melanosit) ve kafadaki kıkırdak
dokularının gelişiminde de gerileme görülmüştür. Real–time RT-PCR kullanılarak
DrTOR ve mitfA genlerinin mRNA ifade profilleri incelenmiştir. 20 µM rapamycin
verilen embryolarda DrTOR mRNA ifadesi 3.5 kat artarken, aynı embriyolarda mitfA
ifadesi % 40 azalmıştır. Son olarak, DrTOR’a karşı dizayn edilen bir siRNA embriyolara
solüsyon içerisinde verilmiş ve bu siRNA’nin gen ifade engelleme kapasitesi test
edilmiştir.

iv
ACKNOWLEDGEMENT
First of all, I would like to thank Dr. Özlen KONU for her valuable supervision
during my study. She supported me both theoretically and morally during these two
years while we set up a molecular zebrafish laboratory in Turkey. I also thank her for
taking me as her first assistant in the KONU Lab.
I would like to thank deeply to my old friends from Korea to U.S.A for sharing
their valuable time on the phone and internet, especially to Oğuzhan Özsürekçi, Ali
Bozak, Ahmet Erkam, Ahmet Eyim, Balkan Keçecioğlu, Okan Ataman and all friends
from METU, and I wish them best luck and happiness in their lives.
Also, I would like to thank my room-mates at in these two years: Harun Nezih
Türkçü, Yavuz Öztürk, Sefahattin Tongay, Ayhan Yurtsever, A. Faik Demirörs, Anıl
Ağıral.
I would like to thank my old friends from the MBG Department of METU and
wish them success in their future studies.
I also would like to thank all members of the MBG Department of Bilkent
University , especially for the members of mbg-family group (2002).
I also would like to thank Necmi Bıyıklı, Süleymen Tek and other zedeler and all
old friends in Ankara for their friendship since 1997.
Of course, my deepest gratitudes go to my family, who have been far away from
me for 10 years, but I always felt that they were near me. I thank them for their love and
support.

v
TABLE OF CONTENTS
PAGE
ABSTRACT ii
ÖZET iii
ACKNOWLEDGEMENTS iv
TABLE OF CONTENTS v
LIST OF TABLES viii
LIST OF FIGURES ix
ABBREVIATIONS xi
1. INTRODUCTION 1 1.1. ZEBRAFISH AS A VERTEBRATE MODEL ORGANISM 1
1.1.1. Embryonic Stages of Development 2
1.1.2. Developmental Genetics 5
1.1.3. Neural Crest-derived Structures 6
1.1.3.1. Melanocytes 7
1.1.3.2. Cartilage 7
1.1.4. Pleitoropy 9
1.2. FRAP/TOR SIGNALING NETWORK 9
1.3. RAPAMYCIN AS AN INHIBITOR OF FRAP/TOR 11
1.4. MORPHOLOGICAL AND MOLECULAR EFFECTS OF
FRAP/TOR INHIBITION 13
1.4.1. S. cerevicea 13
1.4.2. C. elegans 15
1.4.3. D. melanogaster 15
1.4.4. M. musculus 16
1.5. FUNCTIONAL GENOMICS 16
1.6. CANDIDATE GENES IN FRAP/TOR SIGNALING 17
1.6.1. Vxinsight as a tool for candidate gene discovery 17
1.6.2. mitfA 18

vi
2. AIM OF THE STUDY 20 2.1. Aim 20
2.2. Strategy 20
3. MATERIALS AND METHODS 21 3.1. Animals 21
3.1.1. Maintenance 21
3.1.1.1. Aquaria System and Water Conditions 21
3.1.1.2. Housing and Feeding 21
3.1.2. Breeding 22
3.1.3. Embryo Handling 22
3.2. Standard Solutions and Buffers 23
3.3. Rapamycin Treatment 26
3.4. Phenotypic Screening Methods 26
3.4.1. Morphometric Measurements 26
3.4.2. Fixation of Embryo/Larva 27
3.4.3. Cartilage Staining and Morphology 27
3.4.4. Melanocyte Morphology and Distribution 28
3.5. Determination of Gene Expression 28
3.5.1. Total RNA Isolation From Embryos and Adult Tissues 28
3.5.2. Determination of RNA Concentrations By Spectrophotometer 29
3.5.3. Denaturing Agarose Gel Electrophoresis 30
3.5.3.1. Preparation of the FA (formaldehyde agarose) Gel (1.2 %) 30
3.5.3.2. Preparation of Samples for Loading 30
3.5.4. cDNA Conversion 30
3.5.5. Primer Design 30
3.5.6. RT-PCR 31
3.5.7. Real Time RT-PCR 32
3.6. siRNA Treatment 33
3.6.1. siRNA Design 33
3.6.2. siRNA Production 33
3.6.2.1. Transcription Template Preparation 34

vii
3.6.2.2. dsRNA Synthesis 35
3.6.2.3. siRNA Preparation/Purification 35
3.6.2.4. siRNA Quantification 35
3.6.3. siRNA Treatment 35
4. RESULTS 36 4.1. In silico Construction of Zebrafish TOR (DrTOR) Gene 36
4.1.1. Exon Homologies between Human, Mouse, Rat and Zebrafish 36
4.2. DrTOR Expression 42
4.2.1. Embryonic 42
4.2.2. Adult Tissues 42
4.3. Phenotypic Screening 43
4.3.1. Larval Growth 43
4.3.2. Cranial Cartilage Elements 54
4.3.3. Melanocyte Development and Morphology 57
4.4. Effects of Rapamycin on Gene Expression of Selected
Candidate Genes 59
4.4.1. Standard Curves and Amplification Efficiencies 59
4.4.2. Real-time RT-PCR Expression Studies 61
4.4.2.1.DrTOR 61
4.4.2.2. mitfA 62
4.5. Application of siRNA Technology to DrTOR 63
5. DISCUSSION AND FUTURE PERSPECTIVES 65
6. REFERENCES 70
APPENDICES

viii
LIST OF TABLES
NUMBER/NAME PAGE
Table 1.1 Description of the embryonic stages of zebrafish between 0-72 hours 3
Table 3.1 Parameters of the Primer Designer 2.0 31
Table 3.2 Sequence of primers 31
Table 3.3 Annealing temperatures optimized for the PCR reactions 32
Table 3.4 The sense and antisense sequences for the DrTOR siRNA 33
Table 4.1 Certain features of the mammalian TOR genes 36
Table 4.2 Homology comparisons of human, mouse and rat exons of TOR
genes against the zebrafish genome 37
Table 4.3 Pairwise comparisons of TOR cDNA sequences between human,
mouse, rat, and zebrafish 40
Table 4.4 Pairwise comparisons of TOR amino acid sequences between human,
mouse, rat, and zebrafish 40
Table 4.5 Body size measurements 49
Table 4.6 Two-Way ANOVA for the 1st set of experiments 52
Table 4.7 Threshold cycle numbers for the 10X dilution series for the candidate
genes 59
Table 4.8 Upregulation of DrTOR in response to rapamycin during early
development 61
Table 4.9 Down regulation of mitfA in response to rapamycin during early
development 62
Table 4.10 Fold Change and % inhibition of mRNA expression of mitfA
by rapamycin for 48 hpf expression over 8 hpf expression results 63
Table 4.11 Comparison of inhibition rate of experiment I and experiment II 63
Table 4.12 Results of the siRNA inhibition study using immersion method 64

ix
LIST OF FIGURES
NUMBER/NAME PAGE Fig. 1.1 Specialization of different cells 6
Fig. 1.2 The components of the pharyngeal skeleton 8
Fig. 1.3 Domains of the Human TOR 10
Fig. 1.4 Upstream and downstream components of TOR 11
Fig. 1.5 Rapamycin chemical structure 12
Fig. 1.6 Effects of TOR on the import process of the transcription factor 14
Fig. 1.7 Role of mitfA in pigmentation 19
Fig. 3.1 Hatching system 22
Fig. 3.2 96-well plate 23
Fig. 3.3 Incubator and Microscope 27
Fig. 3.4 A simplified schema of the siRNA production 34
Fig. 4.1 Vista plots between zebrafish and Human (1), and Human with
rat (2) and mouse (3) 41
Fig. 4.2 Embryonic expression pattern of DrTOR with respect to
mipep expression 42
Fig. 4.3 Adult expression pattern of DrTOR in multiple tissues
with respect to mipep expression 43
Fig. 4.4 An example of the digital photographs used by TPS program 44
Fig. 4.5 Box plots of relative body sizes for different doses of rapamycin 45
Fig. 4.6 Representative pictures for the control and treatment embryos
at 2, 3and 4 days post fertilization 47
Fig. 4.7 The mean increase in body size 48
Fig. 4.8 Linear regression analysis of growth inhibition 51
Fig. 4.9 The mean increase in body size (Standard Length, mm) for
DMSO only (D-R) and DMSO+Rapamycin (D+R) treated embryos
(Second Experimental Set) 53
Fig. 4.10 Alcian-blue staining of the cranial cartilage elements in control
and 2 µM sample 55

x
Fig. 4.11 Alcian-blue staining of the cranial cartilage elements in control
and 20 µM sample 56
Fig. 4.12 Pigmentation and yolk abnormalities observed at the 2 dpf of the second
set of embryos 57
Fig. 4.13 Pigmentation and yolk abnormalities observed at the 3 dpf and
4 dpf of the second set of embryos 58
Fig. 4.14 Pigmentation and yolk abnormalities observed at the 5 dpf of the second
set of embryos 58
Fig. 4.15 Standard curve plots of the candidate genes used in the study 60
Fig. 4.16 Expresssion profile of DrTOR for embryos 12-48 hpf when
compared with mipep 61
Fig. 4.17 Expresssion profile of mitfA for embryos 12-48 hpf when
compared with mipep 62
Fig. 4.18 Fold difference of TOR mRNA after siRNA treatment by
immersion method 64
xi
ABBREVIATIONS
APS Ammonuim Persulphate
bp Base Pairs
BMP Bone Morphogenetic Protein
Ch Ceratohyal
DMSO Dimethyl Sulfoxide
DNA Deoxyribonucleic Acid
dpf Days Post Fertilization
EDTA Diaminoethane Tetra-acetic Acid
EtBr Ethidium Bromide
FGF Fibroblast Growth Factor
FRB FKBP-Rapamycin Binding
Hy Hyoid
jef Jellyfish Mutant Zebrafish
KCl Potassium Chloride
Mc Meckel’s Cartilage
nac Nacre Mutant Zebrafish
NaCl Sodium Chloride
Na2HPO4 Sodium Monohydrogen Phosphate
PAGE Polyacrylamide Gel Electrophoresis
PBS Phosphate Buffered Saline
PCR Polymerase Chain Reaction
pdf Post Day Fertilization
PIKK Phosphoinositide Kinase Related Kinase
Pq Palatoquadrate
RNase Ribonuclease
TOR Target Of Rapamycin
Tris Tris (Hydroxymethyl)- Methylamine
UV Ultraviolet

1
1. INTRODUCTION
1.1. ZEBRAFISH AS A VERTEBRATE MODEL ORGANISM
The Zebrafish (Danio rerio) is a tropical freshwater fish from Northern India
whose developmental was first studied by Hisoaka & Battle (Hisoaka et al., 1958). In
the early 1980s, zebrafish has been proposed as a model organism by George Streisinger
(Streisinger et al., 1981) based on the utility of zebrafish in the establishment of
homozygous lines, and the availability of mutants, whose numbers reached to thousands
in the recent years. Nowadays, a large number of laboratories use zebrafish as a model
organism in their developmental and functional genomics studies (http://zfin.org/ZFIN).
Furthermore, although not yet complete, annotated zebrafish genome sequences and
ESTs are publically available (www.ensembl.org).
Zebrafish is a vertebrate organism thus is more closely related to humans in
comparison with other commonly used model organisms, such as Drosophila and C.
elegans. Because of this close relationship, many biological traits, including gene
function, embryonic development, anatomy/physiology, and behavior are similar
between the fish and human. Furthermore, zebrafish is an excellent model organism due
to several other characteristics that it possesses: 1) The zebrafish is relatively small in
size thus easy to maintain; 2) It produces large numbers of offspring, and the fertilization
is external; 3) Zebrafish embryonic development is short in length relative to that of the
mammals such that the basic body plan is shaped within the first 24 hours where the
same process takes about 9 days in mice (Lardelli et al., 2000); 4) Zebrafish organs
highly resemble those of the mammalian; 5) The embryos are relatively large (radius =
0.5 mm) allowing for easy embryonic manipulation, e.g., microinjection; 6) The
embryos are transparent making possible to mark and observe the development and
pathology of internal organs, such as the brain, heart and muscle; 7) Finally, the rapid
growth and global interactivity of the zebrafish community provide researchers with
large amount of biological knowledge and molecular resources. Indeed, zebrafish, with
more than 2000 characterized mutants, has become one of the most preferred models in

2
studying human disease, e.g., hematopoiesis (Brownlie et al., 1999), and melanoma
(Widlund et al., 2002).
1.1.1. Embryonic Stages of Development
Embryonic stages, which last ~3 days, include the events of fertilization all
through the hatching process from the chorion. In the first day, zygote, cleavage,
blastula, gastrula and segmentation periods are seen; pharyngula period occurs at day 2
while hatching period takes place at around day 3 (Table 1). The developmental stages
are temperature dependent.
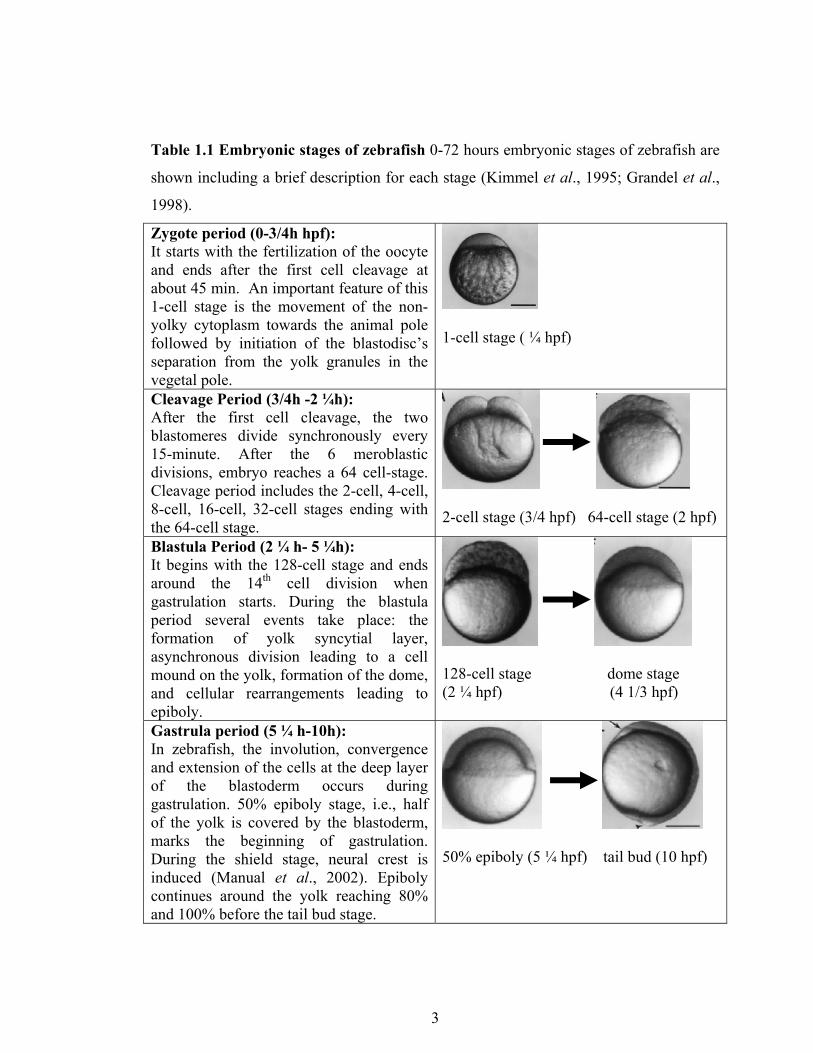
Table 1.1 Embryonic stages of zebrafish 0-72 hours embryonic stages of zebrafish are
shown including a brief description for each stage (Kimmel et al., 1995; Grandel et al.,
1998).
Zygote period (0-3/4h hpf): It starts with the fertilization of the oocyte and ends after the first cell cleavage at about 45 min. An important feature of this 1-cell stage is the movement of the non-yolky cytoplasm towards the animal pole followed by initiation of the blastodisc’s separation from the yolk granules in the vegetal pole.
1-cell stage ( ¼ hpf)
Cleavage Period (3/4h -2 ¼h): After the first cell cleavage, the two blastomeres divide synchronously every 15-minute. After the 6 meroblastic divisions, embryo reaches a 64 cell-stage. Cleavage period includes the 2-cell, 4-cell, 8-cell, 16-cell, 32-cell stages ending with the 64-cell stage.
2-cell stage (3/4 hpf) 64-cell stage (2 hpf)
Blastula Period (2 ¼ h- 5 ¼h): It begins with the 128-cell stage and ends around the 14th cell division when gastrulation starts. During the blastula period several events take place: the formation of yolk syncytial layer, asynchronous division leading to a cell mound on the yolk, formation of the dome, and cellular rearrangements leading to epiboly.
128-cell stage dome stage (2 ¼ hpf) (4 1/3 hpf)
Gastrula period (5 ¼ h-10h): In zebrafish, the involution, convergence and extension of the cells at the deep layer of the blastoderm occurs during gastrulation. 50% epiboly stage, i.e., half of the yolk is covered by the blastoderm, marks the beginning of gastrulation. During the shield stage, neural crest is induced (Manual et al., 2002). Epiboly continues around the yolk reaching 80% and 100% before the tail bud stage.
50% epiboly (5 ¼ hpf) tail bud (10 hpf)
3
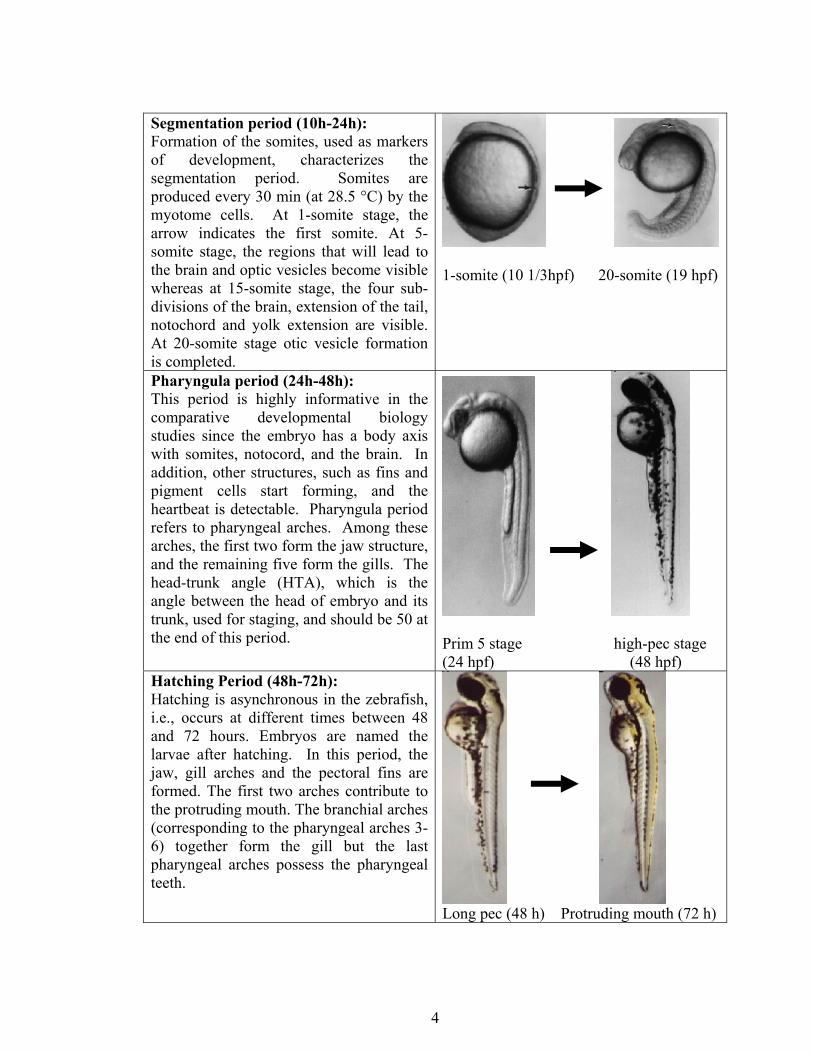
Segmentation period (10h-24h): Formation of the somites, used as markers of development, characterizes the segmentation period. Somites are produced every 30 min (at 28.5 °C) by the myotome cells. At 1-somite stage, the arrow indicates the first somite. At 5-somite stage, the regions that will lead to the brain and optic vesicles become visible whereas at 15-somite stage, the four sub-divisions of the brain, extension of the tail, notochord and yolk extension are visible. At 20-somite stage otic vesicle formation is completed.
1-somite (10 1/3hpf) 20-somite (19 hpf)
Pharyngula period (24h-48h): This period is highly informative in the comparative developmental biology studies since the embryo has a body axis with somites, notocord, and the brain. In addition, other structures, such as fins and pigment cells start forming, and the heartbeat is detectable. Pharyngula period refers to pharyngeal arches. Among these arches, the first two form the jaw structure, and the remaining five form the gills. The head-trunk angle (HTA), which is the angle between the head of embryo and its trunk, used for staging, and should be 50 at the end of this period.
Prim 5 stage high-pec stage (24 hpf) (48 hpf)
Hatching Period (48h-72h): Hatching is asynchronous in the zebrafish, i.e., occurs at different times between 48 and 72 hours. Embryos are named the larvae after hatching. In this period, the jaw, gill arches and the pectoral fins are formed. The first two arches contribute to the protruding mouth. The branchial arches (corresponding to the pharyngeal arches 3-6) together form the gill but the last pharyngeal arches possess the pharyngeal teeth.
Long pec (48 h) Protruding mouth (72 h)
4

5
1.1.2. Developmental Genetics
The development of a complex, multicellular organism from single cell is the
most fascinating event in nature. In 1980s developmental genetics studies took a turn
with the identification of mutant genes affecting the segmentation in Drosophila eggs
(Nüsslein-Volhard et al., 1980) followed by other studies in different model organisms.
Later, developmental geneticist focused on the link between the cancer and
development. Cancer has been suggested as a developmental disorder (Dean et al., 1998)
since many genes that play a key role in development might be involved in cancer. For
example, Wilms' Tumour (WT), a relatively common childhood kidney cancer, is a good
example. WT1 gene plays a role during kidney development and also in kidney
function in adults; mutant version of this protein causes kidney cancer (Kent et al.,
1995).
Another important signaling pathway during the development is the Wnt
signaling, which regulates the cellular proliferation, morphology, motility, fate, axis
formation and organ development (Kikuchi et al., 2003). Mutations in the members of
the Wnt pathway may cause different cancers depending on the mutant gene, i.e., APC
mutations, colorectal cancer (Kolligs et al., 2002); high B-catenin overexpression,
cutaneous lymphomas (Bellei et al., 2004). Wnt-signaling pathway has also a role in the
melanocyte differentiation, and this interaction has been shown on the zebrafish model
(Winlund et al., 2002). The microphtalamia-associated transcription factor (MITF) is a
down-stream target of the Wnt signal. The expression of the MITF (human) and mitfA
(zebrafish) is required for the differentiation of the melanocytes from the neural crest
cells. Studies on the melanoma patients shows that expression of the MITF is observed
in the neoplastic growth of the melanoma as in the normal development (Winlund et al.,
2003; Poser et al., 2004). Accordingly, understanding of gene regulation during
development might help further identification of candidate genes carrying oncogenic
potential.

1.1.3. Neural-crest Derived Structures
Neural crest cells bilaterally arising at the margins of the neural tube, occupy the
border between the neural and non-neural ectoderm. Neural stem cells give rise to
intermediate precursors, which then gain more specialized fates to become differentiated
cells such as cartilage, neurons, glia and melanoblasts (Fig. 1; Douarin et al., 2003;
Nieto et al., 2001). Several members of the Wnt family, fibroblast growth factor (FGF),
and bone morphogenetic protein family (BMP) have been known to play important roles
in the formation of neural crest and the delamination of the cells from neural crest
(Christiansen et al., 2000). Two kinds of neural crest cells that exist are: 1)
ectomesenchymal, i.e., cartilage, bone and adipocyte; and 2) non-ectomesenchymal, i.e.,
pigment cells, neurons and glial cells of the peripheral nervous system, and endocrine
cells (Douarin et al., 2003). As in other vertebrates, neural crest induction begins during
gastrulation period in the zebrafish embryo; and this stage is equivalent to the 6-hpf
embryo stage in which embyros move into the shield stage from that of the 50% epiboly
(Manual et al., 2002).
Fig. 1.1 Specialization of different cells from multipotent stem cells of the neural crest
(from Douarin et al., 2003).
6

7
1.1.3.1. Melanocytes
The three main pigment cell types (i.e., chromatophores) are the black
melanocytes, yellow xanthopores and silvery iridophores in zebrafish. Pigment cells are
derived mostly from the neural crest, but another source for them also exists, i.e., the
RPE (retinal pigment epithelium, only melanocytes; Kelsh et al., 2000). Melanocytes,
placed bilaterally, become detectable in the zebrafish embryos at around 24 hours
(beginning of the pharyngula period), which later form the three horizontal melanophore
stripes along the trunk. Melanocytes contain a special organelle of endosomal origin,
called melanosome where melanin is synthesized from tyrosine by using tyrosinase
(Lister et al., 2002). Development of the melanocyte depends on the activity of Wnt
signaling during the delamination process of the unipotent neural crest cells (Jin et al.,
2001; Dorsky et al., 1998; Dorsky et al., 2000). For example, high levels of Wnt-1 and
Wnt-3 expression characterize the neural crest cells that will assume the melanocyte fate.
On the other hand, BMP works antagonistically to the Wnt pathway repressing
melanogenesis but permitting the neural and glial cell differentiation (Jin et al., 2001).
1.1.3.2. Cartilage
Cartilage differentiation occurs in the ectomesenchymal cells of the neural crest.
Cartilage is made up of two cell types: the chondrocytes that exist in the matrix and the
perichondrial cells found in the enveloping mesenchyme of the organ (Kimmel et al.,
1998). For zebrafish, most of the cartilage studies are performed on the head structures,
such as, the jaws and the branchial arches (Schilling et al., 1996).

Fig. 1.2 The components of the pharyngeal skeleton.
Branchial arches 1-5
palatoquadrate
ceratohyal
hyosympletic
Mackel’s cartilage
There are seven pharyngeal arches in the zebrafish head structure; first
pharyngeal arch is called the mandibular arch, which is composed of Meckel’s cartilage
forming the lower jaw and the palatoquadrate forming the upper jaw of the mouth.
Second pharyngeal arch is called the hyoid, which consists of hyosympletic and
ceratohyal arches (Piotrowski et al., 1996). Hox genes, mainly expressed in the
rhombomeres, control the specification of neural crest cells to become the cartilage.
Some of the Hox genes are specific for certain individual arches, e.g., Hoxa2 is
responsible for the hyoid (Piotrowski et al., 1996). The primary component of the
cartilage is the col2a1 protein, a major collagen. During chondrocyte differentiation,
matrix structure around the chondrocyte is composed of the col2a1. For example, the
jellyfish (jef) mutant of zebrafish is characterized by several structural abnormalities in
the cartilage elements of neurocranium, pharyngeal arches, and the pectoral girdle (Yan
et al., 2002). Further studies indicated that jef phenotype is due to a mutation in the
sox9a gene, which directly regulates the expression of the col2a1 (Yan et al., 2002).
Therefore sox9a/jef is necessary for both the condensation and differentiation of the
cartilage.
8
9
1.1.4. Pleitropic effects
All three structures mentioned above, i.e., the melanophores, pharyngeal skeletal
elements, and the glial cells, originate from the neural crest cells. Therefore, a mutation
or environmentally induced change in the expression of a candidate gene involved in the
neural crest cell fate determination, differentiation, migration, and/or survival may lead
to multiple phenotypic consequences. Indeed, a recent study has shown that defects in
the trancription factor AP-2a result in the reduction of the embryonic melanophores, as
well as in various abnormalities in pharyngeal skeleton and the autonomic nervous
system (O’Brien et al., 2004).
1.2. FRAP/TOR SIGNALING NETWORK
TOR is an acronym for the “target of the rapamycin”. After being discovered by
Heitman and his group 10 years ago (Heitman et al., 1991), TOR function was first
characterized in yeast. Later, it was found that TOR protein structure is highly
conserved among different organisms. In short, TOR is a member of a large protein
family of PIKK (phosphoinositide kinase-related kinases) that responds to the various
intracellular and extracellular signals for cellular growth and cell cycle regulation. Other
members of this family include PI-3K, ATM (Ataxia Telangiectasia Mutated),
ATR/FRP (Ataxia Telangiectasia Related), and DNA-PKC (DNA-activated protein
kinase, catalytic subunit). All these proteins possess highly homologous protein kinase
domains at their C-termini (Rohde et al., 2001). Besides the C-terminal kinase activity,
TOR also has other important domains for its function; 1) HEAT domains to support a
large surface area by an extended superhelical structure for protein-protein interactions
(Perry et al., 2003); 2) FAT and FATC domains that lie on both sides of the kinase
domain to maintain the kinase activity; 3) a repressor domain that exists near the FATC
whose absence cause an increase in TOR kinase activity (Sekulic et al., 2000); and 4) an
FRB domain near the kinase domain with a function of inhibition of TOR activity after
binding with FKBP12/rapamycin complex ( Fingar et al., 2004).

Fig. 1.3 Multiple domains of the Human TOR (Fingar et al., 2004)
Importance of TOR arises from its regulatory kinase activity in various signaling
pathways. In the upstream of TOR, there are proteins involved in the regulation of the
nutritional and mitogenic signals, i.e., insulin/IGF receptor signaling, PI3K, PTEN,
Akt/PKB, TSC1 and TSC2 (Tuberous Sclerosis Complex 1 and 2), and Rheb (Ras-
homolog enriched in brain) (Oldham et al., 2003; Fingar et al., 2004). Once the signal
arrives at the TOR protein, TOR transmits the growth and proliferation signal to its
downstream via binding to a scaffold protein, RAPTOR (Hara et al., 2002). Recent
studies identified two important genes in the translational mechanism that is directly
linked to the kinase activity of the TOR protein. 1) 4E-BP (eukaryotic initiation factor
4E binding protein), when not phosphorylated by TOR, competes with eIF4G
(eukaryotic initiation factor 4G) to bind the eIF4E (eukaryotic initiation factor 4E), thus
reducing the efficiency of translation; and 2) p70S6K (ribosomal protein S6 kinase),
when activated by TOR, increases the efficiency of the translation of mRNA carrying 5’
oligopyrimidine tract (5’ TOP mRNA; Tereda et al., 1994). When TOR is active, the
eIF4F complex (i.e., eIF4E, eIF4G, eIF4A) is efficiently formed; and ribosomes then are
recruited to the mRNA (Gingras et al., 2001).
10

Insulin/IGF(other mitogenic and growth factos)
PIK3
11
Fig. 1.4 Upstream and downstream components of TOR.
1.3 RAPAMYCIN AS AN INHIBITOR OF FRAP/TOR
Rapamycin (Sirolimus) is a lipophilic macrolide that is produced by the soil
bacteria, Streptomyces hygroscopicus (Fig. 1.5). Its G1-arrest induction, anti-cancer,
anti-fungal and immunosuppressive effects make rapamycin a potential drug for the
investigation of the cell proliferation, growth and development (Grolleau et al., 2002).
Rapamycin can be administered via multiple routes: 1) organisms may be immersed
inside a solution/medium that contains rapamycin; or 2) rapamycin may be injected into
the embryo or larvae using a microinjection apparatus. Immersion method works well in
the yeast, Drosophila models and in mammalian cell cultures.
PIP2 PIP3 Akt(PKB) TSC1&2
PTEN Rheb
mTOR
rapamycin
raptor
S6K 4E-BP Cell proliferation,
protein sysnthesis eIF4E

Fig. 1.5 Rapamycin chemical structure
Heitman et al. (1991) studied the rapamycin-resistant yeast mutant, and found
that the FRP1 gene, whose product is FKBP12, was absent in most of the resistant yeast.
Although initially FKBP12 was thought of as a target gene for rapamycin-resistance,
later the real target was identified as TOR. Accordingly, FKBP12 is a non-essential gene
product yet its presence in the cell is necessary for the action of the rapamycin on its
target protein. Mechanistically, rapamycin first binds to FKBP12; then the resulting
protein-drug complex inhibits TOR (Heitman et al., 1991). TOR gene that contains an
FRB (FKBP-Rapamycin-Binding) domain lies between the kinase domain and FAT
domain in the C-terminal side. Once the rapamycin-FKBP complex binds to the FRB
domain, the kinase domain of the TOR becomes inactive thus preventing activation of
the downstream elements in the TOR signaling pathway.
12

13
1.4. MORPHOLOGICAL AND MOLECULAR EFFECTS OF FRAP/TOR
INHIBITION
TOR pathway is important for the proliferation of the cells and also growth of the
organism. Previous studies performed on the yeast and more complex eukaryotic
organisms show us the necessity of this pathway for cellular homeostasis. TOR studies
initially were performed on yeast; more recently, morphological and molecular effects of
TOR have been investigated by using other important model organisms such as C.
elegans, D. melanogaster. TOR function has been studied either by using mutant strains
or using a pharmacological approach, such as, administration of rapamycin. Yet, no TOR
study exists for zebrafish in the literature.
1.4.1. S. cerevicea
Organisms adjust their growth according to the nutritional cues that they detect
in their environment. In this nutrient-sensitive intracellular regulatory network, TOR
plays a central role. In the budding yeast, S. cerevicea, there are two TOR complexes,
but only one is sensitive (TORC1) to rapamycin (Loewith et al., 2002). TOR functions
in growth processes by 1) positively regulating genes with roles in ribosome biogenesis;
and 2) negatively regulating those required for the transcription of stress induced genes
(Thomas et al., 2004).
The molecular mechanism of the TOR with respect to the nutrients depends on
the activation status of the PP2A, an important phosphatase in the yeast. TOR maintains
the PP2A in its repressed state so Rtg2, Ure2 and 14-3-3 become active; ribosomal genes
are transcribed; and the transcription factors of the stress-induced genes are repressed.
When TOR is inhibited by nutrient limitation or rapamycin, PP2A becomes active and it
inhibits the function of the Rtg2, Ure2 and 14-3-3, so stress induced genes are activated
after the import process of the transcription factors, Rtg1, Rtg3, Gln3, Msn2, and Msn4
(Loewith et al., 2002; Rohde et al 2001) (Fig.6).
Since FRAP/TOR inhibition produces very similar phenotypes to starved yeast,
FRAP/TOR acts as a regulator of nutrient-sensing pathway. Starvation has different

kinds of effects on many regulatory pathways for yeast: 1) sporulation, 2) glucose
activation for the hexose transport regulation; 3) diauxic shift for the regulation of
fermentable carbon, 4) nitrogen discrimination for quality of nitrogen, 5) nitrogen
starvation for the lack of nitrogen. Hardwick et al .(1999) examined the above regulatory
pathways in order to decipher the potential role of rapamycin in nutrient-sensitive
signaling. They used yeast microarrays that contain 6220 ORFS and found that while
three of nutrient-sensitive pathways (general amino acid control, sporulation, nitrogen
starvation patway) were not under the control of rapamycin, thus TOR signaling, the
other three (i.e., glucose activation pathway, diauxic shift, nitrogen discrimination
pathway) were strongly regulated by the rapamycin (Hardwick et al., 1999).
Fig. 1.6 Effects of TOR on the import process of the transcription factor inside the
nucleus (Rohde et al., 2001).
14
15
1.4.2. C. elegans
C.elegans is insensitive to the rapamycin; therefore studies dealing with TOR
had to be performed by using RNA interference methodology and TOR mutants. The
insensitivity to rapamycin may arise from the fact that C. elegans has a cuticle, which
may prohibit the entrance of the rapamycin into the cells (Long et al., 2002).
Experiments done by Long et al. (2002) for the CeTOR mutant alleles showed that
CeTOR-deficient animals exhibited similar phenotypes to those that were starved.
However, CeTOR deficiency caused more hazardous effects, i.e., developmental arrest at
the L3 larval stage, defects in the formation of intestinal lysosome and intestinal vesicles
(Long et al., 2002). In another study by Vellai et al. (2003), absence of TOR resulted in
an extended lifespan in C.elegans in about two fold. The involvement of TOR in ageing
supports the interaction between TOR, nutrition, longevity, and metabolism.
1.4.3. D. melanogaster
As in C.elegans, an extension in the lifespan was observed in Drosophila upon
inhibition of TOR function (Kapahi et al., 2004). In Drosophila, it was found that the
tumor suppressor genes, TSC1 and TSC2 (tuberous sclerosis complex 1 and 2), inhibited
the function of TOR, so overexpression of TSC1/2 or the downregulation of TOR
resulted in an increase in the lifespan. This increase also was influenced by the
nutritional status of Drosophila as in C. elegans. When these two tumor suppressor
genes were inhibited by high levels of amino acids, TOR activated the genes involved in
the ribosome biogenesis and translational mechanism. In addition to the aminoacid
level, insulin and IGF produced similar effects on the TOR activation through the PI3K
signaling (Oldham et al., 2003) since insulin signaling passed through from PI3K to
TOR via PKB/Akt (Miron et al., 2003). Drosophila studies also showed the importance
of TOR signaling in body size regulation. Mutation in TOR caused developmental arrest
during the larval stages of Drosophila, such that mutant organisms only reached 24% of
size of the wild type (Zhang et al., 2000).

16
1.4.4. M.musculus
One mutant type of the mouse is the flat-top mutant, which exhibited severe
defects especially in its brain structure. Furthermore, flat-top mutants are relatively
smaller and short-lived (i.e., death occurs within 13 days) when compared with the wild
type embryos. Hentges et al. (2001) studied these mutant loci were homologous to those
located on the human chromosome 1p35-36 where TOR lies. Furthermore, rapamycin
treatment phenocopied the effect of the flat-top (mutant TOR) embryo.
1.5. FUNCTIONAL GENOMICS
Recent advances in the molecular biology and genetics fields, such as whole
genome sequencing, the development of gene knock-out and knock-down technologies,
as well as the availability of high throughput expression analysis by microarrays, have
accelerated the discoveries made in regards to functional genomics. Extensively
annotated complete sequences of many model organisms, such as, C. elegans, D.
melanogaster, M. musculus, have been published, allowing for comparative evolutionary
analyses of genomes. Functional genomics studies in invertebrates C.elegans and D.
melanogaster have produced vast amount of information on the function of clusters of
genes responsible for development and pathogenesis (C. elegans: Ashrafi et al., 2003,
obesity; Pothof et al., 2003, mutator genes and cancer; D. melanogaster: Pagliarini &
Xu, 2003, metastasis; Boutros et al. 2004, growth and viability). Zebrafish, although its
genome is not fully sequenced, has been highly promising as a model organism in
functional discovery due to its vertebrate status. Successful knockdown studies in fish
and amphibians have been mostly based on the use of morpholinos (Heasman et al.,
2000; Heasman et al., 2002) but recently siRNA technology also became available
(Boonanuntanasarn et al., 2003; Dodd et al., 2004). These studies proved useful in
identification and functional studies of zebrafish genes that played key roles in
developmental processes and diseases that are common among all vertebrates. For
example, Langheinrich et al., 2002 examined the zebrafish genes involved in DNA
damage-induced apoptosis using morpholinos, thus demonstrating the potential zebrafish
has as a vertebrate cancer model. Furthermore, functional genomics studies have began

17
to ease the path for novel gene discovery, which indeed is a difficult task for the fact that
gene networks cross-talk with each other, extensively.
1.6. CANDIDATE GENES IN FRAP/TOR SIGNALING
As it is explained in the part 1.2, TOR lies in center of the nutrient and growth
signaling mechanism of the cell, and the two important genes that are located
downstream of the TOR are p70S6K and the 4EBP, which act as stimulatory proteins in
the translation processes. Alteration in the expression profile of these developmental
genes during embryogenesis due to the activation status of TOR is very reasonable since
during development, de novo protein synthesis is required. Accordingly, we aimed to
find computationally the genes with expression profiles similar to that of TOR for
further characterization of the effects TOR inhibition by rapamycin in zebrafish.
1.6.1. Vxinsight as a tool for candidate gene discovery
VxInsight is a powerful visualizing program to evaluate the microarray data on a
global scale. Stuart et al. (2003) used more than 3000 microarray experiments from
SMD (Stanford Microarray Database) from H. sapiens, D. melanogaster, C. elegans
and S. cerevisiae, to construct a gene co-expression network. They solved the
nomenclature problem of the homologus genes from these four different organisms by
using a new concept called the meta-gene (MEG). In their construction, there were a
total of 6307 meta-genes derived from 6591 human, 5180 worm, 5802 fly, and 2434
yeast genes. Each meta-gene was then placed on the coordinate system of a 2-
dimentional map of the VxInsight, so that one could localize the gene of interest as well
as its expressionally co-regulated neighbors. FRAP/TOR with a meta-gene number of
MEG-1077 were found to be connected to a network of genes through HIPK; among
several genes that seemed promising for further study, here in we focus on MITF (MEG-
1228) which is involved in melanocyte differentitation from neural crest cells.
1.6.2. mitfA
MITF (microphthalmia -associated transcription factor) is a basic helix-loop-
helix-leucine zipper protein, with a significant role in establishing the melanocyte fate
from neural crest cells (Winlund et al., 2003). Identification of the nacre mutation in
zebrafish helped to elucidate the mechanisms of melanocyte formation in zebrafish,
because nacre embryos did not show the characteristic pigmentation pattern of the
embryo except in the retina of the eye. The aberrant gene in nacre was found to be an
ortholog of the mammalian Mitf by Lister et al (1999), and named as mitfA because
zebrafish genome has a paralog of mitfA, i.e., mitfB, which compensated the function of
the mitfA on the pigmentation of eye in nacre mutant (Lister et al., 2001; Lister et al.,
2002). Defects in MITF also lead to abnormalities in the coat color of mouse
(Hodgkinson et al., 1993), and deafness and the Waandenburg Syndrome in humans
(Widlund et al., 2003).
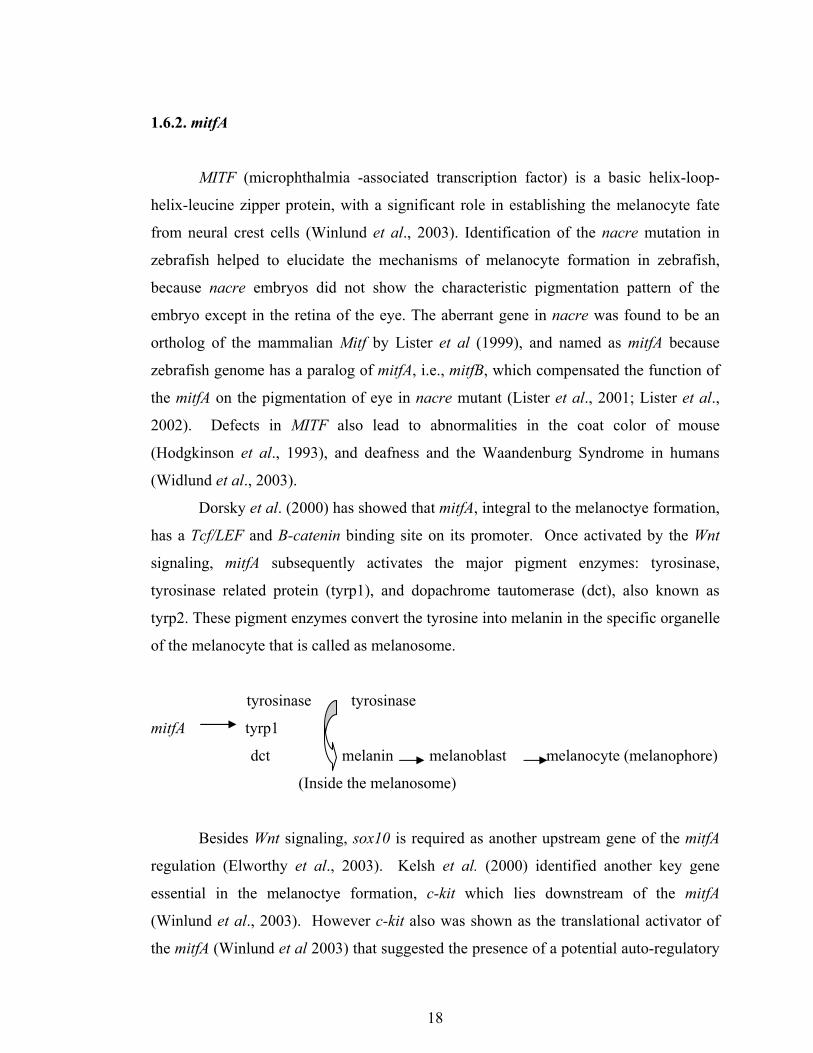
Dorsky et al. (2000) has showed that mitfA, integral to the melanoctye formation,
has a Tcf/LEF and B-catenin binding site on its promoter. Once activated by the Wnt
signaling, mitfA subsequently activates the major pigment enzymes: tyrosinase,
tyrosinase related protein (tyrp1), and dopachrome tautomerase (dct), also known as
tyrp2. These pigment enzymes convert the tyrosine into melanin in the specific organelle
of the melanocyte that is called as melanosome.
tyrosinase tyrosinase
18
mitfA tyrp1
dct melanin melanoblast melanocyte (melanophore)
(Inside the melanosome)
Besides Wnt signaling, sox10 is required as another upstream gene of the mitfA
regulation (Elworthy et al., 2003). Kelsh et al. (2000) identified another key gene
essential in the melanoctye formation, c-kit which lies downstream of the mitfA
(Winlund et al., 2003). However c-kit also was shown as the translational activator of
the mitfA (Winlund et al 2003) that suggested the presence of a potential auto-regulatory

mechanism between the mitfA and c-kit. The general scheme for the Mitf expressional
regulation was graphically summarized in Fig. 7.
Fig. 1.7 Role of mitfA in pigmentation
Sox10 Wnt
mitfB mitfA
?
C-kit
tyr,tyrp1,dct
melanophores
dct,tyr
retinal pigmetation
19
20
2. AIM OF THE STUDY 2.1. AIM
FRAP/TOR expression plays an important role in the cell cycle regulation and
nutritional control of translation. Rapamycin, as a specific inhibitor of FRAP/TOR at the
protein level, allows for characterization of the mechanisms involved in this pathway.
Effects of rapamycin have been studied in many model organisms, including S.
cerevicea, C. elegans, D. melanogaster, M. musculus, as well as in different cell lines.
Our primary aim was to investigate the FRAP/TOR function in the zebrafish embryos,
whose TOR signaling has not been previously studied.
2.2. STRATEGY
In order to study FRAP/TOR function in zebrafish, we used a strategy involving
lack of function studies was used. Thus we aimed to inhibit the FRAP/TOR function a)
at the protein level by using rapamycin; and b) at the transcriptional level by using
siRNA designed for DrTOR. Accordingly, we attempt to show the effects of TOR
inhibition by using real time RT-PCR, morphometrics, and histological techniques.

21
3. MATERIALS AND METHODS
3.1. ANIMALS
Zebrafish (Danio rerio) used in the presents experiments were purchased from a
pet-shop. The AB strain from University of Oregon at Eugene, OR, USA, also was
established in the laboratory for further studies.
3.1.1. Maintenance
3.1.1.1. Aquaria system and water condition
Zebrafish were kept in glass aquaria (50 x 30 x 23 cm), which hold about 30
liters (6 gallons) of system water. Tap water was allowed to stay for two days before
being fed into the system. Each aquarium was equipped with a standard filtering system
that has a coarse mechanical filter, while providing large surface area for the denitrifying
bacteria. Five percent of the water was replaced with fresh system water daily, or
alternatively 1/3 of the tank water was replaced weekly.
Illumination period should be 14h light/10h dark for efficient zebrafish
maintenance and optimal breeding. This cycle was kept constant by using a clock timer.
Embryos were handled during the dark period if necessary under a red-light lamp for not
to disturb the fish.
.
3.1.1.2. Housing and feeding
Adult zebrafish were of 3-4 cm in length; and up to 15 adults were kept in a 30-
liter aquarium. Adult fish were fed dry food flakes twice per day. For efficient
breeding, live food also is necessary; thus fish were fed Artemia nauplia every other
day. For hatching the Artemia, inverted plastic bottles with cut-off bottom were used,
(Fig. 3.1). 5 g of Ocean Salt was added into 200 ml constantly aerated distilled water;
and temperature was kept at 28.5 °C. At the end of 48 hours, hatched Artemia were
collected using a plastic pipette; filtered through paper towels and rinsed by system
water.

Fig. 3.1 Hatching system.
3.1.2. Breeding
For efficient breeding, fish kept at a constant 14h/10h light/dark regime at 28.5
°C. Pairs of male and female fish were put in the breeding cages in the afternoon; the
fertilized eggs were collected in the morning. Zebrafish are photoperiodic in their
breeding, and produce embryos every morning. Up to 70 to 300 embryos could be
obtained per day in our laboratory, and generally ~ 50 to 80% of them were fertilized.
Unfertilized eggs were discarded immediately while fertilized eggs were transferred into
a 95-mm Petri dish and washed several times in system water.
3.1.3. Embryo handling
Maximum of 70 embryos were kept in each 95-mm Petri dish in E3 embryo
medium (5mM NaCl, 0.17 mM KCl, 0.33 mM CaCl2, 0.33 mM MgSO4 and 10-5%
methylene Blue) or in the system water. Petri dishes were kept in an incubator, set at
28.5 °C with a 14h light/10h dark illumination period. In order to treat multiple
embryos either with rapamycin, siRNA or control solutions, they were transferred into
the 96-well plates (Fig. 3.2). Within each well, up to 5 embryos were treated by a
maximum of 250 µl treatment solution. Embryos were kept in these wells until 6 days
post fertilization (dpf) since they feed from their yolk. For the purposes of this thesis,
embryos were studied until they were 6 dpf while zebrafish older than 6 dpf were kept in
22
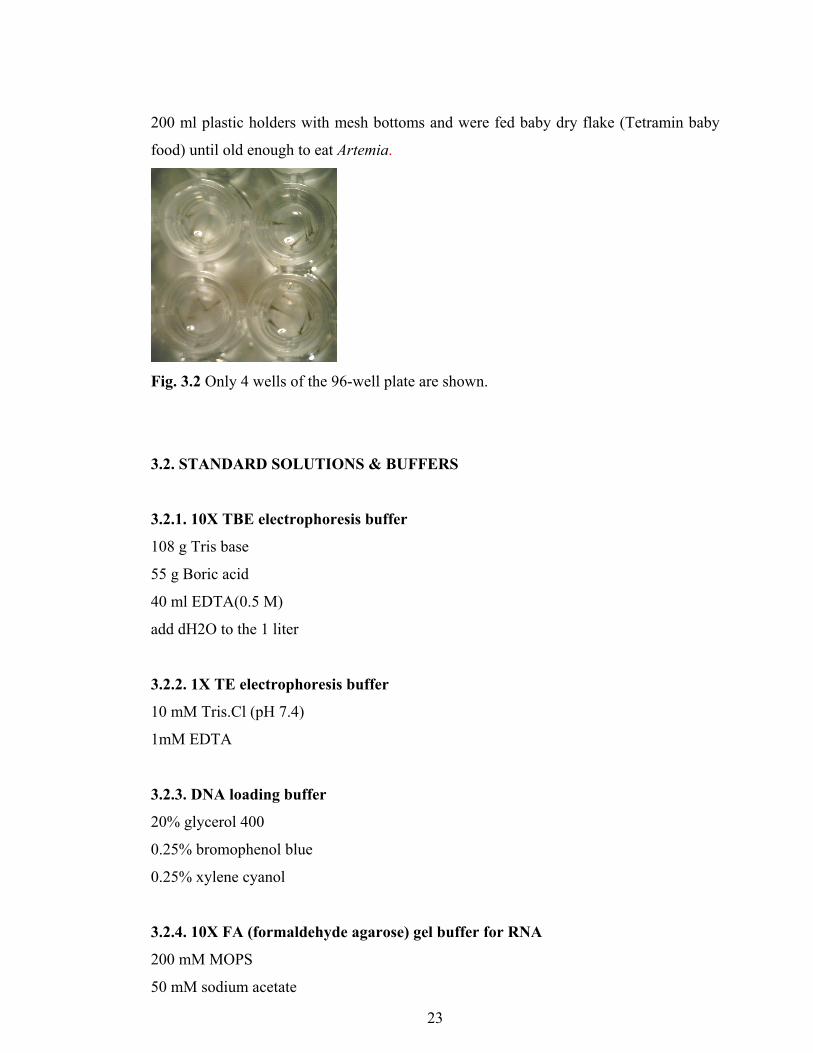
200 ml plastic holders with mesh bottoms and were fed baby dry flake (Tetramin baby
food) until old enough to eat Artemia.
Fig. 3.2 Only 4 wells of the 96-well plate are shown.
3.2. STANDARD SOLUTIONS & BUFFERS
3.2.1. 10X TBE electrophoresis buffer
108 g Tris base
55 g Boric acid
40 ml EDTA(0.5 M)
add dH2O to the 1 liter
3.2.2. 1X TE electrophoresis buffer
10 mM Tris.Cl (pH 7.4)
1mM EDTA
3.2.3. DNA loading buffer
20% glycerol 400
0.25% bromophenol blue
0.25% xylene cyanol
3.2.4. 10X FA (formaldehyde agarose) gel buffer for RNA
200 mM MOPS
50 mM sodium acetate
23

24
10 mM EDTA
pH to 7.0 with NaOH
3.2.5. 1X FA gel running buffer
100 ml 10X FA gel buffer
20 ml 37% (12.3 M) formaldehyde
880 ml RNase-free water
3.2.6. 5X RNA loading buffer
16 µl saturated aqueous bromophenol blue solution
80 µl 500 mM EDTA, pH 8.0
720 µl 37% (12.3 M) formaldehyde
2 ml 100% glycerol
3084 µl formamide
4 ml 10X FA gel buffer
RNase-free water to the 10 ml.
3.2.7. traciane solution (stock)
400 mg tricaine powder
97.9 ml dd H2O
~2.1 ml 1 M Tris (pH 9)
to use as an anesthetic:
4.2 ml tricaine stock solution
~100 ml clean tank water
3.2.8. PFA (4%)
0.8 g paraformaldehyde (powder)
20 ml PBS
store at 4 °C in dark , its efficient stability was 2-3 days

25
3.2.9. PBS
8 g NaCl
0.2 g KCl
1.44 g Na2HPO4
0.24 g KH2PO4
dissolve in 800 ml dH2O, adjust the pH 7.4 with HCl
add dH2O to 1 liter
3.2.10. PBT (0.1%)
40 ml PBS
40 µl Tween20
3.2.11. neutral 10% formalin
10 ml (37%) formaldehyde
0.4 g NaH2PO4
0.65 g Na2HPO4
add dH2O to 100 ml, adjust the pH 7.0
3.2.12. DEPC-H2O
500 µl DEPC (from AppliChem)
1 liter dH2O
o/n aeration, autoclave
3.2.13. Alcian blue solutions (0.1%)
100 mg alcian blue dye (powder)
70 ml EtOH (100 %)
30 ml glacial acetic acid

26
3.3. RAPAMYCIN TREATMENT OF EMBRYOS
Rapamycin (MW: 914.2 g) was ordered from the Calbiochem as 1 g solid
product (Calbiochem, Germany, Catalog # 553210). This 1 g product was dissolved in a
200 µl DMSO (dimethlysulphoxide) as a stock solution that has a concentration of 5
mM; and was stored at -20°C in dark. To decrease the harmful effect of the thawing in
each use, it was aliquoted as 20 µl samples. Its concentration was then adjusted to 20
µM, 2 µM and 1 µM by making appropriate dilutions using the system water or the E3
medium. These solutions with variable concentrations were applied to the zebrafish
embryos in the wells of a 96-well plate. In each experiment, control solutions were
prepared by including the same amount of DMSO as found in the rapamycin solutions.
At 8, 12, 16, 20, 24, 36, and 48 hpf, and 3, 4 and 5 dpf embryos were removed from
wells; either observed and photographed in the depression slide and/or fixed in
paraformaldehyde or formalin.
3.4. PHENOTYPIC SCREENING METHODS
3.4.1. Morphometric measurements
The zebrafish larvae were examined under the dissecting microscope (Zeiss,
Stemi 1000; Fig. 3.3). Standard length measurements were taken by using a computer
program (TPS, SUNY-Stony Brook, http://life.bio.sunysb.edu/morph/) on the digital
photos (Pretec, DC 1310, 1.3 mega pixels). The coordinates were saved as a text file;
and standardization of each set of measurements was made by using coordinates from a
micrometer photograph, separately taken for each sample. A Matlab® program was
used to convert the coordinates into Euclidean distances in mm, and statistical analyses,
i.e., ANOVA and regression also were performed using Matlab® anova1, anovan, and
regress built-in function (see Appendix A for the code of program ).

Fig. 3.3 Zeiss microscope and incubator at 28.5 °C.
3.4.2. Fixation of embryo/larva
Embryos were anesthetized in the tricaine solution (0.08%, SIGMA, Catalog#
5040) and then fixed in either parafomaldeyhde or formalin for alcian blue staining.
Larvae were treated in a PFA solution (4% paraformadehyde in PBS) or buffered
formalin (10%) for 2 hours at RT or overnight at 4 °C; followed by washing in the PBT
for 10 min at 4 °C. They were then dehydrated in a MeOH:PBT series (1:3/1:1/3:1) for
10 min at RT in each solution; and were stored in the 100% MeOH at -20 °C.
3.4.3. Cartilage staining and morphology
Paraformaldehyde-fixed larvae were rinsed in the 80% EtOH/ 20 % glacial acetic
acid. The larvae were then stained in a 0.1% Alcian Blue solution dissolved in 80%
ethanol/20% glacial acetic acid for 6-8 hours; and de-stained in the 80% EtOH/20%
glacial acetic acid several times. Larvae were rehydrated gradually in the EtOH/PBS
series (3:1/1:1/1:3) in dark; followed by bleaching in the 1% KOH/3% H2O2 for about 1
hour. At the end, they were de-stained in a 0.1% KOH/glycerine series, and were stored
in the 75-100% glycerol.
27

28
3.4.4. Melanocyte morphology and distribution
Melanocytes were examined under the microscope for their characteristic larval
pattern and digital photographs were taken for visualization and presentations.
3.5. DETERMINATION OF GENE EXPRESSION
mRNA expression of several genes from embryos, larvae, and various adult
tissues were quantified. Therefore, total RNA from multiple samples were extracted;
reverse transcribed into cDNA; and qualitative PCR and/or real-time quantitative PCRs
were performed on these samples.
3.5.1. Total RNA Isolation from Embryos and Adult Tissues
During RNA isolations, all material and solutions were treated with diethyl
pyrocarbonate (DEPC) to inhibit the RNase contamination. Larval and adult zebrafish
samples were first put into the RNAlater solution or liquid N2. Total RNA isolation was
performed by using the Qiagen RNeasy Mini Kit or Ambion Totally RNA isolation kit.
Briefly, samples were removed from RNAlater and put in the RLT buffer, which
contains 1% B-ME (B-mercaptoethanol). Samples were homogenized in RLT by using
20 gauge needles. One volume of 70% EtOH was added to the homogenized lysate, and
mixed well. Up to 700 µl of the sample were added to an RNeasy mini column in a 2 ml
tube; and centrifuged for 15 s at 10.000 rpm. After discarding the flow-through, 700 µl
buffer RW1 were added to the RNeasy column, centrifuged for 15 s at 10.000 rpm. After
discarding the flow-through, 500 µl buffer RPE, which contains 4 times 100% EtOH,
were added onto the RNeasy column, and centrifuged for 15 s at 10.000 rpm; and this
was repeated a second time followed by centrifugation for 1 min at full speed. The
column was placed in the 1.5 ml collection tube; and 30 µl RNase-free water were
pipetted on the center of the RNeasy silica gel membrane; and centrifuged for 1 min at
10.000 rpm. At the end, the elute containing RNA of the sample was stored at -80 °C.
29
Alternatively, RNA was isolated using Totally RNA Isolation Kit (Ambion).
Samples were removed from the RNAlater and put in the at least 200µl denaturation
solution and homogenized by using a 20 gauge needle. One volume of the
phenol:chloroform:IAA was added to the lysate and shaked for 1 min. The
lysate/phenol was stored on ice for 5 min then centrifuged for 5 min at the 12.000 rpm at
4 °C. The upper aqueous phase was transferred to a new vessel; and 1/10 aqueous phase
volume of the Sodium Acetate solution was added to the phenol extracted lysate. Then,
a volume of acid-phenol:chloroform was added and shaken for 1 min. The lysate/phenol
was stored on ice for 5 min and was centrifuged for 5 min at 12.000 rpm at 4 °C. The
aqueous phase transferred to a new vessel; and one aqueous phase volume of the
isopropanol was added to the preparation; mixed well; placed at -20 °C for at least 30
min; and then centrifuged at 12.000 rpm for 15 min. Supernatant was carefully discarded
and the pellet was washed with the 70% EtOH to remove the residual salts. Finally, the
pellet was resuspended in the 30-50µl of DEPC Water/EDTA and stored at -80 °C.
3.5.2. Determination of RNA Concentrations by Spectrophotometer
2 µl of each sample were diluted (1:200) with 400 µl DEPC-treated ddH2O.
Then, the measurements were taken at 260 nm and 280 nm by using the Beckman
spectrophotometer. The concentration was calculated by using the formula below given
below:
[RNA]=O.D260*40*d.f(200)
O.D 260/O.D 280 ratio is used the purification quality of the RNA. Most ratios were
between 1.8 and 2.1, as expected.

30
3.5.3. Denaturing Agarose Gel Electrophoresis
3.5.3.1. Preparation of the FA (formaldehyde agarose) Gel (1.2 %)
1.2 g agarose was added into 10 ml 10 X FA gel buffer followed by the addition
of the RNase free water to 100 ml. Mixture was heated to melt the agarose then it was
cooled to 65 °C. 1.8 ml of 37% (12.3 M) formaldehyde; and 1µl of a 10 mg/ml ethidium
bromide stock solution was added; mixed thoroughly and poured onto the gel support.
3.5.3.2. Preparation of samples for loading
One volume of 5X loading buffer per 4 volumes of the RNA sample (for low
RNA amounts RNA was diluted in the DEPC–water) was added and mixed; incubated
for 3-5 min at 65 °C; then chilled on ice; and loaded onto the pre-equilibrated FA gel.
1X FA gel running buffer was used for equilibration. The samples were then run at 5-7
V/cm in 1X FA gel running buffer. The gels were visualized under the U.V light and
images were analyzed using the Multi-Analyst Software.
3.5.4. cDNA Conversion
After the RNA isolation and measurements, equal amounts of the RNA were
converted into the 1st strand cDNA by using the Fermentas cDNA kit (Catalog# 1622).
First, RNA was annealed by the oligodT primers for 5 min at the 70 °C. This mixture
was treated by an RNase inhibitor for 5 min at the 37 °C. Finally, mixture was treated by
the MMLV-reverse transcriptase for 1 hour at 42 °C and 10 min at 70 °C. The cDNAs
were stored at the -20 C.
3.5.5. Primer Design
Primers were designed by using a software program, the Primer Designer
Version 2.0 (Scientific and Educational Software). System defaults used were given in
the Table 3.1 and the following primers were ordered accordingly (Table 3.2):
31
Table 3.1 The default parameters used as primer design criteria by Primer Designer
Version 2.0.
%GC : 50%-60%
Tm°C range : 55 °C -80 °C
Hair pin energy cut off : 0.0 kcal
Dimers:
Reject if >= 3 matches at the 3’ end
Reject if >=7 adjecent homologous bases
Runs of bases:
Reject runs if >=3 bases any
Reject runs if >=3 G or C at the 3’ end
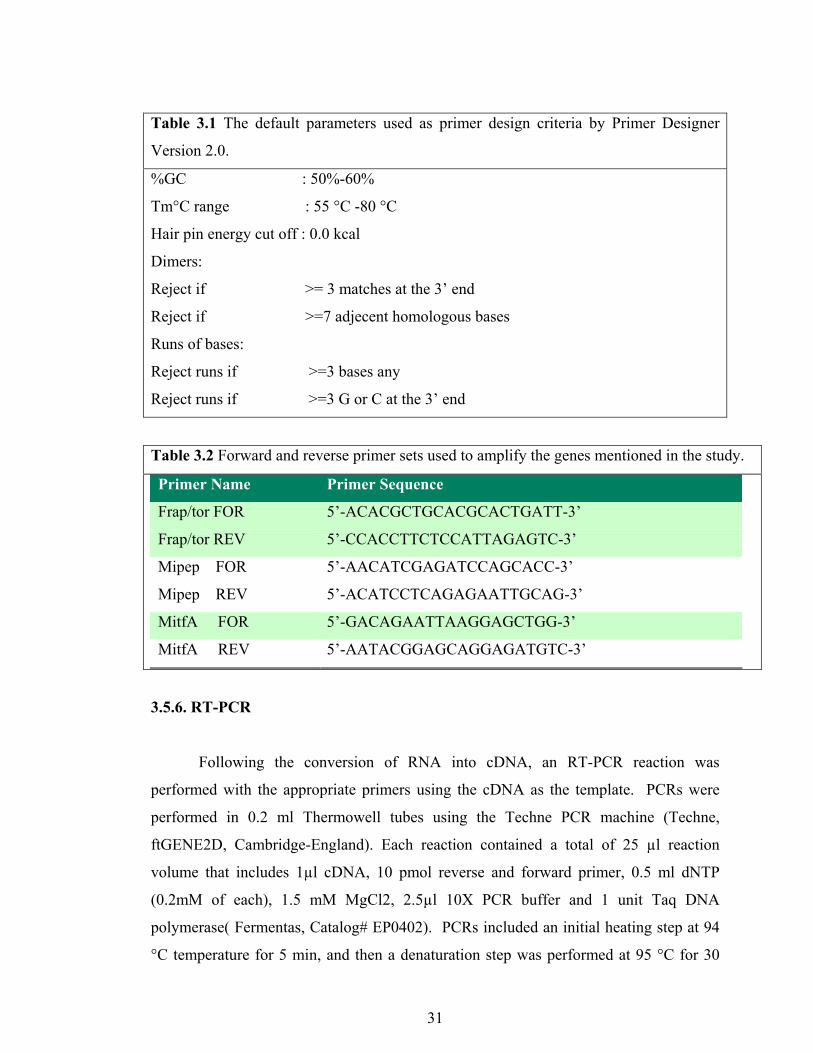
Table 3.2 Forward and reverse primer sets used to amplify the genes mentioned in the study.
Primer Name Primer Sequence
Frap/tor FOR 5’-ACACGCTGCACGCACTGATT-3’
Frap/tor REV 5’-CCACCTTCTCCATTAGAGTC-3’
Mipep FOR 5’-AACATCGAGATCCAGCACC-3’
Mipep REV 5’-ACATCCTCAGAGAATTGCAG-3’
MitfA FOR 5’-GACAGAATTAAGGAGCTGG-3’
MitfA REV 5’-AATACGGAGCAGGAGATGTC-3’
3.5.6. RT-PCR
Following the conversion of RNA into cDNA, an RT-PCR reaction was
performed with the appropriate primers using the cDNA as the template. PCRs were
performed in 0.2 ml Thermowell tubes using the Techne PCR machine (Techne,
ftGENE2D, Cambridge-England). Each reaction contained a total of 25 µl reaction
volume that includes 1µl cDNA, 10 pmol reverse and forward primer, 0.5 ml dNTP
(0.2mM of each), 1.5 mM MgCl2, 2.5µl 10X PCR buffer and 1 unit Taq DNA
polymerase( Fermentas, Catalog# EP0402). PCRs included an initial heating step at 94
°C temperature for 5 min, and then a denaturation step was performed at 95 °C for 30

32
min as first step of the 30-35 cycles of the loop. Annealing temperature was the second
step of the loop (Table 3.3).
Table 3.3 Annealing temperatures optimized for the PCR reactions of the candidate
genes.
Primer set Annealing temperature (30sec)
Frap/tor 60 °C
Mipep 57 °C
MitfA 56 °C
Elongation was performed at 72 °C for 30 seconds for each primer set. At the
end of the 30-35 cycles, a final extension at 72 °C for 10 minutes was also performed. 20
µl of the product was loaded on a 2% agarose gel in the electrophoresis system for
visualization and characterization of the PCR products.
3.5.7. Real Time RT-PCR
Qiagen Real-Time Kit, which contained SYBR green as a marker dye for
measurement of PCR yield in each cycle, was used for all reactions. 12.5 µl SYBR-
green mix, 10 pmol forward and reverse primers, and 1 µl cDNA were mixed in the
supported 96 well-plate and RNase-free water was added to 25 µl in each well; and 3 µl
mineral oil was added at the top of the solution to inhibit the evaporation of the product
from the well. PCR reactions were performed using the BIO-RAD iCYCLER machine.
For each primer set, PCR program was the same with that explained in the section 3.5.5,
but additionally iCYCLER reactions included a pre-activation step for the hot-start
Qiagen Taq DNA polymerase (95 °C for 8-10 min). A melt curve was generated at the
end of each set of reactions beginning with 55 °C and ending at 95 °C by 0.5 °C
increments in each 15 second. The expression profiles over the embryonic time course
were analyzed using sign-rank tests (matlab® sign rank function). Sign-rank test
compares paired samples (control and rapamycin samples at specific time points) and
gives a probability value describing the likelihood of having the observed expression
difference by chance alone.

33
3.6. siRNA TREATMENT
3.6.1. siRNA Design
A 5’ siRNA for the degradation of the target DrTOR mRNA was designed from
the putative exon 6 of the gene. Candidate siRNA target sequences were determined
using the tools provided by Qiagen (www.qiagen.com); then analyzed by the blast
program in the ENSEMBL (www.ensembl.gov) and NCBI (www.ncbi.nlm.nih.gov)
databases to select those siRNAs with the least possible homology to other sequences in
the genome. The selected siRNA sequence was as follows:
5’-AAGGATGATCGTGTACATGGA-3’,
This target sequence was used to produce the sense and antisense strands (Table
3.4) by the siRNA template design tool on the website of AMBION (www.ambion.com).
Table 3.4 The sense and antisense sequences for the DrTOR siRNA
Results: Antisense siRNA Oligonucleotide Template: 5'- AAGGATGATCGTGTACATGGACCTGTCTC -3' Results: Sense siRNA Oligonucleotide Template: 5'- AATCCATGTACACGATCATCCCCTGTCTC -3'
3.6.2. siRNA Production:
dsRNA was obtained using the siRNA contstruction kit by Ambion (Catalog #
1620). The manufacturer’s protocols are as briefly described below:
3.6.2.1. Transcription Template Preparation
The sense and antisense template oligonucleotides (DNA) were converted to
dsDNA using the T7 promoter primer and exo-klenow fragment.
3.6.2.2. dsRNA Synthesis
Oligonucleotides were used as templates for the in vitro transcription process.
By using the T7 RNA polymerase, single stranded RNA products for sense and

34
antisense oligonucleotides were obtained, and then these ssRNAs were assembled in the
same reaction tube overnight at 37 °C to obtain a dsRNA product.
3.6.2.3. siRNA Preparation/Purification
To remove the 5' overhanging leader sequences, leader sequence was digested by
the single strand specific ribonuclease (RNase). DNA template also was eliminated by
the DNase treatment in the same digestion buffer. Afterwards, dsRNA were treated by
the siRNA binding buffer and siRNA wash buffer, finally dsRNA was eluted into RNase-
free water and stored at –80 °C (Fig. 3.4).
3.6.2.4. siRNA Quantification
.
siRNA was diluted 100 times in the TE buffer; and its absorbance was measured
by the spectrophotometer at 260 nm. The absorbance value was multiplied by the 4000;
and the result was divided by 14 since there are 14 µg of RNA in 1 nmole of an average
21-mer dsRNA. siRNA was used after the appropriate dilution as a solution.
3.6.3. siRNA Treatment on Zebrafish Embryos
ds siRNA were given to the embryos in 96-well plates, 4-5 embryos were treated
with the 40 nM, 80 nM siRNA containing E3 medium; a control with no siRNA was also
present.
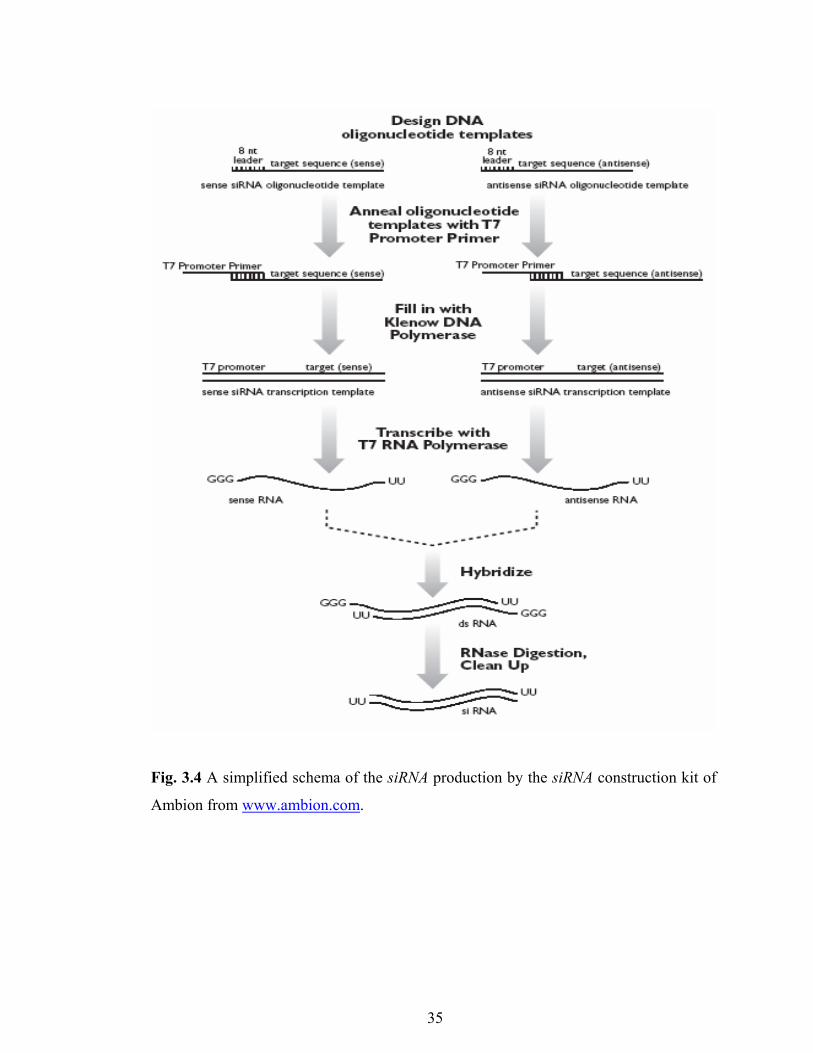
Fig. 3.4 A simplified schema of the siRNA production by the siRNA construction kit of
Ambion from www.ambion.com.
35

36
4. RESULTS
4.1. IN SILICO CONSTRUCTION OF ZEBRAFISH TOR (DrTOR) GENE
FRAP/TOR gene was not fully annotated in any of the genome browsers on the
WWW until recently. In order to the characterize TOR gene for Danio rerio in silico,
human, mouse and rat FRAP/TOR genomic sequences were used for the blast analysis to
find Dr FRAP/TOR in the genome of zebrafish. At the moment, genome of the
zebrafish, composed of many supercontigs, is partially assembled on the ENSEMBL
web site (http://www.ensembl.org/Danio_rerio/). Recently, zebrafish TOR has been
partially annotated in the ENSEMBL database. Therefore, the information provided in
regards to assembled parts of the DrTOR in ENSEMBL also was used. Exon homology
study involved the comparisons between all known exons of the human, rat, mouse TOR
genes against the most current version of the zebrafish genome (3b WTSI Zv3, 01 April
2004).
4.1.1. Exon Homology
The blast analyses of each exon of the mammalian FRAP/TORs against zebrafish
genome were performed using the ENSEMBL zebrafish BLAST/SSAHA program
(Table 4.1).
Table 4.1 Chromosomal locations, ensembl ID numbers, and certain features of the
mammalian TOR genes
FRAP/TOR gene ensembl ID locus
number of exons
transcript length (bp)
translation length (a.a)
Human ENST00000263936
chromosome 1 57 8619 2555
Mouse ENSMUST00000057580
chromosome 4 58 7718 2546
Rat ENSRNOT00000014167
chromosome 5 58 7653 2550
.

37
Table 4.2 Homology comparisons of human, mouse and rat exons of TOR genes against
the zebrafish genome. No hit refers to the absence of any significant homology between
that particular exon and zebrafish genome for a specified species. * indicates that no
homology could be identified by the ENSEMBL blast program, so that sequence
similarity was calculated by using the clustalW program (http://www.ebi.ac.uk/cgi-
bin/clustalw/). The values whose boxes are marked by the blue color were found in the
1bp to 34766 bp of the Supercontigfinished 202, other values were calculated according
to the region on the chromosome 8.
Human exons % identity Mouse exons
% identity Rat exons
% identity
Human exon1 76.47 mouse exon1 no hit rat exon1 74.26 Human exon2 80.73 mouse exon2 72.79 rat exon2 75.23 Human exon3 79.13 mouse exon3 76.15 rat exon3 79.57 Human exon4 78.11 mouse exon4 77.39 rat exon4 77.11 Human exon5 81.48 mouse exon5 *74 rat exon5 80.74 Human exon6 75.18 mouse exon6 82.22 rat exon6 75.18 Human exon7 74.07 mouse exon7 76.34 rat exon7 75.23 Human exon8 67.21 mouse exon8 78.7 rat exon8 *67 Human exon9 80.62 mouse exon9 *66 rat exon9 78.29 Human exon10 81.63 mouse exon10 79.84 rat exon10 81.3 Human exon11 81.94 mouse exon11 79.59 rat exon11 82.41 Human exon12 84.54 mouse exon12 84.72 rat exon12 83.09 Human exon13 81.3 mouse exon13 84.54 rat exon13 79.67 Human exon14 68.89 mouse exon14 78.86 rat exon14 *67 Human exon15 78.49 mouse exon15 70 rat exon15 80.85 Human exon16 77.94 mouse exon16 76.34 rat exon16 78.68 Human exon17 82.81 mouse exon17 80.15 rat exon17 83.59 Human exon18 81.2 mouse exon18 82.81 rat exon18 82.4 Human exon19 *71 mouse exon19 80.8 rat exon19 79.52 Human exon20 77.51 mouse exon20 80.72 rat exon20 76.92 Human exon21 74.34 mouse exon21 78.57 rat exon21 79.79 Human exon22 *71 mouse exon22 77.88 rat exon22 73.01 Human exon23 81.72 mouse exon23 *71 rat exon23 81.72 Human exon24 No hit mouse exon24 82.8 rat exon24 no hit Human exon25 76.92 mouse exon25 no hit rat exon25 no hit Human exon26 77.91 mouse exon26 no hit rat exon26 78.17 Human exon27 80.27 mouse exon27 77.62 rat exon27 78.53 Human exon28 84.21 mouse exon28 80.98 rat exon28 78.91 Human exon29 79.29 mouse exon29 78.23 rat exon29 81.58 Human exon30 82.29 mouse exon30 81.58 rat exon30 80.71 Human exon31 *78 mouse exon31 79.29 rat exon31 81.25 Human exon32 No hit mouse exon32 83.33 rat exon32 79.31 Human exon33 No hit mouse exon33 87.07 rat exon33 no hit Human exon34 No hit mouse exon34 no hit rat exon34 no hit Human exon35 72.33 mouse exon35 no hit rat exon35 no hit

38
Human exon36 81.9 mouse exon36 no hit rat exon36 *71 Human exon37 80.34 mouse exon37 *72 rat exon37 82.3 Human exon38 87.37 mouse exon38 82.3 rat exon38 83.19 Human exon39 *77 mouse exon39 83.9 rat exon39 87.38 Human exon40 75.51 mouse exon40 68.1 rat exon40 73.53 Human exon41 80.81 mouse exon41 *73 rat exon41 81.63 Human exon42 80.49 mouse exon42 81.63 rat exon42 78.79 Human exon43 79.23 mouse exon43 77.78 rat exon43 82.11 Human exon44 80 mouse exon44 83.74 rat exon44 78.14 Human exon45 78.86 mouse exon45 78.69 rat exon45 81.48 Human exon46 *77 mouse exon46 82.22 rat exon46 78.86 Human exon47 83.67 mouse exon47 78.86 rat exon47 *80 Human exon48 84.55 mouse exon48 80.15 rat exon48 84.35 Human exon49 *78 mouse exon49 84.35 rat exon49 86.18 Human exon50 *78 mouse exon50 80.49 rat exon50 83.13 Human exon51 *82 mouse exon51 81.93 rat exon51 82.19 Human exon52 *87 mouse exon52 *82 rat exon52 84 Human exon53 *77 mouse exon53 82.67 rat exon53 *84 Human exon54 *67 mouse exon54 *88 rat exon54 *78 Human exon55 *75 mouse exon55 *78 rat exon55 *67 Human exon56 *82 mouse exon56 *66 rat exon56 *79 Human exon57 No hit mouse exon57 *80 rat exon57 *83 mouse exon58 *81 rat exon58 no hit
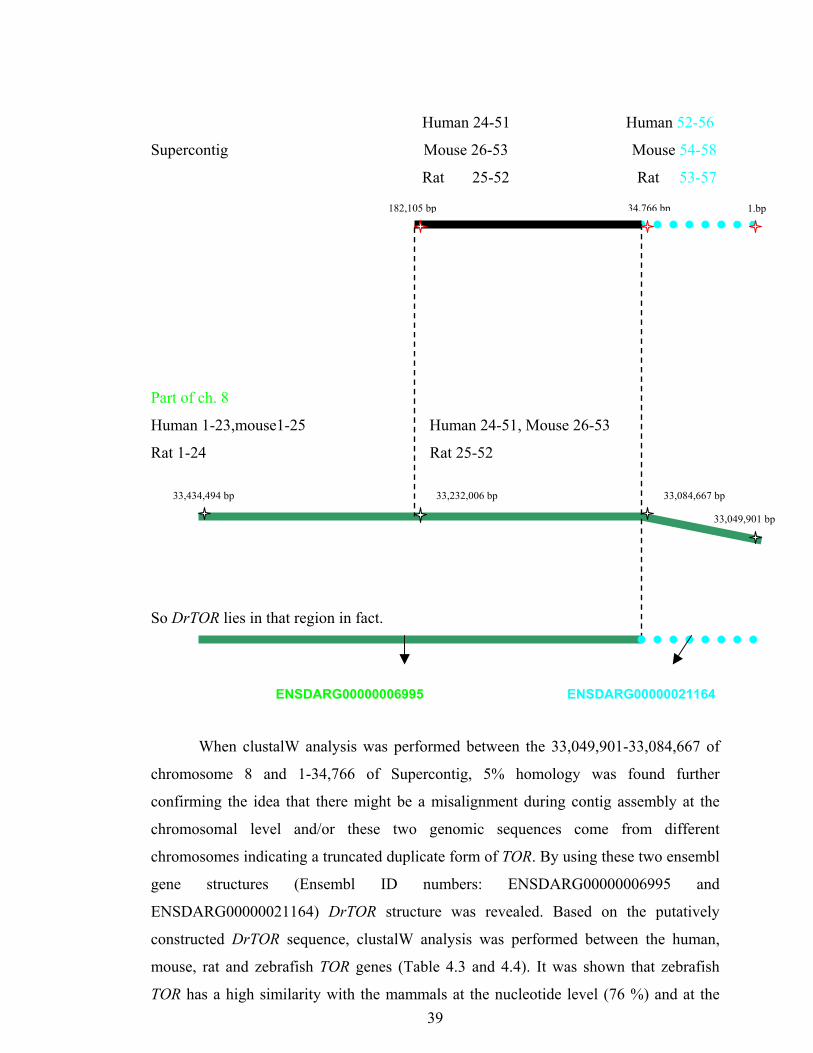
Accordingly, it was shown that most of the exons in human (up until exon 51),
mouse (up until exon 53) and rat (up until exon 52) TOR also were found on the
chromosome 8 of zebrafish; and this region laid between the 33,084,667 to 33,434,494
of the chromosome 8, with an ensemble gene ID of ENSDARG00000006995. There was
also a contig sequence in the zebrafish genome to which the human exons from 24 to 51,
mouse exons from 26 to 53, and rat exons from 25 to 52 showed homology (from 34766
to 182,105 of the supercontigfinished 202). Particularly interesting was that the
remaining exons (human52-56,mouse 54-58 and rat 53-57) also were found in this
supercontig (i.e., from positions 1 to 34766). However, when walked 34766 bp further
on the chromosome 8 (i.e, 33,084,667-34766=33,049.901), no homology existed in
regards to these final five exons. Thus, a conflict was identified between the 1-34766 of
the supercontig and 33,049,901 – 33,084,667 of the Chromosome 8.
Human 24-51 Human 52-56
Supercontig Mouse 26-53 Mouse 54-58
Rat 25-52 Rat 53-57
39
Part of ch. 8
Human 1-23,mouse1-25 Human 24-51, Mouse 26-53
Rat 1-24 Rat 25-52
So DrTOR lies in that region in fact.
33,232,006 bp 33,434,494 bp
1.bp
ENSDARG00000006995 ENSDAR
When clustalW analysis was performed between the 33,049,901
chromosome 8 and 1-34,766 of Supercontig, 5% homology was
confirming the idea that there might be a misalignment during contig a
chromosomal level and/or these two genomic sequences come
chromosomes indicating a truncated duplicate form of TOR. By using the
gene structures (Ensembl ID numbers: ENSDARG00000
ENSDARG00000021164) DrTOR structure was revealed. Based on
constructed DrTOR sequence, clustalW analysis was performed betwe
mouse, rat and zebrafish TOR genes (Table 4.3 and 4.4). It was shown
TOR has a high similarity with the mammals at the nucleotide level (76
34,766 bp
182,105 bp33,084,667 bp
33,049,901 bp
G00000021164
-33,084,667 of
found further
ssembly at the
from different
se two ensembl
006995 and
the putatively
en the human,
that zebrafish
%) and at the

40
protein level (85%). First part of the genomic sequence of DrTOR also was searched in
the human genome using VistaPlot software (http://sichuan.lbl.gov/vista/index.shtml).
The homology between human and putative DrTOR is high; the peaks represent
homology that is higher than 70% identity were shown in the 1st row. The same region
of the human was also searched in the mouse and rat genome, and human vs. mouse and
human vs. rat were shown in the 2nd and 3rd row respectively (Fig. 4.1).
Table 4.3 Pairwise comparisons of TOR cDNA sequences between human, mouse, rat,
and zebrafish.
clustal by clustalW of EBI Frap/tor Human mouse rat zebrafishHuman 1 89% 90% 76% Mouse * 1 95% 76% Rat * * 1 76% Zebrafish * * * 1
Table 4.4 Pairwise comparisons of TOR amino acid sequences between human, mouse,
rat, and zebrafish
clustal by clustalW of EBI Frap/tor human mouse rat zebrafishHuman 1 95% 95% 85% Mouse * 1 99% 85% Rat * * 1 85% Zebrafish * * * 1
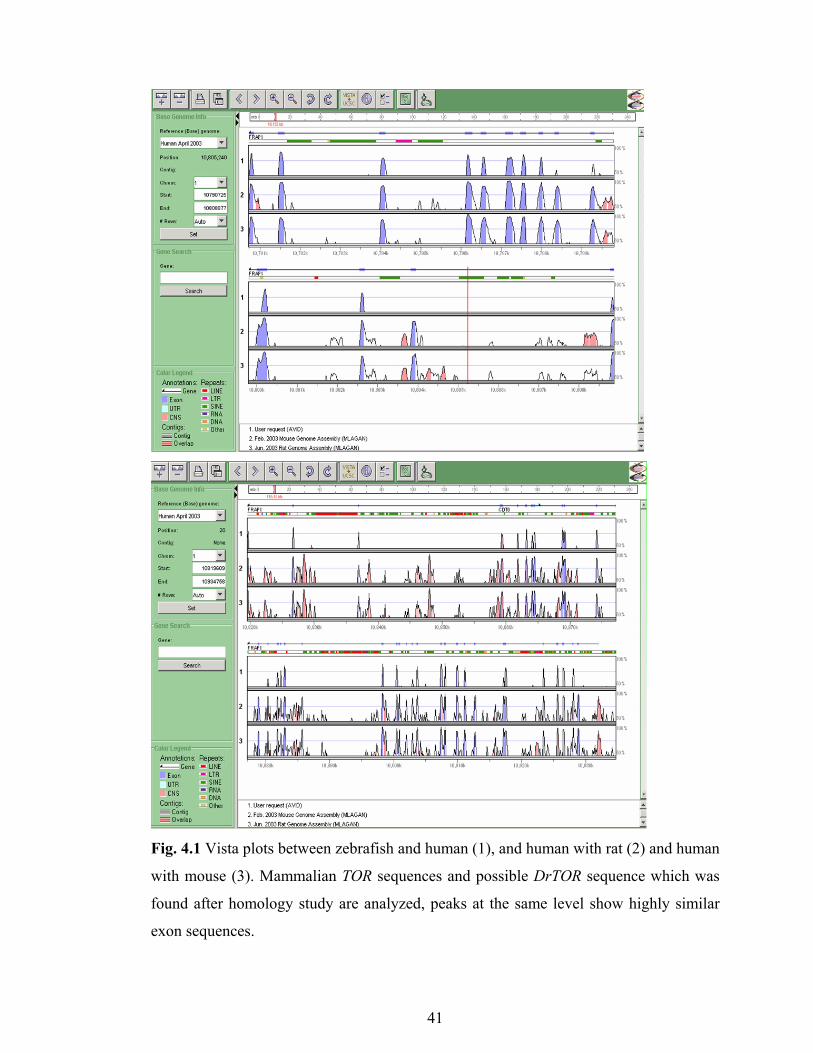
Fig. 4.1 Vista plots between zebrafish and human (1), and human with rat (2) and human
with mouse (3). Mammalian TOR sequences and possible DrTOR sequence which was
found after homology study are analyzed, peaks at the same level show highly similar
exon sequences.
41
4.2. DrTOR EXPRESSION
4.2.1. Embryonic Gel Expression
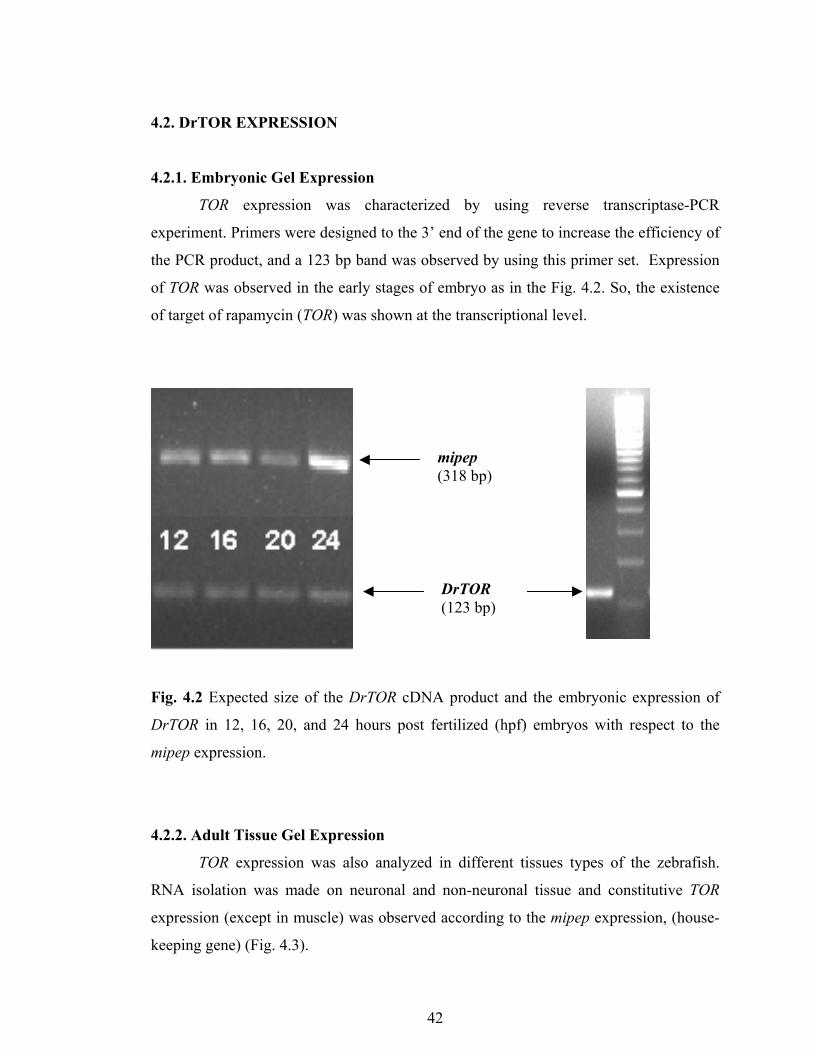
TOR expression was characterized by using reverse transcriptase-PCR
experiment. Primers were designed to the 3’ end of the gene to increase the efficiency of
the PCR product, and a 123 bp band was observed by using this primer set. Expression
of TOR was observed in the early stages of embryo as in the Fig. 4.2. So, the existence
of target of rapamycin (TOR) was shown at the transcriptional level.
Fig. 4.2 Expected size of the DrTOR cDNA product and the embryonic expression of
DrTOR in 12, 16, 20, and 24 hours post fertilized (hpf) embryos with respect to the
mipep expression.
mipep (318 bp)
DrTOR (123 bp)
4.2.2. Adult Tissue Gel Expression
TOR expression was also analyzed in different tissues types of the zebrafish.
RNA isolation was made on neuronal and non-neuronal tissue and constitutive TOR
expression (except in muscle) was observed according to the mipep expression, (house-
keeping gene) (Fig. 4.3).
42

Fig. 4.3 Adult expression pattern of DrTOR in multiple tissues with respect to Mipep
expression. cDNA samples: 1) dorsal fin, 2) peripheral fin, 3) gill, 4) ovary, 5) spleen, 6)
digestive tract, 7) eye, 8) heart, 9) muscle.
mipep ( 318bp)
DrTOR (123 bp)
4.3. PHENOTYPIC SCREENING
4.3.1. Larval Growth
Larval growth rate was assessed over four days (2, 3, 4, and 5 days post
fertilization, dpf) in terms of standard length (SL, mm) that spans from the anterior end
of the upper jaw to the to the end of the hypural plate (Fig. 4.4). The statistical
significance of the rapamycin dose and length of exposure on growth has been analyzed
using One-Way or Two-way ANOVAs (see Appendix for details) at α = 0.05.
43

Fig. 4.4 An example of the digital photographs used by TPS program to measure the
body size in terms of Standard Length (SL). Red dots indicate the anterior tip of the
upper jaw and the end of hypural plate
Zebrafish larvae hatch at around 48-72 hours after fertilization. The larval length
at 2 dpf is a mere 3 mm but the larvae rapidly grow over several days (i.e., an additional
one/fourth of its original size). The growth rate is relatively linear or even exponential
at these initial stages although later on in development, rate of growth slows down.
Initial studies suggested that rapamycin exerted a dose-dependent inhibitory
effect on the larval growth (Fig. 4.5). Since rapamycin concentrations less than 1 µM
did not affect growth rate significantly (Fig. 4.5), a higher concentration of rapamycin
(i.e., 20 µM in addition to 1 and 2 µM) also was included in the further experiments.
44

Fig. 4.5 Box plots of relative body sizes (standardized to the mean length of the
untreated control samples) for different doses of rapamycin, i.e., 0 (untreated control)
and doses ranging between 200 and 2000 nM rapamycin. ANOVA analyses were
significant both at 3 dpf (F = 6.69, df = 5, p = 0.0027) and 5 dpf (F = 6.03, df = 5, p =
0.042).
Accordingly, rapamycin treatment, in addition to significant changes in other
morphological aspects such as pigmentation and yolk reabsorption, resulted in growth
inhibition in a dose-dependent manner (Figure 4.6, 4.7). While the specific control
groups (i.e., DMSO-only treated larvae; Figure 4.7, diamond shape) exhibited constant
45

46
growth over this four-day period, rapamycin inhibited the larval growth significantly and
dose-dependently (Fig.4.7). Table 4.5 gives a detailed analysis of the changes in body
size for 1, 2, and 20 µM treatment groups. Accordingly, the larvae treated with the
lowest dose (1 µM) of rapamycin did not show any significant differences from its
control group in terms of the body size (Table 4.7, Fig. 4.7). On the other hand, the
effects of 2 µM of rapamycin were significantly different from those of the control
treatment, but only at days 3 and 4 (Table 4.7, Fig. 4.7). The most striking observation
was that, at the 20 µM, rapamycin almost completely abolished any growth that should
occur during the period of the experiment (Table 4.7, Fig. 4.7). This translates into the
fact that SL of the 20 µM rapamycin-treated 5 days old embryo (2.74 mm) was not
different from that of the 20 µM rapamycin-treated 2 days old embryo (2.70 mm) while
it was relatively shorter than the SL of 2 days old control embryo treated with DMSO
only (2.98 mm). This reduction when compared with the control was overestimated to
certain degree due to the fact that one of the embryos in the rapamycin group was
grossly defective and miniature in size (2.34 mm) when compared to the other two
individuals. Although growth arrest properties of rapamycin have been well established
in model organisms such as the fruitfly and mice, to our knowledge, the present study is
the first that shows the growth inhibitory effect of rapamycin on the early development
of zebrafish larvae.

Fig. 4.6 Representative pictures of the control and treatment embryos at 2, 3, and 4 days
post fertilization (4X Image).
Control Rapamycin
2 days
Control Rapamycin
2 days 3 days
Control
Rapamycin
3 days
Control
Rapamycin
4 days
Control Rapamycin
4 days
Control Rapamycin
47

1 µM
2.5
3
3.5
4
day2 day3 day4 day5Days After Fertilization (dpf)
Mea
n St
anda
rd
Leng
th (m
m) D-R
D+R
2 µM
2.5
3
3.5
4
day2 day3Days AfterFertilization (d
Mea
n St
anda
rd
Leng
th (m
m) D-R
D+R
20 µM
2.5
3
3.5
4
day2 day3Days After Fertilization
Mea
n S
tand
ard
Leng
th (m
m)
D-R
D+R
Fig. 4.7 The mean increase in body size (Stan
and DMSO+Rapamycin (D+R) treated embryo
at three different doses, 1, 2, and 20 µM over 4
level based on One-Way ANOVA (see Table 4
48
*
*day4 day5pf)
day4 d (dpf)
dard Length, mm
s. Rapamycin t
days. * Indicate
.5 for p-values).
*
* * *ay5
) for DMSO only (D-R)
reatment was performed
s significance at the 0.05

Table 4.5 Body size measurements (i.e., Standard Length, SL; mean ± Standard Error of
Mean, SEM) of control (DMSO-Rapamycin, SLD-R) and experimental
(DMSO+Rapamycin, SLD+R) groups treated with three different doses (1, 2, and 20 µM).
Sample sizes (N), significance of the ANOVA tests, and percentage of the change in
body size (∆ Size) were shown for 2, 3, 4, and 5 days post fertilization zebrafish
embryos.
DOSE
SLD-R ± SEM
(mm) N
SLD+R ± SEM
(mm) N P-Value ∆ Size (%)
2 DAYS
1 µM 2.945 ± 0.039 3 2.958 ± 0.075 3 0.891 0.42
2 µM 3.134 ± 0.063 3 2.996 ± 0.057 3 0.179 -4.41
20 µM 2.983 ± 0.081 3 2.696 ± 0.031 3 0.030* -9.63
3 DAYS
1 µM 3.176 ± 0.120 3 3.224 ± 0.009 3 0.709 1.52
2 µM 3.254 ± 0.013 3 3.092 ± 0.040 3 0.017* -4.98
20 µM 3.314 ± 0.077 3 2.867 ± 0.075 3 0.014* -13.49
4 DAYS
1 µM 3.543 ± 0.097 2 3.424 ± 0.176 3 0.654 -3.35
2 µM 3.531 ± 0.036 2 3.175 ± 0.054 2 0.032* -10.08
20 µM 3.811 ± 0.000 1 2.917 ± 0.069 3 0.023* -23.44
5 DAYS
1 µM 3.704 ± 0.046 3 3.575 ± 0.027 3 0.071 -3.48
2 µM 3.821 ± 0.121 3 3.631 ± 0.014 2 0.309 -4.99
20 µM 3.531 ± 0.029 2 2.740 ± 0.206 3 0.059as -22.39
49
50
Rapamycin’s dose-specific effects on zebrafish growth rate were found to be
statistically significant at all the stages examined in this study, i.e., 2, 3, 4, and 5 dpf
(Fig. 4.8). In all cases, the slope of the linear regression line was negative indicating
that growth decreased with increasing rapamycin concentration. Furthermore, the slope
ranged between –2.1 and –4.5 %, exhibiting a tendency to further decrease with the
length of exposure (Fig. 4.8). To statistically analyze the effects of A) dose and B)
length of exposure/day, a Two-Way ANOVA was performed (Matlab®, anovan). The
results showed that while the dose factor was highly significant, the length of
exposure/day factor was not significant at α = 0.05. This suggested that the growth
inhibition by rapamycin was similar at all the developmental stages examined, i.e., 20
µM dose is significantly more effective than either the 1 or 2 µM doses between the
second and fifth days of larval development (Table 4.6, Fig. 4.8). Further studies also
indicated that rapamycin’s dose-dependent effects might be brood-specific. Indeed, we
have performed a second set of experiments in which the embryos again were treated
with 1, 2, and 20 µM rapamycin and larval growth was observed from 2 dpf to 5 dpf.
Although the effects of rapamycin were highly significant, the rate of growth in control
embryos was smaller than that took place in the first experiment set (Compare Fig. 4.7
and Fig. 4.9).
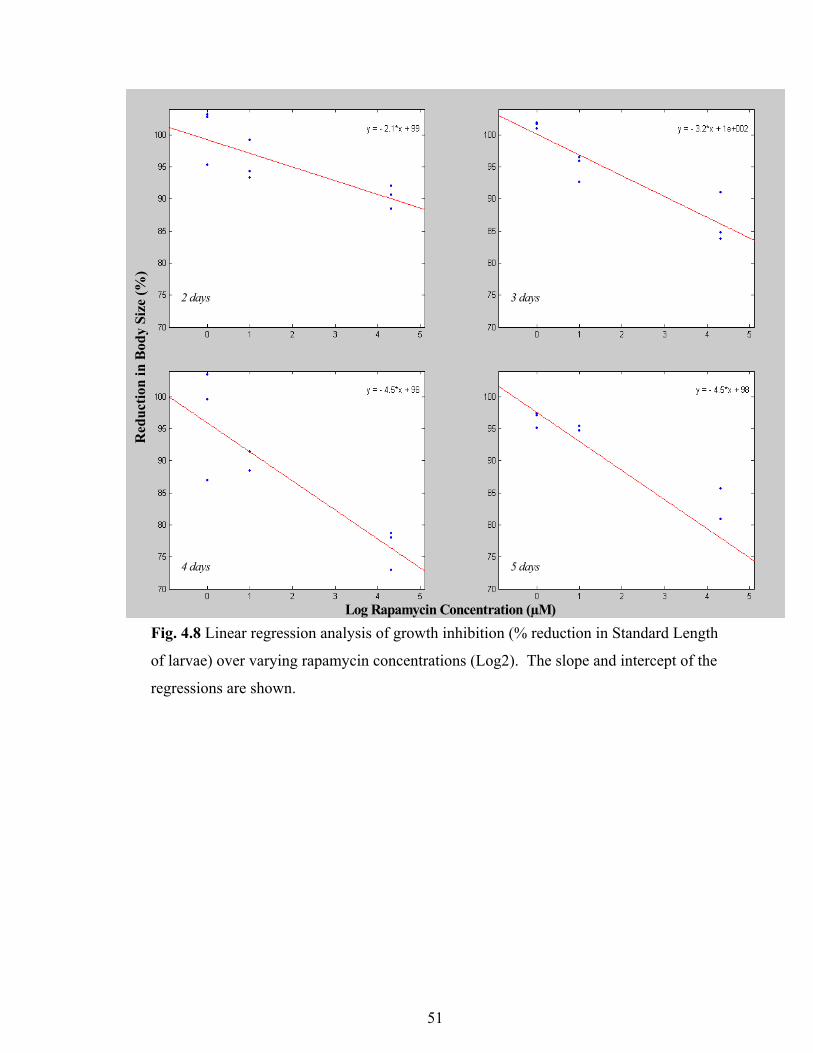
Log Rapamycin Concentration (µM)
Red
uctio
n in
Bod
y Si
ze (%
)
2 days 3 days
4 days 5 days
Log Rapamycin Concentration (µM)
Red
uctio
n in
Bod
y Si
ze (%
)
2 days 3 days
4 days 5 days
Fig. 4.8 Linear regression analysis of growth inhibition (% reduction in Standard Length
of larvae) over varying rapamycin concentrations (Log2). The slope and intercept of the
regressions are shown.
51

Table 4.6 Two-Way ANOVA for the 1st set of experiments; doses include 1, 2, and 20
µM and days include 2, 3, 4, and 5 dpf.
0.5
0.6
0.7
0.8
0.9
1
1.1
1 2 20
Rapamycin Concentration (uM)
Bod
y Si
ze R
elat
ive
to C
ontr
ol
2345
52

1 µM
2.5
3
3.5
4
day2 day3 day4Days After Fertilization (dpf)
Mea
n St
anda
rd
Leng
th (m
m)
D-R
D+R
2 µM
2.5
3
3.5
4
day2 day3 day4Days After Fertilization (dpf)
Mea
n St
anda
rd
Leng
th (m
m)
D-R
D+R
20 µM
2.5
3
3.5
4
day2 day3
Days After Fertilization
Mea
n St
anda
rd
Leng
th (m
m)
D-R
D+R
Fig. 4.9 The mean increase in body size (Standa
and DMSO+Rapamycin (D+R) treated em
Rapamycin treatment was performed at three d
days. * indicates significance at the 0.05 level ba
53
*
*
d
(dpf)
rd Le
bryos
ifferen
sed o
*
*
*
ay4
ngth, mm) for DMSO only (D-R)
(Second Experimental Set).
t doses, 1, 2, and 20 µM over 3
n One-Way ANOVA.

54
4.3.2. Cranial Cartilage Elements
Neural crest-derived cranial cartilage elements were examined using Alcian Blue
staining procedure for embryos treated with 2µM and 20µM doses of rapamycin (Fig.
4.10 and Fig. 4.11, respectively). The screening for cartilage was used to establish the
basis for the dose-dependent size reduction observed between the control and rapamycin
treatment groups. Furthermore, the cartilage screening allowed for examining the
presence or absence of the main elements of the cranial cartilage.
The results indicated that all of the cranial cartilage elements that were present in
the control embryos also were found in the 2 µM rapamycin treated embryos.
Nevertheless, the size of Meckel’s cartilage, palatoquadrate, hyosymplectic, ceratohyal,
and branchial arches were comparatively smaller than the control embryos (Fig. 4.10).
This finding supports the reduction in body size since the skeletal components that make
up the head are also smaller in the treatment group. On the other hand, 20 µM
rapamycin treatment resulted in a more severe phenotype (Fig. 4.11), with apparent
abnormalities in many of the cranial cartilage elements, e.g., Meckel’s cartilage and
hyosymplectic, and in some cases missing or underdeveloped cranial structures
(e.g., branchial arches).

F
an
M
R
A
ig. 4.10 Alcian blue staining of the cranial cartilage elements in control (DMSO only)
d treatment embryos (DMSO + 2 µM rapamycin). Cranial elements abbreviated are:
c, Meckel’s cartilage; Pq, palatoquadrate; Hy, hyoid; Ch, ceratohyal.(A) Control; (B)
apamycin (2 µM); (C) Comparative: Control (right) and Rapamycin (left).
Mc
HyPq
Ch
Mc
HyPq
Ch
C
B
55

F
a
M
R
B
A
i
n
a
hy ch
pq
mc
D
Cg. 4.11 Alcian blue staining of the cranial cartilage elements in control (DMSO only)
d treatment embryos (DMSO + 20 µM rapamycin). Cranial elements abbreviated are:
c, Meckel’s cartilage; Pq, palatoquadrate; Hy, hyoid; Ch, ceratohyal.(A) Control ; (B)
pamycin (20 µM); (C) Control; (D) Rapamycin (20 µM).
56

4.3.3. Melanocyte Development and Morphology
Melanocyte development and morphology have been examined in control and
rapamycin treated embryos, microscopically. The embryo and larva have characteristic
patterns of melanocyte distribution. The results indicated that rapamycin treatment
delayed the appearance of pigments in a dose-dependent manner. Furthermore, once the
pigments started to migrate along the dorsal and ventral routes, the rate of migration in
the rapamycin treated embryos was relatively slower and was not as extensive as in the
control embryos (Fig. 4.12, Fig. 4.13, and Fig. 4.14). Particularly interesting was that
the pigmentation around the yolk was extensively reduced in the rapamycin embryos
when compared with that in the control embryos (Fig. 4.12)
C R
2µM
C R 20 µM
2 dpf
Fig. 4.12 Pigmentation and yolk deficiency can be observed at the 2 dpf second set of
embryos (C: Control, R: Rapamycin treated embryos).
57

2 µM
20 µM
C
C
R
R
C
C
R
R
2 µM
20 µM
3 dpf 4 dpf
2 µM
20 µM
C
C
R
R
C
C
R
R
2 µM
20 µM
3 dpf 4 dpf
Fig. 4.13 Pigmentation and yolk deficiency can be observed at the 3 dpf and 4 dpf
second set of embryos (C: Control, R: Rapamycin treated embryos).
C R
C R
2 µM
20 µM
5 dpf Fig. 4.14 Pigmentation and yolk deficiency can be observed at the 5 dpf second set of
embryos (C: Control, R: Rapamycin treated embryos).
58

59
4.4. EFFECTS OF RAPAMYCIN ON GENE EXPRESSION OF SELECTED
CANDIDATE GENES
4.4.1. Standard Curves and Amplification Efficiencies
Real-time PCR data on a series of ten-fold dilutions of cDNA reverse-transcribed
from 2 dpf zebrafish embryos was obtained for amplification of the candidate and
housekeeping genes used in this study (iCycler, BioRad, Inc. Hercules, CA). Standard
curves were generated based on the data presented in Table 4.7. Theoretically, a 100%
efficient amplification of a PCR product equals 3.33 cycles. Our results indicated that
amplification efficiencies of all of the genes used in this study were close to the
theoretical value, ranging between 3.17 and 3.64 (Fig. 4.15, Table 4.7). Mipep,
mitochondrial intermediate peptidase, gene was used as the housekeeping gene in this
study. The choice was based on the finding that mipep was one of the genes whose
mRNA not significantly influenced by rapamycin treatment in yeast (Hardwick et al.,
1999).
Efficiency: [10(-1/slope)-1]*100
Table 4.7 Threshold cycle numbers for the 10X dilution series for the candidate genes
Conc. (log10) mipep DrTor mitfa
0 25.8 24.8 25.2 -1 27.8 27.8 29.1 -2 32.7 31 32.4 -3 36.3 34.3 36
Slope -3.64 -3.17 -3.57 Efficiency 89% 107% 91%
.

Fig. 4.15 Standard curve of the candidate genes used in the study.
60

4.4.2. Real-time RT-PCR Expression Studies
4.4.2.1. DrTOR
mRNA expression of DrTOR was quantified in an embryonic time-course for
control and 20 µM rapamycin treated embryos with respect to mipep expression. The
embryonic expression profiles of control and rapamycin embryos remained steady,
however the expression of DrTOR in rapamycin embryos were consistently higher than
that of the control embryos at all stages of development studied here. (Table 4.8; Fig.
4.16; Sign-rank test, p =0.03).
Table 4.8 Upregulation of DrTOR in response to rapamycin during early development.
HOURS Control Rapamycin Fold Induction (rapamycin/control)12 0.134 0.435 3.2485 16 0.072 0.308 4.2869 20 0.077 0.268 3.4837 24 0.117 0.268 2.2976 36 0.058 0.250 4.2882 48 0.177 0.308 1.7410
AVERAGE 3.5210
0.0000.0500.1000.1500.2000.2500.3000.3500.4000.4500.500
12 16 20 24 36 48
Hours Post Fertilization
Fold
Diff
eren
ce R
elat
ive
to 8
hpf
ControlRapamycin
Fig. 4.16 Expresssion profile of DrTOR for embryos 12-48 hpf standardized to 8 hpf
when compared with mipep. Sign-rank test P =0.03, correlation coefficient between the
rapamycin and control group is 0.46 (not significant)
61

4.4.2.2. mitfA
mRNA expression of mitfA was quantified in an embryonic time-course for
control and 20µM rapamycin treated embryos. mitfA expression exhibited differences
during this time course with an increase between 16 and 24 hours of post fertilization.
In accord with the previous studies (Lister et al., 2002) this period corresponds to the
induction of mitfA expression at the time of fate determination for the neural crest cells
to become melanocytes. The mitfA expression was highly correlated between the control
and rapamycin embryos over the time period of the study; however, mitfA expression in
rapamycin embryos was significantly lower than that in the control embryos from 12
through 48 hours (Table 4.9 ; Fig. 4.17; Sign-rank test, p =0.03).
Table 4.9 Down regulation of mitfA in response to rapamycin during early development
HOURS Control Rapamycin Inhibition (%) (rapamycin/control)
12 0.041 0.034 -18.69 16 0.117 0.083 -29.25 20 9.190 2.639 -71.28 24 1.231 0.467 -62.11 36 5.278 3.482 -34.02 48 6.063 2.639 -56.47
AVERAGE -45.30
-2.000
0.000
2.000
4.000
6.000
8.000
10.000
12 16 20 24 36 48
Hours Post Fertilization
Fold
Diff
eren
ce R
elat
ive
to 8
hpf
ControlRapamycin
Fig. 4.17 Expresssion profile of mitfA for embryos 12-48 hpf when compared with
mipep. Sign-rank test P =0.03 correlation coefficient between the rapamycin and control
group is 0.98.
62
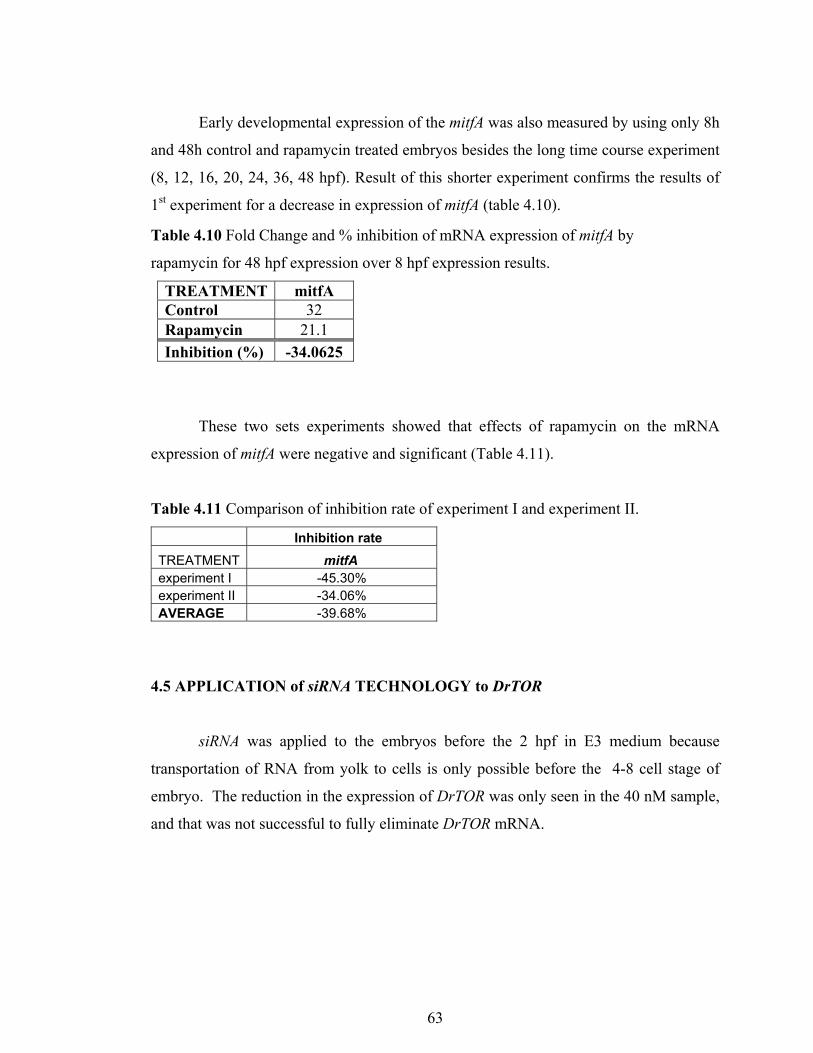
Early developmental expression of the mitfA was also measured by using only 8h
and 48h control and rapamycin treated embryos besides the long time course experiment
(8, 12, 16, 20, 24, 36, 48 hpf). Result of this shorter experiment confirms the results of
1st experiment for a decrease in expression of mitfA (table 4.10).
Table 4.10 Fold Change and % inhibition of mRNA expression of mitfA by
rapamycin for 48 hpf expression over 8 hpf expression results.
TREATMENT mitfA Control 32 Rapamycin 21.1 Inhibition (%) -34.0625
These two sets experiments showed that effects of rapamycin on the mRNA
expression of mitfA were negative and significant (Table 4.11).
Table 4.11 Comparison of inhibition rate of experiment I and experiment II.
Inhibition rate TREATMENT mitfA experiment I -45.30% experiment II -34.06% AVERAGE -39.68%
4.5 APPLICATION of siRNA TECHNOLOGY to DrTOR
siRNA was applied to the embryos before the 2 hpf in E3 medium because
transportation of RNA from yolk to cells is only possible before the 4-8 cell stage of
embryo. The reduction in the expression of DrTOR was only seen in the 40 nM sample,
and that was not successful to fully eliminate DrTOR mRNA.
63
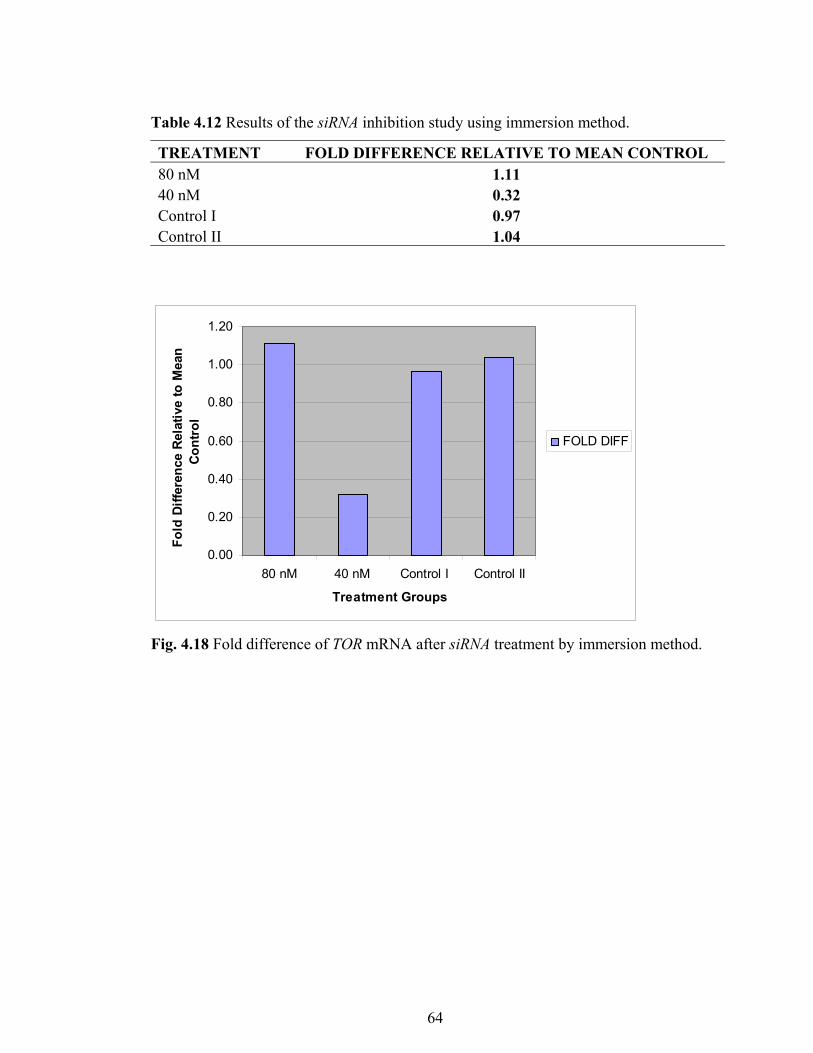
Table 4.12 Results of the siRNA inhibition study using immersion method.
TREATMENT FOLD DIFFERENCE RELATIVE TO MEAN CONTROL 80 nM 1.11 40 nM 0.32 Control I 0.97 Control II 1.04
0.00
0.20
0.40
0.60
0.80
1.00
1.20
80 nM 40 nM Control I Control II
Treatment Groups
Fold
Diff
eren
ce R
elat
ive
to M
ean
Cont
rol
FOLD DIFF
Fig. 4.18 Fold difference of TOR mRNA after siRNA treatment by immersion method.
64

65
5. DISCUSSION AND FUTURE PERSPECTIVES
FRAP/TOR is responsible for a multitude of functions necessary for the
maintenance of cellular homeostasis, and the increased rate of growth and proliferation.
First discovered in the yeast, FRAP/TOR also has been identified and functionally
investigated in C.elegans, D. melanogaster, M. musculus, R. norvegicus, and H. sapiens.
Although the zebrafish, Danio rerio, has already become a highly preferred model
organism in functional genomics studies, to our knowledge, there is no report in the
existing literature in regards to either the homology status of the complete cDNA of
zebrafish TOR (DrTOR), or its mRNA expression or cellular function. This lack of
information about DrTOR has been the source of motivation of the present thesis.
In this study, the full-length cDNA and protein sequence of DrTOR were
identified and constructed in silico using the public genomic sequences available for
zebrafish (www.ensembl.org). The results suggested that DrTOR appears to be a single-
copy gene located on the 8th chromosome of the zebrafish. Although presence of
duplicate genes is a highly common phenomenon in zebrafish (in teleosts) in comparison
to mammals, a duplicate full-length DrTOR is unlikely but it is still possible that a
truncated version may exist. This is because supercontig 22, although highly
homologous (>95 %) to TOR sequence in chromosome 8, was not assembled with
chromosome 8. Furthermore, the degree of sequence similarities between the DrTOR
and the mammalian TORs (those of human, rat, and mouse) were determined using
phylogenetic analyses (ClustalW and Multalign studies). These studies suggested a high
degree of homology between the zebrafish and mammalian Tor proteins.
The mRNA expression of DrTOR has been determined for the first time, using
an embryonic time-course experiment, and also multiple adult tissues in zebrafish.
Accordingly DrTOR seemed to be expressed constitutively across all of the
developmental stages and tissues that were examined. The constitutive expression of
DrTOR is an expected result since DrTOR is essential in the nutrient sensitive regulation
of protein translation machinery as well as regulation of cell and body size, which is a
steady process in the developing embryo. Especially during early development (before 5
days post fertilization), zebrafish uses its yolk for nutrients, thus this constant supply of

66
yolk requires TOR signaling to be efficiently consumed. Accordingly, one may suggest
that the quality and quantity of the yolk material may indeed be the nutrient signal that
regulates the activity of the Tor protein in zebrafish. This could be tested further by
experiments that involve the removal of yolk during embryogenesis to see its effects on
DrTOR expression both at the mRNA and protein levels. Alternatively, embryos from
nutritionally deficient parents and those from adequately fed parents could be compared
in terms of the expression of TOR signaling components and associated growth
parameters.
Previously, rapamycin has been shown to specifically inhibit the kinase activity
of Tor protein in various eukaryotes. The observed high sequence homology of DrTOR
to mammalian Tor proteins suggested that DrTOR function also was likely to be
conserved in zebrafish. Once the mRNA expression of DrTOR was confirmed to occur
during embryogenesis, different concentrations of rapamycin have been used to inhibit
TOR function in 2 to 5 days post fertilized embryos. The primary expected result of
rapamycin exposure in zebrafish would be a decrease in body size in a dose-dependent
manner in line with the experiments done in other organisms. Indeed, the embryonic
and larval body size was significantly reduced; and this reduction was dependent on the
dose of rapamycin used. At 2 µM of rapamcyin treatment, there was up to a 10%
decrease in 4 dpf embryos, whereas at 20µM rapamycin resulted in a much greater
degree of inhibition (up to 23%) that could be defined as complete growth arrest.
However, there was an indication that 0.4 % DMSO alone may result in a minor growth
reduction as observed in the control group of 20 µM DMSO at day 5. An ANOVA
performed on the standard length measurements from all control groups at day 5 showed
that this observed reduction at day 5 was not significant at α = 0.05 (Experiment I day 5;
p = 0.17). However, further experiments may consider using a lower dose of rapamycin
(10 µM) to reduce the unwanted effects of DMSO, which is necessary to dissolve the
rapamycin. Furthermore, rapamycin may be dissolved in a smaller amount of DMSO
such as 20 µl to make a stock solution with higher rapamycin concentrations. In order to
fully understand the toxicity of rapamycin in zebrafish, an IC50 should also be
determined. The findings of the present thesis support rapamycin’s teratogenic effects as
shown in mice (Hentges et al., 2001).
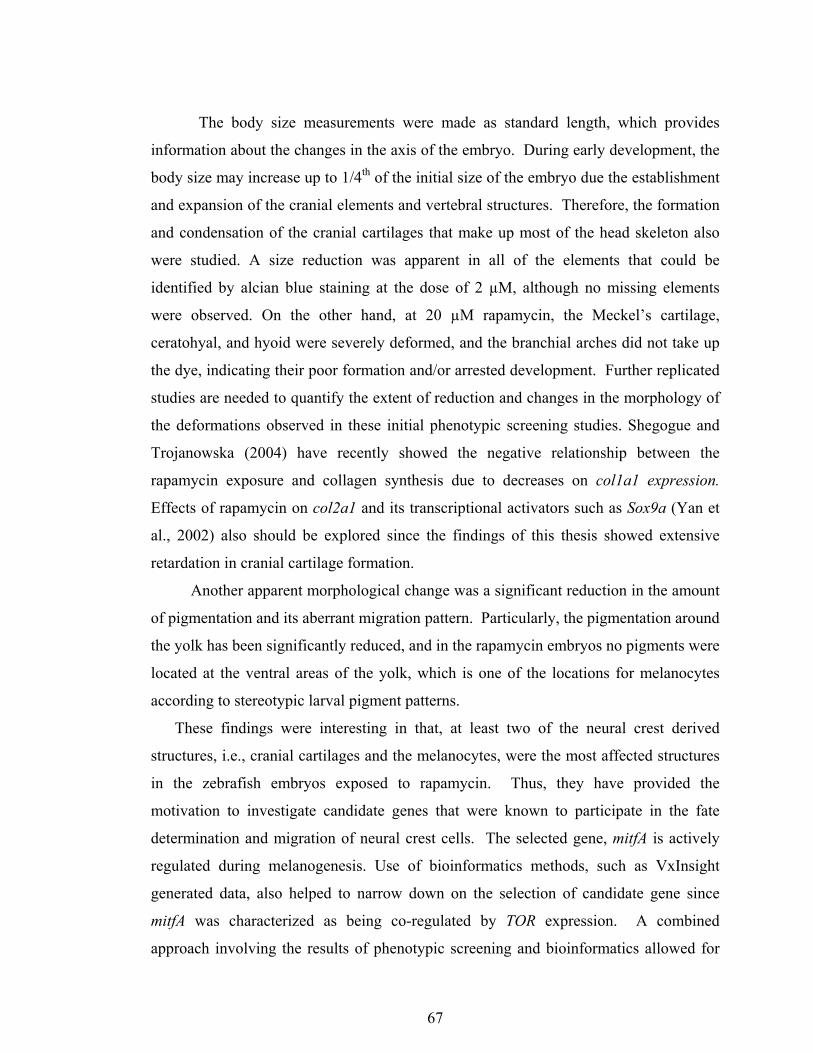
67
The body size measurements were made as standard length, which provides
information about the changes in the axis of the embryo. During early development, the
body size may increase up to 1/4th of the initial size of the embryo due the establishment
and expansion of the cranial elements and vertebral structures. Therefore, the formation
and condensation of the cranial cartilages that make up most of the head skeleton also
were studied. A size reduction was apparent in all of the elements that could be
identified by alcian blue staining at the dose of 2 µM, although no missing elements
were observed. On the other hand, at 20 µM rapamycin, the Meckel’s cartilage,
ceratohyal, and hyoid were severely deformed, and the branchial arches did not take up
the dye, indicating their poor formation and/or arrested development. Further replicated
studies are needed to quantify the extent of reduction and changes in the morphology of
the deformations observed in these initial phenotypic screening studies. Shegogue and
Trojanowska (2004) have recently showed the negative relationship between the
rapamycin exposure and collagen synthesis due to decreases on col1a1 expression.
Effects of rapamycin on col2a1 and its transcriptional activators such as Sox9a (Yan et
al., 2002) also should be explored since the findings of this thesis showed extensive
retardation in cranial cartilage formation.
Another apparent morphological change was a significant reduction in the amount
of pigmentation and its aberrant migration pattern. Particularly, the pigmentation around
the yolk has been significantly reduced, and in the rapamycin embryos no pigments were
located at the ventral areas of the yolk, which is one of the locations for melanocytes
according to stereotypic larval pigment patterns.
These findings were interesting in that, at least two of the neural crest derived
structures, i.e., cranial cartilages and the melanocytes, were the most affected structures
in the zebrafish embryos exposed to rapamycin. Thus, they have provided the
motivation to investigate candidate genes that were known to participate in the fate
determination and migration of neural crest cells. The selected gene, mitfA is actively
regulated during melanogenesis. Use of bioinformatics methods, such as VxInsight
generated data, also helped to narrow down on the selection of candidate gene since
mitfA was characterized as being co-regulated by TOR expression. A combined
approach involving the results of phenotypic screening and bioinformatics allowed for

68
insights in novel gene function discovery and deciphering the highly connected genetic
networks around the DrTOR.
The mRNA expression of mitfA was highly correlated between the control and
20 µM rapamycin treated embryos (r = 0.98). This information was important in testing
the accuracy of the real time RT-PCR results, since such a high correlation from two
independent sets of embryonic experiments is not likely to occur randomly.
Furthermore, the expression pattern closely followed the phenotypic changes that occur
in the embryo. The neural crest cells start gaining their melanogenic fates from
approximately 16 hpf at 28.5 °C. This was exactly the time period in the present
experiments where mitfA expression increased drastically in both the control and
rapamycin embryos followed by a significant reduction at 24 hpf. Another steady
increase was observed after 36 hpf, which continued towards the 48th hours.
Interestingly, the similarity in the general pattern of mitfA expression between two
groups suggested that the rapamycin embryos also go through the stereotypical
developmental timing processes with the control embryos. However, the amount of
induction was not near to the extent the control embryos experienced. This might be due
to that an upstream component in the mitfA signaling being inhibited due to Tor
inhibition by rapamycin. Or alternatively, mitfA itself may be directly in the downstream
of TOR and rapamycin resulted in the downregulation of its expression. Previous
studies have indicated that c-kit, which act upstream of Mitf, is influenced by rapamycin
treatment (Feng et al., 2000). Therefore, the inhibition of c-kit expression or function is
likely to occur in zebrafish, as well. Further studies should be designed to investigate the
participation of c-kit in the TOR signaling in zebrafish. Changes in the mitfA expression
profile may be affected by the circadian rhythm of the embryos. Zebrafish have been on
a day/night cycle during the experiments (14h light/10h dark). Accordingly, lights were
turned off at 24:00 when embryos were 14 hours old, and came back at 10.00 when
embryos reached the 24 hpf stage. In this respect, the highest increase in the mitfA
expression occured between the 16 and 20th hours of the development (Fig. 27) and at
dark period. However, a sharp decrease in the expression of mitfA was observed from
20th to 24th hours of development; and at 24 hpf mitfA expression started to rise once
again to remain steady later in the development. However, due to lack of samples taken
at shorter intervals between the 24th to 48th hours of development, it was not possible to
69
test the presence of cyclic fluctuations in mitfA expression during zebrafish late
embryogenesis.
On the other hand, DrTOR expression in the control and rapamycin experiments
remained rather steady over the embryonic developmental course (12-48 hpf). This is in
accord with DrTOR being constitutively expressed for the maintenance of cell growth
and division. However, rapamycin treated embryos exhibited a generally higher level of
DrTOR expression when compared with the control embryos (p = 0.03). This suggested
that DrTOR might have an auto control mechanism such that when the activity of
DrTOR is reduced, (A) its expression could be positively feed-backed; or (B) the
downstream effectors of DrTOR, possibly involved in negative regulation of DrTOR
expression, fail to relay the inhibitory signal to the transcription factors controlling
DrTOR expression.
siRNA experiments are relatively recent in fish. There are only two research
groups that investigated and published their results so far. These studies used the
microinjection method. In a pilot study, the potential of the immersion method in
zebrafish was investigated due to the encouraging results obtained from cell culture
studies as well as whole organism studies such as in C. elegans. The results indicated
that immersion method in zebrafish did not work at the concentrations and/or the
methodology that is proposed in this experiment (40 and 80 nM). Although there was a
4-fold reduction of DrTOR expression at the 40 nM siRNA treatment embryos, 80 nM
siRNA embryos did not show any reduction in the DrTOR expression. Since the degree
of penetrance (% of individuals that take-up and respond to an inhibitory molecule) is a
known variable in the knock-down studies, further experiments are need to conclude that
immersion method indeed is not sufficient for successful inhibition by siRNA in
zebrafish. Further improvements in the method may involve the use of liposomes or
CaCl2 for successful transfection.
70
6. REFERENCES Ashrafi, K., Chang , F.Y., Watts, J.L., Fraser, A.G., Kamath, R.S., Ahringer, J., Ruvkun, G. (2003) Genome-wide RNAi analysis of Caenorhabditis elegans fat regulatory genes. Nature. 421, 268-272. Bellei, B., Pacchiarotti, A., Perez, M., Faraggiana, T. (2004). Frequent beta-catenin overexpression without exon 3 mutation in cutaneous lymphomas, Mod Pathol. Boonanuntanasarn, S., Yoshizaki, G., Takeuchi, T. (2003). Specific gene silencing usingsmall interfering RNAs in fish embryos. Biochem Biophys Res Commun. 310(4), 1089-95. Boutros, M., Kiger, A.A., Armknecht, S., Kerr, K., Hild, M., Koch, B., Haas, S.A., Consortium, H.F., Paro, R., Perrimon, N. (2004). Genome-wide RNAi analysis of growth and viability in Drosophila cells. Science. 303 ,832-835. Brownlie, A. and Zon, L. (1999). The zebrafish as a model system for the study of hematopoiesis. Bioscience .49, 382-392 Christiansen, J.H., Coles, E.G., Wilkinson, D.G. (2000). Molecular control of neural crest formation, migration and differentiation. Current Opinion in Cell Biology . 12, 719–724. Chung, B., Westerfield, M., Haffter, P., Hopkins, N., Kimmel, C. and Postlethwait, J.H. (2002). A zebrafish sox9gene required for cartilage morphogenesis. Development . 129, 5065-5079. Dean, M. (1998). Cancer as a complex developmental disorder. Cancer Res. 58(24) 5633-5636. Dodd, A., Chambers, S.P., Love, G. (2004). Short interfering RNA-mediated gene targeting in the zebrafish. FEBS Lett. 12;561, 89-93 Dorsky, R.I., Moon, R.T., Raible, D.W. (1998). Control of neural crest cell fate by the Wnt signalling pathway. Nature. 396, 370–373. Dorsky, R.I., Raible , D.W., Moon , R.T. (2000) .Direct regulation of nacre, a zebrafish MITF homolog required for pigment cell formation, by theWnt pathway. Genes Development. 14, 158–162. Douarin, N.M. and Dupin, E. (2003) .Multipotentiality of the neural crest. Current Opinion in Genetics & Development .13, 529–536. ElWorthy, S., Lister, J.A., Carney, T.J., Raible, D.W., Kelsh, R.N. (2003). Transciptional Regulation of mitfa for the sox10 requirement in zebrafish melanophore development. Development. 130, 2809-2818.
71
Feng, L.X., Ravindranath, N. and Dym, M. (2000) Stem cell factor/c-kit up-regulates cyclin D3 and promotes cell cycle progression via the phosphoinositide 3-kinase/p70 S6 kinase pathway in spermatogonia. J Biol Chem. 18;275, 25572-25576. Grandel, H. and Schulte-Merker, S. (1998). Mechanical Development.79, 99. Grolleau, A., Bowman, J., Pradet-Balade, B., Puravs, E., Hanash, S., Garcia-Sanz, J.A., Beretta, L. (2002) .Global and specific translational control by rapamycin in T cells uncovered by microarrays and proteomics. Journal of Biological Chemistry. 21;277, 22175-84. Hardwick, J.S., Kuruvilla, F.G., Tong, J.K., Shamji, A.F. and Schreiber, S.L. (1999). Rapamycin-modulated transcription defines thesubset of nutrient-sensitive signaling pathways directly controlled by the Tor proteins. PNAS . 96, 14866–14870. Heasman, J., Kofron, M., and Wylie, C. (2000). Beta-catenin signaling activity dissected in the early Xenopus embryo: A novel antisense approach. Dev. Biol. 222, 124–134. Heasman, J. (2002). Morpholino oligos: making sense of antisense? Dev Biol. 15;243, 209-214. Heitman, J., Movva, N.R., Hall, M.N. (1991). Targets for cell cycle arrest by the immunosuppressant rapamycin in yeast. Science. 23;253, 905-909. Hentges, K.E., Sirry, B., Gingeras, A.C., Sarbassov, D., Sonenberg, N., Sabatini, D. and Peterson, A.S. (2001). FRAP_mTOR is required for proliferation and patterning during embryonic development in the mouse. PNAS . 98, 13796–13801. Hisoaka, K.K. and Battle, H.I. (1958). The normal developmental stages of thezebrafish. Brachydanio rerio. J. Morph. 102, 311-323. Hodgkinson, C.A., Moore, K.J., Nakayama, A., Steingrimsson, E., Copeland, N.G., Jenkins, N.A., Arnheiter, H. (1993) . Mutations at the mouse microphthalmia locus are associated with defects in a gene encoding a novel basic-helix-loop-helix-zipper protein. Cell. 30;74, 395-404. Jin, E.J., Erikson, C.A., Takada, S., Burrus, L.W. (2001). Wnt and BMP Signaling Govern Lineage Segregation of Melanocytes in the Avian Embryo. Developmental Biology. 233, 22-37. Kapahi, P., Zid, B.M., Harper, T., Koslover, D., Sapin, V. and Benzer, S. (2004). Regulation of Lifespan in Drosophila by Modulation of Genes in the TOR Signaling Pathway. Current Biology. 14, 885–890. Kelsh, R.N., Schmid, B., Eisen,J.S., (2000). Genetic Analysis of Melanophore Development in Zebrafish Embryos. Developmental Biology. 225, 277-293.
72
Kent, J., Coriat, A-M., Sharpe, P.T., Hastie, N.D. and Van Heyningen, V. (1995). The Evolution of WT1 Sequence and Expression Pattern in the Vertebrates. Oncogenes. 11, 1781-1792. Kikuchi, A. (2003). Tumor formation by genetic mutations in the components of the Wnt signaling pathway. Cancer Sciences. 94, 225-229. Kimmel, C.B., Ballard, W.W., Kimmel, S.R., Ullmann, B. and Schilling, T.F. (1995). Developmental Dynamics. 203, 253. Kimmel, C.B., Miller, C.T., Kruze, T., Ullmann, B., BreMiller, R.A., Larison, K.D. and Snyder, H.C. (1998). The Shaping of Pharyngeal Cartilages during Early Development of the Zebrafish.. Developmental Biology. 203, 245–263. Kolligs, F.T., Bommer, G., Goke, B. (2002) . Wnt/beta-catenin/tcf signaling: a critical pathway in gastrointestinal tumorigenesis. Digestion. 66, 131-144. Lammi, L., Arte, S., Somer, M., Jarvinen, H., Lahermo, P., Thesleff, I., Pirinen, S., Nieminen, P. (2004). Mutations in AXIN2 cause familial tooth agenesis and predispose to colorectal cancer. The American Journal of Human Genetics. 74, 1043-1050. Langheinrich, U., Hennen, E., Stott, G., Vacun, G. ( 2002). Zebrafish as a model organism for the identification and characterization of drugs and genes affecting p53 signaling. Curr Biol. 12, 2023-2028. Lardelli, M. (2000). Anzccart News,13, 1-3. Lee, J.S., Ray, R. and Chien, C.B. (2001). Cloning and Expression of Three Zebrafish Roundabout Homologs Suggest Roles in Axon Guidance and Cell Migration. Dev. Dynamics. 221, 216-230. Lister, J.A., Robertson, C.P., Lepage, T., Johnson, S.L. and Raible, R.W. (1999). nacre encodes a zebrafish microphthalmia-related protein that regulates neural-crest-derived pigment cell fate. Development . 126, 3757-3767. Lister, J.A., Close, J. and Raible, D.W. (2001). Duplicate mitf Genes in Zebrafish: Complementary Expression and Conservation of Melanogenic Potential . Developmental Biology . 237, 333–344 . Lister, J.A. (2002). Development of Pigment Cells in the Zebrafish Embryo. Microscopy Research and Technique. 58, 435-441. Loewith, R., Jacinto, E., Wullschleger, S., Lorberg, A., Crespo, J.L., Bonenfant, D., Oppliger, W., Jenoe, P. and Hall, M.N. (2002). Two TOR Complexes, Only One of which Is Rapamycin Sensitive, Have Distinct Roles in Cell Growth Control. Molecular Cell. 10, 457–468.

73
Long, X., Spycher, C., Han, Z.S., Rose, A.M., ller, F.M. and Avruch, J. (2002). TOR Deficiency in C. elegans Causes Developmental Arrest and Intestinal Atrophy by Inhibition of mRNA Translation. Current Biology. 12, 1448–1461. Manual, J.A. and Roberto, M. (2002). Early induction of neural crest cells. Current Opinion in Genetics & Development. 12, 452-458. Miron, M., Lasko, P. and Sonenberg, N. (2003). Signaling from Akt to FRAP/TOR Targets both 4E-BP and S6K in Drosophila melanogaster. Molecular And Cellular Biology. 23, 9117–9126. Nieto, M.A. (2001). The early steps of neural crest development. Mechanisms of development. 105, 27-35. Nüsslein-Volhard, C. and Wieschaus, N. (1980). Mutations Affecting Segment Number and Polarity in Drosophila. . Nature. Nüsslein-Volhard, C. and Dahm, R. (2002). ZEBRAFISH(A Practical Approach), Oxford University Press . O’Brien, E.K., Alenc, C., Bonde, G., Li, W., Schoenebeck, J., Allende, M.L., Gelb, B.D., Yelon, D., Eisen, J.S. and Cornell, R.A. (2004). Transcription factor Ap-2a is necessary for development of embryonic melanophores, autonomic neurons and pharyngeal skeleton in zebrafish. Developmental Biology. 265, 246–261. O'Neill, M.D. and Escobar, S. (2001). Zebrafish mutants may offer clues to human deafness. Bio Beat On-Line Magazine . Oldham, S. and Hafen, E. (2003) Insulin/IGF and target of rapamycin signaling: a TOR de force in growth control. TRENDS in Cell Biology. 13, 79-85. Pagliarini, R.A., Xu, T. ( 2003). A genetic screen in Drosophila for metastatic behavior. Science. 302, 1227-1231. Piotrowski, T., Schilling, T.F., Brand, M., Jiang, Y.J., Heisenberg, C.P., Beuchle, D., Grandel, H., Van-Eeden, F.J.M., Seiki, M.F., Granato, M., Haffter, P., Hammerschmidt, M., Kane, D.A., Kelsh, R.N., Mullins, M.C., Odenthal, J., Warga, R.M. and Nüsslein-Volhard, C. (1996). Jaw and branchial arch mutants in zebrafish II: anterior arches and cartilage Differentiation. Development. 123, 345-356. Poser, I. and Bosserhoff, A.K. (2004). Transcription factors involved in development and progression of malignant melanoma. Histology and Histopathology. 19, 173-188. Pothof, J., van-Haaften, G., Thijssen, K., Kamath, R.S., Fraser, A.G., Ahringer, J., Plasterk, R.H., Tijsterman, M. (2003). Identification of genes that protect the C. elegans genome against mutations by genome-wide RNAi. Genes Dev. 17, 443-448.

74
Rohde, J., Heitman, J. and Cardenas, M.E. (2001). The TOR Kinases Link NutrientSensing to Cell Growth. .The journal of biological chemistry. 276, 9583–9586. Schilling, T.F., Piotrowski, T., Grandel, H., Brand, M., Heisenberg, C.P., Jiang, Y.J., Beuchle, D., Hammerschmidt, M., Kane, D.A., Mullins, M.C., van-Eeden, F.J.M., Kelsh, R.N., Seiki, M.F., Granato, M., Haffter, P., Odenthal, J., Warga, R.M., Trowe, T. and Nüsslein-Volhard, C. (1996). jaw and branchial arch mutants in zebrafish I: branchial arches. Development. 123, 329-344. Shegogue, D. and Trojanowska, M. (2004). Mammalian target of rapamycin positively regulates collagen type I production via a phosphatidylinositol 3-kinase-independent pathway. J Biol Chem. 279(22), 23166-23175. Streisinger, G., Walker, C., Dower, N., Knauber, D. and Singer, F. (1981). Nature . 291 ,293. Stuart, J.M., Segal, E., Koller, D., Kim, S.K. (2003). A gene-coexpression network for global discovery of conserved genetic modules. Science. 10;302, 249-255. Thomas, G., Sabatini, D.M., Hall, M.N. (2004) TOR(target of rapamycin): Springer Publishing. Vellai, Y., Vellai, K.T., Zhang, Y., Kovacs, A.L., Orosz, L., Müller, F. (2003). Influence of TOR kinase on lifespan in C. elegans. NATURE. 426, 620. Widlund, H.R., Horstmann, M.A., Price, E.R., Cui, J., Lessnick, S.L., Wu, M., He, X., Fisher, D.E. (2002). Beta-catenin-induced melanoma growth requires the downstream target Microphthalmia-associated transcription factor. J Cell Biol. 16;158, 1079-1087. Widlund, H.R. and Fisher, D.E. (2003) .Microphthalamia-associated transcription factor: a critical regulator of pigment cell development and survival. Oncogene. 22, 3035-3041. Yan, Y.L., Miller, C.T., Nissen, R., Singer, A., Liu, D., Kirn, A., Draper, B., Willoughby, J., Morcos, P.A., Amsterdam, A., Zhang, H., Stallock, J.P., Joyce, C., Reinhard, C. and Neufeld, T.P. (2000). Regulation of cellular growth by the Drosophila target of rapamycin dTOR. Genes & Development. 14, 2712–2724 .

75
APPENDICES: APPENDIX A: MATLAB CODE; function [landmark,samplelabel,specdist,grplabel,correctdist,ori,conc,descstato,descstat,no,n]=readland1(filename,n1,n2,n3) tline1=[] tline2=[] count=0 count2=0 %OPEN COORDINATE FILE fid=fopen(filename,'rt') %READ THE APPENDED COORDINATES, SAVE THE NAME OF THE SAMPLE and COORDINATES IN LANDMARK structure while feof(fid)==0 tline=fgetl(fid); if ~isempty(findstr(tline,'LM')) count=count+1; landmark(count).numland=tline; tline1=[]; count2=0; elseif ~isempty(findstr(tline,'IMAGE')) landmark(count).samplename=tline; elseif isempty(findstr(tline,'LM')) count2=count2+1; landmark(count).coordin{count2}=tline; end end specdist=zeros(count,1); %FOR EACH SAMPLE AND ITS MAP CALCULATE THE EUCLEDIAN DISTANCE for i=1:count [g,z]=size(landmark(i).coordin); allcoor=zeros(z,2); for j=1:z allcoor(j,1:2)=str2num(landmark(i).coordin{j}); end landmark(i).distance=dist(allcoor'); if ~isempty(findstr(landmark(i).numland,'LM=3')) specdist(i)=landmark(i).distance(n1,n3); else specdist(i)=landmark(i).distance(n1,n2);

76
end end %GENERATE A SAMPLE LABEL FOR EACH SAMPLE samplelabel=zeros(count,1); for i=1:count % 11 indicates dmso 1uM if ~isempty(findstr(landmark(i).samplename,'IMAGE=C1.')) samplelabel(i)=11; % 12 indicates dmso 2uM elseif ~isempty(findstr(landmark(i).samplename,'IMAGE=C2.')) samplelabel(i)=12; % 120 indicates dmso 20uM elseif ~isempty(findstr(landmark(i).samplename,'IMAGE=C20.')) samplelabel(i)=120; % 21 indicates dmso+rapa 1 uM elseif ~isempty(findstr(landmark(i).samplename,'IMAGE=R1.')) samplelabel(i)=21; % 22 indicates dmso+rapa 2 uM elseif ~isempty(findstr(landmark(i).samplename,'IMAGE=R2.')) samplelabel(i)=22; % 220 indicates dmso+rapa 20uM elseif ~isempty(findstr(landmark(i).samplename,'IMAGE=R20.')) samplelabel(i)=220; end end ls=length(specdist); grplabel=samplelabel(1:2:ls); % CONVERT SAMPLE PIXELS INTO MM USING THE MAP PIXELS correctdist=(specdist(2:2:ls).*sqrt(2))./specdist(1:2:ls); % ANOVA FOR 1uM la11=find(grplabel==11); la21=find(grplabel==21); [p,anovatab,stats]=anova1([correctdist(la11);correctdist(la21)],[grplabel(la11);grplabel(la21)]); % ANOVA FOR 2uM la12=find(grplabel==12); la22=find(grplabel==22); [p,anovatab,stats]=anova1([correctdist(la12);correctdist(la22)],[grplabel(la12);grplabel(la22)]); % ANOVA FOR 20uM la120=find(grplabel==120); la220=find(grplabel==220); [p,anovatab,stats]=anova1([correctdist(la120);correctdist(la220)],[grplabel(la120);grplabel(la220)]);

77
% ANOVA FOR CONCENTRATION CURVE, three groups, each group is standardized to its mean dmso control value oridata=[correctdist(la21);correctdist(la11);correctdist(la22);correctdist(la12);correctdist(la220);correctdist(la120)]; origrp=[grplabel(la21);grplabel(la11);grplabel(la22);grplabel(la12);grplabel(la220);grplabel(la120)]; ori=[origrp oridata]; figure [mo,so,co,no]=grpstats(oridata,origrp,0.05); descstato=[mo,so,co]; concdata=[correctdist(la21)./mean(correctdist(la11));correctdist(la22)./mean(correctdist(la12));correctdist(la220)./mean(correctdist(la120))]; concgrp=[ones(length(la21),1)*1;ones(length(la22),1)*2;ones(length(la220),1)*20]; conc=[concgrp concdata]; [p,anovatab,stats]=anova1(concdata,concgrp); title('Concentration curve') figure comparison=multcompare(stats) figure [m,s,c,n]=grpstats(concdata,concgrp,0.05) descstat=[m,s,c]; %[p,anovatab,stats]=anova1(correctdist,grplabel); %figure %comparison=multcompare(stats) %figure %[m,s,c,n]=grpstats(correctdist,grplabel,0.05) %descstat=[m,s]; %return . .