effects of radar beam shielding on rainfall estimation for
TRANSCRIPT

Effects of Radar Beam Shielding on Rainfall Estimation for the PolarimetricC-Band Radar
KATJA FRIEDRICH AND URS GERMANN
MeteoSvizzera, Locarno, Switzerland
JONATHAN J. GOURLEY
National Severe Storms Laboratory, Norman, Oklahoma
PIERRE TABARY
Direction des Systèmes d’Observation, Météo-France, Trappes, France
(Manuscript received 25 July 2006, in final form 5 February 2007)
ABSTRACT
Radar reflectivity (Zh), differential reflectivity (Zdr), and specific differential phase (Kdp) measured fromthe operational, polarimetric weather radar located in Trappes, France, were used to examine the effects ofradar beam shielding on rainfall estimation. The objective of this study is to investigate the degree ofimmunity of Kdp-based rainfall estimates to beam shielding for C-band radar data during four typical rainevents encountered in Europe. The rain events include two cold frontal rainbands with average rainfallrates of 7 and 17 mm h�1, respectively, and two summertime convective rain events with average rainfallrates of 11 and 22 mm h�1.
The large effects of beam shielding on rainfall accumulation were observed for algorithms using Zh andZdr with differences of up to �2 dB (40%) compared to a Kdp-based algorithm over a power loss range of0–8 dB. This analysis reveals that Zdr and Kdp are not affected by partial beam shielding. Standard reflec-tivity corrections based on the degree of beam shielding would have overestimated rainfall rates by up to1.5 dB for less than 40% beam shielding and up to 3 dB for beam shielding less than 75%. The investigationalso examined the sensitivity of beam shielding effects on rainfall rate estimation to (i) axis–ratio param-eterization and drop size distribution, (ii) methods used to smooth profiles of differential propagation phase(�dp) and estimate Kdp, and (iii) event-to-event variability. Although rainfall estimates were sensitive todrop size distribution and axis–ratio parameterization, differences between Zh- and Kdp-based rainfall ratesincreased independently from those parameters with amount of shielding. Different approaches to smooth-ing �dp profiles and estimating Kdp were examined and showed little impact on results.
1. Introduction
Rainfall estimation by radar is subject to smaller er-rors when measurements are made at levels close to theground. The relation between surface rainfall and radarmeasurements taken at increasing altitudes diminishesdue to the vertical variability and horizontal advectionof precipitation. Doppler weather radars are typicallyused for operational rainfall estimation, since they are
capable of measuring three-dimensional reflectivity,Doppler velocity, and spectrum width with a spatialresolution of hundreds of meters and temporal resolu-tion within minutes. However, radar data observed atlow altitudes are often contaminated by returns frommountains, ocean waves, buildings, or vegetation. Nu-merous techniques have been developed to detect andremove ground clutter returns based on texture of re-flectivity, Doppler spectrum, and clutter maps (Doviakand Zrnic 1993; Joss and Lee 1995; Germann and Joss2003; Kessinger et al. 2003). Usually the orographic en-vironment around the radar is characterized in terms ofcalculating the area that is illuminated by the radarbeam for a given scanning strategy and radar charac-
Corresponding author address: Dr. Katja Friedrich, Meteo-Svizzera, Via ai Monti 146, CH-6605 Locarno Monti, Switzerland.E-mail: [email protected]
NOVEMBER 2007 F R I E D R I C H E T A L . 1839
DOI: 10.1175/JTECH2085.1
© 2007 American Meteorological Society
JTECH2085

teristics. This has been done for most radar sites, espe-cially those located in mountainous terrain (Delrieu etal. 1995; Gabella and Perona 1998; Maddox et al. 2002;Pellarin et al. 2002; Germann et al. 2006). Quantifyingand correcting power losses due to beam shielding isespecially important for quantitative precipitation esti-mation in mountainous terrain (Young et al. 1999).Promising results toward this goal based entirely onradar reflectivity and Doppler velocity are shown, forinstance, by Andrieu et al. (1997), Creutin et al. (1997),Pellarin et al. (2002), and Germann et al. (2006).
Over the last three decades, potential benefits of po-larization diversity for weather radars have also beeninvestigated extensively to improve quantitative pre-cipitation measurements (e.g., Seliga and Bringi 1976;Bringi et al. 1984; Bringi and Hendry 1990; Chan-drasekar et al. 1990; Joss and Waldvogel 1990; Gorgucciet al. 1994; Zrnic and Ryzhkov 1999; Illingworth 2003;Szalinska et al. 2005). Polarization diversity allows thetransmission and reception of the electric field in dif-ferent spatial orientations. Polarimetric weather radarsare usually limited to transmitting and receiving hori-zontally and vertically oriented electric fields (also re-ferred to as dual polarization). By combining the dif-ferently oriented transmitted and received reflectivi-ties, information about particle size, shape, orientation,and dielectric constant can be obtained. Polarimetricradar variables most commonly derived from dual-polarization measurements are reflectivity at horizontalpolarization (Zh), the ratio of horizontal to vertical re-flectivity or differential reflectivity (Zdr), correlation
between horizontally and vertically polarized returnsignals denoted as a correlation coefficient (�hv), thephase difference between horizontally and verticallypolarized returns or differential propagation phase(�dp), and specific differential phase (Kdp) defined asone-half of the range derivative of �dp (Bringi andChandrasekar 2001).
Rainfall estimates from polarimetric variables aremost commonly based either on reflectivity (Zh, Zdr),Kdp, or combinations. Phase measurements have alower sensitivity to distortions of the amplitude causedby, for example, calibration problems, attenuation, andthe presence of hail and are not affected by partialbeam shielding (Zrnic and Ryzhkov 1996). Partialbeam shielding effects become obvious when compar-ing reflectivity-based rainfall estimates including Zh
[denoted as R(Zh)] and those based on Kdp [denoted asR(Kdp)] as shown in Fig. 1 for a 6-h stratiform rainfallevent occurring on 4 July 2005. More information ondata processing and a detailed discussion of this casewill be given in sections 2 and 4. Although large differ-ences in rainfall accumulation occurred with the differ-ent methods, artifacts resulting from radar beam shield-ing are more evident in the accumulations from the Zh
method. Regions of high beam shielding (�70%) indi-cated by black-filled semicircle segments correspond toregions of lower R(Zh) rainfall rates, while R(Kdp) ishardly affected in those areas. The effect of partialbeam shielding for Zh and Kdp is also shown in Fig. 2 asa function of power loss for the same 6-h rainfall eventshown in Fig. 1. Median values of Zh are reduced by
FIG. 1. Six-hour rainfall accumulation (0000–0600 UTC) on 4 Jul 2005 at an 0.4° elevationangle using radar rainfall algorithms based on (a) Zh denoted as R(Zh) and (b) Kdp denotedas R(Kdp), respectively. Regions of radar beam shielding �70% are indicated as black-filledsemicircle segments located at the outside of the analysis domain. The analysis domain islimited to a range of 5 to 100 km around the Trappes radar located in the center.
1840 J O U R N A L O F A T M O S P H E R I C A N D O C E A N I C T E C H N O L O G Y VOLUME 24

�4 dB for a power loss due to beam shielding of 6 dB.Detailed discussion about the discrepancies will be pro-vided in section 5. This is significant, knowing that theprecision in Zh needed for rainfall rate estimation isapproximately 1 dBZ. The polarimetric variables Kdp
are less affected by beam shielding for losses up to 6 dB.Their median values vary within the experimentallyfound precision of 0.1° km�1 for Kdp (Gourley et al.2006a). Signal-to-noise ratio (SNR) decreases with in-creasing radar beam shielding, adding an increased un-certainty to phase measurements (Doviak and Zrnic1993). This might be in effect when more than 70% ofthe beam is shielded and the variation of Kdp increases.In the case of radar beam shielding, a weaker transmit-ted signal reaches precipitation at further ranges, re-sulting in a reduced backscattered signal to the receiveras illustrated schematically in Fig. 3. Unbiased phasemeasurements are possible in these shielded regionswhere the backscattered signal has been reduced. How-ever, in order to measure small �dp changes in lightrain, high accuracy is required. The theoretical standarderror of �dp, ��, is �1° primarily related to limits due tothe transmission and reception mode (Ryzhkov andZrnic 1998b; Illingworth 2003). In practice �dp valuesare contaminated by several factors and �� is typically2°–3° (Hubbert et al. 1993; Ryzhkov and Zrnic 1995;Keenan et al. 1998; Gourley et al. 2006a). Blackmanand Illingworth (1993) showed that obstacles causelarge, random differential phase shifts. Illingworth(2003) quantifies this phase noise to be �5° when arandom phase is added to precipitation that has a back-scatter amplitude 10 times larger. Nevertheless, rain be-hind obstacles is characterized by small phase fluctua-tions if the signal-to-noise ratio is sufficiently high.
Several studies focus on the comparison betweenrainfall estimates using polarimetric variables and sur-
face observations such as rain gauges or disdrometermeasurements (see, e.g., Seliga et al. 1981; Aydin et al.1987, 1995; Gorgucci et al. 1995, 1996; Ryzhkov andZrnic 1995, 1996; Brandes et al. 1997; Petersen et al.1999). The potential benefit of polarimetric quantitiesin mountainous regions was exclusively investigated byZrnic and Ryzhkov (1996) and Vivekanandan et al.(1999). Zrnic and Ryzhkov (1996) showed an improve-ment in rainfall rate when the specific differential phasewas used in regions where Kdp � 0.4° km�1 comparedto the rainfall rate estimation based on Zh. The reflec-tivity during the 2-h period of a mesoscale convectivesystem was on average 6.4 dB lower at 0° compared tothe 0.5° elevation angle. After correcting reflectivity forlosses due to attenuation and beam shielding using thephase information, Zrnic and Ryzhkov (1996) showeddifferences in the root-mean-square error between Zh-based rainfall and gauge data, reducing from 6.8 to 3.6mm for the lowest elevation. Similar results wereachieved during a flash flood event close to Denver,Colorado, investigated by Vivekanandan et al. (1999).They compared rainfall rates derived solely from Zh
and those using Kdp. While hardly any differences(�1.4 mm over 4.5 h) occurred in regions with lowbeam shielding (�40%) differences of 4.7 mm wereobserved in mountainous terrain with beam shielding of20%–90% during the same time period.
The objective of this study is to investigate the ben-efit of Kdp-based rainfall estimates as a function ofbeam shielding for midlatitude precipitation eventswith average total rainfall amounts of �5–50 mm usinga C-band radar. Reflectivity-based rainfall estimates in-cluding Zh and Zdr [denoted as R(Zh) and R(Zh, Zdr)]are compared to those based on Kdp [denoted asR(Kdp)] as a function of beam shielding. Additionally,the influence of beam shielding effects on Zdr are in-vestigated by comparing R(Kdp, Zdr) to R(Kdp). Sincethe comparison of rainfall rates to other instruments(e.g., rain gauges) requires several assumptions and in-
FIG. 2. Same as in Fig. 1, but showing Zh (black line; scale on theleft) and Kdp (gray line; scale on the right) as a function of powerloss and beam shielding. Medians for each beam shielding class(every 1%) are indicated as thin lines; the centered averagedmedians including 10 beam shielding classes are overlaid as thicklines.
FIG. 3. Two-dimensional schematic illustrating radar beamshielding by an obstacle. The distribution of the transmittedpower (hatched area) within the 3-dB beamwidth (black solidlines) is approximated by a Gaussian shape. In this case, 50% ofthe transmitted radar beam is shielded by the obstacle.
NOVEMBER 2007 F R I E D R I C H E T A L . 1841
troduces scale mismatches, we will limit this study to anintercomparison of rainfall rates based on polarimetricvariables deriving relative differences of rainfall esti-mates as a function of beam shielding. The studies byZrnic and Ryzhkov (1996) and Vivekanandan et al.(1999) provided some guidance in addressing this issue,but they are lacking in a few key respects that are im-portant for an operational application in Europe. First,both studies were accomplished with an S-band radar.The differential phase shift �dp consists of two compo-nents, the phase difference due to forward scatteringand a component related to backscatter differentialphase. The latter becomes significant when Mie scat-tering occurs. While this term is usually negligible at theS band, Mie scattering occurs for raindrops larger than3 mm for C-band radars (� � 5 cm). Also, both studiesfocused on heavy precipitation events causing flashfloods. In Vivekanandan et al. (1999) the maximumobserved rain amounts accumulated over the entireconvective storm event (�4.5 h) was 68 mm, while thesquall line observed by Zrnic and Ryzhkov (1996) hadmaximum accumulated rain amounts of 27 mm over2 h. This study focuses on more typical rain rates en-countered in Europe.
Section 2 describes the observing system and therainfall characteristics of the four events analyzed inthis study. Methodology of the radar processing is ex-plained in section 3. The relation between reflectivity-and Kdp-based rainfall accumulations for differentamounts of beam shielding is explored in section 4.Special emphasis is placed on the sensitivity to the axis–ratio parameterization and drop size distribution(DSD), the Kdp estimation method, and the event-to-event variability. Section 5 discusses the reflectivity cor-rection for beam shielding applied for operational ap-plications. Finally, conclusions are presented in sec-tion 6.
2. Observing system, beam shielding map, andevent overview
The analysis of rainfall rate estimators is based ondata measured by the polarimetric C-band Doppler ra-dar located at Trappes, which is �30 km southwest ofParis, France. It is operated by the French weather ser-vice (Météo-France) and is part of the operationalweather radar network (Parent du Châtelet et al. 2005).Transmitted frequency is 5.64 GHz resulting in a wave-length of 5.31 cm. Beamwidth is about 1.1° and pulsewidth is set to 2 s. This polarized radar was designedto simultaneously transmit and receive horizontally andvertically polarized waves. It is capable of directly pro-cessing Zh, Zdr, �hv at zero time lag, and �dp. Measure-
ments were obtained at an elevation angle of 0.4° every5 min. Data were collected on a polar coordinate sys-tem with a spatial resolution of 0.24 km in range and0.5° in azimuth. A description of the radar and a de-tailed examination of the quality of the polarimetricvariables were reported in Gourley et al. (2006a).
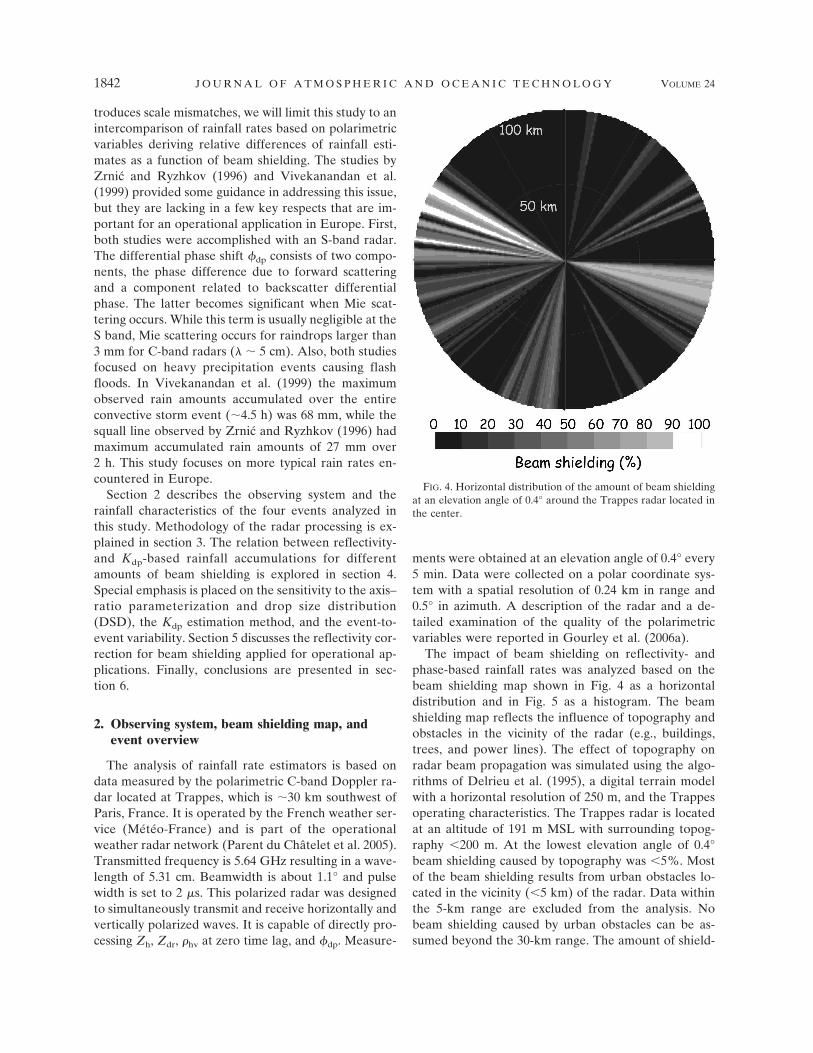
The impact of beam shielding on reflectivity- andphase-based rainfall rates was analyzed based on thebeam shielding map shown in Fig. 4 as a horizontaldistribution and in Fig. 5 as a histogram. The beamshielding map reflects the influence of topography andobstacles in the vicinity of the radar (e.g., buildings,trees, and power lines). The effect of topography onradar beam propagation was simulated using the algo-rithms of Delrieu et al. (1995), a digital terrain modelwith a horizontal resolution of 250 m, and the Trappesoperating characteristics. The Trappes radar is locatedat an altitude of 191 m MSL with surrounding topog-raphy �200 m. At the lowest elevation angle of 0.4°beam shielding caused by topography was �5%. Mostof the beam shielding results from urban obstacles lo-cated in the vicinity (�5 km) of the radar. Data withinthe 5-km range are excluded from the analysis. Nobeam shielding caused by urban obstacles can be as-sumed beyond the 30-km range. The amount of shield-
FIG. 4. Horizontal distribution of the amount of beam shieldingat an elevation angle of 0.4° around the Trappes radar located inthe center.
1842 J O U R N A L O F A T M O S P H E R I C A N D O C E A N I C T E C H N O L O G Y VOLUME 24
ing by obstacles was estimated from rainfall accumu-lated over 14 episodes at farther ranges (60–100 km)because the power losses are evident beyond the rangeswhere the initial shielding occurred. This range waschosen because data were not affected by contamina-tion due to direct ground clutter and the melting layerduring those episodes. Local minima in the accumu-lated rainfall along the azimuth are related to beamshielding effects, and the amount of shielding was de-rived as the relative differences between the minimumand the average rainfall accumulation. This method en-ables the derivation of the total amount of beam shield-ing for far ranges caused by nearby obstacles, which isthen applied to the entire ranges between 5 and 100 km.Resolving the amount of shielding for individual ob-stacles at certain ranges is difficult. In summary, weassume that the obstacles that cause the discontinuitiesin the rainfall accumulations are all next to the antenna.It is thus plausible that the true beam shielding at shortranges (5–30 km) is partially overestimated. Finally,beam shielding maps reflecting the influence of topog-raphy and urban obstacles are combined (Fig. 4).
The analysis was completed by using four rain eventswith different precipitation characteristics. Duration ofthe event and rainfall characteristics based on radarreflectivity measurements over the entire rain periodare listed in Table 1; average and maximum rainfall
rates were derived from rain gauge measurementswithin the 100-km radius around Trappes. Two coldfrontal rainbands were included in the analysis withaverage rainfall rates of 7 mm h�1 on 17 December2004 and 17 mm h�1 on 4 July 2005. Maximum rainfallrates were 13 mm h�1 on 17 December and 37 mm h�1
on 4 July. Although the rain on 17 December had thewidest spatial extent of the four cases, only �32% ofthat area had rainfall rates �20 mm h�1. On 4 July largeparts within the observational domain (78.3%) hadrainfall rates of �20 mm h�1. Stratiform precipitationoccurred on 28 July 2005 with maximum and averagerainfall rates of 32.4 and 5.1 mm h�1, respectively. Therain occurred only over 4 h and covered 0.14 10�4
km2 with 20% of the area having rainfall rates largerthan 20 mm h�1. Convection was embedded in thestratiform precipitation on 23 June with maximumand average rainfall rates of 51 and 11 mm h�1. In thelatter case only 0.52 10�4 km2 were covered byprecipitation, while 67% had rainfall rates larger than20 mm h�1.
3. Data processing
The investigation area was limited to ranges between5 and 100 km from the radar in order to ensure a su-perior accuracy of the derived polarimetric variables.Data processing consists of four parts, as schematicallyillustrated in Fig. 6. First, effects of noise, miscalibra-tion, near-radome interference, and system offset in ini-tial �dp measurements were removed or corrected(Gourley et al. 2006a). Then, echoes primarily relatedto ground clutter returns from fixed obstacles or due toanomalous propagation, chaff, and scatterers in opticalclear air (i.e., insects) were removed using a fuzzy logicalgorithm (Gourley et al. 2006b).
For rainfall estimation a more useful parameter than�dp itself is one-half of the range derivative of the two-way differential propagation phase defined as the spe-cific propagation phase Kdp. The appendix gives a de-tailed description about the methodology applied inthis analysis for estimating and evaluating Kdp. Pixelscontaining hydrometeor types other than raindrops(e.g., hail, melting snow, and snow) and those that had
TABLE 1. Characteristics of the four analyzed rain events based on radar data: start time, event duration, number of scans includedin the analysis, and spatial extent of precipitation averaged over the whole event (accumulated number of pixels per scan where Zh �10 dBZ ) with percentage fraction �1 and �20 mm h�1. A maximum area of 3.14 104 km2 is covered with a range of 100 km.
Date Start (UTC) Duration (h) No. of scans Extent (104 km2) Area � 1 mm h�1 (%) Area � 20 mm h�1 (%)
17 Dec 2004 0000 6 72 1.65 62.2 32.123 Jun 2005 1200 8 96 0.52 83.1 67.1
4 Jul 2005 0000 10 120 1.17 92.1 78.328 Jul 2005 1400 4 48 0.14 46.5 25.6
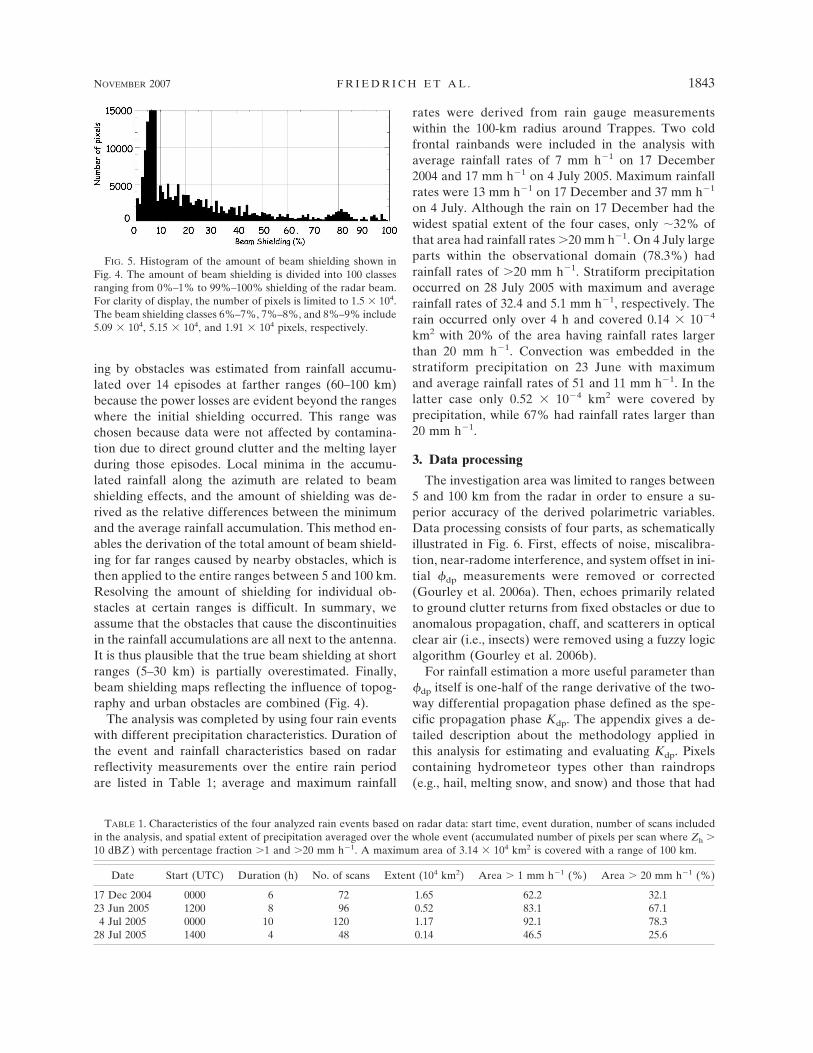
FIG. 5. Histogram of the amount of beam shielding shown inFig. 4. The amount of beam shielding is divided into 100 classesranging from 0%–1% to 99%–100% shielding of the radar beam.For clarity of display, the number of pixels is limited to 1.5 104.The beam shielding classes 6%–7%, 7%–8%, and 8%–9% include5.09 104, 5.15 104, and 1.91 104 pixels, respectively.
NOVEMBER 2007 F R I E D R I C H E T A L . 1843

reduced Zh and Zdr values due to attenuation were re-moved. The applied thresholds are listed in Table 2.Rain and drizzle are primarily identified by combiningZh, Zdr, and �hv measurements. A threshold of �dp �
20° was applied to restrict the attenuation of the trans-mitted power by hydrometeors to �1.4 dBZ for Zh and�0.4 dB for Zdr. Data containing hail were identifiedand removed using the differential reflectivity hail sig-nal according to Aydin et al. (1986) originally devel-oped to detect hail for S-band radars. This techniquewill be applied in this study to C-band radar in the sameway as for measurements at S band since Mie reso-nances occur primarily when Zdr � 1.75 dB. Generally,the application of the Aydin technique for C-band ra-dars requires more scrutiny. Also, data observed aboveand within the melting layer were excluded from theanalysis. For every hour, the lower height level of themelting layer was manually identified based on in-creases in Zh and reduced values of �hv. From thehourly derived lower melting layer heights the overallminimum was derived and data located beyond thisrange were removed. If the melting layer was not de-tectable by the radar, the lower height was set 1 kmbelow the 0° isotherm as observed by the Météo-Francesoundings launched at 0000 and 1200 UTC fromTrappes. The melting layer was not intersected withinthe 100-km range from the radar on 23 June, 4 July, and28 July 2005, while data beyond the 40-km range for the0.4° elevation angle were excluded from the analysis on17 December 2004.
Four radar rainfall algorithms were chosen to esti-mate rainfall rates based on polarimetric variables.Rainfall rates expressed in units of millimeters per hourwere computed at each pixel as
R�Zh� aZhb, �1�
R�Zh, Zdr� aZhb10cZdr, �2�
R�Kdp� a|Kdp|bsign�Kdp�, �3�
R�Kdp, Zdr� a|Kdp|b10cZdrsign�Kdp�. �4�
The units for Zh are mm6 m�3 and ° km�1 for Kdp.All relations listed in Eqs. (1)–(4) depend on the rela-tion between shape and size of the drops (denoted asthe axis–ratio relation) and assumed drop size distribu-tion. The analysis of disdrometer data collected duringthree months of convective and stratiform precipitationin a region close to Trappes revealed a mean Z–R re-lationship of Zh 282 R(Zh)1.66 [corresponding to a 0.0334 and b 0.6024 in Eq. (1)], which is used foroperational rainfall rate estimation (Testud 2003).Since the same disdrometer data have not been ana-lyzed for polarimetric rainfall rate quantities, we usedtheoretical and experimental studies focused on the pa-rameterization of different drop size distributions.Hagen (2001) applied three axis–ratio parameteriza-
FIG. 6. Schematic showing the different steps of data processingand rainfall accumulation.
TABLE 2. Thresholds for Zh, Zdr, and �hv used to identify rainand drizzle (based on Keenan 2003). Data were restricted to anapproximate attenuation of Zdr of 0.6 dB or smaller and of Zh of1.4 dBZ or smaller using the �dp threshold. The differential re-flectivity hail signal, Hdr, was used to exclude areas containing hail(Aydin et al. 1986).
Polarimetric variableThreshold for rain
and drizzle detection
Zh 10–60 dBZZdr 0.2–4 dB�hv �0.97�dp �20°Hdr Zh � f(Zdr) �0f(Zdr) 27 dB Zdr � 0 dBf(Zdr) 27 dB � 19Zdr 0 � Zdr
� 1.74 dBf(Zdr) 60 dB Zdr � 1.74 dB
1844 J O U R N A L O F A T M O S P H E R I C A N D O C E A N I C T E C H N O L O G Y VOLUME 24
tions (Pruppacher and Beard 1970; Keenan et al. 1997;Andsager et al. 1999), two measured and one simulateddrop size distribution, to a T-matrix scattering program(Bringi and Chandrasekar 2001) in order to derive theparameters a, b, and c, in Eqs. (2)–(4) for C-band radarmeasurements. Table 3 lists nine combinations of pa-rameter settings describing different axis–ratio rela-tions and drop size distributions. Different parametersettings were used in order to investigate the sensitivityof our results to these parameterizations. The resultswill be discussed in section 4a. The Trappes radar per-formed a volume scan every 5 min resulting in 12 radarrainfall rate estimates per hour. An hourly rainfall rateon a pixel-by-pixel basis was derived by averaging thescans accomplished every 5 min over one hour. Becauseof rain advection into and out of the observing domainand the stringent quality control measures, 12 rainfallrate values were not always available per hour. In thesecases a minimum number of six values was required tocalculate an hourly rainfall rate. Then, the hourly rain-
fall rate was accumulated over the duration of the rainevent, which varied between 4 h for 28 July to 10 h for4 July 2005 (Table 1).
The following analysis is based on comparing reflec-tivity- to Kdp-based rainfall rates accumulated over therainfall event. The reflectivity-based rainfall accumu-lates, R(Zh) and R(Zh, Zdr), were normalized by R(Kdp)since R(Kdp) is considered as the reference rainfall rateimmune to beam shielding effects in this analysis. Be-cause nonuniform beam filling effects and low rainfallrates may result in negative values of R(Kdp) andR(Kdp, Zdr) [see Eqs. (3)–(4)], negative rain rates areunrealistic and are thus excluded from further analysis.Additionally, the ratio of [R(Kdp, Zdr)/R(Kdp)] was ana-lyzed to investigate explicitly the behavior of Zdr withincreasing beam shielding. All three relations were ex-pressed in decibels denoted as 10log10[R(Zh)/R(Kdp)],10log10[R(Zh, Zdr)/R(Kdp)], and 10log10[R(Kdp, Zdr)/R(Kdp)]. The amount of beam shielding was dividedinto 100 classes ranging from low beam shielding (0%–
TABLE 3. Rainfall rate equations for different DSDs and axis–ratio parameterizations after Hagen (2001). DSDs were based ondisdrometer data measured at Oberpfaffenhofen between April and November 1996 and Locarno between September and November1999; and data based on a simulation. Axis–ratio parameterizations from Pruppacher and Beard (1970), Keenan et al. (1997), andAndsager et al. (1999) were applied to the DSDs in order to calculate values of a, b, and c using a T-matrix scattering program. Thetext set in boldface highlights the rainfall rate equations used for the analysis beyond section 4b.
Rainfall rate equation fordifferent DSDs
Axis–ratio parameterization from
Pruppacher and Beard (1970) Keenan et al. (1997) Andsager et al. (1999)
Oberpfaffenhofen, Germany (48.08°N, 11.28°E), April–November 1996R(Zh, Zdr) aZb
h10cZdr a � 0.0221 a � 0.0239 a � 0.0221b � 0.82 b � 0.75 b � 0.76c � �0.45 c � �0.40 c � �0.33
R(Kdp) a|Kdp| b sign(Kdp) a � 18.40 a � 29.08 a � 24.87b � 0.79 b � 0.79 b � 0.74
R(Kdp, Zdr) a|Kdp| b10cZdr sign(Kdp) a � 42.73 a � 63.90 a � 57.38b � 0.94 b � 0.94 b � 0.90c � �0.22 c � �0.25 c � �0.22
Locarno, Switzerland (46.17°N, 8.88°E), September–November 1999R(Zh, Zdr) aZb
h10cZdr a 0.0245 a 0.025 a 0.0215b 0.81 b 0.76 b 0.77c �0.40 c �0.36 c �0.3
R(Kdp) a|Kdp| b sign(Kdp) a 19.66 a 28.81 a 24.92b 0.78 b 0.77 b 0.71
R(Kdp, Zdr) a|Kdp| b10cZdr sign(Kdp) a 41.27 a 58.54 a 52.16b 0.92 b 0.91 b 0.86c �0.2 c �0.23 c �0.2
Simulated DSDR(Zh, Zdr) aZb
h10cZdr a 0.0185 a 0.0179 a 0.0172b 0.84 b 0.82 b 0.82c �0.31 c �0.3 c �0.26
R(Kdp) a|Kdp| b sign(Kdp) a 25.81 a 39.06 a 37.14b 0.84 b 0.82 b 0.78
R(Kdp, Zdr) a|Kdp| b10cZdr sign(Kdp) a 38.27 a 61.05 a 58.28b 0.92 b 0.92 b 0.88c �0.13 c �0.19 c �0.17
NOVEMBER 2007 F R I E D R I C H E T A L . 1845

1%) to almost complete beam shielding (99%–100%).Median and variance were derived from a probabilitydensi ty funct ions of 10log 1 0[R(Zh) /R(Kd p)] ,10log10[R(Zh, Zdr)/R(Kdp)], and 10log10[R(Kdp, Zdr)/R(Kdp)], which were obtained for each beam shieldingclass. For simplicity, we will refer to this as the medianand variance of 10log10[R(Zh)/R(Kdp)], 10log10[R(Zh,Zdr)/R(Kdp)], and 10log10[R(Kdp, Zdr)/R(Kdp)] in thefollowing discussion. For clarity of presentation, themedians were smoothed using a centered moving aver-age technique consisting of 10 beam shielding classes.Results are shown up to a power loss of 10 dB (90%beam shielding). Beyond this power loss the samplesizes become small and the computed medians arenoisy.
4. Relation between reflectivity- and Kdp-basedrainfall accumulations
First, we tested whether the median of the reflectiv-ity- to Kdp-based rainfall accumulation within low beamshielding (denoted as l) was significantly differentfrom those obtained within highly shielded areas (de-noted as h) using the resampling technique reported inGourley and Vieux (2005). For each rainfall event, twodatasets were created that have the same number ofpixels either distributed close to 0% or 100% repre-senting low and high beam shielding, respectively.Table 4 lists the number of pixels and the classes in-cluded in the low and high shielding dataset for eachrainfall event. Since the number of pixels per class wasmuch higher for low compared to high beam shielding(Fig. 5), the classes for low shielding ranged mainly onlyfrom 0% to 5%, while high beam shielding covered 30classes ranging from 70% to 100%.
The results of the statistical significance test are listedin Table 5. The medians of 10log10[R(Zh)/R(Kdp)] and10log10[R(Zdr, Zh)/K(dp)] were higher in low beamshielding regions (l � h) in all four analyzed events
with differences (l � h) of 1.77–3.21 dB. The medianof 10log10[R(Kdp, Zdr)/R(Kdp)] in the low beam shield-ing area exceeded the median in the high beam shield-ing region only on 4 July. Differences in the median of10log10[R(Kdp, Zdr)/R(Kdp)] ranged between �0.12 and0.15 dB. To determine whether the differences betweenthe low and high shielding dataset are significant, thelow and high shielding datasets for each rainfall eventwere combined and randomly separated into twodatasets. The median difference for each rainfall eventwas then computed. This resampling test was per-formed 1000 times in order to calculate the probabilitydensity function of differences due to random chance.The reduction in accumulations for the R(Zh) andR(Zdr, Zh) algorithms between low and high shieldingregions is statistically significant at the 99% level for allfour cases (Table 5). Rain rates from the R(Kdp, Zdr)algorithm, however, do not decrease with increasingbeam shielding at the 99% significance level.
a. Sensitivity to axis–ratio parameterization anddrop size distribution
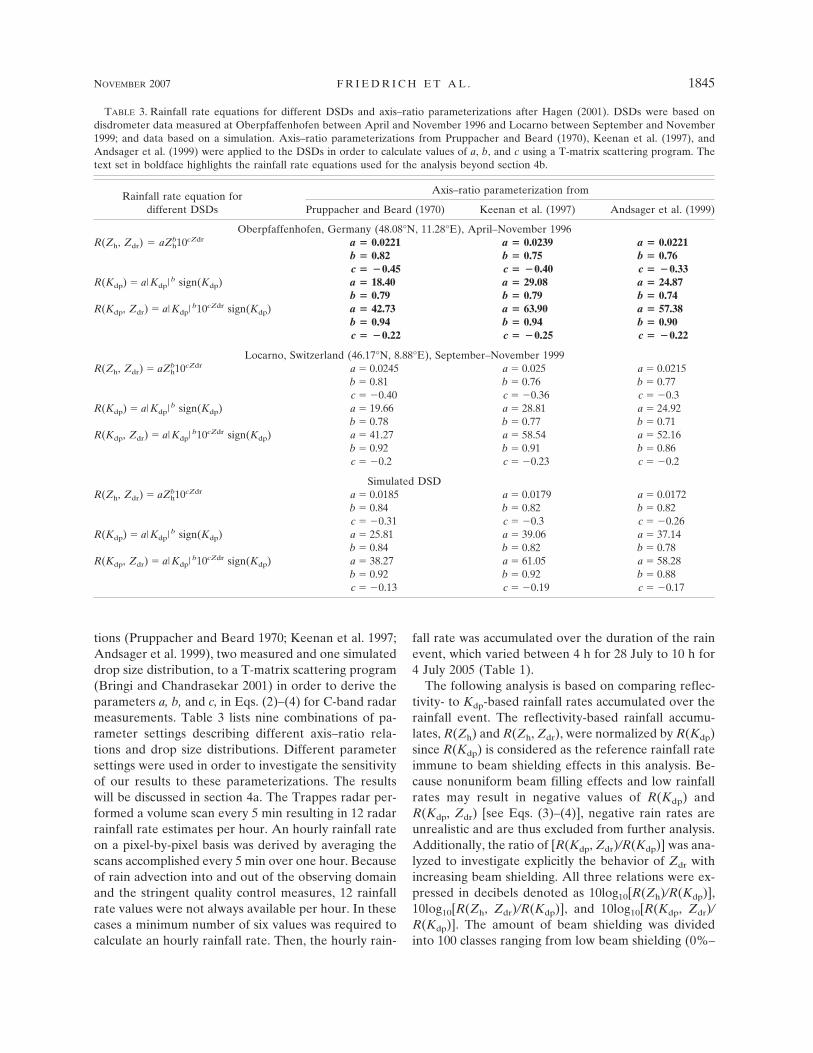
First, the sensitivity of reflectivity- and Kdp-basedrainfall accumulations on drop size distribution and ax-is–ratio parameterization was investigated. For eachrainfall event (Table 1) the hourly rainfall rate wascomputed for all nine combinations listed in Table 3and then accumulated over the event. Figure 7 showsmedians of 10log10[R(Zh)/R(Kdp)], 10log10[R(Zh, Zdr)/R(Kdp)], and 10log10[R(Kdp, Zdr)/R(Kdp)] for differentDSD and axis–ratio parameterizations as a function ofthe amount of beam shielding for the 4 July case. Al-though the different DSD and axis ratio parameteriza-tions produced similar trends with increasing beamshielding, large differences of up to �2 dB for the me-dian of 10log10[R(Zh)/R(Kdp)] in Fig. 7a and of �4 dBfor the median of 10log10[R(Zh, Zdr)/R(Kdp)] in Fig. 7bwere observed between the nine combinations. Thesedifferences are primarily related to the fact that R(Zh)was derived from a fixed drop size distribution and ax-is–ratio parameterization that was found for theTrappes radar (see Testud 2003), while the DSD andaxis–ratio parameterizations were varied for R(Zh, Zdr)and R(Kdp) according to Hagen (2001). The focus ofthis paper is on the behavior of reflectivity- versus Kdp-based rainfall rates as a function of beam shielding andnot differences due to different parameterizations.
In Figs. 7a and 7b, the medians of 10log10[R(Zh)/R(Kdp)] and 10log10[R(Zh, Zdr)/R(Kdp)] decreased at arate of �0.2 and �0.3 for power losses (beam shielding)of 0–6 dB (0%–75%), respectively. In particular, themedians of 10log10[R(Zh)/R(Kdp)] declined at a rate of0.2 between 0- and 1.5-dB, 0.4 between 1.5- and 2.8-dB,
TABLE 4. Characteristics of the statistical significance test foreach rainfall event. Total number of hourly accumulated rainfallrate pixels (Nt) and the number of pixels within the high beamshielding dataset ranging between 70% and 100% beam shielding(Nds). Since the number of pixels within a beam shielding classdecrease strongly with increasing beam shielding (Fig. 5), fewerbeam shielding classes were combined for the low beam shieldingdataset. Note that both the low and high beam shielding datasethave the same number of pixels (Nds).
Nt Nds
Classes included in the lowbeam shielding dataset (%)
17 Dec 2004 20 641 1445 0–423 Jun 2005 65 170 4563 0–5
4 Jul 2005 39 141 2740 0–528 Jul 2005 199 103 9955 0–4
1846 J O U R N A L O F A T M O S P H E R I C A N D O C E A N I C T E C H N O L O G Y VOLUME 24

and 0.3 between 2.8- and 6-dB power loss. The declinerate for the median of 10log10[R(Zh, Zdr)/R(Kdp)] withincreasing beam shielding was slightly higher with 0.3between 0- and 1.5-dB, 0.5 between 1.5- and 2.8-dB,and 0.4 between 2.8- and 6-dB power loss. Note thecentered moving averages (thick lines in Fig. 7) includ-ing 10 beam shielding classes were highly influenced bythe data included in �8-dB power loss. This effectcaused a stagnation and slight increase of the movingaverage curves between 7 and 10 dB. The number ofsamples was significantly smaller (�100 pixels perclass) beyond 85% beam shielding (Fig. 5), and themedians show strong variation. Since the results be-yond 8-dB power loss become questionable, they werenot analyzed further in this section. Although the dif-ferent curves in Figs. 7a and 7b show an offset in themedian values, medians of 10log10[R(Zh)/R(Kdp)] and10log10[R(Zh, Zdr)/R(Kdp)] decreased at almost thesame rate. This can give a first indication that the Zdr
measurements are less sensitive to beam shielding ef-fects. This effect is much better indicated when com-paring 10log10[R(Kdp, Zdr)/R(Kdp)] in Fig. 7c. Figure 7cindicates that the medians of 10log10[R(Kdp, Zdr)/R(Kdp)] scarcely changed (decline �0.01 between 0 and6 dB) with increasing beam shielding. However, thecontribution of Zdr in Eq. (4) is rather small comparedto the influence of Kdp. In section 5, the influence ofbeam shielding on the polarimetric quantities will beinvestigated in more detail. Again, results beyond 8 dBwere excluded from the analysis. Similar trends in the
medians of 10log10[R(Zh)/R(Kdp)], 10log10[R(Zh, Zdr)/R(Kdp)], and 10log10[R(Kdp, Zdr)/R(Kdp)] were ob-served for the other rain events (figures not shown).Differences in decrease rate between different DSDsand axis–ratio parameterizations were less then 0.03between 0 and 6 dB. Therefore, a single DSD fromOberpfaffenhofen, Germany, and the Andsager et al.(1999) drop shape parameterization will be used here-after. While the DSD observed in Locarno, Switzer-land, mainly included heavy Mediterranean rain eventsin autumn, DSD from Oberpfaffenhofen covered awide range of stratiform and convective rain eventssimilar to those discussed in this paper.
b. Sensitivity to Kdp estimation methods
Three methods were applied for estimating Kdp andthe results were evaluated using a consistency method.The methodology is explained in the appendix. Theevaluation of the �dp-based Kdp estimation is shown inFig. 8 as a function of radar reflectivity and Kdp esti-mation based on Zh and Zdr for the rainfall event on 4July 2002. The best agreement with the consistencymethod was found for the centered finite-differencemethod compared to the regression-based method(Figs. 8a,c, left). Comparing the centered finite-difference method, the �dp-based Kdp is closer to thereflectivity-based Kdp using centered differences. Thesame results were observed when comparing with mea-sured reflectivity. The regression-based techniquesshowed higher variation than the finite-difference
TABLE 5. Results of the statistical significance test between one sample that includes data with low beam shielding and a secondsample that covers high beam shielding. Differences between the median of the low and high shielding dataset (l � h), the medianof high beam shielding dataset (h), and the 1st and 99th percentiles of the probability density function including the resampleddifferences are shown. For resampling, data from both datasets were randomly selected and the differences between the medians werecalculated. The percentiles were derived from the resampled median differences.
l � h (dB) h (dB) 1st percentile (dB) 99th percentile (dB)
17 Dec 200410log10[R(Zh)/R(Kdp)] 1.77 �1.74 �0.31 0.3010log10[R(Zh, Zdr)/R(Kdp)] 2.10 �2.56 �0.33 0.3210log10[R(Kdp, Zdr)/R(Kdp)] �0.03 �0.94 �0.10 0.08
23 Jun 200510log10[R(Zh)/R(Kdp)] 2.34 �3.48 �0.14 0.1210log10[R(Zh, Zdr)/R(Kdp)] 2.67 �4.42 �0.16 0.1310log10[R(Kdp, Zdr)/R(Kdp)] �0.12 �1.22 �0.04 0.02
4 Jul 200510log10[R(Zh)/R(Kdp)] 2.51 �3.58 �0.11 0.0910log10[R(Zh, Zdr)/R(Kdp)] 3.21 �4.99 �0.13 0.1010log10[R(Kdp, Zdr)/R(Kdp)] 0.15 �1.41 �0.03 0.01
28 Jul 200510log10[R(Zh)/R(Kdp)] 2.14 �4.75 �0.18 0.1610log10[R(Zh, Zdr)/R(Kdp)] 2.70 �5.38 �0.22 0.1910log10[R(Kdp, Zdr)/R(Kdp)] �0.09 �0.75 �0.06 0.04
NOVEMBER 2007 F R I E D R I C H E T A L . 1847
methods. Note that the jump in reflectivity at 40 dBZwas caused by the change in averaging interval. Theanalysis of all cases shows that the Kdp method is lesssensitive to the smoothing method of �dp profiles but isindeed sensitive to the averaging interval. The analysisin sections 4b and 4c is based on smoothing of the �dp
range profiles by a moving average technique and cal-culating Kdp based on centered differences.
Figure 9 shows the median of 10log10[R(Zh)/R(Kdp)],10log10[R(Zh, Zdr)/R(Kdp)], and 10log10[R(Kdp, Zdr)/R(Kdp)] as a function of power loss (beam shielding) forthree different methods chosen to estimate Kdp. Thesensitivity to Kdp estimation methods is examined inthis section because it has been shown in Ryzhkov andZrnic (1998a) and Gorgucci et al. (1999) that Kdp can bebiased either negatively or positively if there is nonuni-
FIG. 7. Median of (a) 10log10[R(Zh)/R(Kdp)], (b) 10log10[R(Zh, Zdr)/R(Kdp)], and (c) 10log10[R(Kdp,Zdr)/R(Kdp)] for each shielding class every 1% beam shielding (thin lines) and moving average com-bining 10 shielding classes (thick lines) for the 6-h rainfall event on 4 Jul 2005. Different gray shadingindicates the DSDs. Black lines represent the DSD measured in Oberpfaffenhofen (OP), dark gray linesthe DSD measured in Locarno (LO), and light gray lines indicate the simulated DSD (SI). Solid linesindicate axis–ratio parameterization according to Pruppacher and Beard (1970) (PB), dashed linesdenote the Keenan et al. (1997) parameterization (K), and dashed–dotted lines represent the Andsageret al. (1999) parameterization (A). The nomenclature of the nine combinations was assembled by theabbreviation of the DSD and axis–ratio parameterization.
1848 J O U R N A L O F A T M O S P H E R I C A N D O C E A N I C T E C H N O L O G Y VOLUME 24
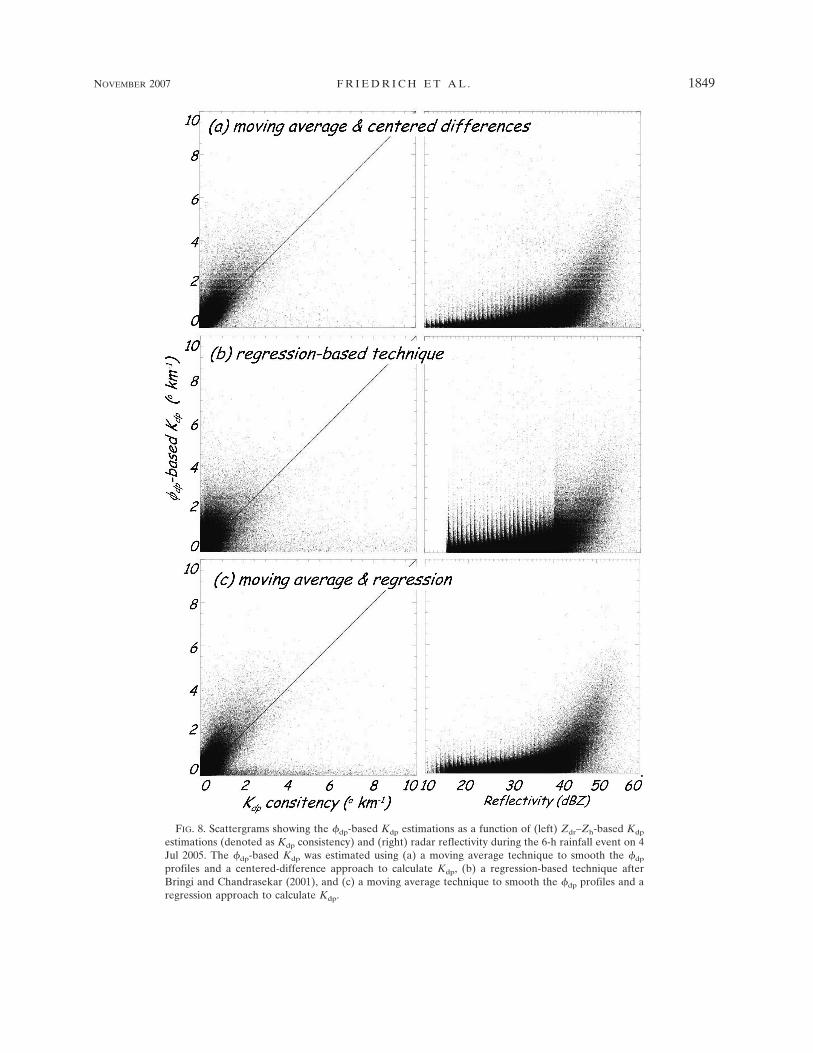
FIG. 8. Scattergrams showing the �dp-based Kdp estimations as a function of (left) Zdr–Zh-based Kdp
estimations (denoted as Kdp consistency) and (right) radar reflectivity during the 6-h rainfall event on 4Jul 2005. The �dp-based Kdp was estimated using (a) a moving average technique to smooth the �dp
profiles and a centered-difference approach to calculate Kdp, (b) a regression-based technique afterBringi and Chandrasekar (2001), and (c) a moving average technique to smooth the �dp profiles and aregression approach to calculate Kdp.
NOVEMBER 2007 F R I E D R I C H E T A L . 1849

form rainfall in the path over which Kdp is estimatedand strong azimuthal gradients within the radar resolu-tion volume. Different Kdp estimation methods basedon regression versus centered finite-difference ap-proaches were tested using data measured on 4 July.The number of pixels included in the analysis variedsignificantly for the different beam shielding classes
(�beam shielding 1%). For more than 50% beamshielding, the number of pixels ranged between 10 and1000 per class, while for less than 30% the shieldingclasses contained 1500–50 000 pixels (Fig. 5).
The medians of 10log10[R(Zh) /R(Kdp)] and10log10[R(Zdr, Zh)/R(Kdp)] decreased with increasingbeam shielding in a similar way for all the three Kdp
FIG. 9. Same as in Fig. 7, but comparing different techniques to estimate Kdp such as the movingaverage technique to smooth �dp and centered finite differences to estimate Kdp (black lines); theregression-based estimate of Kdp based on Bringi and Chandrasekar (2001) is indicated by the dark graylines; and the moving average technique to smooth �dp and a regression method to calculate Kdp isindicated by the light gray lines. Rainfall rate equations were based on the DSD measured in Oberp-faffenhofen and the Andsager et al. (1999) axis–ratio parameterizations.
1850 J O U R N A L O F A T M O S P H E R I C A N D O C E A N I C T E C H N O L O G Y VOLUME 24
estimation methods up to 85% beam shielding or 8-dBpower loss. The medians declined at a rate of 0.1–0.2 for10log10[R(Zh)/R(Kdp)] and 0.2–0.3 for 10log10[R(Zdr,Zh)/R(Kdp)] for all Kdp estimation methods between 0-and 6-dB power loss. The decrease of the median wasslightly less by �0.1 for 0–1.5-dB power loss and 0.05for 1.5–2.8-dB power loss for the regression-basedmethod compared to the finite-difference approach.The differences in the Kdp estimation techniques were�0.2 dB for median values of 10log10[R(Kdp, Zdr)/R(Kdp)] shown in Fig. 9c with hardly any change withincreasing beam shielding. Similar trends were ob-served for the other rain events (figures not shown).The trend of decreasing 10log10[R(Zh)/R(Kdp)] and10log10[R(Zh, Zdr)/R(Kdp)] with increasing beamshielding was apparent and independent of the Kdp es-timation method. The values of 10log10[R(Zh)/R(Kdp)],10log10[R(Zh, Zdr)/R(Kdp)], and 10log10[R(Kdp, Zdr)/R(Kdp)] at a given value of beam shielding are similarfor all the Kdp estimation methods evaluated in thisstudy. Much higher sensitivities are seen with differ-ences in DSD and axis–ratio parameterizations (seeFig. 7). The following analysis is based on smoothing ofthe �dp range profiles by a moving average techniqueand calculating Kdp based on centered differences.
c. Event-to-event variability
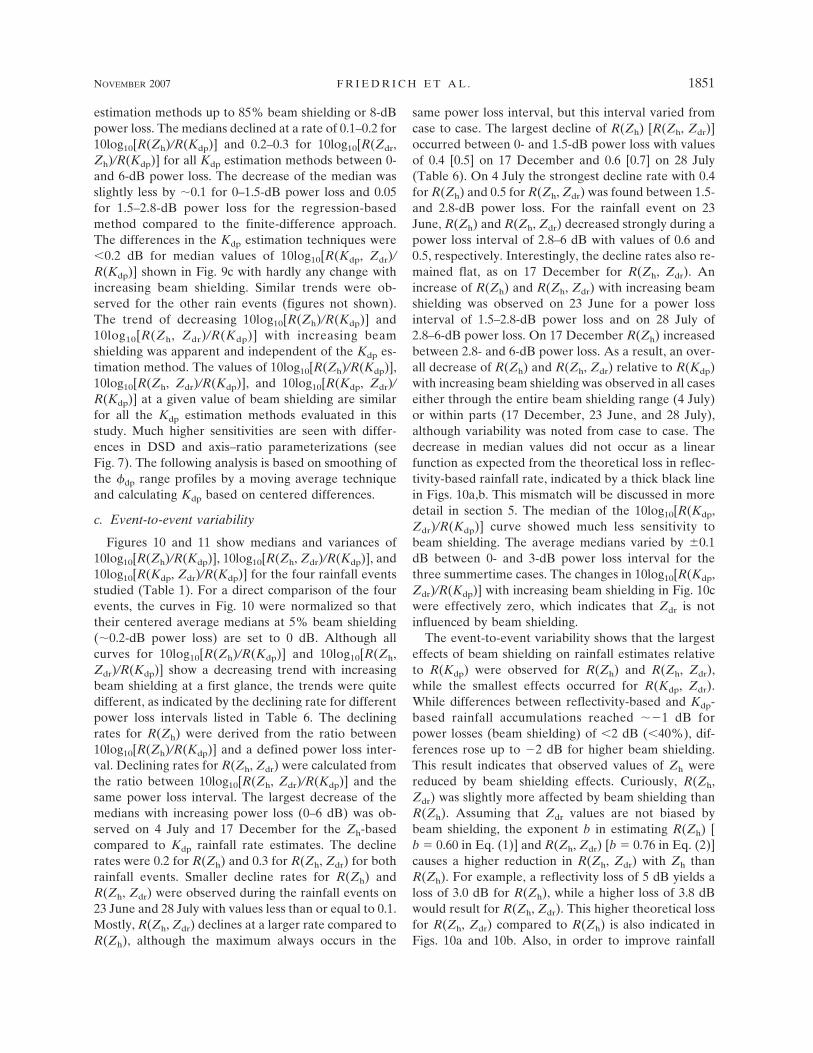
Figures 10 and 11 show medians and variances of10log10[R(Zh)/R(Kdp)], 10log10[R(Zh, Zdr)/R(Kdp)], and10log10[R(Kdp, Zdr)/R(Kdp)] for the four rainfall eventsstudied (Table 1). For a direct comparison of the fourevents, the curves in Fig. 10 were normalized so thattheir centered average medians at 5% beam shielding(�0.2-dB power loss) are set to 0 dB. Although allcurves for 10log10[R(Zh)/R(Kdp)] and 10log10[R(Zh,Zdr)/R(Kdp)] show a decreasing trend with increasingbeam shielding at a first glance, the trends were quitedifferent, as indicated by the declining rate for differentpower loss intervals listed in Table 6. The decliningrates for R(Zh) were derived from the ratio between10log10[R(Zh)/R(Kdp)] and a defined power loss inter-val. Declining rates for R(Zh, Zdr) were calculated fromthe ratio between 10log10[R(Zh, Zdr)/R(Kdp)] and thesame power loss interval. The largest decrease of themedians with increasing power loss (0–6 dB) was ob-served on 4 July and 17 December for the Zh-basedcompared to Kdp rainfall rate estimates. The declinerates were 0.2 for R(Zh) and 0.3 for R(Zh, Zdr) for bothrainfall events. Smaller decline rates for R(Zh) andR(Zh, Zdr) were observed during the rainfall events on23 June and 28 July with values less than or equal to 0.1.Mostly, R(Zh, Zdr) declines at a larger rate compared toR(Zh), although the maximum always occurs in the
same power loss interval, but this interval varied fromcase to case. The largest decline of R(Zh) [R(Zh, Zdr)]occurred between 0- and 1.5-dB power loss with valuesof 0.4 [0.5] on 17 December and 0.6 [0.7] on 28 July(Table 6). On 4 July the strongest decline rate with 0.4for R(Zh) and 0.5 for R(Zh, Zdr) was found between 1.5-and 2.8-dB power loss. For the rainfall event on 23June, R(Zh) and R(Zh, Zdr) decreased strongly during apower loss interval of 2.8–6 dB with values of 0.6 and0.5, respectively. Interestingly, the decline rates also re-mained flat, as on 17 December for R(Zh, Zdr). Anincrease of R(Zh) and R(Zh, Zdr) with increasing beamshielding was observed on 23 June for a power lossinterval of 1.5–2.8-dB power loss and on 28 July of2.8–6-dB power loss. On 17 December R(Zh) increasedbetween 2.8- and 6-dB power loss. As a result, an over-all decrease of R(Zh) and R(Zh, Zdr) relative to R(Kdp)with increasing beam shielding was observed in all caseseither through the entire beam shielding range (4 July)or within parts (17 December, 23 June, and 28 July),although variability was noted from case to case. Thedecrease in median values did not occur as a linearfunction as expected from the theoretical loss in reflec-tivity-based rainfall rate, indicated by a thick black linein Figs. 10a,b. This mismatch will be discussed in moredetail in section 5. The median of the 10log10[R(Kdp,Zdr)/R(Kdp)] curve showed much less sensitivity tobeam shielding. The average medians varied by �0.1dB between 0- and 3-dB power loss interval for thethree summertime cases. The changes in 10log10[R(Kdp,Zdr)/R(Kdp)] with increasing beam shielding in Fig. 10cwere effectively zero, which indicates that Zdr is notinfluenced by beam shielding.
The event-to-event variability shows that the largesteffects of beam shielding on rainfall estimates relativeto R(Kdp) were observed for R(Zh) and R(Zh, Zdr),while the smallest effects occurred for R(Kdp, Zdr).While differences between reflectivity-based and Kdp-based rainfall accumulations reached ��1 dB forpower losses (beam shielding) of �2 dB (�40%), dif-ferences rose up to �2 dB for higher beam shielding.This result indicates that observed values of Zh werereduced by beam shielding effects. Curiously, R(Zh,Zdr) was slightly more affected by beam shielding thanR(Zh). Assuming that Zdr values are not biased bybeam shielding, the exponent b in estimating R(Zh) [b 0.60 in Eq. (1)] and R(Zh, Zdr) [b 0.76 in Eq. (2)]causes a higher reduction in R(Zh, Zdr) with Zh thanR(Zh). For example, a reflectivity loss of 5 dB yields aloss of 3.0 dB for R(Zh), while a higher loss of 3.8 dBwould result for R(Zh, Zdr). This higher theoretical lossfor R(Zh, Zdr) compared to R(Zh) is also indicated inFigs. 10a and 10b. Also, in order to improve rainfall
NOVEMBER 2007 F R I E D R I C H E T A L . 1851
estimations Zdr must be measured within an accuracy of�0.2 dB. In practice this accuracy may be limited byseveral factors such as reflectivity gradients and mis-matched beams (Illingworth 2003). Because the equa-tions used to derive rain rates are nonlinear and involvemultiple polarimetric variables, it is difficult to quantifyhow Zdr values were impacted by beam shielding usingrain rates. The behavior of Zdr with increasing powerloss will be discussed in more detail in section 5.
The variance was �1.5–2 dB for 10log10[R(Zh)/R(Kdp)] and 10log10[R(Zh, Zdr)/R(Kdp)] for the sum-mertime cases, and �2.2–2.8 dB for the 17 December2004 case (Fig. 11). A variance of �0.8 dB was ob-served for 10log10[R(Kdp, Zdr)/R(Kdp)] for all cases.The variation in the median values of all curves in-creased significantly for beam shielding �80% and�2%. Generally, the number of data points included inthe analysis was lower for high (60%–100%) and very
FIG. 10. Same as in Fig. 7, but showing median of (a) 10log10[R(Zh)/R(Kdp)], (b) 10log10[R(Zh,Zdr)/R(Kdp)], and (c) 10log10[R(Kdp, Zdr)/R(Kdp)] for rain events measured on 17 Dec 2004 and 23 Jun,4 Jul, and 28 Jul 2005. Different gray shading indicates the event as shown in (a). The moving averagecombining 10 beam shielding classes is overlaid (thick lines). For an intercomparison of the cases, thegraphs were displaced in a way that the centered moving average medians at 5% beam shielding arelocated at the zero median. The thick black lines in (a) and (b) indicate the theoretical loss in reflectivity-based rainfall rate to be expected according to the amount of beam shielding. Note that the expectedpower loss is often used to correct measured reflectivity.
1852 J O U R N A L O F A T M O S P H E R I C A N D O C E A N I C T E C H N O L O G Y VOLUME 24

low (0%–2%) beam shielding compared to 2%–60%beam shielding (Fig. 5). These uncertainties are relatedeither to the reduced number of data points involved inthe analysis, inaccuracies in the shielding maps, an in-accurate pointing angle by the radar, or combinationstherein. For low and high beam shielding a displace-ment by only 1° azimuth produces a large impact on theeffective beam shielding. This is enforced by the factthat high shielding mainly due to urban obstacles onlyoccurred along isolated rays (Fig. 4). Doviak and Zrnic
(1993) also claimed that with a decrease of SNR, phasemeasurements have an increased uncertainty but nobias. It is plausible that at beam shielding of 80%–100%, the SNR became too low and resulted in noisyR(Kdp) estimates.
5. Discussion of partial beam shielding effects onKdp, Zh, and Zdr
The analysis in section 4c is based on the assumptionthat Kdp measurements are not effected by partial beam
TABLE 6. List of declining rates for R(Zh) and R(Zh, Zdr). The declining rates for R(Zh) were derived from the ratio between averagemedian of 10log10[R(Zh)/R(Kdp)] and a defined power loss interval; the declining rates for R(Zh, Zdr) represent the ratio between10log10[R(Zh, Zdr)/R(Kdp)] and a defined power loss interval. Data were fitted to a linear model by minimizing the chi-square errorstatistic; curves are shown in Figs. 10a,b. Events are sorted according to the ratio for a power loss between 0 and 6 dB.
10log10[R(Zh)/R(Kdp)] (dB) 10log10[R(Zh, Zdr)/R(Kdp)] (dB)
Power loss interval (dB) 0–1.5 1.5–2.8 2.8–6 0–6 0–1.5 1.5–2.8 2.8–6 0–6
4 Jul 2005 �0.2 �0.4 �0.3 �0.2 �0.3 �0.5 �0.4 �0.317 Dec 2004 �0.4 �0.3 0.2 �0.2 �0.5 �0.4 0.0 �0.323 Jun 2005 �0.1 0.2 �0.6 �0.1 �0.2 0.3 �0.5 �0.128 Jul 2005 �0.6 �0.2 0.1 0.0 �0.7 �0.2 0.1 �0.1
FIG. 11. Variance of (a) 10log10[R(Zh)/R(Kdp)], (b) 10log10[R(Zh, Zdr)/R(Kdp)], and (c) 10log10[R(Kdp,Zdr)/R(Kdp)] for rain events measured on 17 Dec 2004 and 23 Jun, 4 Jul, and 28 Jul 2005. The thin linesrepresent the variances within each shielding class (� 1%); thick lines are the centered movingaverages including 10 beam shielding classes.
NOVEMBER 2007 F R I E D R I C H E T A L . 1853

shielding. This hypothesis is supported by the averageKdp of the four rainfall events shown in Fig. 12. Valuesof Kdp ranged within the experimentally found preci-sion of 0.1° km�1 and reveal no dependency on beamshielding. On the contrary, Zh decreases by �5 dB fora power loss of 10 dB (Fig. 12), as already indicated forrainfall rates in section 4c. Interestingly, the loss inR(Zh) is smaller than the theoretical loss in reflectivity-based rainfall rate. This is significant because for anoperational application a fast and straightforward ap-proach to correct radar reflectivity for beam shieldingeffect is conducted by adding the power loss based onthe shielding map to the measured reflectivity in deci-bels. Note that this correction can also be accomplishedby converting the power loss in terms of loss in rainfall
rate using Eq. (1). In Fig. 10, the estimated power lossbased on the Trappes beam shielding map and the theo-retical loss of the reflectivity-based rainfall rate [Eq.(1)] is indicated by the thick black line. As an example,2 dB would need to be added to the measured reflec-tivity (dB) to compensate for a power loss of 2 dB(37% beam shielding). For the Swiss operational radarlocated in the Alps, radar reflectivity is corrected for amaximum power loss of 2 dB, and the corrected pixelsare weighted according to the visibility (Germann et al.2006). For the French operational radar rainfall prod-uct radar reflectivity is corrected for partial beamshielding up to 5-dB (70%) power loss (Tabary 2007).Figure 13 shows a zoom-in of Fig. 10a for a power lossof 0–2 dB. The average medians on 4 July and 17 De-
FIG. 13. Same as in Fig. 10a, but zoomed into the power loss region ranging from 0 to 2 dB.
FIG. 12. Mean Zh (black line; scale on the left), Zdr (dark gray line; scale on the left), and Kdp (lightgray line; scale on the right) averaged over all four rainfall events as a function of power loss and beamshielding. Mean values for each beam shielding class (every 1%) are indicated as thin lines; the centeredaveraged means including 10 beam shielding classes are overlaid as thick lines.
1854 J O U R N A L O F A T M O S P H E R I C A N D O C E A N I C T E C H N O L O G Y VOLUME 24

cember agree well (�0.1 dB) with the theoretical as-sumption between 0- and 1-dB power loss. For powerlosses between 1 and 2 dB the median values were 0.6(1.0) dB larger than expected losses for the 4 July (17December) case. On 23 June, however, the differenceswere mainly 0.6–1.2 dB. On 28 July median values wereup to 0.6 dB lower than the reflectivity correction forlow shielding (0–1-dB power loss). With increasingbeam shielding the average median approached the re-flectivity correction. Figure 11a indicates that the re-flectivity correction beyond 2-dB power loss can createbiases of up to a factor of 3. Generally, the slopes of themedians with increasing beam shielding for the fourcases are much lower than the theoretical value.
The largest uncertainty between measured and theo-retical loss in rainfall rate is related to the representa-tiveness of obstacles near the radar in the beam shield-ing map. As described in section 2, the amount ofshielding is overestimated in the vicinity of the radar.Therefore, observed R(Zh) is larger than expected fromthe beam shielding map, resulting in a lower decreaseof R(Zh)/R(Kdp) compared to the theoretical loss.While the total amount of beam shielding for far rangescan be estimated using rainfall accumulations, resolvingthe amount of shielding for individual obstacles is dif-ficult. As a result, the accuracy of reflectivity correctionstrongly depends on the accuracy of the beam shieldingmap. Wrong antenna pointing both in azimuth and el-evation can result in significant errors in the correctionof R(Zh) based on a beam shielding map. Further rea-sons for the mismatch between theoretical and mea-sured R(Zh) loss remain speculative. Based on rainfallamounts and their distribution (see section 2), a widevariation in drop size distribution can be assumed thatmight not represent the estimated Z–R relationship.Variability might be related to the differences in DSD,causing the R(Zh) and R(Zh, Zdr) algorithms to yielddifferent rainfall amounts relative to R(Kdp). The accu-racy of the �dp measurement also influences the results.A lot of emphasis in this study was put on differentmethods of filtering �dp profiles and deriving Kdp mea-surements. In addition, phase shifts are small at lowrainfall rates, which results in noisy �dp measurements.Last, noisy �dp measurements result from smallamounts of ground clutter and mismatched sidelobesignals.
The analysis in section 4c reveals another interestingquestion on whether Zdr is influenced by partial beamshielding. According to Fig. 12, Zdr is not significantlyaffected by beam shielding. Values range between theexperimentally found precision of 0.2 dB and show nodependency on beam shielding effects. Giangrande andRyzhkov (2005) observed azimuthal modulations of Zdr
within uniform precipitation only at the lowest eleva-tion angle of 0.5°. In their cases the Zdr bias was as largeas 0.8 dB, which they related to partial beam shieldingeffects. They associated the origin of the Zdr bias to themismatch of the antenna beam in the horizontal andvertical polarization, multipath propagation with differ-ent characteristics in the vertical and horizontal wave,and effects of semitransparent obstacles such as trees inthe vicinity of the radar. The Trappes radar is locatedon top of a 15-m-high tower to avoid the influence ofobstacles nearby the radar. Most of the ground cluttercontamination results from urban obstacles occurringwithin a 25-km range (see Fig. 1 in Gourley et al.2006b). However, azimuthal modulations can also becaused by radome and near-radome interferences,which were discovered for the Trappes radar by Gour-ley et al. (2006a). In their case, Zdr varied within asemiregular pattern by �0.5 dB at an elevation of 1.5°,which is unblocked by obstacles and ground clutter.
6. Conclusions
The influence of radar beam shielding on reflectivity-and Kdp-based rainfall estimates hsd been investigatedwith data obtained by the operational, polarimetric C-band weather radar located in Trappes, France. Thebehavior of R(Zh), R(Zh, Zdr), and R(Kdp, Zdr) withincreasing beam shielding with respect to R(Kdp) wasinvestigated focusing on three main issues: 1) the sen-sitivity of the results to axis–ratio parameterization anddrop size distribution, 2) the sensitivity to Kdp estima-tion methods comparing regression with centered dif-ference approaches, and 3) the representativeness ofthe results in terms of event-to-event variability. Theanalysis was based on four typical rain events encoun-tered in Europe including cold frontal rainbands withaverage rainfall rates of �7 mm h�1 in winter, and oneevent with average values of �17 mm h�1 in summer-time. Also two summertime events were part of theanalysis with stratiform precipitation and partially em-bedded convection with average rainfall rates of 5–11mm h�1.
Nine combinations of rainfall estimates consisting ofthree drop size distributions and three axis–ratio pa-rameterizations were assessed (Table 3). Although therainfall estimates were sensitive to drop size distribu-tion and axis–ratio parameterization, the trends occur-ring with increasing beam shielding were independentfrom these parameters. Influences of Kdp and fluctua-tions of �dp were not apparent on the relationship be-tween reflectivity- and Kdp-based rainfall accumulation.Rainfall accumulations from Kdp were insensitive tothree different methods examined to estimate Kdp from�dp profiles.
NOVEMBER 2007 F R I E D R I C H E T A L . 1855

The influence of beam shielding on R(Zh), R(Zh,Zdr), and R(Kdp, Zdr) is summarized in Fig. 14. Largeeffects of beam shielding on rainfall accumulationswere observed for R(Zh) and R(Zh, Zdr) with differ-ences up to �2 dB (40%) compared to R(Kdp) over abeam shielding range of 0–8 dB. In two of the fourevents the strongest decrease in 10log10[R(Zh)/R(Kdp)]and 10log10[R(Zh, Zdr)/R(Kdp)] occurred between 0 and1.5 dB. Analyzing the behavior of Zdr and Kdp withincreasing power loss shows that Zdr and Kdp are notaffected by beam shielding. Mean values range withinthe experimentally found precision of 0.2 dB for Zdr
and 0.1° km�1 for Kdp. Although Zdr hardly varies withincreasing power loss, R(Zh, Zdr) seems to be moreaffected by beam shielding than R(Zh). This discrep-ancy can be related to the difference in the b exponentsin Eqs. (1) and (2), which means that R(Zh, Zdr) variesmore with Zh than R(Zh). Also, rainfall rate estimationsusing Zdr are more sensitive to accuracy of Zdr thanZ–R relationships with respect to Zh. Interestingly, ra-dar reflectivity (Fig. 2) and reflectivity-based rainfall(Fig. 10) decreased at a lower rate than the reflectivitycorrection theory. If the reflectivity of the four casesstudied would have been corrected for beam shieldingeffects by adding the power loss, the rainfall rate wouldhave been overestimated by as much as 0.5 dB forpower loss �1.5 dB. For higher power losses the rainfallrate would have been overestimated up to �3 dB. Thismismatch between the results and the reflectivity cor-rection is primarily related to the accuracy with whichthe beam shielding map was derived. While topographyis typically known with a high spatial resolution, urbanobstacles and trees within less than a 5-km range fromthe radar are very hard to resolve with beam shielding
maps. Only small effects (�0.5 dB) occurred for R(Kdp,Zdr) compared to R(Kdp). Large variability in the po-larimetric variables occurred for power losses �6 dB(75% beam shielding), increasing significantly forpower losses larger than 8 dB (�85% beam shielding).
Acknowledgments. We extend special thanks toJacques Parent du Châtelet of Météo-France; Gian-mario Galli and Bertrand Calpini of MeteoSwiss; Mar-tin Hagen of Deutsches Zentrum für Luft- und Raum-fahrt Oberpfaffenhofen; Alexander Ryzhkov of theUniversity of Oklahoma; and the anonymous reviewerfor providing comments and suggestions that enhancedthe quality of the paper. The authors thank KimDoKhac of Météo-France for assisting in the acquisi-tion of the radar data. This research is part of thecollaboration between Switzerland and France in theINTERREG IIIa project “Radar de Franche-Comté.”It is co-funded by the European Union, the FrenchMinistère de l’Ecologie et du Dèveloppment Durable,Météo-France, MeteoSwiss, the Swiss State Secretariatfor Economic Affairs, and the Swiss cantons Neuchâtel,Bern, Jura, Basel Landschaft, Fribourg, and Vaud.
APPENDIX
Methodology for Estimating and Evaluating Kdp
Several methods have been evaluated to calculateKdp with C-band radars, for example, those of May etal. (1999), Bringi and Chandrasekar (2001), and Testudet al. (2000). Here, Kdp is estimated as one-half therange derivative of �dp. Since �dp fluctuates typically
FIG. 14. Schematic diagram summarizing the results of this study. The thick black lines illustrate thebehavior of R(Zh), R(Zdr), and R(Kdp, Zdr) with respect to R(Kdp). The results are based on four rainfallevents with different rainfall characteristics (Table 1). The gray lines indicate the theoretical loss ofreflectivity-based rainfall rate according to the power loss from the beam shielding map.
1856 J O U R N A L O F A T M O S P H E R I C A N D O C E A N I C T E C H N O L O G Y VOLUME 24
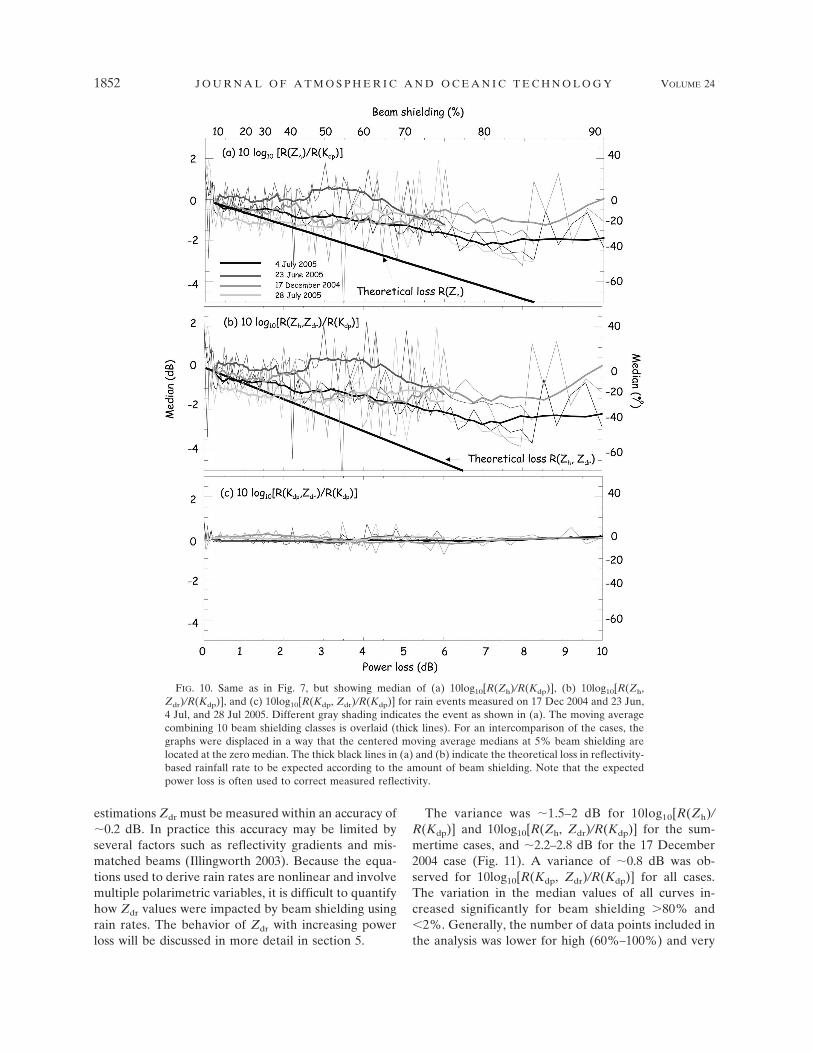
�3°–6°, the accuracy of Kdp can be increased bysmoothing the range profile. The standard deviation ofthe Kdp estimation depends on the standard deviationof �dp and the selection of the range averaging interval(Bringi and Chandrasekar 2001). Several approachesfor Kdp estimations have been reported over the lastyears (e.g., Hubbert et al. 1993; Hubbert and Bringi1995; Ryzhkov and Zrnic 1996). In this study, two ap-proaches are chosen for estimating Kdp, the smoothingof the �dp range profiles (i.e., moving average) and aregression-based estimation.
First, noisy measurements from nonmeteorologicalechoes were removed by eliminating pixels where thestandard deviation of �dp within 10 consecutive rangegates was �10° (modified from Ryzhkov and Zrnic1998b). In this analysis, three Kdp estimations weretested: 1) smoothing of the �dp range profiles by a mov-ing average technique and calculating Kdp based oncentered differences; 2) as in estimation 1, but Kdp isderived by calculating the regression within the rangeaveraging interval; and 3) the regression-based estima-tion of Kdp following Bringi and Chandrasekar (2001).Ryzhkov and Zrnic (1996) reveal that at low rain ratesthe standard deviation of Kdp depends strongly on theradial resolution of Kdp estimates. They suggest using a
heavy filtering (in their case 7–11 km) below a specificradar reflectivity threshold (in their case 40 dBZ) and alight filter (in their case 2–4 km) above this threshold.Their analysis of 15 storms revealed a standard devia-tion of Kdp of 0.12°–0.3° km�1 for light filtering and0.04°–0.10° km�1 for heavy filtering. With an error ofonly 0.1° km�1, Kdp has to be at least 1° km�1 corre-sponding to a rainfall rate of �22 mm h�1 for the stan-dard error in rainfall rate for S-band radar to be lessthan 10%. Two range averaging intervals were chosenaccording to the reflectivity value (Ryzhkov and Zrnic1996). Generally, the �dp range profiles are averagedover an interval of 5.8 km (24 consecutive gates). Sincelarge averaging intervals led to an underestimation ofKdp for local reflectivity maxima, the averaging intervalwas reduced to 2 km (8 pixels) when the reflectivityexceeded 40 dBZ.
A technique for radar calibration, developed byGoddard et al. (1994) for a 3-GHz radar, is used toestimate Kdp from Zh and Zdr. It uses a drop size shapemodel that is based upon empirical adjustments to lin-ear shapes for drops �1.1 mm so that the technique isless sensitive to drop size distribution. A fourth-orderpolynomial is then fit to the model to ensure a compu-tationally fast application as follows:
Kdp 2 10�5��0.4252Zdr4 � 3.4683Zdr
3 � 9.8064Zdr2 � 10.083Zdr � 1.2135�Zh. (A1)
To reduce the effects of hydrometeor attenuation on Zh
and Zdr, a linear �dp-based method is applied to correctattenuation effects (Bringi et al. 1990) as
Zh�r� Z��r�h � � ��dp�r� � �dp�0�� �A2�
Zdr�r� Z�dr�r� � � ��dp�r� � �dp�0�� , �A3�
where Z�h(r), Z�dr(r) is the observed reflectivity and dif-ferential reflectivity at range r, Zh and Zdr are the at-tenuation-corrected values, and �dp(0) is the system �dp
value. The coefficient � is set to 0.07, and � is 0.02,which represents the mean correction coefficients for Cband as derived from several case studies (Carey et al.2000).
REFERENCES
Andrieu, H., J. D. Creutin, G. Delrieu, and D. Faure, 1997: Use ofweather radar for the hydrology of a mountainous area. PartI: Radar measurement interpretation. J. Hydrol., 193, 1–25.
Andsager, K., K. V. Beard, and N. F. Laird, 1999: Laboratorymeasurements of axis ratios for large raindrops. J. Atmos.Sci., 56, 2673–2683.
Aydin, K., T. A. Seliga, and V. Balaji, 1986: Remote sensing of
hail with a dual-linear polarization radar. J. Climate Appl.Meteor., 25, 1475–1484.
——, H. Direskeneli, and T. A. Seliga, 1987: Dual-polarizationradar estimation of rainfall parameters compared withground-based disdrometer measurements: October 29, 1982Central Illinois experiment. IEEE Trans. Geosci. RemoteSens., GE-25, 834–844.
——, V. N. Bringi, and L. Liu, 1995: Rain-rate estimation in thepresence of hail using S-band specific differential phase andother radar parameters. J. Appl. Meteor., 34, 404–410.
Blackman, M., and A. J. Illingworth, 1993: Differential phasemeasurement of precipitation. Preprints, 26th Conf. on RadarMeteorology, Norman, OK, Amer. Meteor. Soc., 745–747.
Brandes, E. A., J. Vivekanandan, and J. W. Wilson, 1997: Radarrainfall estimates of the Buffalo Creek flash flood usingWRS-88D and polarimetric radar data. Preprints, 28th Conf.on Radar Meteorology, Austin, TX, Amer. Meteor. Soc., 123–124.
Bringi, V. N., and A. Hendry, 1990: Technology of polarizationdiversity radar for meteorology. Radar in Meteorology: Bat-tan Memorial and 40th Anniversary Radar Meteorology Con-ference, D. Atlas, Ed., Amer. Meteor. Soc., 153–190.
——, and V. Chandrasekar, 2001: Polarimetric Doppler WeatherRadar: Principles and Applications. Cambridge UniversityPress, 636 pp.
——, T. A. Seliga, and K. Aydin, 1984: Hail detection with adifferential reflectivity radar. Science, 225, 1145–1147.
NOVEMBER 2007 F R I E D R I C H E T A L . 1857

——, V. Chandrasekar, N. Balakrishnan, and D. S. Zrnic, 1990:An examination of propagation effects in rainfall on radarmeasurements at microwave frequencies. J. Atmos. OceanicTechnol., 7, 829–840.
Carey, L. D., S. A. Rutledge, D. A. Ahijevych, and T. D. Keenan,2000: Correcting propagation effects in C-band polarimetricradar observations of tropical convection using differentialpropagation phase. J. Appl. Meteor., 39, 1405–1433.
Chandrasekar, V., V. N. Bringi, N. Balakrishnan, and D. S. Zrnic,1990: Error structure of multiparameter radar and surfacemeasurements of rainfall. Part III: Specific differential phase.J. Atmos. Oceanic Technol., 7, 621–629.
Creutin, J. D., H. Andrieu, and D. Faure, 1997: Use of weatherradar for the hydrology of a mountainous area. Part II: Radarmeasurement validation. J. Hydrol., 193, 26–44.
Delrieu, G., J. Creutin, and H. Andrieu, 1995: Simulation of radarmountain returns using a digitized terrain model. J. Atmos.Oceanic Technol., 12, 1038–1049.
Doviak, R. J., and D. S. Zrnic, 1993: Doppler Radar and WeatherObservations. Academic Press, 562 pp.
Gabella, M., and G. Perona, 1998: Simulation of the orographicinfluence on weather radar using a geometric–optics ap-proach. J. Atmos. Oceanic Technol., 15, 1485–1494.
Germann, U., and J. Joss, 2003: Operational measurement of pre-cipitation in mountainous terrain. Weather Radar: Principlesand Advanced Applications, P. Meischner, Ed., Springer-Verlag, 52–77.
——, G. Galli, M. Boscacci, and M. Bolliger, 2006: Radar precipi-tation measurement in a mountainous region. Quart. J. Roy.Meteor. Soc., 132, 1669–1692.
Giangrande, S. E., and A. V. Ryzhkov, 2005: Calibration of dual-polarization radar in the presence of partial beam blockage.J. Atmos. Oceanic Technol., 22, 1156–1166.
Goddard, J. W. F., J. Tan, and M. Thurai, 1994: Technique forcalibration of meteorological radars using differential phase.Electron. Lett., 30, 166–167.
Gorgucci, E., G. Scarchilli, and V. Chandrasekar, 1994: A robustestimator of rainfall rate using differential reflectivity. J. At-mos. Oceanic Technol., 11, 586–592.
——, V. Chandrasekar, and G. Scarchilli, 1995: Radar and surfacemeasurement of rainfall during CaPE: 26 July case study. J.Appl. Meteor., 34, 1570–1577.
——, G. Scarchilli, and V. Chandrasekar, 1996: Operational moni-toring of rainfall over the Arno River basin using dual-polarized radar and rain gauges. J. Appl. Meteor., 35, 1221–1230.
——, ——, and ——, 1999: Specific differential phase estimationin the presence of nonuniform rainfall medium along thepath. J. Atmos. Oceanic Technol., 16, 1690–1697.
Gourley, J. J., and B. E. Vieux, 2005: A method for evaluating theaccuracy of quantitative precipitation estimates from a hy-drologic modeling perspective. J. Hydrometeor., 6, 115–133.
——, P. Tabary, and J. Parent du Châtelet, 2006a: Data quality ofthe Meteo-France C-band polarimetric radar. J. Atmos. Oce-anic Technol., 23, 1340–1356.
——, ——, and ——, 2006b: A fuzzy logic algorithm for the sepa-ration of precipitating from nonprecipitating echoes using po-larimetric radar observations. J. Atmos. Oceanic Technol., 24,1439–1451.
Hagen, M., 2001: On the variation of the parameterization ofrainfall rate estimation by dual polarization techniques. Pre-
prints, 30th Conf. on Radar Meteorology, Munich, Germany,Amer. Meteor., Soc., 644–645.
Hubbert, J., and V. N. Bringi, 1995: An iterative filtering tech-nique for the analysis of copolar differential phase and dual-frequency radar measurements. J. Atmos. Oceanic Technol.,12, 643–648.
——, V. Chandrasekar, V. N. Bringi, and P. Meischner, 1993: Pro-cessing and interpretation of coherent dual-polarized radarmeasurements. J. Atmos. Oceanic Technol., 10, 155–164.
Illingworth, A. J., 2003: Improved precipitation rates and dataquality by using polarimetric measurements. Weather Radar:Principles and Advanced Applications, P. Meischner, Ed.,Springer-Verlag, 130–166.
Joss, J., and A. Waldvogel, 1990: Precipitation measurement andhydrology. Radar in Meteorology: Battan Memorial and 40thAnniversary Radar Meteorology Conference, D. Atlas, Ed.,Amer. Meteor. Soc., 577–579.
——, and R. Lee, 1995: The application of radar–gauge compari-sons to operational precipitation profile corrections. J. Appl.Meteor., 34, 2612–2630.
Keenan, T. D., 2003: Hydrometeor classification with a C-bandpolarimetric radar. Aust. Meteor. Mag., 52, 23–31.
——, D. Zrnic, L. Carey, P. May, and S. Rutledge, 1997: Sensi-tivity of C-band polarimetric variables to propagation andbackscatter effects in rain. Preprints, 28th Conf. on RadarMeteorology, Austin, TX, Amer. Meteor. Soc., 13–14.
——, K. Glasson, F. Cummings, T. S. Bird, R. J. Keeler, and J.Lutz, 1998: The BMRC/NCAR C-band polarimetric (C-POL) radar system. J. Atmos. Oceanic Technol., 15, 871–886.
Kessinger, C., S. Ellis, J. van Andel, and J. Yee, 2003: The PAclutter mitigation scheme for the WSR-88D. Preprints, 31stConf. on Radar Meteorology, Seattle, WA, Amer. Meteor.Soc., 526–529.
Maddox, R. A., J. Zhang, J. J. Gourley, and K. W. Howard, 2002:Weather radar coverage over the contiguous United States.Wea. Forecasting, 17, 927–934.
May, P. T., T. D. Keenan, D. S. Zrnic, L. D. Carey, and S. A. Rut-ledge, 1999: Polarimetric radar measurements of tropical rainat a 5-cm wavelength. J. Appl. Meteor., 38, 750–765.
Parent du Châtelet, J., P. Tabary, and M. Guimera, 2005: ThePANTHERE Project and the evolution of the French opera-tional radar network and products: Rain-estimation, Dopplerwinds, and dual-polarization. Preprints, 32d Conf. on RadarMeteorology, Albuquerque, NM, Amer. Meteor. Soc., 14R.6.
Pellarin, T., G. Delrieu, G.-M. Saulnier, H. Andrieu, B. Vignal,and J.-D. Creutin, 2002: Hydrologic visibility of weather ra-dar systems operating in mountainous regions: Case study forthe Ardèche catchment (France). J. Hydrometeor., 3, 539–555.
Petersen, W. A., and Coauthors, 1999: Mesoscale radar observa-tions of the Fort Collins flash flood of 28 July 1997. Bull.Amer. Meteor. Soc., 80, 191–216.
Pruppacher, H. R., and K. V. Beard, 1970: A wind tunnel inves-tigation of the internal circulation and shape of water dropsfalling at terminal velocity in air. Quart. J. Roy. Meteor. Soc.,96, 247–256.
Ryzhkov, A. V., and D. S. Zrnic, 1995: Comparison of dual-polarization radar estimators of rain. J. Atmos. Oceanic Tech-nol., 12, 249–256.
——, and ——, 1996: Assessment of rainfall measurement thatuses specific differential phase. J. Appl. Meteor., 35, 2080–2090.
1858 J O U R N A L O F A T M O S P H E R I C A N D O C E A N I C T E C H N O L O G Y VOLUME 24

——, and ——, 1998a: Beamwidth effects on the differential phasemeasurements of rain. J. Atmos. Oceanic Technol., 15, 624–634.
——, and ——, 1998b: Polarimetric rainfall estimation in the pres-ence of anomalous propagation. J. Atmos. Oceanic Technol.,15, 1320–1330.
Seliga, T. A., and V. N. Bringi, 1976: Potential use of radar dif-ferential reflectivity measurements at orthogonal polariza-tions for measuring precipitation. J. Appl. Meteor., 15, 69–76.
——, ——, and H. H. Al-Khatib, 1981: A preliminary study ofcomparative measurements of rainfall rate using the differ-ential reflectivity radar techniques and a raingage network. J.Appl. Meteor., 20, 1362–1368.
Szalinska, W., P. Tabary, and H. Andrieu, 2005: Conditionalevaluation of convectional versus polarimetric QPE at C-band. Preprints, 32d Conf. on Radar Meteorology, Albuquer-que, NM, Amer. Meteor. Soc., P6R.12.
Tabary, P., 2007: The new French operational radar rainfall prod-uct. Part I: Methodology. Wea. Forecasting, 22, 393–408.
Testud, J., 2003: Precipitation measurements from space. WeatherRadar: Principles and Advanced Applications, P. Meischner,Ed., Springer-Verlag, 199–234.
——, E. Le Bouar, E. Obligis, and M. Ali-Mehenni, 2000: The rainprofiling algorithm applied to polarimetric weather radardata. J. Atmos. Oceanic Technol., 17, 322–356.
Vivekanandan, J., D. N. Yates, and E. A. Brandes, 1999: The in-fluence of terrain on rainfall estimation from radar reflectiv-ity and specific propagation phase observations. J. Atmos.Oceanic Technol., 16, 837–845.
Young, C. B., B. R. Nelson, A. A. Bradley, J. A. Smith, C. D. Pe-ters-Lidard, A. Kruger, and M. L. Baeck, 1999: An evaluationof NEXRAD precipitation estimates in complex terrain. J.Geophys. Res., 104, 19 691–19 703.
Zrnic, D. S., and A. V. Ryzhkov, 1996: Advantages of rain mea-surements using specific differential phase. J. Atmos. OceanicTechnol., 13, 454–464.
——, and ——, 1999: Polarimetry for weather surveillance radars.Bull. Amer. Meteor. Soc., 80, 389–406.
NOVEMBER 2007 F R I E D R I C H E T A L . 1859