effects of population density and land …cdn.intechopen.com/pdfs/40507/intech-effects_of...effects...
TRANSCRIPT
Chapter 14
© 2012 Elsayed, licensee InTech. This is an open access chapter distributed under the terms of the Creative Commons Attribution License (http://creativecommons.org/licenses/by/3.0), which permits unrestricted use, distribution, and reproduction in any medium, provided the original work is properly cited.
Effects of Population Density and Land Management on the Intensity of Urban Heat Islands: A Case Study on the City of Kuala Lumpur, Malaysia
Ilham S. M. Elsayed
Additional information is available at the end of the chapter
http://dx.doi.org/10.5772/47943
1. Introduction
The increased size of urban areas in terms of their population and their land consumption has intensified adverse urban environmental impacts. The increased capacity of the human race provokes adverse environmental change on a truly global scale. In the last two decades all over the globe rapid changes in technology and in the re-location of population from rural to urban areas have altered local natural environments beyond recognition, now the global environment is at risk. Most people would argue that changes in the location and concentration of commercial activities, especially in large cities, have produced the greatest visual impact on the built environment (Tamagno et al., 1990). In many developing countries, towns are expanding and an increasing proportion of the land is being taken up for urban land uses, replacing fields, farms, forests and open spaces. As a result, distinctive and often unpleasant climatic conditions are experienced by the majority of urban inhabitants in the world today (Shaharuddin, 1997). Urban settlements provide one of the best examples of change in human activities and perceptions. Residential areas are constantly undergoing modification and expansion into areas that were formally occupied by agriculture and the natural environment. Residential lands were reclaimed or will be reclaimed from the sea or swampland if the demand for land is sufficiently high. By 1950, approximately 30% of the world’s population lived in urban areas. That number is now nearing 50%, with a current urban population estimated at 2.9 billion people. By the year 2030, the global population is predicted to rise by two billion (Streutker, 2003), a growth

Application of Geographic Information Systems 268
expected to occur almost entirely in urban areas. The increased capacity of the human race provokes adverse environmental change on a truly global scale, something to which urban populations make a major contribution. Atmospheric modifications through urbanization have been noted. Climatically (Sham, 1987), one obvious consequence of urbanization is the creation of the heat island. (Streutker, 2003) focused on one of the primary effects of urbanization on weather and climate, the urban heat island; he found that the urban temperature depends on population density.
Several factors result in temperature difference between the urban and rural areas, stemming from changes in the thermal properties of surface materials to alterations of the topography and man activities in cities. Large urbanized regions have been shown to physically alter their climates in the form of elevated temperatures relative to rural areas at their periphery (Brain, 2001). The effect of metropolitan regions is not only confined to horizontal temperatures but also to those in the vertical direction with far-reaching consequences, studies have shown that the thermal influence of a large city commonly extends up to 200-300 m and even to 500 m and more (Sham, 1993).
The study aims to study the level of urbanization in terms of population density and land management and its effect on the intensity of the urban heat island of the city of Kuala Lumpur.
The measurements for level of urbanization vary from country to another. Usually, national procedures followed for such measurements based on specific criteria that may include any/ some/ all of the following:
a. The concentration or size of populations. b. The process in which the in-migration of people to cities blends into an urban lifestyle. c. The process in which urban culture spreads to agricultural villages. d. The predominant type of economic activity. e. The development of urban areas and their urban characteristics such as specific services
and facilities. f. The process in which the proportion of people living in an urban area increases.
Of these definitions, the last one is the most quantitative. Therefore, for the purposes and limitations of this study, the last definition is used to defining and measuring the level of urbanization. Thus, the level of urbanization depends solely on density of population per acres and land use for the city.
2. Methodology
The data related to the population density and land management of the city of Kuala Lumpur was gathered from Malaysian Governmental sources, specifically, from the City Hall of Kuala Lumpur. On the other hand, two major sources of data are used to study the UHI of the city.

Effects of Population Density and Land Management on the Intensity of Urban Heat Islands: A Case Study on the City of Kuala Lumpur, Malaysia 269
2.1. Population density
The 1970 and 1980 censuses in Malaysia classified urban areas into three categories: "metropolitan," with a population in excess of 75,000; "large town," with a population size of 10,000 and over; and "small town," with a population size of 1,000 to 9,999 persons. "Small towns," however, are excluded from the consideration of urbanization levels. Based on this definition, Malaysia has 14 metropolitan areas and 53 towns with a population of 10,000 to 75,000. Kuala Lumpur city is the capital city of Malaysia with a population of 1504300 persons. It is recognized as the greatest metropolitan area within the country (Elsayed, 2006). Table 1. and Fig. 1. below illustrate the changes in the population densities for Kuala Lumpur City and its City Centre in 1980, 2000 and 2004 respectively.
Year Population Area in sq km Population density
KL City centre KL City centre KL City centre
1980 156980 93800 234 18.13 670 5174
2000 1423900 128720 234 18.13 6085 7100
2004 1504300 121655 234 18.13 6429 6710
Table 1. Changes in the population densities for KL and City centre in1980, 2000 & 2004
Figure 1. Changes in population densities for KL and City centre in 1980, 2000 & 2004
2.2. Land management
There is a tremendous change in the land use of the city of Kuala Lumpur since 1980 to 2004. Map1. and Map 2 below depict the land use of KL city in 1980 and 2004 respectively.
0
1000
2000
3000
4000
5000
6000
7000
8000
1980 2000 2004
Years
pers
on/s
q km
Kuala Lumpur city
City Center of the City

Application of Geographic Information Systems 270
Map 1. Land use for the city of Kuala Lumpur 1980

Effects of Population Density and Land Management on the Intensity of Urban Heat Islands: A Case Study on the City of Kuala Lumpur, Malaysia 271
Map 2. Land use for the city of Kuala Lumpur 2004
2.3. Urban heat island
Secondary and Primary sources of data are used to study the UHI of the city. The Secondary data is collected from the relatively longer records of meteorological data provided by specific weather station networks, while the Primary data is collected through an intensive fieldwork done with the collaboration of number of assistants and field observers. These two methods were combined and used to study and measure the urban heat island of the city:

Application of Geographic Information Systems 272
2.3.1. Measuring the urban heat island through weather station networks
Two weather station networks cover the City of Kuala Lumpur and its periphery; Governmental weather station network and private one. According to the case study, a specific number of stations are selected to be involved in the study. Concerning the first weather station network, which is under Malaysian Ministry of Science and Environment and called the Malaysian Meteorological Services (MMS), the stations selected to be used are: Kuala Lumpur International Airport (KLIA), Petaling Jaya, Subang, Sungai Besi, and University Malaya. While for the private weather station network, the stations selected are: Combak, Shah Alam, Cheras, Contry Height, Klang, Nilai, and Petaling Jaya.
2.3.2. Measuring the urban heat island through traverses surveys
This method is used in a specific confined area within the study area for this research. It was used for the city center of Kuala Lumpur city and four major Gardens within Kuala Lumpur and its periphery, and that because of the lake of weather station in those areas. Moreover, within the city center of the city no weather station is located. The area was confined not only because of lack of data in that areas, it is moreover because of equipments and financial constraints that faced the researcher during that period.
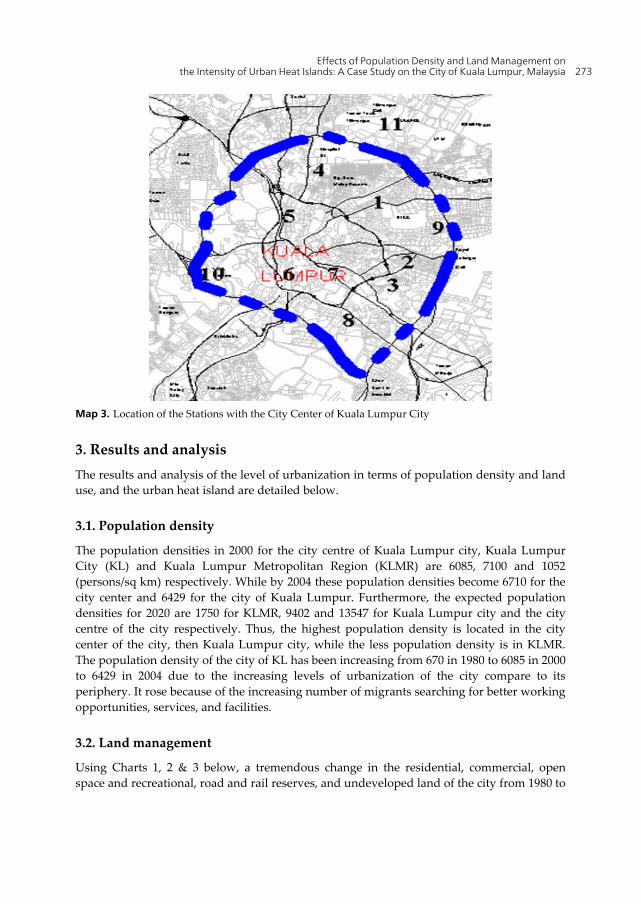
Because of the difficulty of making simultaneous measurements, a number of eighteen observers took measurements and readings. They are senior undergraduate students from College of Architecture and Environmental Design and College of Engineering, International Islamic University Malaysia. With the help of these observers, an intensive traverse surveys were carried out for measuring the air temperature, relative humidity and air velocity during one week period in December 2004, starting in 20th of the month and end by 26th for one-hour duration per day from 21:00-22:00 Local Malaysian Time (LMT). The study area is divided into several sectors. Each sector is assigned to one or two observers according to the area and complexity of the sector. The total number of sectors is 12. (Table 2. and Map 3. below).
No. Name of the station No of observers1- KLCC Two2- Bukit Bentang One3- Time Square One4- Chow kit One5- Sogo One6- Central Market One7- Puduraya One8- Hang Tuah Two9- KLCC Park Two10- Main Lake Garden Two11- Titiwangsa Lake Garden Two12- National Zoo Two
Table 2. Stations used for Traverses Surveys Method
Effects of Population Density and Land Management on the Intensity of Urban Heat Islands: A Case Study on the City of Kuala Lumpur, Malaysia 273
Map 3. Location of the Stations with the City Center of Kuala Lumpur City
3. Results and analysis The results and analysis of the level of urbanization in terms of population density and land use, and the urban heat island are detailed below.
3.1. Population density
The population densities in 2000 for the city centre of Kuala Lumpur city, Kuala Lumpur City (KL) and Kuala Lumpur Metropolitan Region (KLMR) are 6085, 7100 and 1052 (persons/sq km) respectively. While by 2004 these population densities become 6710 for the city center and 6429 for the city of Kuala Lumpur. Furthermore, the expected population densities for 2020 are 1750 for KLMR, 9402 and 13547 for Kuala Lumpur city and the city centre of the city respectively. Thus, the highest population density is located in the city center of the city, then Kuala Lumpur city, while the less population density is in KLMR. The population density of the city of KL has been increasing from 670 in 1980 to 6085 in 2000 to 6429 in 2004 due to the increasing levels of urbanization of the city compare to its periphery. It rose because of the increasing number of migrants searching for better working opportunities, services, and facilities.
3.2. Land management
Using Charts 1, 2 & 3 below, a tremendous change in the residential, commercial, open space and recreational, road and rail reserves, and undeveloped land of the city from 1980 to

Application of Geographic Information Systems 274
2004 is recognized. The residential and undeveloped land use of the whole city both decreased from 25.7% to 22.66% and from 27.7% to 23.7% respectively. Under the undeveloped land use the agricultural/ fishery/ forest land use is categorized. There is a recognized decrease in the agricultural/ fishery/ forest land use. By 2004 it occupied only 0.07% (16.13 acres) of the total area of the city. Conversely, the commercial, open space and recreational, and road and rail reserves land increased from 2.1% to 4.51%, 1.3% to 6.52%, and from 14.0% to 23.42% correspondingly. Almost there is no change in the industrial, institutional, cemetery, and educational land use of the whole city. The industrial and institutional lands decreased from 2.3% to 2.28% and from 7.2% to 6.69% respectively. While the cemetery, and educational lands increased from 3.3% to 3.98% and from 1.1% to 1.13 %respectively.
The changes in the land use of the city center are almost following the same manner of the city of Kuala Lumpur. The commercial, road and rail reserves land increased from 254.88 to 318.99 hectares and from 498.69 to 566.68 hectares respectively. While the residential, industrial, and institutional land use reduced from 390.58 to 287.6 hectares, from 4.12 to 0.93 hectares, and from 266.04 to 163.06 hectares correspondingly. In converse to the city increase in the open space and recreational land use, the city centre open space and recreational land use decreased from 179.28 to 170.25 hectares. While the undeveloped land use of the city center increased from 0.0 to 137.89 hectares.
Chart 1. Land use in percentage for city of Kuala Lumpur in 1980
0
5
10
15
20
25
30
Comm
ercia
l
Reside
ntial
Indu
strial
Educa
tiona
l
Institu
tiona
l & G
over
nmen
tal r
eser
ves
Cemet
eries
Ope
n sp
ace
Malay
rese
rvat
ion la
nds
Agricu
ltura
l & u
ndev
elop
ed la
nd
Mining
Major
road

Effects of Population Density and Land Management on the Intensity of Urban Heat Islands: A Case Study on the City of Kuala Lumpur, Malaysia 275
Chart 2. Land use in percentage for city of Kuala Lumpur in 2004
Chart 3. Land use in Hectares for the city center of Kuala Lumpur in 1984 & 2004
0
5
10
15
20
25
Comm
ercia
l
Reside
ntial
Indu
strial
Educa
tiona
l
Institu
tiona
l
Cemet
eries
Ope
n sp
ace
& recr
eatio
nal
Undev
elop
ed la
nd
Agricu
ltura
l/ fis
hery
/ for
est
Term
inal
Road
& rail r
eser
ves
Utility
Squat
ters
Religions
Public
facil
ities
0
100
200
300
400
500
600
CommercialResidentialIndusterialInstitutionalOpen SpaceCommunityUndevelopedSquattersOthers
Land use 1984
Land use 2004
Application of Geographic Information Systems 276
3.3. The urban heat island
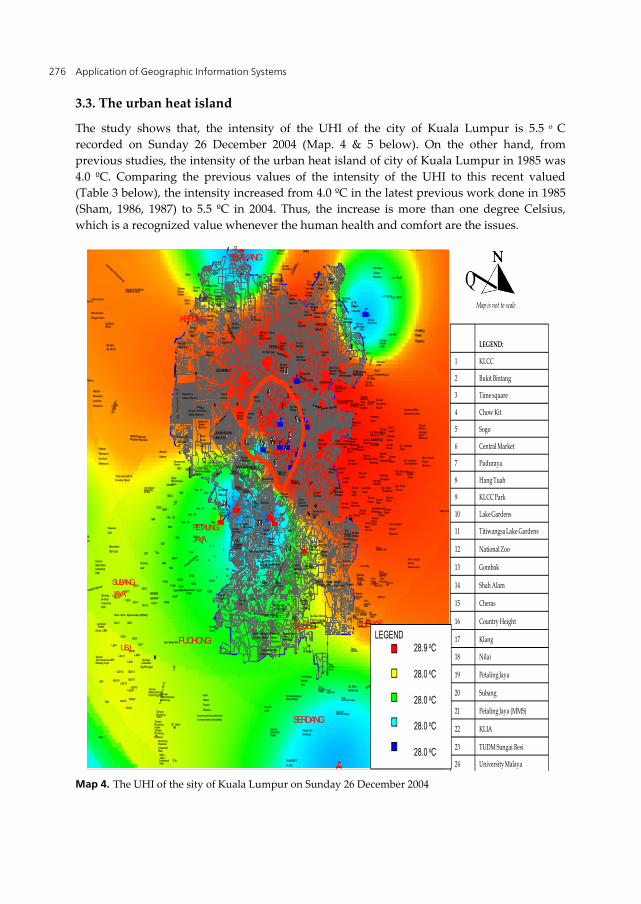
The study shows that, the intensity of the UHI of the city of Kuala Lumpur is 5.5 o C recorded on Sunday 26 December 2004 (Map. 4 & 5 below). On the other hand, from previous studies, the intensity of the urban heat island of city of Kuala Lumpur in 1985 was 4.0 ºC. Comparing the previous values of the intensity of the UHI to this recent valued (Table 3 below), the intensity increased from 4.0 ºC in the latest previous work done in 1985 (Sham, 1986, 1987) to 5.5 ºC in 2004. Thus, the increase is more than one degree Celsius, which is a recognized value whenever the human health and comfort are the issues.
Rubber
Research
Country Resort
Institute
Malaysia
Tropicana Golf &
Bandar Baru
CoursePutra Utama
Sungai Buloh
Research
Permai
Rubber
Institute
Malaysia
Kg Baru Sg. Buloh
Indu
stri
Tama
n Sg
. Bul
oh
Hospital Sg Buloh(Medical City)
North-South Expressway
Sg Buloh Camp
Subang Jaya
(Sime UEP)
LengkapTeratai
Taman Perindustrian UEP
GolfDI ya
Saujana
Glenmarie
Golf Club
JAYASubang Hi-Tech Industrial Park
Federal Highway
Park
Hicom Glenmarie Industrial
SUBANG
S28
S27
S26
SS15
Golf
Subang
SS12
SS19
SS17
SS14SS18
SS 13
Sec. 22
SS24SS26
SS4
SS3
Tmn Bukit Mayang Emas
SS3
PJS6
PJS7
PJS8
PJS9PJS11
BANDAR
SUNWAY
New Pantai Expressway
Bandar
SS21
Damansara Utama
Utama
SS8
51A
SS9A
SS9
SS7
51
Feder
al High
way
LDP
HEIGHTSEquestrian
Bukit Kiara
Club
Taman Tun
Dr. Ismail
SPRINT Extension Proposed Alignment
SS23SS2
SS22A
SS22Damansara Jaya
LDP
S51ASS1
Sec. 14
Sec. 19
Sec. 13
Sec. 20
8
PETALING
JAYA
PJS2
PJS2
PJS3
PJS5
PJS4
PJS5
PJS3
SS20
KL Golf & Country Club
Kelab Golf Perkhidmatan Awam
DAMANSARA
Botanical Garden Reserve
Sri H
artama
s
7
Sec. 11
6
Sg
. P
en
ch
ala
M
.R
Negara Reserve Duta
INTAN
SPRIN
T
SPRINT
Malaya
Sec. 12University Malaya Medical Centre
Universiti
18
34
1
1A
PJS1
Gre
en
Be
lt
5
DBKL'sLand
(Proposedhousing
in future)
SP
RIN
T
Bukit Bandaraya
BANGSAR
TNB Mid
Lucky Garden
Bukit Pantai
Taman Sa
Taman Bandaraya
Taman Bangsar
Bangsar Baru
RTM
Valley City
Seputeh
Entrepreneurs
New Pantai Expressway
Kuchai
Park
Tmn Kuchai Jaya
Happy
Taman PuchongPerdana
Puchong
Puchong (S5)
Taman Perindustrian
Taman Perindustrian
Tm
n S
ri P
uc
hon
g
Taman PuchongIntan
Industrial
B d
Maju Jaya
Park
LDP
(some portions believed to have been alienated) SERDANG
Indah
Bandar
KEPONG
Manjalara
LD
P
Malay Reserve
Sungai Penchala Malay Reserve
Segambut
SEGAMBUT
Mont Kiara
SPRINT
SELAYANG
MRR 2
Istana Taman
Bukit Tunku
KL North East
Bandar Baru Sentul
SENTUL
Expressway
Industri Bolton
USJ11
USJ
USJ12
USJ4
USJ5
USJ3
Shah Alam Expressway (KESAS)
USJ23USJ22
USJ19
USJ24
USJ20
USJ17USJ16 USJ18
(Sg.Penaga)
USJ9
USJ13
USJ8USJ10
SubangIndustrial
USJ7
USJ6
USJ2
(ex-mining land)PUCHONG
LD
P
IndahSP Setia
SB
Taman Puchong
Hitam
Ayer
Forest
Reserve
Kinrara Camp
Yarl
OUGTaman
Shah Alam Expressway (KESAS)
Tmn Sri Sentosa
Malaysia
Bukit Jalil Golf & Country Resort
Technology Park
Garden
Malaysia
Technology National Sports Complex
Park
Selatan
Sri PetalingBandar Baru
SG.BESI
KL
-KLI
A D
ed
icat
ed
Hig
hw
ay
Salak
EPF land
Bandar Tasik Selatan
Sri Kembangan New Village
SILK HighwayTmn Sg Besi Tmn
Harmoni
Tmn Taming Jaya
C
Jaya
Desa Baiduri
Tmn Juara
Toll PlazaTaman Sri Serdang
Saujana Impian
Tmn Suria JayaTmn Bkt
Maktab Latihan Polis
Phoenix
Angsana
Sri CHERASTmn
Bahagia
Tmn Cheras Mas
Sri Cheras
Tmn Cheras Mewah
Cheras
Jaya
Tmn Sri
Tmn Tun Perak
Kuyow M.R
Taman Universiti Indah
Industri Selesa Jaya
Cheras Prima
Industrial
Puchong Perdana
Park
UNIVERSITI
PUTRA
Desa
Taman Ehsan Usaha
FRIM
Jaya
MaluriBukit Taman
Kepong Baru 1
Kepong Baru 2
Kepong Baru 3
ParkTaman Daya
Metropolitan
Sri Edaran Light Ind Park Complex
Jinjang Utara
Police Land
Prop.FRU
Jinjang Selatan Seri Segambut
Tambahan
Jinjang Selatan
Military Camp (Batu Kentonmen)
Re
cre
ati
on
ISA (KDN)
Tmn. Bt. Permai
Sri Utara
Koperasi Taman
Polis
Taman Samudra
MuslimCemetery
RamleeTaman Dato' Senu
Tmn. P.
Reserve
Gombak Malay
Tama
n Gr
eenw
ood
Hospital KL
Taman Tasik Titiwangsa
PerwiraTmn
PerwiraTamanTmn Setia
MRR 2
UTM
Titiwangsa Golf
Setapak Jaya
Kg Baru Air Panas
KEMENTAHPULAPOL
Indah
IbukotaTmn.
Tmn. Setapak
Wardieburn Camp
Wangsa MelawatiTmn.
Setapak WANGSA MAJU
Desa
TamanMelati
Melawati
SetiaGombak
TAR College
Keramat
Taman Setiawangsa
AU1Taman
Permai
Desa Tun Hussein Onn (Army)
Kg Klang
Military Taman
Melawati
Gates
PermataAU5
Taman
KLSC
AU2
Taman Dataran
Taman Hillview
AU3
Taman PKNS Housing(Flats &Apartments)
Sri Ukay
Sec. 16Sec. 17
AngkasaPantai Hill Park
IWK
Bukit
KUALA
National Palace
Bukit Aman
Tasik Perdana LUMPUR
Brickfields
Danau
JKRTaman Desa
Taman
Desa
TUDM
Sow Lin Industrial
Cemetery
ChineseCemetery
Chinese
Chan
Kg. Baru Malay Reserve
Ampang-KL Elevated Highway
Golf
Royal Selangor
KLCC
EmasTaman Ikan
HospitalUKM
Miharja
JKR
Taman Maluri
Shamelin Lembah Maju
Taman Maju Taman To
wn Pa
rkTaman
Perkasa
Taman Tmn Rakyat
BandarSalak Selatan Baru
Tun Razak
The Mines
Sg. Besi Military Training Camp & Rifle Range Reserve
Resort City
Turf Club
PermaisuriTaman Midah
Taman Tasik
Taman Connaught
Desa Tun Razak Industrial Park
Taman Cempaka
Kg. Pandan Dalam
Kg. Baru Balakong
LOT 7642
PDRM
Markas Briged Tengah PGA
Taman
Cheras Perdana
Cheras Jaya
Wangsa
MudunAlam Tmn
Tmn
Jaya
Tmn
Tmn Cheras
BATU 9
Cuepacs
Jiwa Mewah SB
Hill
Ch
eras
Kaja
ng H
ighw
ay
BATU11
Venice
Bandar Baru Ampang
Taman Sri Watan
Hulu Langat
Forest
Reserve
Kg. Lembah Jaya
Taman Rakan
Reservation
Hulu Langat Malay
Taman Angsana Hilir
Taman Putra Sulaiman
Desa Pandan
Kg Kuala Ampang
Taman Keramat Tambahan
Taman Cheras
Cheras Utama
Cheras Jaya
Taman Segar
Pandan
Pandan
Cheras Indah
Indah
Jaya
Baru
Pandan Perdana
Taman Kencana
Kg. Cheras
Taman Mawar
Jaya
Ampang Point
Ampang Jaya
Ampang
Nirwana
Taman CahayaKg. Baru
AMPANG
Kg. Melayu
Taman Dagang
Taman
Ampang
AMPANG TOWN
UkayTun Abdul Ukay
Heights
Taman
Razak
Taman Hijau
Taman Putra
Taman Seraya
Taman Muda
Permai
Teratai
Taman Bukit
Taman Mega Jaya
MewahPandan
Ampang Campuran
Kg. Tasik Tambahan
Rasmi
Kosas
Ampang Indah
Taman
Bukit Indah
Taman
Jaya
Mulia
Kg. Lembah Jaya Selatan
Taman
Jaya
Ampang Water Catchment Area
Melur
Taman Bukit
Taman
Taman Saga HULU LAN
(Bukit
Taman Rimba Ampang
Belacan)
Hulu LangatForest Reserve
Indah
Kg. Tasik Permai
Kg. Ampang
ReserveMalay
Pandang
Zooview
AU4
Zoo Negara
Taman
MR
R 2
Ukay
Taman Kelab Ukay
Wangsa
Bukit Antarabangsa
Lot 452
Lot 18128
Forest Reserve
Lot 18126
Lot 18125
Forest Ampang
Reserve
KAJANG
Kajang Jail
SILK Hg
Kajang By-Pass
Sg. LongToll Plaza
LEGEND:
1 KLCC
2 Bukit Bintang
3 Time square
4 Chow Kit
5 Sogo
6 Central Market
7 Puduraya
8 Hang Tuah
9 KLCC Park
10 Lake Gardens
11 Titiwangsa Lake Gardens
12 National Zoo
13 Gombak
14 Shah Alam
15 Cheras
16 Country Height
17 Klang
18 Nilai
19 Petaling Jaya
20 Subang
21 Petaling Jaya (MMS)
22 KLIA
23 TUDM Sungai Besi
24 University Malaya
QMap is not to scale
195
10
11
6 7
8
32
4
12
24
23
14
LEGEND 28.9 oC
28.0 oC
28.0 oC
28.0 oC
28.0 oC
Map 4. The UHI of the sity of Kuala Lumpur on Sunday 26 December 2004
Effects of Population Density and Land Management on the Intensity of Urban Heat Islands: A Case Study on the City of Kuala Lumpur, Malaysia 277
LEGEND:
1 KLCC
2 Bukit Bintang
3 Time square
4 Chow Kit
5 Sogo
6 Central Market
7 Puduraya
8 Hang Tuah
9 KLCC Park
10 Lake Gardens
11 Titiwangsa Lake Gardens
12 National Zoo
13 Gombak
14 Shah Alam
15 Cheras
16 Country Height
17 Klang
18 Nilai
19 Petaling Jaya
20 Subang
21 Petaling Jaya (MMS)
22 KLIA
23 TUDM Sungai Besi
24 University Malaya
QMap is not to scale
1
95
10
11
6 7
8
3
2
4
LEGEND 28.9 oC
28.0 oC
28.0 oC
28.0 oC
28.0 oC
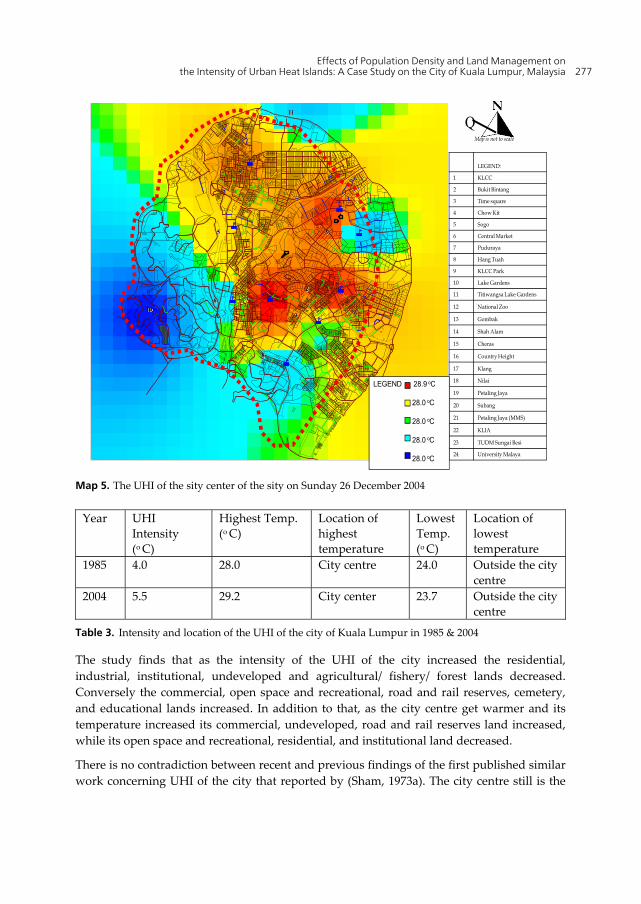
Map 5. The UHI of the sity center of the sity on Sunday 26 December 2004
Year UHI Intensity (o C)
Highest Temp. (o C)
Location of highest temperature
Lowest Temp. (o C)
Location of lowest temperature
1985 4.0 28.0 City centre 24.0 Outside the city centre
2004 5.5 29.2 City center 23.7 Outside the city centre
Table 3. Intensity and location of the UHI of the city of Kuala Lumpur in 1985 & 2004
The study finds that as the intensity of the UHI of the city increased the residential, industrial, institutional, undeveloped and agricultural/ fishery/ forest lands decreased. Conversely the commercial, open space and recreational, road and rail reserves, cemetery, and educational lands increased. In addition to that, as the city centre get warmer and its temperature increased its commercial, undeveloped, road and rail reserves land increased, while its open space and recreational, residential, and institutional land decreased.
There is no contradiction between recent and previous findings of the first published similar work concerning UHI of the city that reported by (Sham, 1973a). The city centre still is the

Application of Geographic Information Systems 278
hottest area of the city of Kuala Lumpur. Such finding is due to continuous human activity and development within the city centre of KL. In the last two decades the city centre of KL experienced rapid changes in concentration of commercial activities and in the re-location of population. The results of the study show that, the records of temperature for most of the stations located within the city center are recorded as the highest temperatures, while the records for the stations located within KL but outside the city centre are that of higher temperatures. On the other hand, the less heat and the high temperatures are register only for the stations located outside KL. Therefore, the higher the level of urbanization in terms of population density, the higher the temperature value recorded. The City center has now been occupied by multi stories and tall buildings. These multi-storied buildings found in the city centers dominate the skyline, and have a dramatic effect on the microclimates of the city centre. Man, through his constant constructions, has affected the exchange of energy and moisture within the system by altering the physical qualities and materials of the earth’s surface with in the city centre. He has continually replaced vegetation and greenery with buildings. Furthermore, he has become a primary source of heat production from his transportation systems, industrial plants, and HVAC systems. Therefore, the city centre is still the hottest area of the city of Kuala Lumpur. On the other hand, the study shows that, all gardens and parks have relative low temperatures regardless of their locations, in or outside KL. Furthermore, the lowest temperature is recorded for a station located within the city centre of the city, which is the Main Lake Garden station. That is because of the age and area of the garden compared to other gardens included in the study. The Main Lake garden is the largest lake park in the city (Hamidah, 1984). This garden dates back to the 1890s with an area of 73 hectares. While Titiwangsa Lake garden is the second lake park in the city with an area of 44.5 hectares. The garden is even different from other gardens in terms of its type and age of plants.
Recent studies (Elsayed, 2006, 2009) show that, although the dependence of the intensity of the urban heat island of the city of KL on population density is significant, the population density at the city centre area is decreasing. It might be of interest to urban planners that, although the temperature is likely to rise with the increase of population density, the situation at the city centre is different. This is due to the intensive human activity and development within the city centre of KL. That indicates that, the management of those lands is highly affecting the intensity of the urban heat island of such land. The city centre experiences rapid changes in concentration of commercial activities and constructions. Man through his constructions has affected the exchange of energy and moisture within the system by altering the physical qualities and materials of the earth’s surface with in the city centre. The city centre has been occupied by multi stories and very tall buildings e.g. Petronas Twin Towers. These multi-storied buildings found in the city centers dominate the skyline, and have a dramatic effect on the microclimates of the city centre. Man replaces vegetation and greenery by buildings and becomes a primary source of heat produce. Therefore, the city centre is still the hottest area of the city of Kuala Lumpur regardless of the reduction happened in its population density. This fact should help in convincing urban planner and design makers in placing more emphasis on the strategies that relates the land management to the mitigation of urban heat island.

Effects of Population Density and Land Management on the Intensity of Urban Heat Islands: A Case Study on the City of Kuala Lumpur, Malaysia 279
4. Conclusion The effects of population density on the intensity of the urban heat island of the city of Kuala Lumpur could be concluded from Table 1, Figure 1 and Table 3 above which illustrate the changes in the population densities for KL and City centre in1980, 2000 & 2004, and the intensity and location of the UHI of the city of Kuala Lumpur in 1985 & 2004 respectively.
The study shows that, the population density of the city is proportional to the records of temperature taken during the survey. The population density of the city of KL has been increasing from 670 in 1980 to 6085 in 2000 to 6429 in 2004. Consequently the intensity of the UHI of the city increased from 4.0oC in 1985 to 5.5oC in 2004. Thus, there is a proportional relationship between the population density and the UHI of the city of KL. Therefore, the study concludes that, the UHI of the city of Kuala Lumpur is proportional to the population density of the city. Accordingly, the study concludes that, the population density affects the urban heat island of the city and contributes to the increase in the intensity of the urban heat island of the city of Kuala Lumpur, Malaysia.
The study shows that, although the overall population density of the city increases, that of the city centre decreases, while the nucleus of this UHI is the city centre. Therefore it is difficult to conclude that the intensity of the UHI is inversely proportional to the population density of the city centre. Nevertheless, it is possible to conclude that, the increase in the intensity of the UHI is not only related to the population density of the city centre, it is actually affected by other different factors and human activities. The study finds that, the commercial, road and rail reserves lands of the city is proportional to the intensity of the UHI, while the open space and recreational, residential, institutional, and agricultural/ fishery/ forest lands is inversely proportional to the intensity of the UHI of the city. Therefore, utilizing these findings and literature reviewed the study concludes that, the intensity of the urban heat island could be reduced if the land of the city of Kuala Lumpur managed in such ways that:
Trees should be planted to shade the hot tarmac of city roads or at least low-level bushes and greenery. Within the city of KL, Many open areas are covered with blocks of marble, granite or tiles. Although these are better than black tarmac, these areas still absorb a lot of heat in direct sunlight and release the heat at late afternoons, evenings and early nights. Again, the author recommends that, such open areas should be turned into green areas or even very small parks. Furthermore, trees should be planted to shade the hot tarmac of inner city roads like Jalan Tuanku Abdul Rahman, Chow Kit…etc; or low level bushes planted along the covered drains in such areas. In addition to that, some roads and highways, which take up an increasing proportion of the urban area, should also be creatively designed to include green shade. The large masses of concrete in new flyovers that are continuously being built all over the city, capture and store large quantities of solar heat, should also take into consideration some plant cover, like overhanging creepers which can shield or block absorption of the heat and reduce the air temperature significantly.
Roads and highways, which take up an ever-increasing proportion of the urban area, should also be creatively designed to include green shade, at the very least along the

Application of Geographic Information Systems 280
medians. The large masses of concrete in new flyovers continuously being built all over the city, which can capture and store large quantities of solar heat, should also take into consideration plant cover, like overhanging creepers which can shield or block absorption of the heat.
Urban car parks should comply with a minimum of 50% shade requirement. Previous studies ([Eliasson, 1993; Sham, 1987, 1990/1991; Shashua, 2000) show that shade trees contribute significantly to temperature reduction, hence the reduction on the intensity of the UHI. Therefore, the author suggests that, urban car parks should comply with a minimum of 50% shade requirement by plantation of trees or/and low level bushes.
Tree planting programs should be reintroduced for all housing estates. Incentives and subsidies should be part of the long term planning.
Many commercial buildings, almost all (Ahmad, 2004) are having flat roofs in Malaysia either to accommodate air-conditioning equipment or water tanks, or for another purposes. Such buildings should green their roofs and planted them with shrubs and low level bushes. This means cultivating greenery on the flat roof surfaces to absorb the heat. This will not only help the city to counter UHI but building owners will also benefit in terms of savings in air-conditioning power consumption. As proven in previous studies; please check chapter 2 for more details.
The creation of as many cities parks as possible will improve the situation and help significantly in reducing the intensity of the UHI of the city. Therefore, tree planting programs should be reinforced in the city of KL, and incentives and subsidies should be part of the long term planning for the city. Previous studies (Eliasson, 1993; Sham, 1987, 1990/1991; Shashua, 2000) prove that green areas moderate urban temperatures. The results of this study confirm this theory; it shows that, the green areas are relatively low in temperature than the non-green areas.
Reduce summer solar radiation by managing the land covered by critical surfaces, for example, pedestrian walks, waiting areas, and busy streets. Reduce the abundance of concrete and asphalt, and increase the amount of vegetation and open water. This will increase higher volumetric heat capacities and greater rates of latent heat influx, thereby lowering air temperatures.
Increase airflow at ground level to flush heated and polluted air away from the city and that could be achieved by managing the land cover and building design.
Author details
Ilham S. M. Elsayed University of Dammam, College of Engineering, Saudi Arabia
Acknowledgement
The author acknowledges the financial support provided by Sudan University of Science and Technology, Ministry of Higher Education, Sudan, and the Centre for Built Environment, International Islamic University Malaysia, for field works and surveys.

Effects of Population Density and Land Management on the Intensity of Urban Heat Islands: A Case Study on the City of Kuala Lumpur, Malaysia 281
5. References
Abdul Samad, H. (2000). Malaysian urbanization and the environment: sustainable urbanization in the new millennium, Akam print, Malaysia
Ahmad, F. E. & Norlinda, B. M. D. (2004). Urban heat islands in Kuala Lumpur, Kuala Lumpur, Department of Irrigation and Drainage Malaysia
Brain, S. J. (2001). Remote Sensing Analysis of Residential Land Use, Forest Canopy Distribution, and Surface Heat Island Formation in Atlanta Metropolitan Region, Ph. D. Thesis, Georgia Institute of Technology, Atlanta
Chan, K. E. ; Abdullah, N. & Tan, W. H. (1984). Population and demographic characteristics in Kuala Lumpur, Proceedings of Seminar on Urbanization and ecodevelopment: with special reference to Kuala Lumpur, University of Malaya, Institute of Advance Studies, Malaysia
Eliasson, I. K. (1993). Urban Climate Related to Street Geometry, Ph. D. Thesis, Goteborgs Universitet, Sweden
Elsayed, I. S. (2006). The Effects of urbanization on the Intensity of the Urban Heat Island: a Case Study on the City of Kuala Lumpur, Ph. D. Thesis, International Islamic University Malaysia
Elsayed, I. S. (2009). Land Management and its effects on the Intensity of the Urban Heat Island: a Case Study on the City of Kuala Lumpur, Proceedings of The IASTED International Conference on Environmental Management and Engineering, Alberta, Canada
Ghani, S. (2000). Urbanization & regional development in Malaysia, Utusan Publications & Distributors, Malaysia
Hafner, J. (1996). The Development of Urban Heat Islands in the Southeast Region of the United States in the Winter Season (Global Warming), Ph. D. Thesis, Huntsville, University of Alabama
Hamidah, K. (1984). (ed.). Kuala Lumpur: the city of our age, City Hall of Kuala Lumpur, Malaysia
Hoong, Y. Y & Sim, L. K. (1984). (ed.). Urbanization and ecodevelopment: with special reference to Kuala Lumpur, Proceedings of Seminar: PRO, 2, Institute of Advance Studies, University of Malaya Press, Kuala Lumpur
Khoo, S. G. (1996). Urbanization and urban growth in Malaysia, Jabatan Perangkaan Malaysia Kok, K. L. (1988). Patterns of Urbanization in Malaysia. National Population & Family
Development Board, Kuala Lumpur, Proceedings of the conference on Urbanization in Malaysia: Patterns, Determinants and Consequences, pp. 20-55
Orville, R. E. (2001). Enhancement of cloud-to-ground lightning over Houston, Texas, Geographical Research, 28, pp. 2597-2600,
Shaharuddin, A. (1997). Urbanization and human comfort in Kuala Lumpur-Petaling Jaya, Malaysia, Ilmu Alam, 23, pp. 171-189
Shahruddin, A. & Norazizah, A. (1997). The essential usage of air conditioning system in Petaling Jaya, Selangor, Malaysia, Proceedings of Symposium on Population, Health and the Environment, International Geographical Union Commission on Population and the Environment, Chiang Mai, Thailand

Application of Geographic Information Systems 282
Sham, S. (1973a). Observations on the city’s form and functions on temperature patterns: a case study of Kuala Lumpur, Tropical Geography, 36, No. 2, pp. 60-65
Sham, S. (1973b). The urban heat island: its concept and application to Kuala Lumpur, Sains Malaysiana, 2, No.1, pp. 53-64
Sham, S. (1980a). Effects of urbanization on climate with special reference to Kuala Lumpur- Petaling Jaya area, Malaysia, In: Urbanization and the atmospheric environment in the low tropics: Experiences from the Klang Valley Region, Malaysia, Penerbit Universit Kebangsaan Malaysia, pp. 264-268
Sham, S. (1980b). The climate of Kuala Lumpur, Petaling Jaya area, Malaysia: A study of the impact of urbanization on local within the humid tropic, Universiti Kebangsaan Malaysia
Sham, S. (1984a). Inadvertent atmospheric modifications through urbanization in the Kuala Lumpur area, Malaysia, In: Urbanization and Ecodevelopment with Special Reference to Kuala Lumpur, Universiti Malaya, Institute of Advanced Studies, Malaysia
Sham, S. (1984b). Urban development and changing patterns of night-time temperatures in the Kuala Lumpur – Petaling Jaya area, Malaysia, Journal Teknologi, 5, pp. 27-36
Sham, S. (1985). Post-Merdeka development and the environment of Malaysia, In: Urbanization and the atmospheric environment in the low tropics: Experiences from the Klang Valley Region, Malaysia, Penerbit Universit Kebangsaan Malaysia, pp. 41-75
Sham, S. (1986). Temperatures in Kuala Lumpur and the merging Kelang Valley conurbation, The Institute of Advanced Studies, Universiti Malaya, Malaysia
Sham, S. (1987). Urbanization and the atmospheric environment in the low tropics: Experiences from the Klang Valley Region, Penerbit Universit Kebangsaan Malaysia
Sham, S. (1990/1991). Urban climatology in Malaysia: An overview, Energy and Buildings Journal, 15-16, pp. 105-117
Sham, S. (1993). Environment and Development in Malaysia: Changing Concerns and Approaches”, ISIS Malaysia, Malaysia
Shashua-Bar, L. & Hoffman, M. E. (2000). Vegetation as a climatic component in the design of an urban street: An empirical model for predicting the cooling effect of urban green areas with trees, Energy and Building, 31, pp. 221-235
Smoyer, K. E. (1997). Environmental risk factors in heat wave mortality in St. Louis, Ph. D. Thesis, University of Minnesota, Minnesota
Streutker, D. R. (2003). A Study of the Urban Heat Island of Houston, Texas, Ph. D. Thesis, , Rice University, Taxes
Tamagno, B. et al. (1990). Changing environments, Cambridge University Press, London, UK, pp. 1-104
Thong, L. B. (1990). Urbanization Strategies in Malaysia and the Development of Intermediate Urbanization Centers, Proceedings of the IGU Regional Conference of Asian Pacific Countries on Urban Growth and Urbanization, Beijing, China
Valazquez-Lozada, A. (2002). Urban heat island effect analysis for San Juan, Puerto Rico, M. Sc. Thesis, University of Puerto Rica
Wan, M. N. & Abdul Malek, M. (2004). Utilizing satellite remote sensing and GIS technologies for analyzing Kuala Lumpur’s urban heat island, Faculty of Architecture and Environmental Design, International Islamic University Malaysia