effects of ph and cation composition on sorption of per ... · ii abstract effects of ph and cation...
TRANSCRIPT

UPTEC W 15028
Examensarbete 30 hpJuni 2015
Effects of pH and Cation Composition on Sorption of Per- and Polyfluoroalkyl Substances (PFASs) to Soil Particles
Malin Ullberg

II
ABSTRACT Effects of pH and Cation Composition on Sorption of Per- and Polyfluoroalkyl Substances (PFASs) to Soil Particles Malin Ullberg Per- and polyfluoroalkyl substances (PFASs) have drawn great attention recently, due to their environmental persistence, potential toxicity and global distribution. PFAS is a large family of substances, characterized by a perflourinated carbon chain and a functional group. All PFASs are synthetic and have been widely used since the 1950s due to their unique properties of being both hydrophobic and oleophobic, making them useful for many industries.
To be able to predict the fate of PFASs in the environment and to obtain detailed understanding of the transport processes, their partitioning behavior between soil par-ticles and water depending on a range of parameters must be investigated. The aims of this study was to investigate the effects of pH, cation composition, functional group and perfluorocarbon chain length on sorption of PFASs to soil particles, by batch sorption experiment in laboratory scale. The laboratory-scale experiments were com-bined with modelling of the net charge to evaluate if net charge is a good predictor for sorption of PFASs to soil particles.
14 PFASs of varying length and functional groups were studied (PFBA, PFPeA, PFHxA, PFHpA, PFOA, PFNA, PFDA, PFUnDA, PFDoDA, PFTeDA, PFBS, PFHxS, PFOS and FOSA). The effect on sorption of Na+, Ca2+ (two different concen-trations) and Al3+ were investigated at pH-range 3-6. Modelling of net charge was carried out in the geochemical model Visual MINTEQ. The soil had 45% organic carbon content.
The adsorption of PFASs was strongly correlated with perfluorocarbon chain length, showing a stronger adsorption to particles with increasing perfluorocarbon chain length (i.e. more hydrophobic). The relation between sorption (represented by the distribution coefficient log Kd) and perfluorocarbon chain length was linear for all PFSAs and C3 to C10 PFCAs. The PFSAs (sulfonate functional group) sorbed stronger to soil particles than the PFCAs (carboxylic functional group), and FOSA (sulfona-mide functional group) sorbed the strongest. For most PFCAs, (C5-C13) there was a trend of decreasing log Kd (i.e. decreased sorption) with increasing pH, due to pH-dependent changes of the soil particle surfaces. For short and intermediate perfluorocarbon chain length PFCAs (C5-C8) and for PFHxS among the PFSAs, cations had a clear effect on sorption. Aluminium ions (trivalent, Al(NO3)3) had the largest effect, followed by calcium (divalent, Ca(NO3)2) where higher concentration resulted in stronger sorption. Sodium (univalent, NaNO3) had the least influence on sorption.
The net charge modelled with Visual MINTEQ takes into account many parameters (including pH) that affect the surface charge and sorption of PFASs to soil particles. When comparing log Kd for the different PFASs with pH and net negative charge, net charge was a better predictor of sorption of PFASs to soil particles than solution pH alone. Keywords: Per- and polyfluoroalkyl substances (PFASs), Soil, Partitioning coefficients, Partitioning, sorption, solution chemistry, electrostatic interaction, Visual MINTEQ

III
REFERAT Effekter av pH och katjonsammansättning på sorption av per- och polyfluoral-kylsubstanser (PFAS:er) till jordpartiklar Malin Ullberg Per- och polyfluoroalkylsubstanser (PFAS:er) har dragit stor uppmärksamhet till sig på senare tid, på grund av deras persistenta egenskaper, potentiella toxicitet och glo-bala utbredning. PFAS är en stor grupp ämnen, kännetecknad av en perflourinerad kolkedja och en funktionell grupp. Alla PFAS är syntetiska och har använts i stor ut-sträckning sedan 1950-talet på grund av deras unika egenskaper av att vara både vat-ten- och fettavstötande, vilket gör dem användbara för många industriella tillämp-ningar. För att kunna förutsäga var dessa föroreningars hamnar i miljön och få mer detaljerad förstående för transportprocesserna, måste deras fördelningbeteende mellan jordpar-tiklar och vattenundersökas för en rad olika parametrar. Syftet med denna studie var att undersöka effekterna av förändrat pH, katjonsammansättning, funktionell grupp och perfluorkolkedjelängd på sorption av PFAS:er till jordpartiklar. Detta gjordes med sorptionsexperiment i laboratorieskala. Laboratorieexperimentet kompletterades med modellering av nettoladdning, för att se huruvida detta väl kunde förklara sorp-tionen till jordpartiklar. 14 PFAS:er av varierande längd och med tre olika funktionella grupper studerades (PFBA, PFPeA, PFHxA, PFHpA, PFOA, PFNA, PFDA, PFUnDA, PFDoDA, PFTe-DA, PFBS, PFHxS, PFOS och FOSA). Effekten på sorption av Na+, Ca2+ (två olika koncentrationer) och Al3+ undersöktes vid pH-intervallet 3-6. Modellering av netto-laddning utfördes i den geokemiska modellen Visual MINTEQ. Jorden som användes hade en halt av organiskt kol på 45%. Adsorptionen av PFAS:er var starkt positivt korrelerad med kedjelängden på de per-fluorinerade kolkedjan. Ju längre kolkedja (dvs. mer hydrofob), desto starkare adsorp-tion till partiklar. Relationen mellan sorptionen (här uttryckt som partitioneringskoffi-cienten log Kd) och kedjelängd var linjär för alla PFSA och för C3 till C10 för PFCA. PFSA (sulfonat) adsorberade starkare än PFCA (karboxyl), och FOSA (sulfonamid) adsorberades starkast. För de flesta PFCA, (C5-C13) fanns en allmän trend där log Kd (dvs. sorption) minskade med ökande pH, på grund av pH-beroende förändringar på jordpartiklarna. För korta och medellånga PFCA (C5-C8) och för PFHxS hade katjonsammansättning-en en tydlig effekt på sorptionen. Aluminiumjoner (trevärd, Al(NO3)3) hade den störs-ta effekten, följt av kalcium (tvåvärd, Ca(NO3)2) där den högre koncentrationen resul-terade i starkare sorption. Natrium (envärd, NaNO3) hade minst påverkan på sorptio-nen till jordpartiklar. Visual MINTEQ tar hänsyn till många parametrar (inklusive pH), när nettoladdningen på jordpartiklarnas yta räknas ut. När log Kd för olika PFAS:er jämfördes med endera pH eller negativ nettoladdning, drogs slutsatsen att nettoladdning korrelerade bättre med sorption än pH. Nyckelord: Perfluoroalkylsubstanser (PFAS), jord, partitioneringskoefficienter, sorption, lösningske-mi, elektrostatisk interaction, Visual MINTEQ

IV
ACKNOWLEDGEMENTS
“Why should we tolerate a diet of weak poi-sons, a home in insipid surroundings, a circle
of acquaintances who are not quite our ene-mies, the noise of motors with just enough re-
lief to prevent insanity? Who would want to live in a world which is just not quite fatal?”
― Rachel Carson, Silent Spring This master thesis of 30 ECTS is the last part of the Master Program in Environmental and Water Engineering at Uppsala University. It has been carried out on the behalf of the Department of Aquatic Science and Assessment at the Swedish University of Ag-ricultural Sciences, SLU. Dan Berggren Kleja, Department of Soil and Environment, Sweden, Geochemistry, acted as supervisor and Lutz Ahrens was the subject reviewer Department of Aquatic Sciences and Assessment. Fritjof Fagerlund at the Department of Earth Sciences at Uppsala University acted as the final examiner. As this work is coming to an end I would like to express my gratitude to all people involved in the process of creating this thesis. First and foremost I would like to thank my supervisor Dan Berggren Kleja and my subject reviewer Lutz Ahrens for their dedication to my project, for all the support and help throughout my project as well as for always taking the time to answer all my questions. I would also like to thank the staff and the other master students at SLU for being patient and helpful in the lab. Lastly, I would like to thank my flatmates of Kollektivet Näcken, my friends and my family for massaging my shoulders and for making sure I got up every morning, for all the support and for believing in me when I didn’t. Malin Ullberg Uppsala, 2015 Copyright © Malin Ullberg and the Department of Aquatic Sciences and Assessment, Swedish University of Agricultural Sciences (SLU) UPTEC W 15028, ISSN 1401-5765. Published digitally at the Department of Earth Sciences, Uppsala University, Uppsala, 2015

V
POPULÄRVETENSKAPLIG SAMMANFATTNING
Effekter av pH och katjonsammansättning på sorption av per- och polyfluoral-kylsubstanser (PFAS:er) till jordpartiklar Malin Ullberg Per- och polyfluoroalkylsubstanser (PFAS:er) är en grupp av syntetiska, organiska ämnen som har fått allt större uppmärksamhet den senaste tiden. Dessa ämnen har visat sig vara svårnedbrytbara, giftiga och bioackumulerande, dvs. har en tendens att ansamlas i levande organismer. Det har återfunnits över hela jorden, även på avlägsna platser där inga PFAS:er har tillverkats eller använts på plats. Kunskapen om hur des-sa ämnen påverkar människor, djur och natur är fortfarande begränsad, men de miss-tänks vara bl.a. hormonstörande, cancerogena och ha toxisk påverkan på immun-försvaret.
PFAS är en stor grupp av ämnen, kännetecknad av en molekyl som består av en lång fluorerad kolkedja och en funktionell grupp i ena änden, vilket ger dem den unika egenskapen att de är både vatten- och fettavstötande. De har använts flitigt sedan 50-talet som tensider (ytaktiva ämnen) i många produkter såsom brandsläckningsskum, färg, läder och textilier. I dagsläget är regelverket kring de flesta av dessa ämnen be-gränsat, och det ämne som fått mest uppmärksamhet inom denna grupp är PFOS. PFOS inkluderades 2009 i Stockholmskonventionens lista över svårnedbrytbara (per-sistenta) organiska föroreningar (POPs), vilket innebär att användandet och produk-tionen av PFOS är begränsat sedan dess.
För att kunna förutsäga var dessa föroreningar hamnar i miljön och för att få en mer detaljerad förstående för hur de rör sig i mark och vatten, måste forskning utföras där viktiga jord- och vattenparametrar varieras. Syftet med denna studie var att variera surhetsgrad (pH), sammansättning av positivt laddade joner (katjoner) och längden på kolkedjan för att se vilken effekt detta hade på på sorption av PFAS:er till organiskt material. Med sorption menas hur stor andel av molekylerna som fäster på jordpartik-lar snarare än att stanna i vattenfasen. För att göra detta förbereddes olika blandningar av jord, lösning och känd mängd PFASer som sedan analyserades.
Datormodellen Visual MINTEQ användes för att uppskatta hur mycket negativ ladd-ning som fanns på jordprovets yta, vilket är en viktig pusselbit i att förstå hur förore-ningarna kommer att bete sig. Det vill säga huruvida de kommer att adsorbera till jord eller stanna i vätskan.
Fjorton PFAS:er av varierande längd studerades (PFBA, PFPeA, PFHxA, PFHpA, PFOA, PFNA, PFDA, PFUnDA, PFDoDA, PFTeDA, PFBS, PFHxS, PFOS och FOSA). Effekten på skillnaden i sorption mellan av natriumjoner, kalciumjoner (två olika koncentrationer) och aluminiumjoner undersöktes över pH-intervallet 3-6 (surt till nära neutralt). Dessa katjoner har olika laddning, och tros därför påverka netto-laddningen olika.
Resultaten visade att adsorptionen av PFAS:er varierade med längden på kolkedjan. Ju längre kolkedja (dvs. mer vattenavstötande), desto starkare adsorberade de till jordpartiklarna i provet. För de flesta av de studerade PFAS:erna fanns ett allmänt samband, där sorptionen minskade med ökande pH. Detta berodde på att ytan på jord-

VI
partiklarna ändrade egenskaper när pH ändrades. Aluminiumjoner hade den starkaste effekten på sorptionen, följt av kalcium, där den högre koncentrationen resulterade i starkare sorption. Natrium hade allra minst påverkan på sorptionen. Visual MINTEQ tar hänsyn till många parametrar (inklusive pH), när nettoladdningen räknas ut. När sorptionen för olika PFAS:er jämfördes med endera pH eller nettoladd-ning, drogs slutsatsen att nettoladdning bättre förutsåg sorption än vad pH gjorde.

VII
ABBREVIATIONS AC Activated carbon BC Oil-derived black carbon Cx Fluorocarbon chain of length x DOC Dissolved organic carbon FASAs Perfluoroalkyl sulfonamides Foc Fraction organic carbon FOSA Perfluorooctane sulfonamide HPLC-MS/MS High-performance liquid chromatography
coupled with tandem mass spectrometry IS Internal standard Kd Soil-water distribution coefficient Koc Organic carbon normalised partition coeffi-
cient PFASs Per- and polyfluoroalkyl substances PFBA Perfluorobutanoate PFBS Perfluorobutane sulfonic acid PFCAs Perfluorinated carboxylate acids PFDA Perfluorodecanoate PFDoDA Perfluorododecanoate PFHpA Perfluorohepanoate PFHxA Perfluorohexanoate PFHxS Perfluorohexane sulfonic acid PFNA Perfluorononanoate PFOA Perfluorooctanoate PFOS Perfluorooctane sulfonic acid PFPeA Perfluoropentanoate PFSAs Perfluorinated sulfonic acids PFTeDA Perfluorotetradecanoate PFUnDA Perfluoroundecanoate POPs Persistent organic pollutants PP Polypropylene SD Standard deviation SPE Solid phase extraction SPM Suspended particulate matter Sw Water solubility
VIII
TABLE OF CONTENTS ABSTRACT.................................................................................................................II!ACKNOWLEDGEMENTS ..................................................................................... IV!POPULÄRVETENSKAPLIG SAMMANFATTNING...........................................V!ABBREVIATIONS..................................................................................................VII!1. INTRODUCTION....................................................................................................1!
1.1. OBJECTIVES AND HYPOTHESIS...........................................................................1!2. BACKGROUND ......................................................................................................2!
2.1. PER- AND POLYFLUOROALKYL SUBSTANCES (PFASs)................................2!2.1.1. Production and usage ...............................................................................................2!2.1.2. Toxicity and occurrence in humans and wildlife.....................................................4!2.1.3. Regulations ..............................................................................................................4!
2.2. PARTITIONING BEHAVIOR OF PFASs.................................................................5!2.2.1. Physiochemical properties .......................................................................................5!2.2.2. Influence of chain length and functional group .......................................................5!2.2.3. Influence of organic carbon .....................................................................................6!2.2.4. Influence of pH ........................................................................................................7!2.2.5. Influence of anions and cations ...............................................................................7!2.2.6 Acid dissociation constants, pKa...............................................................................8!
3. MATERIAL AND METHODS ..............................................................................8!3.1. EXPERIMENT SETUP................................................................................................8!3.2. SOIL CHARACTERISTICS .......................................................................................8!3.3. PFAS SPIKING SOLUTION.......................................................................................8!3.4. BATCH SORPTION EXPERIMENT ........................................................................9!
3.4.1. Pilot experiment.......................................................................................................9!3.4.2. Main experiment ....................................................................................................10!
3.5. CHEMICAL ANALYSES..........................................................................................11!3.5.1. PFAS analysis ........................................................................................................11!3.5.2. pH ..........................................................................................................................13!3.5.3. Dissolved organic carbon ......................................................................................13!3.5.4. Quality assurance/quality control (QA/QC) ..........................................................13!
3.6. MODELLING OF NET CHARGE USING VISUAL MINTEQ............................13!3.7. DATA ANALYSIS ......................................................................................................14!
4. RESULTS ...............................................................................................................15!4.1. BATCH SORPTION EXPERIMENT ......................................................................15!
4.1.1. PFCAs....................................................................................................................15!4.1.2. PFSAs and FOSA ..................................................................................................17!
4.2. INFLUENCE OF CARBON CHAIN LENGTH AND FUNCTIONAL GROUPS ON SORPTION OF PFASs TO SOIL .............................................................................18!4.3. INFLUENCE OF CATIONS, PH AND NET NEGATIVE CHARGE ON SORPTION OF PFASs TO SOIL ....................................................................................20!
4.3.1. Influence of cations and pH on sorption of PFASs to soil ....................................20!4.3.2. Influence of cations and net negative charge on sorption of PFSAs to soil ..........21!
5. DISCUSSION .........................................................................................................26!5.1. BATCH SORPTION EXPERIMENTS ....................................................................26!

IX
5.2. INFLUENCE OF CARBON CHAIN LENGTH AND FUNCTIONAL GROUPS ON SORPTION OF PFASs TO SOIL .............................................................................26!5.3. INFLUENCE OF CATIONS, PH AND NET NEGATIVE CHARGE ON SORPTION OF PFASS TO SOIL....................................................................................27!
5.3.1. Influence of pH ......................................................................................................27!5.3.2. Influence of cations................................................................................................28!5.3.3. Influence of net negative charge............................................................................28!5.3.4. Comparison between pH and net negative charge.................................................28!
5.4. FUTURE PERSPECTIVES .......................................................................................29!6. CONCLUSION ......................................................................................................29!7. REFERENCES.......................................................................................................31!APPENDIX.................................................................................................................34!
Appendix I ..........................................................................................................................34!Appendix II .........................................................................................................................35!Appendix III .......................................................................................................................36!Appendix IV........................................................................................................................36!Appendix V .........................................................................................................................37!Appendix VI........................................................................................................................38!Appendix VII ......................................................................................................................39!

1
1. INTRODUCTION Per- and polyfluoroalkyl substances (PFASs) have drawn great attention recently, due to their environmental persistence, potential toxicity and global distribution (Ahrens et al., 2011; Du et al., 2014). PFAS is a large family of substances, characterized by a perflourinated carbon chain and a functional group. All PFASs are anthropogenic and have been widely used since the 1950s due to their unique properties of being both hydrophobic and oleophobic, making them useful for many industries (Borg and Håkansson, 2012).
In Sweden, PFASs have been found in human blood in worrisome levels, raising a lot of concern. The likely pathway of exposure is drinking water, where the water source have been contaminated by fire extinguishing foam utilized at fire practicing areas (Glynn et al., 2013; Hedenberg, 2014; Ny Teknik, 2014).
To be able to predict the fate of PFASs in the environment, to obtain a detailed under-standing of the transport processes, their partitioning behavior between soil particles and water depending on a range of parameters must be investigated. Even though there has been a great interest for PFASs in the research community over the last 20 years or so, there is still a lot that is unknown.
1.1. OBJECTIVES AND HYPOTHESIS The aims of this study was to investigate the effects of pH, cation composition (par-ticularly trivalent cation Al3+), functional group and perfluorocarbon chain length on sorption of PFASs to soil particles, by batch sorption experiments at laboratory scale. The laboratory-scale experiments were combined with modelling of the soil surface net charge to evaluate if net charge is a good predictor for sorption of PFASs to soil particles.
Previous research has studied effects on sorption by cations with valence two or less (e.g. Na+, Ca2+ and Mg2+), whereas the knowledge of the effect of trivalent cations (such as Al3+) is limited. The concept of correlating sorption with modelled surface net charge is previously uninvestigated. This study covers a greater range of PFASs than most previous studies.
The main hypotheses to be investigated were that: • sorption of PFASs to organic matter is a balance between two counteracting
forces: firstly attraction forces between the hydrophobic ‘tail’ of PFASs and hydrophobic parts of soil organic matter and secondly repulsion forces be-tween the negatively charged ‘head’ (functional group) of the PFASs mol-ecules and the negatively charged carboxylic groups of soil organic matter.
• the hydrophobic attraction forces between PFASs and organic matter would increase with increased carbon chain length of the PFASs molecule.
• the repulsion forces would decrease when the charge of carboxylic groups of the soul surface decreases due to either protonation or complex formation with Ca+2 or Al3+-ions.
• the net charge effect could be modelled using geochemical model Visual MINTEQ and that the modelled net charge of the soil would be a better pre-dictor of sorption than pH.

2
2. BACKGROUND
2.1. PER- AND POLYFLUOROALKYL SUBSTANCES (PFASs) Per- and polyfluoralkyl substances (PFASs) is a collective term for a large group of synthetic highly fluorinated organic compounds that has been produced and used for industry purposes for over 50 years. As highly persistent environmental contaminants, PFASs have been found over the whole globe in humans, wildlife and in the environ-ment (Borg and Håkansson, 2012). Many studies have focused on perfluorooctane sulfonic acid (PFOS) and perfluorooctanoate (PFOA) which are two out of many PFASs, (e.g. Ahrens et al., 2011; Chen et al., 2009, 2009; Du et al., 2014; Pan et al., 2009; Pan and You, 2010; Senevirathna et al., 2010; Zareitalabad et al., 2013) espe-cially during earlier years, although newer research cover a wider spectrum of PFASs (Ahrens et al., 2010; Kim et al., 2015; Labadie and Chevreuil, 2011; Post et al., 2013). The general structure is a polyfluoroalkyl chain, typically three to fifteen carbons long, where flourine replaces the hydrogen, with a functional group at one end (Borg and Håkansson, 2012). For a fully perfluorinated compound, the molecular structure is (CnF2n+1)-1 (Buck et al., 2011). The stable and strong saturated carbon-fluorine bond creates a main structure of PFASs that is both thermally and chemically stable as well as resistant to chemical, physical and biological degradation (Buck et al., 2011; Giesy and Kannan, 2002; Rahman et al., 2014)
For this particular study, fourteen PFASs with varying chain lengths and functional groups were studied. Table 1 show the acronyms, the molecular structure, the differ-ent functional groups studied, the molar weight (divided by the subgroups PFCAs, PFSAs and FASAs), the water solubility (Sw) and the acid dissociation constant (pKa) of the studied compounds.
2.1.1. Production and usage A large number of PFASs have been commercially produced for over 50 years, for example as surfactants (Borg and Håkansson, 2012; Buck et al., 2011; Giesy and Kannan, 2002), or as processing aid for fluoropolymers (Buck et al., 2011). Contrary to traditional surfactants, that are comprised by a water-soluble hydrophilic part and a water-insoluble hydrophobic part, the fluorinated carbon chain of PFASs is both oil-and water repellent, making them especially useful in many industrial areas. Such industrial uses include surface protection for paper and packaging, water-proofing and stain and oil repellent of different textiles (Borg and Håkansson, 2012). Further, PFASs have been used in insecticides, fire-fighting foams, ski-waxes and hydraulic fluids in airplanes (Ahrens et al., 2011; Borg and Håkansson, 2012; Glynn et al., 2013; Moody et al., 2003). Since 2002, when the most commonly used PFOA and PFOS was phased out, shorter-chained PFASs like perfluorobutanoate (PFBA) have successively replaced them (Buck et al., 2011). There is no production of PFASs in Sweden, and has not been, so the sources is likely a combination of emission from industries using these compounds, leachate from landfills and from sewage treatment (Borg and Håkansson, 2012).

3
Table 1. List of the PFASs analyzed in this study along with their molecular structure (Borg and Håkansson, 2012), molecular weight (MW), the water solubility (log Sw) and acid dissociation constant (pKa).
Compound Acronym Structure Chemical formula
MW (g mol-1)
Log Sw (mol L-1)
pKa
Perfluorobutanoate PFBA
C3F7COOH 213.04 0.76b 0.05c
Perfluoropentanoate PFPeA
C4F9COOH 263.05 1.45b -0.10c
Perfluorohexanoate PFHxA
C5F11COOH 313.06 2.15b -0.17c
Perfluorohepanoate PFHpA
C6F13COOH 363.07 2.85b -0.2c
Perfluorooctanoate PFOA
C7F15COOH 413.08 3.55b -0.22c
Perfluorononanoate PFNA C8F17COOH 463.09 4.24b -0.22c
Perfluorodecanoate PFDA
C9F19COOH 513.10 4.94b -0.22c
Perfluoroundecanoate PFUnDA
C10F21COOH 563.11 5.62b -0.22c
Perfluorododecanoate PFDoDA
C11F22COOH 613.12 5.80b -0.22c
Perfluorotetradecanoate PFTeDA
C13F22COOH 713.14 7.05b -0.22c
Perfluorobutane sulfonic acid
PFBS
C4F9SO3H 300.12 1.15b 0.14c
Perfluorohexane sulfonic acid
PFHxS
C6F13SO3H 400.14 2.91b 0.14c
Perfluorooctane sulfonic acid
PFOS C8F17SO3H 500.16 4.30b 0.14c
Perfluorooctane- sulfonamide
FOSA
C8F17SO2NH2 499.18 4.33b 6.56c
aKim et al., 2015, bWang et al., 2011, cAhrens et al., 2012

4
2.1.2. Toxicity and occurrence in humans and wildlife There are concerns about the toxicity of PFASs for humans and wildlife, and the number of studies on the subject is growing steadily, again with an emphasis on PFOA and PFOS (Hansen et al., 2001; Kannan et al., 2004), where PFOS has been officially classified as a persistent, bioaccumulative, and toxic substance (Buck et al., 2011). PFCAs, such as PFOA and perfluorodecanoate (PFDA), have potential to af-fect enzymes and proteins involved in lipid metabolism and other toxic effects, in-cluding accumulation of triglycerides in liver and reduction of thyroid hormone (Giesy and Kannan, 2002). Contrary to other studied persistent organic contaminants, PFASs does not accumulate in fatty tissues, but rather to proteins in liver, blood and eggs (Kannan et al., 2004). However, there is a large difference in the toxicity and health problems among the studied PFASs, and among PFCAs, the toxic effects vary depending upon carbon chain length (Giesy and Kannan, 2002). For example, the potencies of PFCAs to induce peroxisomal beta-oxidation increased with increased carbon chain length (Kudo et al., 2000). Several studies have measured levels in PFASs in human blood, over time (Glynn et al., 2012, 2007; Hansen et al., 2001; Kannan et al., 2004; Kärrman et al., 2006). Glynn et al. (2012) concluded that increas-ing trends in PFASs concentration in human serum over time was observed for per-fluorobutane sulfonic acid (PFBS), perfluorohexane sulfonic acid (PFHxS), per-fluorononanoate (PFNA) and PFDA, whereas decreasing trends was observed for PFOS, perfluorooctane sulfonamide (FOSA) and PFOA, which could be connected to the phasing-out of these compounds (Borg and Håkansson, 2012). In the environment, PFASs have the potential to bioaccumulate in fish (Martin et al., 2003), rendering this a possible exposure risk for humans, and show up in high concentrations in top preda-tors such as otter, mink, polar bear and seal (Giesy and Kannan, 2002).
2.1.3. Regulations The Swedish Chemical Agency (Kemikalieinspektionen) has reported PFASs as com-pounds with especially hazardous characteristics (Glynn et al., 2013). However, risk assessments for many of them are either lacking or require improvement (Borg and Håkansson, 2012). PFOS has been included in the Stockholm Convention on Persis-tent Organic Pollutants (POPs) and therefore been globally restricted in its use (Ahrens et al., 2011). PFOS and PFOA are also regulated in its use in Germany as well as in the United States and Canada, although some specific applications are still allowed (Du et al., 2014). These restrictions have resulted in development of new PFASs with similar characteristics (Ahrens et al., 2011; Rahman et al., 2014). There are no general enforced guidelines for concentrations of PFASs in drinking water in either Sweden or Europe, however target values on PFOS at 350 to 1 000 ng L-1 in drinking water has been set up by The Swedish Environmental Protection Agency (Naturvårdsverket). The interval is based upon tolerable daily intake, body weight and intake of drinking water (Glynn et al., 2013). The Swedish National Food Agency (Livsmedelsverket) has stated preliminary guidelined regarding PFBS, PFHxS, PFOS, perfluoropentanoate (PFPeA), perfluorohexanoate (PFHxA), per-fluorohepanoate (PFHpA) and PFOA, that the sum of the seven PFASs should not exceed 90 ng L-1 in drinking water and also be below the tolerable daily intake (TDI) guideline of 900 ng L-1 in drinking water (Livsmedelsverket, 2015). More research on exposure and toxicology of PFASs is required to make better risk assessments in the future (Rahman et al., 2014).

5
2.2. PARTITIONING BEHAVIOR OF PFASs
2.2.1. Physiochemical properties The nature of the structure of the PFASs gives them a set of properties that makes them unique. The physicochemical properties of PFASs, and how they behave in the environment depends on their perfluorocarbon chain length and on their functional group. Further this particular structure gives them water and oil repellent properties as well as resistance to oxidation (Buck et al., 2011). Three subgroups of PFASs are studied in this report, ten perfluoroalkyl carboxylates (PFCAs), three perfluoralkyle sulfonates (PFSAs) and one perflourooctane sulfonamide (FOSA). The subgroups can be categorised as either long-chained (for PFCAs seven or more perfluorinated car-bons, and for PFSAs six or more) or short-chained (Buck et al., 2011). As a general rule, the polarity and solubility in water (Sw) increases with a decreasing carbon chain length (Table 1). PFCAs and PFSAs are considered stable end products that won’t degrade under naturally occurring conditions (Borg and Håkansson, 2012).
Being surfactants, PFASs have the possibility of forming micelles and hemi-micelles. However, both Johnson et al. (2007) and Higgins and Luthy (2006) states that there is little potential of micelle formation or even hemi-micelles forming within the sedi-ment organic matter.
2.2.2. Influence of chain length and functional group Sorption behavior and bioaccumulation of PFCAs and PFSAs is strongly influenced by molecular structure, where longer chained PFASs adsorb more strongly to organic matter, with a near linear relation between sorption (presented as the organic carbon normalized partitioning coefficient log Koc) and the perfluoroalkyl chain length (Labadie and Chevreuil, 2011). Higgins and Luthy (2006) found that on average, the sorption of the PFASs was 1.7 times stronger (0.23 log units) than for the PFCAs, and that although both chain length and functional group impact the sorption, chain length is the dominating structural feature concerning adsorption to sediment materials and suspended particulate matter (SPM), a conclusion that also Ahrens et al. (2010) found (0.71–0.76 log units higher for PFSAs). The highest particulate associated fraction observed in that study was for perfluoroundecanoate (PFUnDA) with 62%. The or-ganic carbon normalized partition coefficient, KOC, for individual PFASs from a number of studies is presented in Table 2. Ahrens et al. (2010) found that short-chained PFCAs were exclusively detected in the dissolved phase whereas long-chained PFCAs, PFSAs and FOSA bound more strongly to particles and that the sorption was influenced by the soil organic carbon content. In general, PFSAs, FOSA and long-chained PFCAs have a stronger potential to interact with SPM, thus these PFASs have a higher potential for sedimentation and accumulation in sediments (Ahrens et al., 2010). PFASs molecules may prefer ad-sorption onto solid surfaces rather than staying in water phase even if the adsorbent surfaces are hydrophobic due to their hydrophobic and oleophobic properties (Du et al., 2014). The electrostatic negativity is principally originated from the functional head of the compound, while the tail of the molecule mostly displays the hydrophobic effect which is overwhelming the charged effect (Du et al., 2014).

6
Table 2. Log KOC with standard deviation for Ahrens et al., 2011, 2010; Higgins and Luthy, 2006 and Labadie and Chevreuil, 2011.
Log KOC ± SD
Log KOC ± SD
Log KOC ± SD
Log KOC ± SD
[mL g-1] Higgins and Luthy, 2006
a
(n) Ahrens et al., 2011
b
(n) Ahrens et al., 2010
c
(n) Labadie and Chevreuil, 2011
d
(n)
PFHxA 2.1 ± 0.2 (3) PFHpA 2.9 ± 0.0 (6) 2.1 ± 0.2 (3) PFOA 2.1 ± - (2) 2.4 ± 0.2 (9) 3.5 ± 0.1 (6) PFNA 2.4 ± 0.1 (3) 4.0 ± 0.1 (6) 2.9 ± 0.1 (3) PFDA 2.8 ± 0.1 (5) 4.6 ± 0.1 (6) 3.8 ± 0.2 (3) PFUnDA 3.3 ± 0.1 (5) 5.1 ± 0.1 (6) 4.7 ± 0.1 (3) PFDoDA 5.6 ± 0.2 (3) PFHxS 3.7 ± 0.3 (6) 2.2 ± 0.1 (3) PFOS 2.6 ± 0.1 (4) 3.5 ± 0.9 (18) 4.8 ± 0.1 (6) 3.7 ± 0.2 (3) FOSA 4.2 ± 1.0 (22) 4.5 ± 0.1 (6)
a Organic carbon content in sediment ranging from 0-10%. b Organic carbon content in sediment ranging from 0-1.6 % c Organic carbon content in sediment ranging from1.5-10.6 %. d Organic carbon content in sediment 4.8% n = number of samples included in the calculation
2.2.3. Influence of organic carbon Several studies have found presence of organic matter to be an important factor to the partitioning behavior of PFASs in soil (Ahrens et al., 2011; Chen et al., 2009; Du et al., 2014; Higgins and Luthy, 2006; Milinovic et al., 2015; You et al., 2010). Higgins and Luthy (2006) concluded that the dominant sediment parameter influencing sorp-tion of anionic PFASs was organic carbon in sediment. Ahrens et al. (2011) also found that the level of organic content had a significant influence on the partitioning, whereas for sediment with little or no organic content, the density of the sediment became the most important factor. According to Higgins and Luthy (2006), organic carbon levels in sediment, rather than sediment iron oxide content, was the dominant sediment parameter affecting sorption, pointing at the importance of hydrophobic interactions.
For individual PFASs, Milinovic et al. (2015) found that sorption, calculated as soil-water distribution coefficient (Kd) increased linearly with increasing organic matter in the soil and suggested therefore that the main sorption mechanism of PFASs is based predominantly on interactions between the hydrophobic fluorocarbon chain of the compound and the organic matter. Similar correlation for PFOS was found by Du et al. (2014), who further stated that the functional groups on the surface and the pore structure of the adsorbents plays an important role in the adsorption. Chen et al. (2009) studied how pH and Ca2+ concentration affected sorption of PFOS to oil-derived black carbon (BC) and found that hydrophobic interactions of the hy-drophobic moieties of PFOS with oil played a dominant role. BC sorption for PFOS was not stronger than other natural organic carbon in the case of low Ca2+ concentra-tion and pH 5.05.
Given its large influence in sorption behavior of PFASs, activated carbon (AC) is the most widely used adsorbent for water treatment (Du et al., 2014).!The high removal

7
efficiency of AC is due to the large surface, which is generally non-polar with few functional groups, rendering it suitable for removing hydrophobic pollutants. For ex-ample, the removal efficiency of PFOS from wastewater was 99% using granular AC (Du et al., 2014). The adsorption kinetics of PFASs onto the AC have been found to be closely related to the particle diameter and pore size of adsorbents, with powdered adsorbents having fast adsorption while the granular adsorbents normally show very slow adsorption for PFOS (Du et al., 2014).
2.2.4. Influence of pH Many studies have demonstrated the importance of pH when it comes to sorption be-havior or PFASs (e.g. Chen et al., 2009; Du et al., 2014; Higgins and Luthy, 2006; Tang et al., 2010; Wang et al., 2012), but the theories to why it matters are diverse. The effects are typically described as due to protonation or deprotonation of the or-ganic acids near its pKa, but there are likely other processes at play (Higgins and Luthy, 2006). It is likely that pH effects are due to pH-dependent changes in the sorb-ent, such as surface charge of organic matter, rather than protonation/deprotonation of the sorbate (Higgins and Luthy, 2006). In the same study, there was a significant drop in the observed Kd for the most hydrophobic (long-chained) compounds at high pH (7.5) which likely corresponds to the increased DOC concentration (Higgins and Luthy, 2006).!Wang et al. (2012) suggests that the decrease in PFOS and PFOA ad-sorption with increasing pH is due to an increase in ligand exchange reactions and decrease of electrostatic interactions, which is also supported by results from Higgins and Luthy (2006). Also Chen et al. (2009) reports pH dependence and states it is likely that the pH effects are due to pH-dependent changes in sorbent rather than pro-tonation/deprotonation of the sorbate. With the increase of pH, adsorbent surfaces tend to become more negatively charged (or less positively charged) via the protonation and deprotonation of some surface functional groups, leading to stronger electrostatic repulsion for anionic PFASs. In contrast, increasing concentration of ions can compress the electrical double layers of sorbents, which weakens not only the electrostatic interactions (attraction or repul-sion) between sorbent surfaces and PFAS molecules but also the electrostatic repul-sion between the anionic PFASs themselves (Du et al., 2014).
2.2.5. Influence of anions and cations As stated in 2.2.4. Influence of pH, sorption of PFASs changes with pH. However, when a sufficient amount of divalent cations are present in solution, the influence of pH changes (Chen et al., 2009; Du et al., 2014; Tang et al., 2010; You et al., 2010). This has been reported for Ca2+ and Mg2+ and is due to the fact that adsorbent surfaces de-velop more basic sites to bind divalent cations when pH increases. The potential mechanisms behind these results are increased sorption of PFASs by divalent cation bridging effect between perfluorochemicals, salting-out, competitive adsorption with inorganic anions and electrical double layer compression (Du et al., 2014; Wang et al., 2012). Results from You et al. (2010) showed that the sorption of PFOS onto sediment increased threefold as the Ca+2 concentration increased from 0.005 to 0.5 M at pH 7.0, and nearly sixfold at pH 8.0. Higgins and Luthy (2006) showed that Na+ has little or no effect on sorption although the experiment were conducted with similar ranges of ionic strength as Ca2+, and that implies that the observed changes are not simply ionic strength (Higgins and Luthy,

8
2006). Higgins and Luthy (2006) interpreted the effects of Ca2+ on sorption as a re-duction in the charge present on the organic matter.
In an sorption experiment with PFOS and BC, Chen et al. (2009) found similar con-clusions, and explained the results as the screening effect when Ca2+ partially neutral-izes the negative surface charge by specific interactions between the functional groups present in the BC and Ca2+ resulting in an increase in the attractive forces between the surface of the BC and the anionic PFOS and in turn resulted in an increase in sorption. The effect on trivalent ions, such as Al3+, on sorption has yet not been investigated thoroughly, but it has potential to affect sorption even stronger than the divalent ions because it has a higher potential of neutralizing the negatively charged surface of the organic matter and therefore decrease the repulsive effect of the negatively charged PFASs.
2.2.6 Acid dissociation constants, pKa Both PFCAs and PFSAs are relatively strong acids, where PFSAs are stronger, and tend to dissociate to anionic form in the pH range of most natural systems (Rayne and Forest, 2009). The pKa value describes the tendency of an acid to dissociate to its con-jugate acid-base pair, with a low pKa meaning that a compound has a stronger ten-dency to dissociate to its conjugate ions (Rayne and Forest, 2009). pKa for the com-pounds in this study are -0.22–0.05 for PFCAs, 0.14 for PFSAs and 6.65 for FOSA (Table 1).
3. MATERIAL AND METHODS 3.1. EXPERIMENT SETUP To study the influence of pH, and cation concentration on sorption of PFASs to or-ganic matter, known concentrations of sodium-, calcium- and aluminium nitrate re-spectively were added to an organic soil along with different ratios of acid and base to create an adequate pH-range. A pre-test of nine samples was designed to establish additions for adequate acid-base equilibrium. Before shaking, the samples were spiked with the 14 different PFASs.
3.2. SOIL CHARACTERISTICS The soil was a mor sample with high carbon content from a spodosol and was col-lected in 2011 in central Sweden (Risbergshöjden, 59°43'00″N15°01′59″E), and since then kept refrigerated in its field-moist state (Gustafsson et al., 2014a). The soil was sieved through a 2 mm sieve to remove roots and larger particles. The water content was at the time of this study 66%, determined by drying in a 105°C oven for 24h.
Gustafsson et al. (2014) determined the concentrations of geochemically active Al, Ca, Cr, Fe, K, Mg, Mn and Cr (Appendix I). Carbon and nitrogen content were 45 % and 1.3% respectively, on dry-weight basis.
3.3. PFAS SPIKING SOLUTION Equimolar stock solution of 14 PFASs solved in methanol (c = 5 µg/mL) of PFBA, PFPeA, PFHxA, PFHpA, PFOA, PFNA, PFDA, PFUnDA, perfluorododecanoate (PFDoDA), perfluorotetradecanoate (PFTeDA), PFBS, PFHxS, PFOS and FOSA (Table 1) was purchased from Sigma-Aldrich. Internal standards (IS) for the PFASs

9
included the mass labeled compounds 13C4PFBA, 13C2 PFHxA, 13C4 PFOA, 13C5 PFNA, 13C2 PFDA, 13C2 PFUnDA, 13C2 PFDoDA, 18C2 PFHxS, 13C4 PFOS, M8FOSA, d3-N-MeFOSAA, d5-N-EtFOSAA, d3-N-MeFOSA, d3-N-EtFOSA, d7-N-MeFOSE and d9-N-EtFOSE, all purchased from Wellington Laboratories (purity 99%).
3.4. BATCH SORPTION EXPERIMENT
3.4.1. Pilot experiment The desired pH for the main experiment was pH 3, 4, 5 and 6. To determine adequate additions of HNO3 and NaOH to achieve these values, the chemical equilibrium model Visual MINTEQ was used (Gustafsson, 2013). To confirm the output from the model, a pilot batch experiment of nine samples was conducted. These samples were not spiked with PFASs standard.
Solution To vary the cation concentration, different volumes of dissolved nitrate salts were added to the solution (Table 3). 30 mM NaNO3, 30 mM Ca(NO3)2, 20 mM Al(NO3)3 solutions were prepared in volumetric flasks using Millipore-water. NaNO3 were added to all samples to keep the nitrate concentration constant. Three series of sam-ples were prepared with final concentration 10 mM NaNO3, 3 mM Ca(NO3)2 and 2 mM Al(NO3)3 respectively. Concentrations were chosen to reflect naturally occurring levels in soil water, and within the same range as earlier studies (Chen et al., 2009; Higgins and Luthy, 2006). To vary pH in the solution, different volumes (Table 3) of 20 mM HNO3 and 20 mM NaOH solutions were added, prepared with Millipore water (Millipak, 0.22 µm filter) in volumetric flasks. Table 3. Amounts (mL) of acid, base and nitrate salts added to the different samples in the pilot batch experiment.
[mL)] 30 mM NaNO3
20 mM HNO3
20 mM NaOH
30 mM Ca(NO3)2
20 mM Al(NO3)3
H2O
Modelled pH
Measured pH
Sodium Na a 10 6 0 0 0 14 2.6 2.7 Na b 10 0 3 0 0 17 4.7 4.7 Na c 10 0 9 0 0 11 6.6 6.0 Calcium Ca a 4.0 3.0 0 3.0 0 20 2.9 2.9 Ca b 4.0 0 6.0 3.0 0 17 4.7 4.6 Ca c 4.0 0 11 3.0 0 13 6.3 5.7 Aluminium Al a 4.0 1.5 0.0 0 3.0 22 2.8 2.7 Al b 4.0 0 9.0 0 3.0 14 4.7 4.7 Al c 4.0 0 14 0 3.0 9.5 6.3 5.7

10
Addition of soil 1.0 g of soil was added to each of the 50 mL polypropylene (PP) tubes (Corning 430290 50 mL centrifuge tube, non-pyrogenic polypropylene), to which 30 mL of solution containing acid/base, cations and Millipore water was added, resulting in a liquid to solid ratio of 91 mL g-1.
Handling of samples According to Higgins and Luthy (2006), shaking for 7-days is sufficient to reach equi-librium. The nine samples were sealed and mounted laying down on a horizontal shaker (Gerhardt), set to 133 rpm and left for 7 days (168h). Immediately after shak-ing was finished, the samples were centrifuged (Eppendorf Centrifuge 5810) for 20 min at 3000 rpm and pH measured.
3.4.2. Main experiment
Acid-base equilibrium A combination of model output and measured pH (Table 3) from the pilot batch ex-periment was used to come up with the additions of HNO3 and NaOH for the main experiment, presented in Table 4, using same prepared stock solutions as above.
Addition of cations Four series of samples were prepared with final concentrations of 10 mM NaNO3, 3 mM Ca(NO3)2 (low concentration), 5 mM Ca(NO3)2 (high concentration) and 2 mM Al(NO3)3 respectively (Table 4), using same prepared stock solutions as above.
Addition of soil 1.33 g of soil was added to each of the 50 mL PP tubes, to which 40 mL of solution containing acid/base, cations and Millipore water was added, resulting in a liquid to solid ratio of 91 mL g-1.
Spiking The PFASs standard was added to the samples before shaking using a disposable 10 µL glass pipette. This resulted in a theoretical initial aqueous concentration of 1248 ng L-1 of each compound or 50 ng per 40 mL sample.
Handling of samples As for the pilot batch experiment, spiked samples were sealed and mounted laying down on a horizontal shaker set to 133 rpm and left for 7 days (168h). Immediately after shaking was finished, the samples were centrifuged for 20 min at 3000 rpm and the liquid decanted into new rinsed PP tubes and stored in a refrigerator until further analysis. The samples of the main experiment were prepared in duplicates, along with positive (PFASs spike in Millipore water, no soil) and negative (Millipore water) con-trols. In total 36 samples were prepared, of which 32 contained soil.

11
Table 4. Amounts (mL) of acid, base, water and Na+, Ca2+ and Al3+ solutions added to the different samples. The pH stated is the target value.
[mL] 30 mM NaNO3
20 mM HNO3
20 mM NaOH
30 mM Ca(NO3)2
20 mM Al(NO3)3
H2O (Millipore)
Sodium Na pH 3 13 4.0 0 0 0 23 Na pH 4 13 0 2.0 0 0 25 Na pH 5 13 0 6.0 0 0 21 Na pH 6 13 0 12 0 0 15 Calcium low con-centration Ca pH 3 [3 mM] 5.3 4.0 0 4.0 0 27 Ca pH 4 [3 mM] 5.3 0 4.0 4.0 0 27 Ca pH 5 [3 mM] 5.3 0 10 4.0 0 21 Ca pH 6 [3 mM] 5.3 0 15 4.0 0 16 Calcium high con-centration Ca pH 3 [5 mM] 5.3 4.0 0 6.7 0 24 Ca pH 4 [5 mM] 5.3 0 4.0 6.7 0 24 Ca pH 5 [5 mM] 5.3 0 10 6.7 0 18 Ca pH 6 [5 mM] 5.3 0 15 6.7 0 13 Aluminium Al pH 3 5.3 0 0 0 4.0 31 Al pH 4 5.3 0 10 0 4.0 21 Al pH 5 5.3 0 14 0 4.0 17 Al pH 6 5.3 0 20 0 4.0 11 Controls ! ! ! ! ! !Negative (water) 0 0 0 0 0 40 Positive (water + PFASs)
0 0 0 0 0 40
3.5. CHEMICAL ANALYSES
3.5.1. PFAS analysis Due to limited time and resources, only the liquid phase was analysed for PFAS con-tent, with the presumption that the difference between added known concentration of PFASs and the measured concentration of the liquid phase accurately enough reflects the sorbed PFAS concentration.
Preparation of samples All samples were filtered through multiple 0.45 µm syringe filters (VWR Interna-tional 25 mm syringe filters, nylon and polypropylene), all rinsed thrice with metha-nol. 10 mL (measured by weight) sample was spiked with 100 µL internal standard (PFAS IS) using automatic micro-pipette, in order to correct for any potential losses of PFASs during the extraction and the following concentration.
Solid phase extraction for the filtrated water Solid phase extraction (SPE) WAX cartridges (Oasis WAX 6cc Cartridge, 150 mg, 30 µg) were prepared for extraction by passing through 4 mL ammonium hydroxide in methanol (0.1 %), followed by 4 mL methanol and 4 mL Millipore water, before load-ing with the samples which passed through by gravity (Figure 1). Lastly, 4 mL of buf-

12
fer solution (25 mM ammonium acetate, pH 4) concluded the extraction phase. The cartridges were then dried in centrifuge, at 3000 rpm for two minutes.
Figure 1. Samples loaded into SPE cartridges mounted to a manifold.
Elution At this point all PFASs were sorbed to the resin material in the cartridges. Elution was carried out by passing first 4 mL of methanol and then 4 mL of ammonium hydroxide in methanol (0.1 %) into 15 mL PP tubes first rinsed with methanol.
Concentration In order to concentrate the samples down to the final volume of 1 mL, evaporation by nitrogen gas was used (N-EVAP 112, Nitrogen Evaporator from Organomation Asso-ciates Inc.). The concentrated liquid was transferred to small brown glass vials using disposable glass pipettes and reduced to 1 mL (Figure 2). The samples were stored in a freezer until analysis.
Figure 2. Concentration of eluted samples using N2 stream. Left picture show 15 mL PP bot-tles before transfer to small brown glass vials (right).
Instrumental analysis The extracted samples were analyzed according to method described by Ahrens et al. (2009) and calculated using the computer program Agilent Technologies Masshunter Quantitative Analysis. All integrations were checked manually. The instrument used was a high-performance liquid chromatography coupled with tandem mass spec-

13
trometry (HPLC-MS/MS), (Agilent Technologies 1200 series and Agilent Technolo-gies 6040 Triple Quad LC/MS).
3.5.2. pH Immediately following centrifugation of soil/solution mixture, pH was measured di-rectly in the tubes at room temperature using a two-point calibrated PHM 93 reference pH meter from Radiometer Copenhagen.
3.5.3. Dissolved organic carbon Half of the decanted liquid was filtered through 0.45 µm syringe filters (Acrodisc 32 mm syringe filters with Supor Membrane), and sent to ALS Scandinavia for analysis of dissolved organic carbon (DOC) for later use in Visual MINTEQ model (Appendix II).
3.5.4. Quality assurance/quality control (QA/QC) Negative and positive control samples were utilized. PFASs levels in negative control samples (water) were all below detection limit. Losses of PFASs to container walls in positive control samples (water + PFASs) were corrected for by using reference stan-dard (10 µL PFASs standard with 100 µL PFAS IS in methanol), which represents exact actual spiked concentration. The samples of the main experiment were prepared in duplicates. In total 36 samples were prepared, of which 32 contained soil.
Relative error between duplicates for compounds with shorter perfluorocarbon chain lengths (C3-C8 for PFCAs and C4 for PFSAs) were smaller (1.5-13%) than for longer perfluorocarbon chains (C9-C13 for PFCAs, C6-C8 for PFSAs and FOSA (C8)) where relative error ranged from 20 to 49% due to strong adsorption and therefore levels in liquid phase close to detection limit. Average relative error for whole dataset was 22%.
3.6. MODELLING OF NET CHARGE USING VISUAL MINTEQ Visual MINTEQ is a freeware chemical equilibrium model originally built on USEPA’s MINTEQA2 software, for natural waters, calculating for example acid-base equilibrium, metal speciation, solubility equilibrium and sorption (Gustafsson, 2013). In this study, Visual MINTEQ was used first to find suitable pH, and later to model net charge on the soil in the samples, which is dependent on pH, DOC, humic and fulvic acids and concentration of cations and anions. Measured pH and DOC (Appendix II) and added Na-, Ca- and Al-nitrates (Table 4) together with concentrations of Mg, Fe, Mn, K, active humic acid (HA) and active fulvic acid (FA) from earlier analysis of the soil (Appendix I) were used as input. In-put and output files can be found in Appendix I. The overall net charge (Z−) of the soil organic matter is given as mol L-1. Ion concen-trations was entered as fixed in the model, meaning that Visual MINTEQ calculated the concentrations of solid-phase organic complexes that were in equilibrium at the given dissolved concentrations. The net charge is calculated as the sum of the charge contributions from various different organic matter species in the solid phase. In the simple case of fulvic acid and with Al3+ and Ca2+ present in the soil solution, the value of Z− is given by:

14
Z− = RO− - ROCa+ - (RO)2Al+ (1) where RO− is a dissociated functional group (carboxylate group), ROCa+ is a complex involving one functional group and one Ca2+ ion, whereas (RO)2Al+ involves two functional groups and one Al3+ ion. The Z−-value indicates the sum of negative charge on the organic matter (Löfgren et al., 2010).
3.7. DATA ANALYSIS Since no extraction of PFASs in solid phase was done, the fraction sorbed to soil par-ticles was approximated by the following formula: cs = (mstd – mw) / msoil (2)
where cs is the adsorbed PFAS on soil in ng g-1. mstd is the mass of the spiked stan-dard, mw is the measured mass of the spiked compound in the aqueous phase of the sample and msoil is the weight of the soil added. Where negative values on cs were observed, the values were set to 0. The particulate associated fraction ϕ (%) was calculated using the following formula:
ϕ = (ms / mstd) ⋅ 100 (3)
where ms is the approximated amount sorbed to the solid phase in ng. The sediment–water distribution coefficient, Kd, was calculated using the following linear sorption model (Ahrens et al., 2011): Kd = cs / cw (4)
where cw is the concentration of PFAS in the aqueous phase in ng mL-1. Unit for Kd is mL g-1. The organic carbon normalised partition coefficient, KOC, was calculated by the fol-lowing formula (Ahrens et al., 2011): KOC = Kd / fOC (5)
where fOC is the fraction organic carbon in g C g-1 and the unit of KOC is mL g-1 (milli-litres per gram organic carbon).

15
4. RESULTS 4.1. BATCH SORPTION EXPERIMENT
4.1.1. PFCAs Concentrations of the different PFCAs detected in the liquid phase vary, with concen-trations close to initial concentration for shorter-chained compounds (PFBA, PFPeA, PFHxA), and with concentrations close to zero for longer-chained compounds (PFDA, PFUnDA, PFDoDA, PFTeDA) (Figure 3). The measured initial concentration (reference standard) was used for the calculation of the sorption behavior of PFASs ranging from 450 ng L-1 (PFTeDA) to 925 ng L-1 (PFHxA). The deviation from the theoretical spiking concentration (i.e. 1248 ng L-1) could be due to the age of the stan-dard and loss due to sorption to the glass wall, but should not be a problem. For PFCAs, a high variation of the individual PFCA concentrations was observed between the initial and final concentrations (after sorption experiments) in the liquid phase. The final concentration of PFHpA ranged between 500 and 790 ng L-1, PFOA between 190 and 680 ng L-1 and PFNA between 25 and 340 ng L-1. Evident differ-ences in the PFCAs concentrations between the different cations series could be ob- served for these compounds, with the series for NaNO3 and 3 mM Ca(NO3)2 showing similar high concentrations, while Al(NO3)3 and 5 mM Ca(NO3)2 appear in lower concentrations in the liquid phase (Figure 3). Generally, concentrations for these com-pounds in the liquid phase increase with increasing pH. PFBA shows up in higher concentrations for some samples, in the liquid phase than in the reference samples (initial concentration), which is likely due to measurement uncertainties.

16
Con
cent
ratio
n [n
g L
-1]
pH pH
Al(NO3)3 [2 mM] Ca(NO3)2 [3 mM] NaNO3 [10 mM] Ca(NO3)2 [5 mM]
Initial concentration
pH
Figure 3. Concentration of PFCAs in solution (ng L-1) as a function of pH after the sorption experiments using Al(NO3)3 [2 mM], NaNO3 [10 mM], Ca(NO3)2 [3 mM] and Ca(NO3)2 [5 mM]. Black line represents measured in-itial concentrations, measured during the same run. Error bars represent standard deviations of duplicate sam-ples.
0 200 400 600 800
1000
2 3 4 5 6 0
200
400
600
800
1000
2 3 4 5 6 0
200 400 600 800
1000
2 3 4 5 6
0 200 400 600 800
1000
2 3 4 5 6 0
200
400
600
800
1000
2 3 4 5 6 0
200
400
600
800
1000
2 3 4 5 6
0 200 400 600 800
1000
2 3 4 5 6 0
200 400 600 800
1000
2 3 4 5 6 0
200 400 600 800
1000
2 3 4 5 6
0
200
400
600
800
1000
2 3 4 5 6
PFBA PFPeA PFHxA
PFHpA
PFNA
PFOA
PFDA PFUnDA
PFDoDA
PFTeDA

17
4.1.2. PFSAs and FOSA As shown in Figure 4, concentrations of the different PFSAs detected in the liquid phase also vary, as for the PFCAs, with concentrations close to initial concentration for the short-chained PFBS and with concentrations close to zero for the long-chained PFOS. For PFHxS, the concentrations span almost the whole range (17 to 560 ng L-1), with the series for NaNO3 and 3 mM Ca(NO3)2 showing similar high concentrations, while Al(NO3)3 and 5 mM Ca(NO3)2 appear in lower concentrations in the liquid phase. FOSA, with the same chain length as PFNA and PFOS, occur in concentrations close to zero, with initial concentration of 825 ng L-1. PFBS show up in higher concentrations for some samples, in the liquid phase than in the reference (initial concentration), which is likely due to measurement uncertainties. Results from analysis are found in Appendix V.
pH pH
Con
cent
ratio
n [n
g L
-1]
Al(NO3)3 [2 mM] Ca(NO3)2 [3 mM] NaNO3 [10 mM] Ca(NO3)2 [5 mM]
Initial concentration
pH
Figure 4. Concentration of PFSAs and FOSA in solution (ng L-1) as a function of pH after the sorption ex-periments using Al(NO3)3 [2 mM], NaNO3 [10 mM], Ca(NO3)2 [3 mM] and Ca(NO3)2 [5 mM]. Black line represents measured initial concentrations, measured during the same run. Error bars represent standard deviations of duplicate samples.
0 200 400 600 800
1000 1200
2 3 4 5
0 200 400 600 800
1000
2 3 4 5
0 200 400 600 800
1000
2 3 4 5 6
0 200 400 600 800
1000
2 3 4 5
PFBS
PFHxS
PFOS
FOSA

18
4.2. INFLUENCE OF CARBON CHAIN LENGTH AND FUNCTIONAL GROUPS ON SORPTION OF PFASs TO SOIL The fraction of PFASs that adsorbs to particles can be described by the particulate associ-ated fraction (%, Eq. 3). A clear trend between average increasing particulate associated fraction from all samples (n = 31) and perfluorocarbon chain length was observed for C3-C9 PFCAs (2.6-99%) and PFSAs (C4-C8, 8.2-99 %), (Figure 5). For the four PFCAs with the longest chains (i.e. PFDA, PFUnDA, PFDoDA, PFTeDA), the particulate associated fraction was close to 100%, and no clear trend visible among them. FOSA sorbed to nearly 100%.
Figure 5. Particulate associated fraction of the different PFASs, grouped by PFCAs, PFSAs and FOSA, between solid (dark) and liquid (light) phase. Values represent the average for all samples (i.e. all tested pH-values and solution chemistries, n=31). The perfluorocarbon chain length in-creases to the right.
Another measure of sorption to soil is the Kd, which is normalised for solution volume and soil weight (Eq. 4), with a high Kd representing high sorption (i.e. large particulate associated fraction) and vice versa. Figure 6 shows the relationship between log Kd and the length of the fluorocarbon chain for PFCAs, PFSAs and FOSA, respectively. As with the associated particulate fraction, there was a clear trend between increased adsorption (i.e. higher log Kd) and increasing perfluorocarbon chain length. The log Kd for PFSAs increased from 0.3 to 3.6 mL g-1 for PFBS (C4) to PFOS (C8) (R2=0.98). For PFCAs, the log Kd increased linearly from -0.1 (C3) to 3.8 ml g-1 (C10) (R2=0.93), and then tapered off.

19
The PFSAs (sulfonate functional group) adsorbed more strongly (slope 0.84) than the PFCAs (carboxylic functional group, slope 0.60) for the same number of carbon atoms in the chain. The FOSA adsorbed the strongest, with log Kd value of 4.2 ml g-1. Similar trends for KOC (Eq 5) were observed (Table 5). Average Kd and KOC for the different cat-ion-series are found in Appendix VI along with all Kd-values in Appendix VII.
Figure 6. Average log partitioning coefficient (Kd) as a function of perfluorocarbon chain length for PFCAs, PFSAs and FOSA. Lines represent linear regressions for PFSAs (i.e. PFBS (C4) to PFOS (C8)) and PFCAs (i.e. PFBA (C3) to PFUnDA (C10)). Error bars represent standard devi-ation of all samples for each compound (i.e. all tested pH-values and solution chemistries, n = see Table 5).
Table 5. Average Log Kd and log KOC for all samples, with standard deviation. Kd calculated by Eq. 4 and KOC calculated by Eq. 5. [mL g-1] Log Kd Log KOC Compound ± SD ± SD (n) PFBA -0.1 ± 0.6 0.2 ± 0.6 (19) PFPeA 0.4 ± 0.3 0.7 ± 0.3 (30) PFHxA 0.4 ± 0.4 0.8 ± 0.4 (31) PFHpA 0.9 ± 0.3 1.2 ± 0.3 (31) PFOA 1.4 ± 0.4 1.8 ± 0.4 (31) PFNA 2.2 ± 0.5 2.7 ± 0.5 (31) PFDA 3.5 ± 0.4 4.0 ± 0.4 (31) PFUnDA 3.8 ± 0.6 4.3 ± 0.6 (31) PFDoDA 3.5 ± 0.6 4.0 ± 0.6 (31) PFTeDA 3.6 ± 0.7 4.0 ± 0.7 (31) PFBS 0.3 ± 0.8 0.7 ± 0.8 (18) PFHxS 1.6 ± 0.7 2.0 ± 0.7 (31) PFOS 3.6 ± 0.8 4.1 ± 0.4 (31) FOSA 4.1 ± 0.9 4.6 ± 0.5 (31)
y = 0.8x - 4.6 R² = 0.98
y = 0.6x - 3.8 R² = 0.93
-2
-1
0
1
2
3
4
5
6
2 3 4 5 6 7 8 9 10 11 12 13
log
Kd [m
L g-1
]
Perfluorocarbon chain length
PFCAs PFSAs FOSA

20
4.3. INFLUENCE OF CATIONS, PH AND NET NEGATIVE CHARGE ON SORPTION OF PFASs TO SOIL
The net charge of the soil surface is dependent on the pH. Figure 7 shows how the modelled net negative charge changed with pH for Al(NO3)3 [2 mM], NaNO3 [10 mM], Ca(NO3)2 [3 mM] and Ca(NO3)2 [5 mM]. For low pH (~3) the difference be-tween the NaNO3 and the two Ca(NO3)2-series were small (± 9 %), with Al(NO3)3 being lower. For NaNO3, the relation was linear for the interval. The two Ca(NO3)2-series compared with Al(NO3)3 showed inverse correlations, with Ca(NO3)2 increas-ing rapidly and then taping off, whereas Al(NO3)3 started off slow and then increased rapidly presenting a higher value for pH~6.
Figure 7. Modelled net charge as a function of pH (measured).
4.3.1. Influence of cations and pH on sorption of PFASs to soil
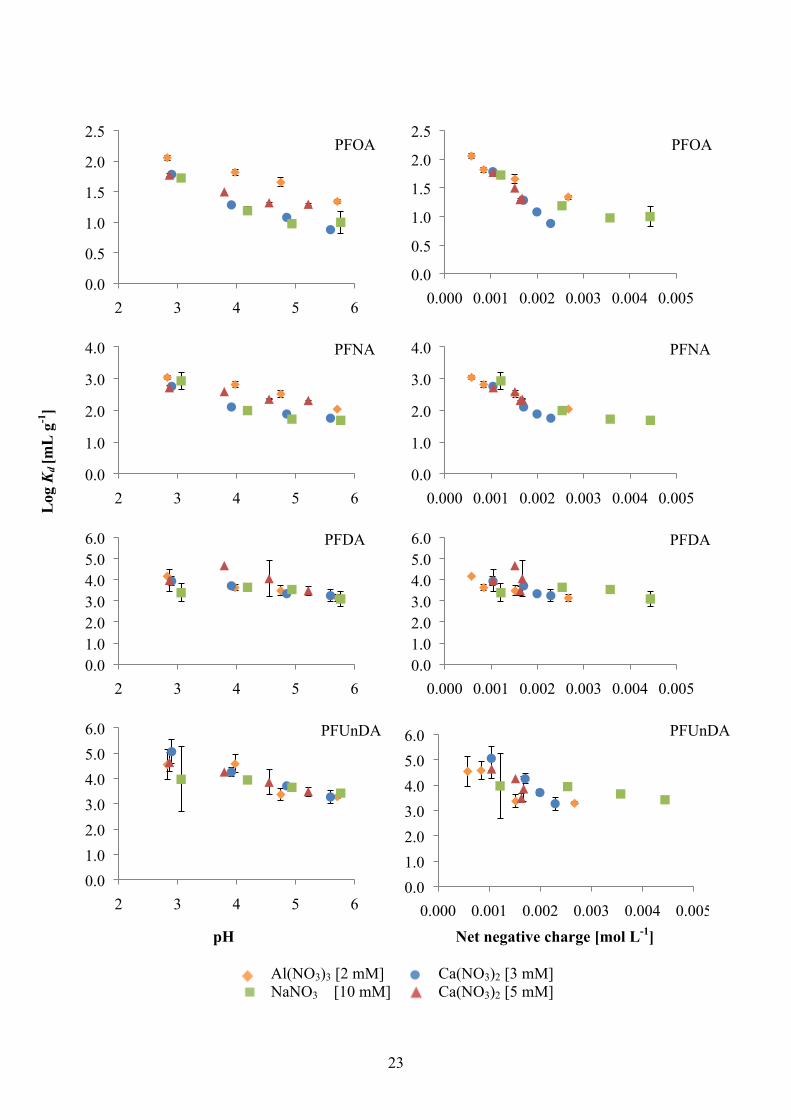
PFCAs The calculated log Kd values were plotted against pH for PFCAs (Figure 8), and PFSAs and FOSA (Figure 9). For most PFCAs, there was a general trend of decreas-ing sorption with increasing pH, with the exception of PFBA (C3) that showed no correlation and PFPeA (C4) but instead showed increasing log Kd with increasing pH for Al(NO3)3 (0.5–0.9 mL g-1), NaNO3 (0.0–0.7 mL g-1) and Ca(NO3)2 with the higher concentration (5 mM) (0.2–0.5 mL g-1). PFHxA (C5, log Kd range -0.2–0.9 mL g-1), PFHpA (C6, log Kd range 0.4– 1.3 mL g-1), PFOA (C7, log Kd range 0.9–2.1 mL g-1) and PFNA (C8, log Kd range 1.7–3.0 mL g-1) showed decreasing sorption with in-creasing pH, and also distinct difference among the cation-series. The Al(NO3)3-series presented the highest log Kd-values consistently over the pH interval for these com-pounds, followed by Ca(NO3)2 (5 mM). Ca(NO3)2 (3 mM) and NaNO3 appeared with similar range of values. For lower pH, the differences between the different series were small, with very little difference between the sodium- and the two calcium-series. As pH increaseed, the difference was more pronounced. For PFDA (C9, log Kd range 3.1–4.7 mL g-1), PFUnDA (C10, log Kd range 3.3–5.1 mL g-1), PFDoDA (C11, log Kd range 3.1–4.5 mL g-1) and PFTeDA (C13, log Kd range 3.0–4.7 mL g-1), the log Kd were in the same range and there was less or no influence by the different cations.
Al(NO3)3 [2 mM]
NaNO3 [10 mM]
Ca(NO3)2 [3 mM]
Ca(NO3)2 [5 mM] 0
0.001
0.002
0.003
0.004
0.005
2 3 4 5 6
Net
neg
ativ
e
char
ge [m
ol L
-1]
pH

21
PFSAs and FOSA PFBS (C4, Kd range -1.2–1.2 mL g-1), PFHxS (C6, Kd range 1.0–3.1 mL g-1) and PFOS (C8, Kd range 3.5–4.1 mL g-1) (Figure 9), showed no evident trend with pH. There was however a large difference between the cation-series, for PFHxS, with Al(NO3)3 (2.4–3.1 mL g-1) having two to three times higher log Kd than Ca(NO3)2 (5 mM), Ca(NO3)2 (3 mM) and NaNO3, which all appeared within the same range of values (1.0–1.6 mL g-1). FOSA (C8, Kd range 3.6–5.1 mL g-1), however, showed a decreasing trend with increasing pH, similar to the one of the long-chained PFCAs (C10-C13, Figure 8).
4.3.2. Influence of cations and net negative charge on sorption of PFSAs to soil
PFCAs PFBA and PFPeA showed no clear correlations with net negative charge, however for fluorocarbon chains C5 and longer (PFHxA–PFTeDA) there were decreasing trends with increasing pH, especially linear for net negative charge 0-0.025 mol L-1. The differences between the different cation-series were not prominent, except for the NaNO3 that showed higher values of net negative charge, in agreement with Figure 7.
PFSAs and FOSA PFBS, PFHxS and PFOS (Figure 9) showed no evident trend with net negative charge. But as for pH, there was a large difference between the cation-series, for PFHxS, with Al(NO3)3 appearing above Ca(NO3)2 (5 mM), Ca(NO3)2 (3 mM) and NaNO3 in the graph. FOSA however, showed a similar net negative charge trend as the long-chained PFCAs (C10-C13, Figure 8).

22
Log
Kd [m
L g
-1]
pH Net negative charge [mol L-1]
Al(NO3)3 [2 mM] Ca(NO3)2 [3 mM] NaNO3 [10 mM] Ca(NO3)2 [5 mM]
-2.5 -2.0 -1.5 -1.0 -0.5 0.0 0.5 1.0
2 3 4 5 6 -2.5 -2.0 -1.5 -1.0 -0.5 0.0 0.5 1.0
0.000 0.001 0.002 0.003 0.004 0.005
-0.4 -0.2 0.0 0.2 0.4 0.6 0.8 1.0
2 3 4 5 6
-0.4 -0.2 0.0 0.2 0.4 0.6 0.8 1.0
0.000 0.001 0.002 0.003 0.004 0.005
-1.0
-0.5
0.0
0.5
1.0
1.5
2 3 4 5 6
-1.0 -0.5 0.0 0.5 1.0 1.5
0.000 0.001 0.002 0.003 0.004 0.005
0.0
0.5
1.0
1.5
2 3 4 5 6 0.0
0.5
1.0
1.5
0.000 0.001 0.002 0.003 0.004 0.005
PFBA PFBA
PFPeA PFPeA
PFHxA
PFHxA
PFHpA PFHpA
23
Log
Kd [m
L g
-1]
pH Net negative charge [mol L-1]
Al(NO3)3 [2 mM] Ca(NO3)2 [3 mM] NaNO3 [10 mM] Ca(NO3)2 [5 mM]
0.0
0.5
1.0
1.5
2.0
2.5
2 3 4 5 6
0.0
0.5
1.0
1.5
2.0
2.5
0.000 0.001 0.002 0.003 0.004 0.005
0.0
1.0
2.0
3.0
4.0
2 3 4 5 6 0.0
1.0
2.0
3.0
4.0
0.000 0.001 0.002 0.003 0.004 0.005
0.0 1.0 2.0 3.0 4.0 5.0 6.0
2 3 4 5 6 0.0 1.0 2.0 3.0 4.0 5.0 6.0
0.000 0.001 0.002 0.003 0.004 0.005
0.0 1.0 2.0 3.0 4.0 5.0 6.0
2 3 4 5 6 0.0 1.0 2.0 3.0 4.0 5.0 6.0
0.000 0.001 0.002 0.003 0.004 0.005
PFOA PFOA
PFNA PFNA
PFDA
PFDA
PFUnDA PFUnDA

24
Log
Kd [m
L g
-1]
pH Net negative charge [mol L-1]
Al(NO3)3 [2 mM] Ca(NO3)2 [3 mM] NaNO3 [10 mM] Ca(NO3)2 [5 mM]
Figure 8. Logarithm distribution coefficient (Kd) as a function of pH (left) and net negative charge (right) for PFCAs. Error bars represents standard deviation between duplicate samples.
0.0 1.0 2.0 3.0 4.0 5.0 6.0
2 3 4 5 6 0.0 1.0 2.0 3.0 4.0 5.0 6.0
0.000 0.001 0.002 0.003 0.004 0.005
0.0
1.0
2.0
3.0
4.0
5.0
6.0
2 3 4 5 6 0.0
1.0
2.0
3.0
4.0
5.0
6.0
0.000 0.001 0.002 0.003 0.004 0.005
PFDoDA PFDoDA
PFTeDA PFTeDA

25
Log
Kd [m
L g
-1]
pH Net negative charge [mol L-1]
Al(NO3)3 [2 mM] Ca(NO3)2 [3 mM] NaNO3 [10 mM] Ca(NO3)2 [5 mM]
Figure 9. Logarithm distribution coefficient (Kd) as a function of pH (left) and net negative charge (right) for PFSAs and FOSA. Error bars represents standard deviation between duplicate samples.
-2.0
-1.0
0.0
1.0
2.0
2 3 4 5 6 -2.0
-1.0
0.0
1.0
2.0
0.000 0.001 0.002 0.003 0.004 0.005
0.0
1.0
2.0
3.0
4.0
2 3 4 5 6
0.0
1.0
2.0
3.0
4.0
0.000 0.001 0.002 0.003 0.004 0.005
1.0
2.0
3.0
4.0
5.0
6.0
2 3 4 5 6 1.0
2.0
3.0
4.0
5.0
6.0
0.000 0.001 0.002 0.003 0.004 0.005
1.0 2.0 3.0 4.0 5.0 6.0
2 3 4 5 6 1.0 2.0 3.0 4.0 5.0 6.0
0.000 0.001 0.002 0.003 0.004 0.005
PFBS PFBS
PFHxS PFHxS
PFOS
PFOS
FOSA FOSA

26
5. DISCUSSION
5.1. BATCH SORPTION EXPERIMENTS Concentrations of individual PFASs detected in the liquid phase varied (Figure 8 and Figure 9), with concentrations close to the initial concentration for shorter-chained compounds (i.e. low sorption to soil particles) and with concentrations close to zero for longer-chained compounds. This indicates that the longer the perfluorocarbon chain length, and the stronger the influence of the functional group, the more likely that the compounds will adsorb to soil particles. PFBA and PFBS showed for some samples slightly higher concentrations in the liquid phase in the soiled samples than for the reference due to analytical uncertainties, thus the log Kd and log KOC for PFBA should be handled with care (Table 6). PFDA, PFUnDA, PFDoDA, PFTeDA, PFOS and FOSA were found in levels close to the detection limit and hence these data are more uncertain and with higher relative errors than the other compounds.
5.2. INFLUENCE OF CARBON CHAIN LENGTH AND FUNCTIONAL GROUPS ON SORPTION OF PFASs TO SOIL
Sorption of PFASs to organic matter is a balance between two counteracting forces: firstly attraction forces between the hydrophobic ‘tail’ (i.e. perfluorocarbon chain) of PFASs and hydrophobic parts of soil organic matter and secondly repulsion forces between the negatively charged ‘head’ (functional group) of the PFASs molecules and the negatively charged carboxylic groups of soil organic matter. In accordance with earlier research, the adsorption of PFASs in this study was strongly correlated with perfluorocarbon chain length (Ahrens et al., 2010; Du et al., 2014; Higgins and Luthy, 2006; Labadie and Chevreuil, 2011), where the longer the perfluorocarbon chain (i.e. more hydrophobic) the stronger the adsorption to particles was (Figure 5 and Figure 6). This can be explained with the increase in hydrophobic attraction forces between PFAS molecules and organic matter with increased carbon chain length of the PFAS molecule. The log Kd and perfluorocarbon chain length dis-played a positively linear relationship for all PFSAs and for C3 to C10 for PFCAs (Figure 6).
As reported in previous studies (Ahrens et al., 2010; Higgins and Luthy, 2006), this study also found that the PFSAs sorbed stronger to particles than PFCAs. This indi-cates that the functional group has an impact on sorption, due to the electrostatic negatively charged functional group of the PFAS molecule functional head (Du et al., 2014). The calculated log Kd (Eq. 4) and log KOC (Eq. 5) were compared to previous studies (Table 6). In general, the log Kd, and log KOC were in the same range as previous stud-ies and showed an increasing trend with increased perfluorocarbon chain length, which is also consistent with previous studies (Ahrens et al., 2011, 2010; Higgins and Luthy, 2006; Labadie and Chevreuil, 2011). The differences between values from this study and others could be due to the very different carbon contents (45% for this study compared to 0-10.6%), and the possibility of relationship between carbon con-tent and sorption not behaving linearly.

27
Table 6. Log Kd and log KOC (± standard deviation (SD)) in this study in comparison with log Koc from other studies (Ahrens et al., 2011, 2010; Higgins and Luthy, 2006; Labadie and Chevreuil, 2011).
a Organic soil with 45 % carbon content b Organic carbon content in sediment ranging from 0-10%. c Organic carbon content in sediment ranging from 0-1.6 % d Organic carbon content in sediment ranging from1.5-10.6 %. e Organic carbon content in sediment 4.8% n = number of samples included in the calculation
5.3. INFLUENCE OF CATIONS, PH AND NET NEGATIVE CHARGE ON SORPTION OF PFASS TO SOIL
5.3.1. Influence of pH For most PFCAs, (C5-C13) and FOSA there was a general trend of decreasing log Kd (i.e. sorption), with increasing pH, with the exception of PFBA that shows no correla-tion and PFPeA that rather show increasing log Kd with increasing pH (Figure 8). This is in accordance with previous studies which showed also a negative correlation between the log Kd and increasing pH as also other studies have found (Chen et al., 2009; Du et al., 2014; Higgins and Luthy, 2006; Tang et al., 2010; Wang et al., 2012). In contrast, the PFSAs (Figure 9), showed no clear correlation between log Kd and pH.
Due to the very low pKa of the PFASs (<0.14 for all compounds except FOSA, Table 1), they are predominately present in their ionized form in the aqueous environment (Ahrens et al., 2012). Thus, at the pH range of 3 to 6, as investigated in this study, the PFASs will be present in their ionized form. However, a change of the pH will change the protonation/deprotonation of the sorbate, as with the increase of pH, adsorbent surfaces tend to become more negatively charged (Figure 7) leading to stronger elec-trostatic repulsion, and hence lower sorption (Chen et al., 2009; Higgins and Luthy, 2006). This effect was observed as a trend regardless of perfluorocarbon chain length for the PFCAs and FOSA, although results for C3 and C4 were uncertain.
Log Kd ± SD
Log KOC ± SD
Log KOC ± SD
Log KOC ± SD
Log KOC ± SD
Log KOC ± SD
[mL g-1] This studya This studya (n) Higgins and Luthy, 2006b (n)
Ahrens et al., 2011c (n)
Ahrens et al., 2010d (n)
Labadie and Chevreuil, 2011e (n)
PFBA -0.1 ± 0.6 0.2 ± 0.6 (19) PFPeA 0.4 ± 0.3 0.7 ± 0.3 (30) PFHxA 0.4 ± 0.4 0.8 ± 0.4 (31) 2.1 ± 0.2 (3) PFHpA 0.9 ± 0.3 1.2 ± 0.3 (31) 2.9 ± 0.0 (6) 2.1 ± 0.2 (3) PFOA 1.4 ± 0.4 1.8 ± 0.4 (31) 2.1 ± - (2) 2.4 ± 0.2 (9) 3.5 ± 0.1 (6) PFNA 2.2 ± 0.5 2.7 ± 0.5 (31) 2.4 ± 0.1 (3) 4.0 ± 0.1 (6) 2.9 ± 0.1 (3) PFDA 3.5 ± 0.4 4.0 ± 0.4 (31) 2.8 ± 0.1 (5) 4.6 ± 0.1 (6) 3.8 ± 0.2 (3) PFUnDA 3.8 ± 0.6 4.3 ± 0.6 (31) 3.3 ± 0.1 (5) 5.1 ± 0.1 (6) 4.7 ± 0.1 (3) PFDoDA 3.5 ± 0.6 4.0 ± 0.6 (31) 5.6 ± 0.2 (3) PFTeDA 3.6 ± 0.7 4.0 ± 0.7 (31) PFBS 0.3 ± 0.8 0.7 ± 0.8 (18) PFHxS 1.6 ± 0.7 2.0 ± 0.7 (31) 3.7 ± 0.3 (6) 2.2 ± 0.1 (3) PFOS 3.6 ± 0.4 4.1 ± 0.4 (31) 2.6 ± 0.1 (4) 3.5 ± 0.9 (18) 4.8 ± 0.1 (6) 3.7 ± 0.2 (3) FOSA 2.7 ± 0.5 4.6 ± 0.5 (31) 4.2 ± 1.0 (22) 4.5 ± 0.1 (6)

28
5.3.2. Influence of cations For short and intermediate perfluorocarbon chain length PFCAs (C5-C8) and PFHxS among the PFSAs, cation concentrations had an effect on sorption. The difference between the different cations were smaller at lower pH, with very little difference between the NaNO3- and the two Ca(NO3)2-series (Figure 8 and Figure 9). As pH increased, the differences between the series increased with Al(NO3)3 showing the highest sorption followed by Ca(NO3)2 (5 mM). The adsorption was higher when more calcium ions were present (i.e. higher log Kd for 5 mM Ca(NO3)2 than for 3mM Ca(NO3)2), which also was found also earlier studies (Chen et al., 2009; Higgins and Luthy, 2006; You et al., 2010). There was no clear difference between 3 mM Ca(NO3)2 and NaNO3. For PFDA, PFUnDA, PFDoDA and PFTeDA (C9-C13), the data-points for all cations (i.e. Ca(NO3)2 (5 and 3 mM), Al(NO3)3 and NaNO3) were close together, with no clear trends, indicating that influence by the different cations is less important for sorption at longer perfluorocarbon chains.
According to Higgins and Luthy (2006), the effect of Ca2+ on sorption is due to a re-duction in the charge present (and repulsive forces) on the organic matter, and par-tially neutralizes the negative surface charge by interactions between the functional groups (carboxylic groups) present in the organic matter, resulting in an increase in the sorption between the surface of the organic matter and the PFASs. Higgins and Luthy (2006) observed that this neutralization effect is stronger when the Ca2+-concentration increases, which could be confirmed in this study. Trivalent ions, such as Al3+ have a higher capacity to neutralize surface charge than divalent ions (such as Ca2+), which is why the sorption was stronger with Al(NO3)3 present, even though the Al(NO3)3-concentration was lower (2 mM) than for Ca(NO3)2 (3 and 5 mM respec-tively). NaNO3 (Na+, univalent) had the least influence on sorption, which was also reported in other studies (Higgins and Luthy, 2006).
5.3.3. Influence of net negative charge The net charge was calculated with the geochemical model Visual MINTEQ, which takes into many parameters when calculating net charge on the soil surface. One of the aims of this study was to investigate whether modelled net charge correlates better with sorption of PFASs than cation composition and pH alone. For PFCAs (C5-C13) and FOSA, log Kd (Figure 8) showed good a correlation with net negative charge, with low net negative (i.e. neutralized soil surface) resulting in the highest log Kd-values. For Al(NO3)3, the net negative charge was generally the lowest, followed by Ca(NO3)2 (5 mM), Ca(NO3)2 (3 mM) and NaNO3. For PFBA, PFPeA, PFBS, PFHxS and PFOS, net negative charge does not explain the high log Kd for Al(NO3)3. Log Kd for PFOS remains relatively constant with net charge.
5.3.4. Comparison between pH and net negative charge When comparing the correlation of Kd vs pH and Kd vs net negative charge (Figure 8 and Figure 9), the net negative charge showed less spreading of the data for all cations for PFHxA, PFHpA, PFOA and PFNA than for pH. This indicates a better correlation, i.e. that net negative charge is a better predictor for the sorption for these compounds than pH is. For PFDA and longer-chained PFCAs (C9-C13), the difference between pH and net negative charge was less pronounced, with pH showing slightly better linear-ity. For PFBA and PFPeA, no correlation was found.

29
For PFHxS, log Kd for Al(NO3)3 was much higher than the other cations, which can be neither explained by pH nor net negative charge. It is possible that this is due to complex formations, however the results of this study cannot confirm this. Log Kd for PFOS showed no correlation with either net negative charge or pH, but were rather constant over the interval. FOSA correlates equally well with both net negative charge and pH.
Overall, the net negative charge is for some PFASs a better predictor for sorption of PFASs to soil. This can be explained by the fact that the charge present on the soil surface is the main factor that affects the sorption of PFASs to soil. Thus, net charge is potentially a better predictor of sorption to soil than solution pH alone (which is based only on the H+-concentration).
5.4. FUTURE PERSPECTIVES This study shows that net charge, pH, cation concentrations are important parameters influencing the sorption of PFASs to soil. More studies are needed for cations with different valence and of different concentrations. Furthermore, this study was limited to soil rich in organic carbon, more studies are needed to compare the results from this study with mineral soil and sediments. Eventually, these results could be used to implement a feature of PFASs sorption to soil into a geochemical model such as Visual MINTEQ, to better predict the fate of PFASs in the environment.
6. CONCLUSION
The aims of this study was to investigate the effects of pH, cation composition, func-tional group and perfluorocarbon chain length on sorption of PFASs to soil particles, by batch sorption experiment in laboratory scale. The laboratory-scale experiments were combined with modelling of the net charge to evaluate net charge is a good pre-dictor for sorption of PFASs to soil particles. The adsorption of PFASs was strongly correlated with perfluorocarbon chain length, showing a stronger adsorption to particles with increasing perfluorocarbon chain length (i.e. more hydrophobic). The relation between log Kd and perfluorocarbon chain length was linear for all PFSAs and C3 to C10 PFCAs (Figure 6). The FASAs (sulfonate functional group) sorbed stronger to soil particles than the PFCAs (carbox-ylic functional group), whereas FOSA (sulfonamide functional group) sorbed the strongest.
For most PFCAs, (C5-C13) there was a trend of decreasing log Kd (i.e. sorption) with increasing pH. A change of pH will change the protonation/deprotonation of the soil surface, thus with increase of pH, adsorbent surfaces tend to become more negatively charged. This stronger electrostatic repulsion resulted in lower sorption for high pH. This effect was observed as a trend regardless of perfluorocarbon chain length for the PFCAs and FOSA. For short and intermediate perfluorocarbon chain length PFCAs (C5-C8) and PFHxS among the PFSAs, cation concentrations had a clear effect on sorption. The adsorp-tion was higher when more calcium ions were present (i.e. higher log Kd for 5 mM Ca(NO3)2 than for 3mM Ca(NO3)2), and Al(NO3)3 consistently showed the highest log Kd for these compounds. NaNO3 had the least influence on sorption. This effect is due

30
to the positive cations which partially neutralizes the negative surface charge by inter-actions between the functional groups (carboxylic groups) present in the organic mat-ter, resulting in an increase in the sorption between the surface of the organic matter and the PFASs. Trivalent ions, such as Al3+ has a higher capacity to neutralize surface charge than divalent ions (such as Ca2+), which is why the sorption was stronger with Al(NO3)3 present. The net charge modelled with Visual MINTEQ takes into account many parameters (including pH) that affect the surface charge and sorption of PFASs to soil particles. When comparing Kd for the different PFASs with pH and net negative charge, net charge was a better predictor of sorption of PFASs to soil particles than solution pH alone.

31
7. REFERENCES Ahrens, L., Harner, T., Shoeib, M., Lane, D.A., Murphy, J.G., 2012. Improved Char-
acterization of Gas–Particle Partitioning for Per- and Polyfluoroalkyl Substan-ces in the Atmosphere Using Annular Diffusion Denuder Samplers. Environ. Sci. Technol. 46, 7199–7206.
Ahrens, L., Taniyasu, S., Yeung, L.W.Y., Yamashita, N., Lam, P.K.S., Ebinghaus, R., 2010. Distribution of polyfluoroalkyl compounds in water, suspended particu-late matter and sediment from Tokyo Bay, Japan. Chemosphere 79, 266–272.
Ahrens, L., Yamashita, N., Yeung, L.W.Y., Taniyasu, S., Horii, Y., Lam, P.K.S., Ebinghaus, R., 2009. Partitioning Behavior of Per- and Polyfluoroalkyl Com-pounds between Pore Water and Sediment in Two Sediment Cores from Tokyo Bay, Japan. Environ. Sci. Technol. 43, 6969–6975.
Ahrens, L., Yeung, L.W.Y., Taniyasu, S., Lam, P.K.S., Yamashita, N., 2011. Parti-tioning of perfluorooctanoate (PFOA), perfluorooctane sulfonate (PFOS) and perfluorooctane sulfonamide (PFOSA) between water and sediment. Chemo-sphere 85, 731–737.
Borg, D., Håkansson, H., 2012. Environmental and Health Risk Assessment of Per-fluoroalkylated and Polyfluoroalkylated Substances (PFASs) in Sweden (No. Report 6513). Naturvårdsverket.
Buck, R.C., Franklin, J., Berger, U., Conder, J.M., Cousins, I.T., de Voogt, P., Jensen, A.A., Kannan, K., Mabury, S.A., van Leeuwen, S.P., 2011. Perfluoroalkyl and polyfluoroalkyl substances in the environment: Terminology, classification, and origins. Integr. Environ. Assess. Manag. 7, 513–541.
Chen, H., Chen, S., Quan, X., Zhao, Y., Zhao, H., 2009. Sorption of perfluorooctane sulfonate (PFOS) on oil and oil-derived black carbon: Influence of solution pH and [Ca2+]. Chemosphere 77, 1406–1411.
Du, Z., Deng, S., Bei, Y., Huang, Q., Wang, B., Huang, J., Yu, G., 2014. Adsorption behavior and mechanism of perfluorinated compounds on various ad-sorbents—A review. J. Hazard. Mater. 274, 443–454.
Giesy, J.P., Kannan, K., 2002. Perfluorochemical surfactants in the environment. En-viron. Sci. Technol. 36, 146A–152A.
Glynn, A., Aune, M., Darnerud, P.O., Cnattingius, S., Bjerselius, R., Becker, W., Lig-nell, S., 2007. Determinants of serum concentrations of organochlorine com-pounds in Swedish pregnant women: a cross-sectional study. Environ. Health 6, 2.
Glynn, A., Berger, U., Bignert, A., Ullah, S., Aune, M., Lignell, S., Darnerud, P.O., 2012. Perfluorinated Alkyl Acids in Blood Serum from Primiparous Women in Sweden: Serial Sampling during Pregnancy and Nursing, And Temporal Trends 1996–2010. Environ. Sci. Technol. 46, 9071–9079.
Glynn, A., Cantillana, T., Bjermo, H., 2013. Riskvärdering av perfluorerande alkyl-syror i livsmedel och dricksvatten (No. Rapport 11 - 2013). Livsmedelsverket.
Gustafsson, J.P., 2013. Visual MINTEQ – a free equilibrium speciation model [WWW Document]. KTH Vis. MINTEQ. URL http://vminteq.lwr.kth.se/ (ac-cessed 5.7.15).
Gustafsson, J.P., Persson, I., Oromieh, A.G., van Schaik, J.W.J., Sjöstedt, C., Kleja, D.B., 2014a. Chromium(III) Complexation to Natural Organic Matter: Mechanisms and Modeling. Environ. Sci. Technol. 48, 1753–1761.

32
Gustafsson, J.P., Persson, I., Oromieh, A.G., van Schaik, J.W.J., Sjöstedt, C., Kleja, D.B., 2014b. Chromium(III) Complexation to Natural Organic Matter: Mechanisms and Modeling. Supporting information.
Hansen, K.J., Clemen, L.A., Ellefson, M.E., Johnson, H.O., 2001. Compound-Specific, Quantitative Characterization of Organic Fluorochemicals in Bio-logical Matrices. Environ. Sci. Technol. 35, 766–770.
Hedenberg, G., 2014. Miljögifter i vatten – faroanalys behövs. Sven. Vatten. Higgins, C.P., Luthy, R.G., 2006. Sorption of Perfluorinated Surfactants on Sedi-
ments. Environ. Sci. Technol. 40, 7251–7256. Johnson, R.L., Anschutz, A.J., Smolen, J.M., Simcik, M.F., Penn, R.L., 2007. The
Adsorption of Perfluorooctane Sulfonate onto Sand, Clay, and Iron Oxide Sur-faces. J. Chem. Eng. Data 52, 1165–1170.
Kannan, K., Corsolini, S., Falandysz, J., Fillmann, G., Kumar, K.S., Loganathan, B.G., Mohd, M.A., Olivero, J., Wouwe, N.V., Yang, J.H., others, 2004. Per-fluorooctanesulfonate and related fluorochemicals in human blood from sev-eral countries. Environ. Sci. Technol. 38, 4489–4495.
Kärrman, A., van Bavel, B., Järnberg, U., Hardell, L., Lindström, G., 2006. Perfluori-nated chemicals in relation to other persistent organic pollutants in human blood. Chemosphere 64, 1582–1591.
Kim, M., Li, L.Y., Grace, J.R., Yue, C., 2015. Selecting reliable physicochemical properties of perfluoroalkyl and polyfluoroalkyl substances (PFASs) based on molecular descriptors. Environ. Pollut. 196, 462–472.
Kudo, N., Bandai, N., Suzuki, E., Katakura, M., 2000. Induction by perfluorinated fatty acids with different carbon chain length of peroxisomal beta-oxidation in the liver of rats. Chem. Biol. Interact. 124, 119–132.
Labadie, P., Chevreuil, M., 2011. Partitioning behaviour of perfluorinated alkyl con-taminants between water, sediment and fish in the Orge River (nearby Paris, France). Environ. Pollut. 159, 391–397.
Livsmedelsverket, 2015. Riskhantering - PFAA i dricksvatten [WWW Document]. URL http://www.livsmedelsverket.se/livsmedel-och-innehall/oonskade-amnen/miljogifter/PFAS-poly-och-perfluorerade-alkylsubstanser/riskhantering-pfaa-i-dricksvatten/ (accessed 4.25.15).
Löfgren, S., Gustafsson, J.P., Bringmark, L., 2010. Decreasing DOC trends in soil solution along the hillslopes at two IM sites in southern Sweden — Geo-chemical modeling of organic matter solubility during acidification recovery. Sci. Total Environ. 409, 201–210.
Martin, J.W., Mabury, S.A., Solomon, K.R., Muir, D.C., 2003. Bioconcentration and tissue distribution of perfluorinated acids in rainbow trout (Oncorhynchus mykiss). Environ. Toxicol. Chem. 22, 196–204.
Milinovic, J., Lacorte, S., Vidal, M., Rigol, A., 2015. Sorption behaviour of per-fluoroalkyl substances in soils. Sci. Total Environ. 511, 63–71.
Moody, C.A., Hebert, G.N., Strauss, S.H., Field, J.A., 2003. Occurrence and persis-tence of perfluorooctanesulfonate and other perfluorinated surfactants in groundwater at a fire-training area at Wurtsmith Air Force Base, Michigan. J. Environ. Monit. 5, 341–345.
Ny Teknik, 2014. Förhöjda halter PFAS hos Kallingebarn [WWW Document]. NyTeknik. URL http://www.nyteknik.se/nyheter/energi_miljo/miljo/article3815625.ece (ac-cessed 5.28.15).

33
Pan, G., Jia, C., Zhao, D., You, C., Chen, H., Jiang, G., 2009. Effect of cationic and anionic surfactants on the sorption and desorption of perfluorooctane sulfonate (PFOS) on natural sediments. Environ. Pollut. 157, 325–330.
Pan, G., You, C., 2010. Sediment–water distribution of perfluorooctane sulfonate (PFOS) in Yangtze River Estuary. Environ. Pollut. 158, 1363–1367.
Post, G.B., Louis, J.B., Lippincott, R.L., Procopio, N.A., 2013. Occurrence of Per-fluorinated Compounds in Raw Water from New Jersey Public Drinking Water Systems. Environ. Sci. Technol. 47, 13266–13275.
Rahman, M.F., Peldszus, S., Anderson, W.B., 2014. Behaviour and fate of perfluoro-alkyl and polyfluoroalkyl substances (PFASs) in drinking water treatment: A review. Water Res. 50, 318–340.
Rayne, S., Forest, K., 2009. Congener-specific organic carbon-normalized soil and sediment-water partitioning coefficients for the C 1 through C 8 perfluoroalkyl carboxylic and sulfonic acids. J. Environ. Sci. Health Part A 44, 1374–1387.
Senevirathna, S.T.M.L.D., Tanaka, S., Fujii, S., Kunacheva, C., Harada, H., Shivakoti, B.R., Okamoto, R., 2010. A comparative study of adsorption of perfluorooctane sulfonate (PFOS) onto granular activated carbon, ion-exchange polymers and non-ion-exchange polymers. Chemosphere 80, 647–651.
Tang, C.Y., Shiang Fu, Q., Gao, D., Criddle, C.S., Leckie, J.O., 2010. Effect of solu-tion chemistry on the adsorption of perfluorooctane sulfonate onto mineral surfaces. Water Res. 44, 2654–2662.
Wang, F., Liu, C., Shih, K., 2012. Adsorption behavior of perfluorooctanesulfonate (PFOS) and perfluorooctanoate (PFOA) on boehmite. Chemosphere 89, 1009–1014.
Wang, Z., MacLeod, M., Cousins, I., T., Scheringer, M., Hungerbühler, K., 2011. Using COSMOtherm to predict physicochemical properties of poly- and per-fluorinated alkyl substances (PFASs). Environ. Chem. 389–398.
You, C., Jia, C., Pan, G., 2010. Effect of salinity and sediment characteristics on the sorption and desorption of perfluorooctane sulfonate at sediment-water inter-face. Environ. Pollut. 158, 1343–1347.
Zareitalabad, P., Siemens, J., Hamer, M., Amelung, W., 2013. Perfluorooctanoic acid (PFOA) and perfluorooctanesulfonic acid (PFOS) in surface waters, sedi-ments, soils and wastewater – A review on concentrations and distribution co-efficients. Chemosphere 91, 725–732.

34
APPENDIX
Appendix I Initial Concentrations in the Soil Suspensions Determined initial concentrations for the Gustafsson et al., 2014 experiment of 1 g soil to 30 mL solution (Gustafsson et al., 2014b). Parametera Value Active humic acid (g L-1) 1.935 Active fulvic acid (g L-1) 0.645 Ca2+ (µmol L-1) 662 Mg2+ (µmol L-1) 136 K+ (µmol L-1) 120 Mn2+ (µmol L-1) 31.5 Al3+ (µmol L-1) 228 Fe3+ (µmol L-1) 35 Cr(OH)2
+ (µmol L-1) 0.02 Cu2+ (µmol L-1) 0.63 a For cations the concentrations shown are geochemically active concentrations before any additions. For extraction methods see text.

35
Appendix II Analysis results for dissolved organic carbon on filtered samples, from ALS Scandinavia AB. Sample DOC Uncertainitya (mg L-1) (+-) Al pH 3 a 72.6 14.6 Al pH 4 a 53 10.6 Al pH 5 a 65.8 13.2 Al pH 6 a 103 20.6 Al pH 3 b 68.3 13.7 Al pH 4 b 52.4 10.5 Al pH 5 b 72.4 14.5 Al pH 6 b 113 22.5 Ca pH 3 [5 mM] a 68.6 13.7 Ca pH 4 [5 mM] a 69.5 13.9 Ca pH 5 [5 mM] a 38.4 7.69 Ca pH 6 [5 mM] a 53.7 10.7 Ca pH 3 [5 mM] b 75.6 15.1 Ca pH 4 [5 mM] b 75.4 15.1 Ca pH 5 [5 mM] b 34.2 0.85 Ca pH 6 [5 mM] b 48.4 9.68 Ca pH 3 [3 mM] a 65.5 13.1 Ca pH 4 [3 mM] a 27.3 5.45 Ca pH 5 [3 mM] a 43.9 8.78 Ca pH 6 [3 mM] a 77.3 15.4 Ca pH 3 [3 mM] b 75 15 Ca pH 4 [3 mM] b 32.8 6.57 Ca pH 5 [3 mM] b 44.7 8.94 Ca pH 6 [3 mM] b 82.4 16.5 Na pH 3 a 67 13.4 Na pH 4 a 31.9 6.38 Na pH 5 a 43.4 8.67 Na pH 6 a 131 26.2 Na pH 3 b 71.1 14.2 Na pH 4 b 39.7 7.95 Na pH 5 b 56.9 11.4 Na pH 6 b 139 27.7
a Corresponds to confidence level of 95%

36
Appendix III Input and output Visual MINTEQ
INPUT OUTPUT
pH Mg Fe Mn K DOC FA solid HA Al Ca Na NO3 Net charge
Sample (mM) (mM) (mM) (mM) (mg L-1) (g L-1) (g L-1) (mM) (mM) (mM) (mM) (mol L-1) Na pH 3 3.1 0.15 0.04 0.03 0.13 69.1 0.54 2.04 0.24 0.71 10 12 -0.00121 Na pH 4 4.2 0.15 0.04 0.03 0.13 35.8 0.61 2.04 0.24 0.71 11 10 -0.00254 Na pH 5 4.9 0.15 0.04 0.03 0.13 50.2 0.58 2.04 0.24 0.71 12 10 -0.00357 Na pH 6 5.8 0.15 0.04 0.03 0.13 135 0.41 2.04 0.24 0.71 16 10 -0.00444 Ca pH 3 [5 mM] 2.9 0.15 0.04 0.03 0.13 72.1 0.54 2.04 0.24 5.71 4 16 -0.00105 Ca pH 4 [5 mM] 3.8 0.15 0.04 0.03 0.13 72.5 0.53 2.04 0.24 5.71 6 14 -0.00151 Ca pH 5 [5 mM] 4.6 0.15 0.04 0.03 0.13 36.3 0.61 2.04 0.24 5.71 9 14 -0.00167 Ca pH 6 [5 mM] 5.2 0.15 0.04 0.03 0.13 51.1 0.58 2.04 0.24 5.71 12 14 -0.00163 Ca pH 3 [3 mM] 2.9 0.15 0.04 0.03 0.13 70.3 0.54 2.04 0.24 3.71 4 12 -0.00104 Ca pH 4 [3 mM] 3.9 0.15 0.04 0.03 0.13 30.1 0.62 2.04 0.24 3.71 6 10 -0.00170 Ca pH 5 [3 mM] 4.9 0.15 0.04 0.03 0.13 44.3 0.59 2.04 0.24 3.71 9 10 -0.00199 Ca pH 6 [3 mM] 5.6 0.15 0.04 0.03 0.13 79.9 0.52 2.04 0.24 3.71 12 10 -0.00229 Al pH 3 2.8 0.15 0.04 0.03 0.13 70.5 0.54 2.04 2.24 0.71 4 10 -0.00058 Al pH 4 4.0 0.15 0.04 0.03 0.13 52.7 0.57 2.04 2.24 0.71 9 10 -0.00084 Al pH 5 4.8 0.15 0.04 0.03 0.13 69.1 0.54 2.04 2.24 0.71 11 10 -0.00152 Al pH 6 5.7 0.15 0.04 0.03 0.13 108 0.46 2.04 2.24 0.71 14 10 -0.00267
Appendix IV Average Kd and KOC with standard deviation, for each of the cation-series (NaNO3, Ca(NO3)2 (5 mM and 3 mM) and Al(NO3)3). (n = number of samples, 8 where nothing else specified)
(n) (n) (n) (n) (n) (n)PFBA 0.4 ± 0.1 -0.6 ± 0.8 (4) -0.2 ± 0.5 (4) -0.6 ± 0.7 (3) 0.7 ± 0.1 -0.3 ± 0.8 (4) 0.1 ± 0.5 (4) -0.3 ± 0.7 (3)PFPeA 0.6 ± 0.2 0.3 ± 0.2 (7) 0.4 ± 0.2 0.3 ± 0.3 (7) 0.9 ± 0.2 0.6 ± 0.2 (7) 0.7 ± 0.2 0.7 ± 0.3 (7)PFHxA 0.8 ± 0.1 0.5 ± 0.2 0.3 ± 0.4 0.3 ± 0.4 1.2 ± 0.1 0.8 ± 0.2 0.6 ± 0.4 0.6 ± 0.4PFHpA 1.1 ± 0.2 0.9 ± 0.2 0.7 ± 0.3 0.8 ± 0.2 1.5 ± 0.2 1.3 ± 0.2 1.1 ± 0.3 1.1 ± 0.2PFOA 1.7 ± 0.3 1.5 ± 0.2 1.3 ± 0.4 1.2 ± 0.3 2.1 ± 0.3 1.8 ± 0.2 1.6 ± 0.4 1.6 ± 0.3PFNA 2.6 ± 0.4 2.5 ± 0.2 2.1 ± 0.4 2.1 ± 0.5 3.0 ± 0.4 2.8 ± 0.2 2.5 ± 0.4 2.4 ± 0.5PFDA 3.6 ± 0.4 4.0 ± 0.6 3.6 ± 0.3 3.4 ± 0.3 3.9 ± 0.4 4.3 ± 0.6 3.9 ± 0.3 3.8 ± 0.3PFUnDA 3.9 ± 0.7 4.0 ± 0.6 4.1 ± 0.7 3.7 ± 0.5 4.3 ± 0.7 4.4 ± 0.6 4.4 ± 0.7 4.1 ± 0.5PFDoDA 3.7 ± 0.7 3.7 ± 0.7 3.7 ± 0.6 3.4 ± 0.4 4.1 ± 0.7 4.1 ± 0.7 4.0 ± 0.6 3.7 ± 0.4PFTeDA 3.8 ± 0.8 3.8 ± 0.8 3.7 ± 0.6 3.5 ± 0.5 4.2 ± 0.8 4.1 ± 0.8 4.0 ± 0.6 3.9 ± 0.5FOSA 4.3 ± 0.7 4.3 ± 0.5 4.1 ± 0.5 4.2 ± 0.5 4.6 ± 0.7 4.7 ± 0.5 4.5 ± 0.5 4.5 ± 0.5PFBS 0.5 ± 1.1 0.2 ± 0.4 (2) 0.2 ± 0.2 (5) 0.4 ± 0.7 (3) 0.9 ± 1.1 0.6 ± 0.4 (2) 0.6 ± 0.2 (5) 0.8 ± 0.7 (3)PFHxS 2.6 ± 0.5 1.5 ± 0.0 1.2 ± 0.2 1.3 ± 0.4 3.0 ± 0.5 1.9 ± 0.0 1.6 ± 0.2 1.7 ± 0.4PFOS 3.7 ± 0.3 4.0 ± 0.5 3.8 ± 0.4 3.5 ± 0.2 4.0 ± 0.3 4.4 ± 0.5 4.1 ± 0.4 3.9 ± 0.2
Log Kd ± SD [ml g-1] Al Ca [5 mM] Ca [3 mM] Na Al
Log KOC ± SD [ml g-1] Ca [5 mM] Ca [3 mM] Na

37
Appendix V Analysis results for PFASs detected in liquid phase (ng L-1), for all samples. Volume refers to sample volume that underwent SPE.
Sample
volume
PFBA
PFPeAPFH
xAPFH
pAPFO
APFN
APFD
APFU
nDA
PFDoD
APFTeD
AFO
SAPFB
SPFH
xSPFO
S[L]
Blank
0.0210
00
00
00
00
00
00
0B
lank0.019
00
00
00
00
00
00
00
Blank+PFA
Saa
0.021879
830923
876878
883761
41162
310
871800
483B
lank+PFASa
b0.020
880831
916872
878880
784365
411
4930
763485
Al pH
3a
0.011797
705711
505187
272
22
00
951142
3A
l pH 4
a0.011
795731
742575
25435
51
11
0721
122
Al pH
5a
0.010811
705765
599317
636
712
44
54118
5A
l pH 6
a0.011
815647
815682
504189
1511
2113
7699
1667
Al pH
3b
0.011830
756718
504170
212
00
00
95443
3A
l pH 4
b0.011
830750
763597
28244
80
11
0678
232
Al pH
5b
0.010820
729772
638364
8713
1518
106
65653
11A
l pH 6
b0.011
830645
796668
480194
2513
2615
7672
1076
Ca pH
3 [5 mM
]a
0.011842
740774
578294
557
12
11
1144341
1C
a pH 4 [5 m
M]
a-
--
--
--
--
--
--
-C
a pH 5 [5 m
M]
a0.010
879762
858699
501107
11
53
01022
3830
Ca pH
6 [5 mM
]a
0.010852
714848
704508
11413
1019
115
872365
6C
a pH 3 [5 m
M]
b0.011
881778
800579
28143
10
00
01148
3432
Ca pH
4 [5 mM
]b
0.010883
786863
714416
641
13
11
1091348
1C
a pH 5 [5 m
M]
b0.011
907765
857724
504102
98
127
31035
3815
Ca pH
6 [5 mM
]b
0.010889
734865
713519
1126
615
134
927370
3C
a pH 3 [3 m
M]
a0.019
853718
775571
28143
20
00
01142
3421
Ca pH
4 [3 mM
]a
0.017837
732853
712523
1745
13
11
892477
2C
a pH 5 [3 m
M]
a0.011
913781
883815
595259
144
64
31295
5364
Ca pH
6 [3 mM
]a
0.010911
738901
781685
31924
1926
138
921550
13C
a pH 3 [3 m
M]
b0.019
867717
773548
28446
50
12
1892
3452
Ca pH
4 [3 mM
]b
0.019878
758880
713515
1655
25
33
1143510
3C
a pH 5 [3 m
M]
b0.010
907775
886766
621242
116
128
2933
5047
Ca pH
6 [3 mM
]b
0.011922
745910
786674
2979
817
124
922517
5N
a pH 3
a0.010
862768
794590
31346
2120
211
11129
33115
Na pH
4a
0.010867
758841
708543
1956
37
22
961505
6N
a pH 5
a0.010
881757
880751
660321
75
118
2940
5555
Na pH
6a
0.010887
677874
755681
37712
1022
167
853588
7N
a pH 3
b0.010
903788
826627
30420
60
21
01120
2843
Na pH
4b
0.010938
852919
769582
2216
27
31
1039522
6N
a pH 5
b0.010
889755
881761
634324
96
126
31008
5556
Na pH
6b
0.010905
683876
749590
30437
819
136
670171
5
[ng L-1]

38
Appendix VI Analysis results for PFASs in solid phase (ng g-1) for all samples, using (Eq 2).
Sample
Soil weight
PFBA
PFPeAPFH
xAPFH
pAPFO
APFN
APFD
APFU
nDA
PFDoD
APFTeD
AFO
SAPFB
SPFH
xSPFO
S[g]
Al pH
3a
1.342.5
3.06.4
10.819.9
25.926.8
23.923.6
13.424.8
0.118.3
18.9A
l pH 4
a1.33
2.62.3
5.58.7
17.925.7
26.724.0
23.713.4
24.87.0
22.219.0
Al pH
5a
1.332.1
3.04.8
8.016.0
24.826.7
23.823.4
13.324.7
12.422.0
18.9A
l pH 6
a1.34
2.04.8
3.35.5
10.421.0
26.423.7
23.113.0
24.67.7
17.618.8
Al pH
3b
1.341.6
1.56.2
10.820.4
26.126.8
24.023.7
13.424.8
0.021.3
18.9A
l pH 4
b1.33
1.61.7
4.98.0
17.125.4
26.724.0
23.713.4
24.88.3
21.918.9
Al pH
5b
1.341.9
2.34.6
6.814.6
24.126.5
23.523.2
13.124.6
9.021.0
18.7A
l pH 6
b1.34
1.64.9
3.95.9
11.120.9
26.123.6
22.913.0
24.68.5
19.418.8
Ca pH
3 [5 mM
]a
1.341.2
2.04.6
8.616.7
25.126.7
24.023.7
13.424.7
-5.712.4
19.0C
a pH 4 [5 m
M]
a1.34
Ca pH
5 [5 mM
]a
1.330.1
1.32.0
5.010.5
23.526.9
24.023.6
13.324.8
-2.011.1
19.0C
a pH 6 [5 m
M]
a1.33
0.92.8
2.44.8
10.323.3
26.523.7
23.213.1
24.62.5
11.618.8
Ca pH
3 [5 mM
]b
1.330.0
0.93.8
8.617.1
25.426.8
24.023.7
13.424.8
-5.812.3
19.0C
a pH 4 [5 m
M]
b1.33
0.00.6
1.94.5
13.024.8
26.924.0
23.613.4
24.7-4.1
12.119.0
Ca pH
5 [5 mM
]b
1.33-0.8
1.22.1
4.210.4
23.726.6
23.823.4
13.224.7
-2.411.2
18.9C
a pH 6 [5 m
M]
b1.33
-0.22.2
1.84.6
10.023.3
26.723.8
23.313.0
24.60.8
11.518.9
Ca pH
3 [3 mM
]a
1.330.9
2.64.5
8.817.1
25.426.8
24.023.7
13.424.8
-5.612.3
19.0C
a pH 4 [3 m
M]
a1.33
1.42.2
2.24.6
9.821.5
26.724.0
23.613.4
24.71.9
8.319.0
Ca pH
5 [3 mM
]a
1.33-0.9
0.81.3
1.57.7
19.026.5
23.923.5
13.324.7
-10.26.5
18.9C
a pH 6 [3 m
M]
a1.34
-0.92.1
0.82.5
5.017.2
26.223.4
22.913.0
24.51.0
6.118.6
Ca pH
3 [3 mM
]b
1.340.5
2.74.6
9.517.0
25.326.7
24.023.7
13.424.7
1.912.2
18.9C
a pH 4 [3 m
M]
b1.33
0.11.5
1.44.5
10.121.8
26.723.9
23.613.3
24.7-5.6
7.318.9
Ca pH
5 [3 mM
]b
1.33-0.7
0.91.2
2.96.9
19.526.6
23.823.4
13.224.7
0.77.5
18.8C
a pH 6 [3 m
M]
b1.34
-1.21.8
0.52.4
5.317.8
26.623.7
23.213.0
24.61.0
7.118.9
Na pH
3a
1.330.6
1.24.0
8.216.1
25.326.2
23.423.1
13.424.7
-5.212.6
18.5N
a pH 4
a1.33
0.41.5
2.54.7
9.220.9
26.723.9
23.513.4
24.7-0.2
7.418.8
Na pH
5a
1.330.0
1.51.4
3.45.7
17.126.7
23.823.4
13.224.7
0.55.9
18.9N
a pH 6
a1.33
-0.13.9
1.63.3
5.115.4
26.523.7
23.112.9
24.63.0
4.918.8
Na pH
3b
1.33-0.6
0.63.0
7.116.4
26.126.7
24.023.7
13.424.8
-5.014.1
18.9N
a pH 4
b1.33
-1.7-1.4
0.22.9
8.120.1
26.723.9
23.513.3
24.7-2.5
6.918.8
Na pH
5b
1.33-0.2
1.61.4
3.16.5
17.026.6
23.823.4
13.224.7
-1.65.9
18.8N
a pH 6
b1.33
-0.73.7
1.53.5
7.817.6
25.823.7
23.213.0
24.68.5
17.418.9
[ng g-1]

39
Appendix VII Analysis results for Kd (mL g-1) for all samples, using (Eq 4).
Sample
PFBA
PFPeAPFH
xAPFH
pAPFO
APFN
APFD
APFU
nDA
PFDoD
APFTeD
AFO
SAPFB
SPFH
xSPFO
S
Al pH
3a
0.50.6
1.01.3
2.03.0
4.14.1
4.04.9
5.1-0.9
2.13.8
Al pH
4a
0.50.5
0.91.2
1.82.9
3.74.3
4.34.2
4.81.0
3.34.0
Al pH
5a
0.40.6
0.81.1
1.72.6
3.63.5
3.33.5
3.81.4
3.13.6
Al pH
6a
0.40.9
0.60.9
1.32.0
3.23.3
3.03.0
3.61.0
2.03.5
Al pH
3b
0.30.3
0.91.3
2.13.1
4.25.0
4.84.7
5.2-1.5
2.73.8
Al pH
4b
0.30.4
0.81.1
1.82.8
3.54.8
4.24.4
4.81.1
3.03.9
Al pH
5b
0.40.5
0.81.0
1.62.4
3.33.2
3.13.1
3.61.1
2.63.2
Al pH
6b
0.30.9
0.70.9
1.42.0
3.03.2
2.92.9
3.51.1
2.33.5
Ca pH
3 [5 mM
]a
0.20.4
0.81.2
1.82.7
3.64.4
4.14.3
4.51.6
4.3C
a pH 4 [5 m
M]
aC
a pH 5 [5 m
M]
a-1.0
0.20.4
0.91.3
2.34.7
4.23.7
3.64.7
1.54.9
Ca pH
6 [5 mM
]a
0.00.6
0.40.8
1.32.3
3.33.4
3.13.1
3.70.5
1.53.5
Ca pH
3 [5 mM
]b
-1.60.0
0.71.2
1.82.8
4.34.9
5.05.1
4.81.6
4.0C
a pH 4 [5 m
M]
b-0.1
0.30.8
1.52.6
4.74.3
3.94.0
4.61.5
4.2C
a pH 5 [5 m
M]
b0.2
0.40.8
1.32.4
3.53.5
3.33.3
4.01.5
3.6C
a pH 6 [5 m
M]
b0.5
0.30.8
1.32.3
3.63.6
3.23.0
3.80.0
1.53.8
Ca pH
3 [3 mM
]a
0.00.6
0.81.2
1.82.8
4.15.4
4.74.7
5.01.6
4.5C
a pH 4 [3 m
M]
a0.2
0.50.4
0.81.3
2.13.7
4.43.9
4.24.4
0.31.2
4.0C
a pH 5 [3 m
M]
a0.0
0.20.3
1.11.9
3.33.8
3.63.5
4.01.1
3.7C
a pH 6 [3 m
M]
a0.4
-0.10.5
0.91.7
3.03.1
2.93.0
3.50.0
1.03.2
Ca pH
3 [3 mM
]b
-0.30.6
0.81.2
1.82.7
3.84.7
4.23.8
4.50.3
1.53.9
Ca pH
4 [3 mM
]b
-0.90.3
0.20.8
1.32.1
3.74.1
3.73.7
3.91.2
3.8C
a pH 5 [3 m
M]
b0.1
0.10.6
1.01.9
3.43.6
3.33.2
4.1-0.2
1.23.4
Ca pH
6 [3 mM
]b
0.4-0.3
0.50.9
1.83.5
3.53.1
3.03.8
0.01.1
3.6N
a pH 3
a-0.1
0.20.7
1.11.7
2.73.1
3.13.0
4.04.6
1.63.1
Na pH
4a
-0.30.3
0.50.8
1.22.0
3.73.9
3.53.9
4.21.2
3.5N
a pH 5
a-1.4
0.30.2
0.70.9
1.73.6
3.73.3
3.24.0
-0.31.0
3.6N
a pH 6
a0.8
0.30.6
0.91.6
3.33.4
3.02.9
3.50.6
0.93.4
Na pH
3b
-0.10.6
1.11.7
3.13.7
4.94.2
4.35.2
1.73.9
Na pH
4b
-0.60.6
1.12.0
3.64.0
3.53.7
4.31.1
3.5N
a pH 5
b0.3
0.20.6
1.01.7
3.53.6
3.33.3
3.91.0
3.5N
a pH 6
b0.7
0.20.7
1.11.8
2.83.5
3.13.0
3.61.1
2.03.6
[ml g
-1]