effects of operations management practices on the …
TRANSCRIPT

EFFECTS OF OPERATIONS MANAGEMENT PRACTICES ON THE
QUALITY OF MASTER OF BUSINESS ADMINISTRATION PROGRAMS
IN KENYAN UNIVERSITIES, CAMPUSES BASED IN NAKURU TOWN
BOSCO J VERBS
A Research Project Submitted to the School of Business and Economics in Partial
Fulfillment of the Requirements for the Award of Master of Business Administration
(Operations Management) Degree of Kabarak University
2016

ii
DECLARATION AND APPROVAL
Declaration
This project is my original work and has not been presented for examination or awards in any
other university or academic institution.
Signature…………………………………………. Date ...………………………………….
Bosco J Verbs
Approval by Supervisors
This project has been submitted with my approval as the university supervisor.
Signature ……………………………… DATE ………………………………
Mr. Philip Ragama
Senior Lecturer;
School of Computer Science and Bio-Informatics
Kabarak University
Signature ……………………………………. Date……………………………………..
Dr. Helen Sang
Lecturer, School of Business and Economics
Kabianga University
GMB/NE/0646/05/15

iii
DEDICATION
I dedicate this project to my parents, family and friends for their unending support and
encouragements throughout this academic journey. I am and will be forever grateful.

iv
ACKNOWLEDGEMENT
My greatest of appreciations, thanks goes to the Almighty God for his grace provisions.
Secondly, to my supervisors Dr. Hellene Sang and Mr. Philip Ragama who have passionately
encouraged and guided me and for the assistance accorded to me by the staff of Kabarak
University, Town campus; the Librarians and Information Technology departments. To my dear
friends, family and my colleagues at Kabarak University MBA Operations Management group
who encouraged and stood with me on many occasions. Thank you.
v
LIST OF ABBREVIATIONS
APICS - American Production and Inventory Control Society
BCOM- Bachelor of Commerce
CUE - Commission of University Education
GDP - Gross Domestic Product
JITT- Just-In-Time Teaching
KSAs - Knowledge, Skills and Abilities
MBA - Master of Business Administration
OM - Operations Management
QA - Quality Assurance
TQM - Total Quality Management
WCM - World Class Manufacturing
vi
ABSTRACT
Master of business administration (MBA) programs are under intense pressure to improve
efficiencies, lower tuition, and offer refreshed curriculum that is of high quality and regarded as
relevant by the marketplace. In light of this environment, this study proposes a framework for
effectively employing operations management (OM) practices in the design and execution of
MBA programs. The study investigated the important role that operation management practices
play in curriculum design and faculty utilization, how operation efficiency can create quality of
student experience, assurance of learning and how operation management practices can lead to
high quality MBA program design. OM practices are shown to be applicable in key areas
including curriculum design, faculty utilization, quality of student experience, assurance of
learning, and program redesign. The study examined the usage of OM practices in running MBA
programs in universities based in Nakuru town. The study concentrated on 10 universities
offering MBA within Nakuru town. Descriptive survey design was used in this study. Previous
surveys from European and American Business Schools indicate that most MBA programs are
not fully utilizing OM practices in their operations. Therefore this study sought to find out if this
is the case in Kenya, more specifically in Business schools in Nakuru town. For empirical
assessment, a questionnaire with items corresponding to each objective-method in the framework
were developed and sent to administrators of MBA Business Schools of Universities based in
Nakuru town. These administrators are considered a critical section in administration decisions
at many business schools as their main roles demonstrate a commitment to providing quality
graduate management education through accreditation by the CUE and other certifying bodies.
Analysis of the collected data was carried out using Statistical Package for Sciences (SPSS),
computer software. Descriptive as well as inferential statistics were used to analyze data.
Frequency distributions, chi-square tests were used to present the data. Inferential statistics;
Pearson's correlations and multiple regressions were used to assess the role of OM Practices in
MBA program administration of Universities in Nakuru Town.
Keywords: MBAQuality, Operations Management Practices, Operations Efficiency, Capacity
Planning, Learning Assurance. Just-In-Time Teaching

vii
TABLE OF CONTENTS
DECLARATION........................................................................................................................... ii
DEDICATION.............................................................................................................................. iii
ACKNOWLEDGEMENT ........................................................................................................... iv
LIST OF ABBREVIATIONS ...................................................................................................... v
ABSTRACT ...................................................................................... Error! Bookmark not defined.
TABLE OF CONTENTS ............................................................................................................ vi
LIST OF TABLES ........................................................................... Error! Bookmark not defined.
LIST OF FIGURES ..................................................................................................................... xi
CHAPTER ONE ........................................................................................................................... 1
INTRODUCTION......................................................................................................................... 1
1.1 Background of the Study .......................................................................................................... 1
1.2 Statement of the problem .......................................................................................................... 9
1.4 Research Hypothesis ............................................................................................................... 11
1.5 Scope of the Study .................................................................................................................. 11
1.6 Limitations of the Study.......................................................................................................... 12
1.7 Significance of the Study ........................................................................................................ 12
1.8 Definition of Operational Terms ............................................................................................. 12
CHAPTER TWO ........................................................................................................................ 14
LITERATURE REVIEW .......................................................................................................... 14
2.1 Introduction ............................................................................................................................. 14
2.2 Theoretical Literature.............................................................................................................. 14
2.2.1 Deming's Theory of Management .................................................................................... 14
2.2.2 Crosby's Theory: .............................................................................................................. 15
2.2.3 Joseph Juran's Theory ...................................................................................................... 17
2.2.4 Ishikawa's Theory ............................................................................................................ 19
2.3 The Effectiveness of OM Practices......................................................................................... 20
2.4 Total Quality Management ..................................................................................................... 21
2.4.1 Capacity Planning ............................................................................................................ 22
2.4.2 Just In Time Teaching ...................................................................................................... 24
2.4.4.1 Assurance of Learning Process Mapping ..................................................................... 28

viii
2.5 Faculty and Student Quality Circles ....................................................................................... 29
2.6 Scheduling for Predictable Flow of Students.......................................................................... 30
2.7 Concurrent Engineering for Curriculum Design..................................................................... 31
2.8 Research Gap .......................................................................................................................... 33
2.9 Conceptual Framework ........................................................................................................... 34
CHAPTER THREE .................................................................................................................... 35
RESEARCH METHODOLOGY .............................................................................................. 35
3.1 Introduction ............................................................................................................................. 35
3. 2 Research Design..................................................................................................................... 35
3.3 The Study Area ....................................................................................................................... 35
3.4 Target Population .................................................................................................................... 35
3.5 Sampling Design and Procedures ........................................................................................... 35
3.6 Data Collection Instruments and procedures .......................................................................... 36
3.7 Validity and Reliability of rresearch iinstruments .................................................................. 36
3.7.1 Validity of Research Instruments......................................................................................... 36
3.7.2 Reliability of the Research Instruments ............................................................................... 37
3.8 Data Analysis and Presentation .............................................................................................. 37
3.9 Operationalization of the Variables. ....................................................................................... 38
CHAPTER FOUR ....................................................................................................................... 39
DATA ANALYSIS, INTERPRETATIONS AND DISCUSSIONS ........................................ 39
4.1 Introduction ............................................................................................................................. 39
4.2 Response Rate ......................................................................................................................... 39
4.3 Background information ......................................................................................................... 39
4.3.1 Gender of the respondents ............................................................................................... 39
4.3.2 Age of the respondents..................................................................................................... 40
4.3.3 Position in organization ................................................................................................... 40
4.3.4 Education level................................................................................................................. 41
4.4 Effects of operations management on MBA Programs. ......................................................... 41
4.4.1 Just-In-Time Teaching and Quality ................................................................................. 41
JITT and Quality ....................................................................................................................... 42
4. 4. 2 Quality assurance and student experience ..................................................................... 43

ix
4. 4. 3 Capacity Planning influences Quality of MBA Programs ............................................. 45
4.4.4 Operational Efficiency and Quality ................................................................................. 47
4.5 Quality MBA program ............................................................................................................ 49
4.5.1 Research output ................................................................................................................ 51
4.5.2 Market Acceptance .......................................................................................................... 53
4.6 Reliability Test ........................................................................................................................ 54
4.7. Correlation Analysis ............................................................... Error! Bookmark not defined.
4.8 Regression Analysis ................................................................. Error! Bookmark not defined.
4.9 Hypothesis Testing................................................................... Error! Bookmark not defined.
CHAPTER FIVE ............................................................................. Error! Bookmark not defined.
SUMMARY, CONCLUSION AND RECOMMENDATIONS.... Error! Bookmark not defined.
5.1 Introduction .............................................................................. Error! Bookmark not defined.
5.2 Summary of the Findings ......................................................... Error! Bookmark not defined.
5.3 Conclusion of the study ........................................................... Error! Bookmark not defined.
5.4 Recommendations .................................................................... Error! Bookmark not defined.
5.5 Suggestions for Further Research ............................................ Error! Bookmark not defined.
REFERENCES ................................................................................. Error! Bookmark not defined.
APPENDIX I: Letter of Introduction ......................................... Error! Bookmark not defined.
APPENDEX II: Questionnaire ....................................................... Error! Bookmark not defined.
APPENDIX III: Universities Offering MBA in Nakuru Town .............................................. 85

x
LIST OF TABLES
Table 4.1 Just-In-Time Teaching and Quality ............................... Error! Bookmark not defined.
Table 4.2 Quality assurance and student experience ..................... Error! Bookmark not defined.
Table 4. 3 Capacity Planning influences Quality of MBA ProgramsError! Bookmark not
defined.
Table 4. 4 Operational efficiency and Quality ............................... Error! Bookmark not defined.
Table 4. 5 Quality MBA program .................................................. Error! Bookmark not defined.
Table 4. 6 Research output............................................................. Error! Bookmark not defined.
Table 4.7: Market acceptance ........................................................ Error! Bookmark not defined.
Table 4. 8 Reliability Test ............................................................................................................. 54
Table 4. 9 Correlation Analysis ..................................................... Error! Bookmark not defined.
Table 4. 10 Model Summary ......................................................... Error! Bookmark not defined.
Table 4. 11 Model Analysis of Variance ....................................... Error! Bookmark not defined.
Table 4. 12: Model Coefficients .................................................... Error! Bookmark not defined.
Table 4. 13 Summary of Hypotheses Testing ................................ Error! Bookmark not defined.

xi
LIST OF FIGURES
Figure 2.1 Conceptual framework……………………………………………………………….33
Figure 4. 1 Gender of the respondents .......................................................................................... 39
Figure 4. 2 Age ............................................................................................................................. 40
Figure 4. 3 Position in organization .............................................................................................. 41
Figure 4. 4 Education level ........................................................................................................... 41

1
CHAPTER ONE
INTRODUCTION
1.1 Background of the Study
Master of Business Administration (MBA) is one of the most popular degree programs in
Kenyan universities (Alvesson & Benner, 2016).Most faculties of commerce have reinvented
themselves to schools of business to accommodate BCOM and MBA programs. The students
may select a specialization in Finance, Accounting, Operations, Strategic, Human resources,
Marketing, International Business, Information systems, Health Care Administration and many
more (Nyasani, 2015). Nyasani further poses a question whether these are specializations or
options? Most MBA degree requirements are course work and a research thesis/project (Azure,
2016). The course is expected to cover a number of issues in economics, business strategy,
finance, accounting and many more foundations of management theory. After course work, the
students proceed to the development of their research projects which will be eventually compiled
into a thesis/project report. Upon completion of the degree requirements, the graduate are
presumably prepared for progressively challenging/rewarding careers in business, industry,
government, health and some many other fields (Bonnie, Stroud, Breiner & Council, 2015).
Then where is the specialization? Based on three global objectives of any MBA degree program,
the graduate is first expected to learn and internalize the theory, principles, and knowledge
required for effective management in today’s dynamic environment (Bedford, 2013). Secondly,
the learner is expected to develop techniques for basing decision and action on careful analysis
of pertinent data; and lastly the learner should develop a philosophy of responsible leadership
and an appreciation of business ethics (Nettles, 2015).
Most of the MBA programs in Kenya have not embraced the best practices that can enable
learners acquire techniques for basing their decisions and action on careful analyzed pertinent
data, rendering them without any leadership philosophy for any future responsibilities that
require strong ethical appreciations (Bruce, 2010). Most MBA degree programs don’t have a
course unit in Business Ethics as it should be the case. Ethics goes hand-in-hand with practice
(Reyes, Kim, & Weaver, 2016). Most of the MBA graduates are hardly thirty years old, do they
go for attachment or they are treated as those who are already working as they study? The
specialization should be in the MBA Research Project/Thesis. Most MBA graduates are

2
―theorists‖ and not ―specialists‖ who can practice in their thematic areas for example someone
claiming that to be a specialist in Operations Management (Magutu, 2013).
This is wrong since operations management has ten key decision areas which may include:
Goods & service design, Quality, Process & capacity design, Location selection, Layout design,
Human resource and job design, Supply-chain management, Inventory, Scheduling and
Maintenance (Schönsleben, 2016). Given the short semester hours available for student to take
their core courses and other graduate business courses in the selected area, the student is
expected to choose a specific area of interest where he/she can conduct a practical research on
for example ―location selection‖ which will be the area of specialization within operations
management option (Magutu, 2016). The supervisors assist the students’ effort of narrowing the
gap between the theory taught in class and best practices in business (Hopkins, 2014). The
research efforts gives students a chance to focus in a specific area of interest where they can
learn and internalize the theory and knowledge required for effective management through
literature review and in line with the last objective any MBA degree program to inculcate
techniques for basing decision/action based on careful analyses of pertinent data (Borg, 2015).
(Magutu, 2016) further explains that MBA graduates should stop specializing on ―MBA
Options‖ but on ―specific decision areas‖ within their options. There is need for specialization in
―Quality Management‖ and not ―Operations Management‖ or a specialist in ―Green Marketing‖
and not ―Marketing Management‖ (Moliner, Ortega, Tarí, & Azorín, 2016). ―A good MBA
Research Project/Thesis topic ought to test on two concepts to show some relationship between
them‖ (Safieddine, 2015). The undergraduate Management Research Project (MRP) can test on a
single concept without necessarily showing any relationship (Liu, 2015). But in most cases, most
MBA students are doing MRPs using very simplistic data analysis techniques. Many MBA
theses/project reports in most universities have been archived since they are of poor quality, or a
replica of previous research (Azure, 2016). This is aimed at reducing chances of students
replicating other people’s work and to help supervisors. All faculties/schools should circulate to
their students/lecturers a list of faculty approved journals where those papers can be published.
The same list as proof of quality should be used to promote faculty members (Magutu, 2016).
There are a number of important challenges facing universities in Kenya and include the demand
for access to social equity, funding and the cost to students, governance and internal
3
management, the changing roles of academics, demographic changes among academics,
inefficiency, and ethnicity (Odhiambo, 2014).
The growth in enrolment has resulted in a situation where in many universities in the country,
physical facilities cannot cope with the number of students (Ochumo, 2015). Libraries are
overcrowded, books are outdated, journal holdings lag years behind, laboratories and equipment
are outdated and inadequate, rooms in hostels are overcrowded, and academic staffs are not
compensated appropriately (Tucker, Fisher & Gerrity, 2014). In addition, massification;
overcrowding; ever-growing demand; erosion of technical colleges due to acquisitions and
takeovers by public universities in search of space; insufficient/declining public funding;
curricula that are not responsive to modern-day needs of the labor market; declining quality;
crumbling infrastructure; poor governance; rigid management structures pose major challenges
to the provision of quality education in Kenyan universities (Kremer, Brannen, & Glennerster,
2013.. This perhaps explains why universities offering professional courses are under siege from
professional bodies’ standard criteria that at times assume more than utopian circumstances in
our struggling institutions (Ochumo, 2015).
The main causes for this include: Pressures of massification that require expansion to cater for
the large increase in student numbers (as evident from the demand, it can be expected that this
situation will deteriorate further), economic problems faced by our country arising out of
insecurity and the subsequent decline of some sectors in the economy, a changed fiscal climate
induced by the policies of multilateral lending agencies, inability of students to afford the tuition
required for financial stability, misallocation and poor use of available financial resources by
some of the universities (Ochumo, 2015). Shortage of Academics; In addition, the number of
academic staff in Kenyan universities has not kept pace with the increasing student population;
the situation has deteriorated to a point where the balance between productivity gains and the
quality of teaching is under threat. The student-to-lecturer ratio in the universities has
deteriorated from 25:1 in 1986 to 52:1 in 2013 (Datar, Garvin & Cullen 2014). This, of course,
has strong implications for quality of lecturer interaction with students as well as concerns about
overall teaching learning process (Méndez & Gummesson, 2012).
The issue of brain-drain has also played a part in the current crisis. In Kenya alone, the World
Bank reports that nearly 40 per cent of the country’s highly skilled professionals immigrate to
4
rich countries (Clinebell, 2008). The migration of the highly skilled cadre of academic
professionals and students has led to an acute shortage of academics in Kenya’s universities,
especially in key fields such as science and engineering (Mbirithi, 2013). The number of non-
academic (support) staff is excessive in many Kenyan universities, an aspect that is attributed to
skewed human resource policies. (Boyle, Hermanson & Mensah, 2011) postulate that in
universities where resources are already scarce this is viewed as unaffordable in light of other
academic needs. Some of our universities suffer in general from poor, inefficient, and highly
bureaucratic management systems. Challenges attributed to scholarly research in most Kenyan
universities include the descriptive nature of research and the lack of empirical rigor (in part due
to a lack of resources); paucity of cross-disciplinary research endeavors; limited collaborations
between practitioners and academics; limited linkage between research and the national
development agenda; decreasing state subsidies; shortage of research expertise and experienced
supervisors; high subscription costs of scholarly journals; limited publishing infrastructure; lack
of incentives for researchers; inadequate mentoring frameworks; and weak or non-existent
partnerships (Kilonzo & Magak, 2013).
Applied Research; (Darley & Luethge, 2015) argue that research done in Kenyan universities
tends to focus on local or national development issues by putting an emphasis on applied
research at the expense of basic research. The focus on national or regional issues may mean that
research outcomes are generally not widely applicable to international issues (Zikmund, Babin,
Carr, & Griffin, 2013). Inadequately equipped libraries exacerbate this, with limited access to
modern journals and the internet (Taylor, Jaeger, McDermott, Kodama, & Bertot, 2012). Neither
doctoral students nor their local faculty supervisors are likely to have access to current
theoretical and comparative literature that might provide new and valuable insights in their
research projects. In most libraries, books are ancient, unavailable or the pages largely mutilated
(Lacy, 2014). (Ng’ang’a, Kabethi & Leonard, 2015) found out that University presses are under-
funded or non-existent, and university journals are either few or unavailable. Saint (2015) asserts
that indeed, a recent World Bank report makes this point strongly by admitting: ―Sub-Saharan
Africa is at the bottom of almost every knowledge economy indicator.
(Kimani, 2015) asserts that the massification phenomenon signals a long way to go to create the
foundation for high-quality research, graduate education, and knowledge creation in our
universities in Kenya. As a measure towards survival and sustainability, universities in Kenya
5
have shifted from the public-good paradigm, primarily concerned with national development
pervasive in the literature on higher education, to a market model that engages the neoliberal
ideal of development, one in which the economic survival of the institution becomes paramount.
(Githinji, 2014) notes that Module II programs have been a boon for universities in Kenya by
increasing funding for and broadened access to university goods and services to consumers.
Additionally, the Module II service has opened up access to students previously unable to obtain
post-secondary education at public institutions. Indeed it is noted that Module II revenue has
engendered enhancements for the institutions, expanding their ability to provide services.
Moreover, (Oanda, 2013) agrees that marketization has enabled these institutions to retain and
attract qualified staff by providing opportunities for ancillary income as an incentive. The flip
side to the Module II initiative is when prudent and frugal management and utilization of the
resources in a given institution wants. The massification phenomenon then becomes a burden
due to limited facilities and requisite human resource. The quality of the instruction is hampered
and the desired outcomes of the learning processes as well the impact of the graduates in society
becomes insignificant in measure (Reuben, 2014).
Research Development; It is encouraging to note that most universities in Kenya like the rest in
the world are now thinking strategically by developing strategic plans and mission statements
that aspire to produce highly skilled and globally competitive graduates functional in the
knowledge economy; relate curriculum to labor demand; reconstruct the curriculum to meet
Kenyan needs; support critical, basic research, theory building, experimentation and teaching;
deal with emerging issues; lead in social transformation rather than act as conservative or elitist
institutions; forge links with industry and government to become more innovative and relevant to
society; and participate in or form part of government policy making organs (Sila, & Gichinga,
2016). The Commission for University Education has made remarkable differences in terms of
the quality of teaching, programmes and facilities particularly in the public universities. For
Kenya to accelerate its development and achieve the Sustainable Development Goals, the
government will have to increase its investment in science and technology at the universities and
in turn demand prudent management of resources (Wambui, Ngari, & Waititu, 2016).
The challenges that face Kenyan universities are serious, but there are certainly opportunities,
and with appropriate research and creative effort, a long and bright future could be waiting for
the Kenyan higher education (Odhiambo, 2014). The master of business administration (MBA)

6
degree continues to grow in popularity in response to organizational needs for employees who
can navigate the complexities of current and future business environments (Byrne, 2014).
However, serious questions have been raised about the value of today's MBA program offerings
(Prince, Burns, & Manolis, 2014). Additionally, MBA programs face a threat from emergence of
for-profit providers, combined with reduction of government funds, and increased competitive
pressures between business schools with an emphasis on rankings (Thomas, Thomas, & Wilson,
2013). The need to reduce costs, together with a debatable value proposition, has many business
schools scrambling to improve operational efficiency while also critically examining the
relevance of their curricula. The discipline of operations management (OM) includes the design,
execution and control of processes that transform inputs into value-added outputs
(Stevenson, 2015).
Adam Smith, a Scottish economist, is often credited with the introduction of production
management in the late eighteenth century. He advocated for division of labor which resulted in
repetitive tasks, specialization, and improved efficiency of operations. Subsequent industrial
developments such as interchangeable and standardized parts, stopwatch timing of task activities,
assembly line production, and statistical quality control contributed to a scientific orientation for
production OM. Historically, OM was almost exclusively applied to manufacturing until the
mid-20th century when the number of service jobs accounted for nearly half of the employment
workforce. However, today 63% of gross domestic product in the Kenya is from the service
industry (KNBS, 2015) and OM is widely applied in service-focused businesses. According to
London-based The Times World University Rankings, 15 of the top 20 universities in the world
hail from the US (Jöns, & Hoyler, 2013). Interestingly, American institutions do not require a
master’s theses for most graduate programmes. Students, especially in professional disciplines,
may complete purely on taught programmes (Monk, Foote, & Schlemper, 2012). However, due
to the Commission for University Education’s forced standardization across universities,
Kenyans desiring master’s degrees must complete a research-based thesis even for professional
courses that does not relate to their later employability (Kimathi, & Henry, 2014).
Unfortunately, requiring a student to conduct research but holding no meaningful criteria on the
quality of the research is akin to testing whether a chef can slaughter a chicken but with no
consideration as to whether the chef sickens consumers who eat his poorly prepared meal
(Peters, Howard, & Sharp, 2012). Many students pursue non-academic topics and try mental

7
gymnastics to try and fit them into a research project. Thousands of Kenyan graduate students
ask simple yes or no questions with answers already found hundreds if not thousands of times in
literature (Kivunja, 2016). The same students also possess little or no concept of testing a theory
or contributing to a body of knowledge by refining a theory. Even when writing a non-research
case study, a shortened training manual, or an opinion piece may all receive publication in some
Kenyan peer-reviewed academic journals and qualify under Commission for University
Education criteria (Bailey, 2014). Furthermore, most Kenyan universities do not run anti-
plagiarism checks on research projects, utilizing powerful available industry software (Larsson,
& Hansson, 2013). External investigators find rampant copying and cases where others are paid
to write one’s research project, even among doctoral theses (Addisu, 2012).
The situation is so serious that some top Kenyan universities even run plagiarism software on
PhD holders seeking faculty job placements and find that many professors seeking employment
plagiarized their doctoral thesis and many of their publications. Similarly, they have to drill
lecturers on the content of their doctoral theses to see if they were the actual authors (Talam,
2014). Many students, confused by the lack of clarity in research methods courses and untrained
supervisors, then produce low quality research (Wicker, 2012). Despite setbacks in many
university settings, Kenya holds some phenomenal centers’ of research excellence that rival any
other nation. The challenge faced entail raising the level of research rigour across the entire
sector. Kenya has the brains and the will; now Kenya needs a way (Kearney, & Lincoln, 2013).
So instead of gauging the success of our universities based on preposterous non-credible
websites that produce laughable ratings, There is a need to empower university lecturers,
doctoral researchers, graduate degree students and undergraduate learners on how to design
research projects that may propel Kenya forward and set us up to compete on a global scale.
Simple tools, conceptualizations and literature review techniques may dramatically boost
research output and lift our rigour. (Scott & Bellow, 2015)
Kenya's universities are expanding their facilities and seeking collaborations to tap into a rapidly
growing Masters in Business Administration market (Nyangau, 2016). The MBA has increasing
currency among the working class of East Africa's biggest economy (Odhiambo, 2014). Over the
past few months Kenya's leading universities have spent tens of millions of shillings to boost
their capacity to enroll a soaring number of students seeking additional qualifications. More
universities have entered the MBA market. Strathmore University/Strathmore Business School

8
offers a four-year-old executive MBA programme, which is unique in being associated with
several leading international business schools including Spain's globally ranked IESE Business
School, which is in turn associated with Harvard (Basu, 2016). Statistics show that Kenyan
universities offering MBA programmes are churning out at least 2,500 graduates annually more
than double five years ago. At least half of the country's universities are now offering MBAs,
compared with around eight universities five years ago (Sila, 2016).
Experts say increasing interest in MBAs among the working class is informed by desire on the
part of workers to boost their careers and get better pay, in a market where salaries have not kept
pace with inflation. Statistics in the Kenyan Economic Survey 2015 show that household
incomes grew at the rate of 6.4% in 2010, 7.5% in 2011 and 8.7% in 2012 before peaking at
8.4% in 2014. But high inflationary pressure that almost tripled from 11.9% in 2010 to 29.3%
2014 has eroded purchasing power "As a growing economy Kenya needs highly qualified skills,
and the labor market is becoming very competitive thus requiring the working class to upgrade
their educational qualifications to remain relevant (Odhiambo, 2014).The traditional players in
the MBA market, the biggest higher education institutions in the country attract the largest MBA
classes. Upcoming, smaller public universities have also joined the fray, heightening competition
in the field. Institutions are also rushing to roll out differentiated degrees, with some such as
Strathmore sending students abroad for periods for training (Weinstein, 2013). The competition
front is on differentiation of the MBA programmes because at the end of the day, they all sound
the same (Odhiambo, 2014) while executive MBA programmes in conjunction with. The MBA
market in Kenya is highly competitive, and focus is on producing all-round graduates who,
instead of specializing in specific disciplines, goes through all relevant units (Maina, 2015),
KCA's Deputy Vice-chancellor in charge of academic affairs.
Firms seeking human capital prefer MBA graduates for management positions. The Kenyan
government is banking on education to drive its long-term growth targets under Vision 2030, the
development blueprint that is aimed at making Kenya a middle-income country in the next two
decades (Odhiambo, 2016)."Education is one of the key sectors that will deliver growth in
Kenya," according to a just- published government progress report on Vision 2030. However, it's
faced with key concerns of access, retention, quality, relevance and equity as well as internal and
external inefficiencies, which must be dealt with. (Njeru, 2005) adds that with the demand for
MBA degrees rising, universities are spending heavily on advertising their courses. The growth

9
in the MBA market comes at a time when Kenya's universities are grappling with an admissions
crisis due to growing student numbers, which have not been matched by expansion of facilities.
As a result, quality concerns dog the higher education sector (Bloom, Canning, Chan, & Luca,
2014). Kenya's universities continue to perform poorly in global rankings.
1.2 Statement of the problem
With increased competition for students, limited faculty resources, and budgetary constraints,
MBA programs are under intense pressure to maximize their operational efficiency. This study
aims to pair strategic program objectives with proven OM Practices in critical areas, including
curriculum development, capacity planning, and quality assurance. Framing the administration of
MBA programs in this context provides a foundation for evaluating current practices and
establishing best practice guidance (Sultan & Wong 2012). This study intends to describe a
conceptual framework based on key OM practices and illustrate how employment of these
practices can assist MBA programs with improving operational efficiency, program quality,
effective timing of curriculum enhancements to form an assessment of the degree to which
business schools apply these OM practices in design and implementation of their programs.
According to (Busing & Palocsay, 2016), preliminary investigations and studies show evidently
that the adoption of OM in the MBA setting has been limited to date. Therefore, opportunities
exist for deliberate application of OM practices. A lack of program ownership, internal rivalries
for faculty resources, and enrollment growth are significant challenges facing MBA programs.
Therefore this study is directed towards elaborating these themes, to shed additional light on how
business schools can relate OM concepts and principles as they run MBA programs in Nakuru.
Many faculties in Kenyan universities only publish questionable-quality research that does not
stand up to international standards (Scott & Bellow 2015). The landscape is changing and Higher
education is being reshaped by globalization and the digital revolution. There are growing
pressures related to declining sources of income and rising costs. There is heightened
competition for share of the global student market. Institutions are seeing a lasting effect from
the global financial crisis impacting both enrolment numbers and philanthropy, and students
have increasing demands and expectations of their educational experience. Prospective students
are becoming more consumer-orientated and making decisions about education accordingly.
University rankings will increasingly have more influence on positioning institutions in the

10
international market, and graduate career-readiness is a growing student concern. Students are
looking for access to services and education across new technologies and more flexible delivery
options. In order to be competitive and to meet these expectations, universities will need to
invest in expensive facilities and infrastructure (Bryant, 2013).
Challenges facing Kenya’s higher education institutions: It explores the struggle to develop
quality and quality assurance mechanisms against a background of rapidly diminishing income,
brain drain, political interference and the negative aspects of globalization (Mwangi, & Owino,
2012). The challenges have consequently led to a decline in the quality of education and left
higher education hanging on a thread. This study argues that the higher education sector requires
clear policies of rewarding and retaining talented staff and ways of dealing with the politically
instigated expansion (Chun, & Evans, 2013). It provides an opportunity for reflection on policies
and practices in Kenya’s higher education sector and suggests an urgent need for reforms.
Quality assurance plays a key role in initiating these reforms. Higher education in many
developing countries is no longer a luxury but an essential for survival. However, education
policy-makers in developing countries continue to express concern about the poor state of higher
education.
Given the historical development of higher education institutions in Africa, the universities have
been at the centre of higher education challenges. It is also important to note that many narratives
of higher education development in different parts of Africa demonstrate similarities in many
aspects. African universities, like their counterparts elsewhere, have the responsibility of
advancing the frontiers of knowledge through teaching and research. However, it is important to
note that African universities play a more significant role in national development than they do
in other parts of the world, as they are often the only institutions with some capacity to undertake
research and to generate the knowledge required for development (Bloom, Canning & Chan
2016). Recent university rankings generally show that Kenyan universities save for the two
oldest are performing poorly (CUE, 2015).Other than research, ranking takes into account the
teacher-student ratio, proportion of international faculty members in relation to local staff, and
the number of international students.

11
1.3 Objectives of the study
The aim of this study was to determine effects of Operations Management Practices on the
Quality of MBA Programs of Kenyan Universities.
1.3.1 Specific Objectives
i. To determine how Just-In-Time Teaching (JITT) can improve quality of MBA programs
in Kenyan Universities.
ii. To find out how operation efficiency affects quality of MBA programs in Kenyan
Universities.
iii. To find out how quality assurance affects quality of MBA programs in Kenyan
Universities.
iv. To investigate how capacity planning can lead to high quality MBA program in Kenyan
Universities.
1.4 Research Hypothesis
In order to achieve the objectives, the study developed the following hypothesis:
H01. Just in Time Teaching has no significant impact on the improvement of the quality of
MBA program in Kenyan Universities.
H02. Operation efficiency has no significant effect on the quality of MBA programs in
Kenyan Universities.
H03. Quality assurance has no significant effect on the quality of MBA programs in Kenyan
Universities.
H04. Capacity planning has no significant effect on the emergence of high quality MBA
program design in Kenyan Universities.
1.5 Scope of the Study
The study aimed to establish the how operations management Practices affects the quality of
MBA programs taking the consideration a period of five years (2011-2015). This time frame was
chosen so as to enable determination of the operation management practices that were pre-
existing and those that have recently emerged. This study was limited to Universities in Nakuru
County offering MBA programs in their business schools and the population of the study is staff
from all universities offering MBA program in Nakuru town. The location is choosing due to
proximity and convenience. The

12
1.6 Limitations and Delimitations of the Study
It is expected that universities were hesitant to avail information sort by the study as they
consider their differentiation strategies to be proprietary in nature however the researcher created
a good rapport with the respondents and assure them of the anonymity of the institutions they
represent and their very identities as well. Furthermore they were assured that the information
gathered will be used sorely for the purposes of academic research.
1.7 Significance of the Study
This study intends to discuss the implications for the future role of OM in the context of MBA
program management, as well as opportunities for expanding the framework to incorporate
principles from other functional business areas. While this work will primarily be of interest to
administrators and faculty responsible for MBA program development, it will have relevance
across academic disciplines. CUE ranks graduate business programs based on faculty credentials,
admissions selectivity, student engagement, and recruiter ratings. These criteria are all directly
related to the quality of the business program's operation, from curriculum design to student
acquisition of knowledge, skills and abilities (KSAs). In an early instance of promoting
educational quality initiatives, Wharton School faculty applied total quality management
principles in designing their MBA curriculum (Kleindorfer, 1994). (Hillmer & Kocabasoglu,
2008) described the benefits of incorporating the voice of the customer by obtaining executive
input on expectations of an ideal manager during MBA program redesign. With respect to
sustainability of MBA programs, (Page & Nodoushani, 2006) suggested that effective use of OM
may facilitate both low cost and program distinction.
1.8 Operational Definition of Terms
The following terms were used as follows;
Capacity Planning is the process of determining the production capacity needed by an
organization to meet changing demands for its products. In the context of capacity planning,
design capacity is the maximum amount of work that an organization is capable of completing in
a given period. Effective capacity is the maximum amount of work that an organization is

13
capable of completing in a given period due to constraints such as quality problems, delays,
material handling, etc, (Krajewski, Ritzman, Larry, 2005).
Just in Time Teaching is an instructional strategy that combines online study assignments with
interactive classroom environment to improve student learning and understanding (Clark, 2016)
MBA;A master of business administration (MBA) is a graduate degree achieved at a university
or college that provides theoretical and practical training to help graduates gain a better
understanding of general business management functions. The MBA degree can have a specific
focus, such as accounting, finance or marketing (Alvesson & Benner, 2016).
Operations Management; According to (Heizer, Render & Munson, 2016) OM is an area of
management concerned with designing and controlling the process of production, redesigning
business operations in the production of goods or services. It involves the responsibility of
ensuring that business operations are efficient in terms of using as few resources as needed and
effective in terms of meeting customer requirements. It is concerned with managing the process
that converts inputs (in the forms of raw materials, labor, and energy) into outputs (in the form of
goods and/or services).
Operations Practices; these are the specific methods/tools of OM that are used to come up
desirable results as an end product of using OM strategies (Machado & Davim, 2016).
Operational efficiency is the capability of an enterprise to deliver products or services to its
customers in the most cost-effective manner possible while still ensuring the high quality of its
products, service and support, (Vangie, 2016).
Quality is a product or service’s ability to meet the customers’ need or want or fitness for use
(Juran, 2008)

14
CHAPTER TWO
LITERATURE REVIEW
2.1 Introduction
This Chapter discusses theories, specific objectives and the conceptual framework.
2.2 Theoretical Literature
2.2.1 Deming's Theory of Management
(Deming, 1982) offered 14 key principles for management to follow for significantly improving
the effectiveness of a business or organization. As much as many of the principles are
philosophical, others are more programmatic. All are transformative in nature. The points were
first presented in his book Out of the Crisis (Deming, 1985). The condensation of the 14 Points
for Management are: Create constancy of purpose toward improvement of product and service,
with the aim to become competitive and to stay in business, and to provide jobs; adopt the new
philosophy. We are in a new economic age. Western management must awaken to the challenge,
must learn their responsibilities, and take on leadership for change; Cease dependence on
inspection to achieve quality. Eliminate the need for inspection on a mass basis by building
quality into the product in the first place; End the practice of awarding business on the basis of
price tag. Instead, minimize total cost. Move toward a single supplier for any one item, on a
long-term relationship of loyalty and trust; Improve constantly and forever the system of
production and service, to improve quality and productivity, and thus constantly decrease costs;
Institute training on the job; Institute leadership, the aim of supervision should be to help people
and machines and gadgets to do a better job.
Deming (2016) Supervision of management is in need of overhaul, as well as supervision of
production workers; Drive out fear, so that everyone may work effectively for the company;
Break down barriers between departments. People in research, design, sales, and production must
work as a team, to foresee problems of production and in use that may be encountered with the
product or service; Eliminate slogans, exhortations, and targets for the work force asking for zero
defects and new levels of productivity. Such exhortations only create adversarial relationships, as
the bulk of the causes of low quality and low productivity belong to the system and thus lie
beyond the power of the work force which includes: Eliminate work standards (quotas) on the
15
factory floor. Substitute leadership, Eliminate management by objective and Eliminate
management by numbers, numerical goals. Substitute leadership; Remove barriers that rob the
hourly worker of his right to pride of workmanship. The responsibility of supervisors must be
changed from sheer numbers to quality; Remove barriers that rob people in management and in
engineering of their right to pride of workmanship. This means, inter alia, abolishment of the
annual or merit rating and of management by objective; Institute a vigorous program of
education and self-improvement; Put everybody in the company to work to accomplish the
transformation. The transformation is everybody's job (Deming, 2013).
2.2.2 Crosby's Theory:
On quality, (Crosby, 1982) emphasized, is neither intangible nor immeasurable. It is a strategic
imperative that can be quantified and put back to work to improve the bottom line. Acceptable
quality or defect levels and traditional quality control measures represent evidence of failure
rather than assurance of success. The emphasis, for him, is on prevention, not inspection and
cure. The goal is to meet requirements on time, first time and every time. He believes that the
prime responsibility for poor quality lies with management, and that management sets the tone
for the quality initiative from the top.
His approaches to quality are unambiguous and in his view, good, bad, high and low quality are
meaningless concepts, and the meaning of quality is conformance to requirements. Non-
conforming products are ones that management has failed to specify or control. The cost of non-
conformance equals the cost of not doing it right first time, and not rooting out any defects in
processes. Zero defects do not mean that people never make mistakes, but that companies should
not begin with allowances or sub-standard targets with mistakes as an in-built expectation.
Instead, work should be seen as a series of activities or processes, defined by clear requirements,
carried out to produce identified outcomes. Systems that allow things to go wrong - so that those
things have to be done again - can cost organizations between 20% and 35% of their revenues, in
his estimation.
Crosby (1982) seminal approach to quality was laid out in Quality is free and is often
summarized as the 14 steps: Management commitment: The need for quality improvement must
be recognized and adopted by management, with an emphasis on the need for defect prevention.
Quality improvement is equated with profit improvement. A quality policy is needed which
16
states that ' each individual is expected to perform exactly like the requirement or cause the
requirement to be officially changed to what we and the customer really need. Quality
improvement team: Representatives from each department or function should be brought
together to form a quality improvement team. Crosby (1982), these should be people who have
sufficient authority to commit the area they represent to action.
Quality measurement: The status of quality should be determined throughout the company. This
means establishing quality measures for each area of activity that are recorded to show where
improvement is possible, and where corrective action is necessary. He advocates delegation of
this task to the people who actually do the job, so setting the stage for defect prevention on the
job, where it really counts. Cost of quality evaluation: The cost of quality is not an absolute
performance measurement, but an indication of where the action necessary to correct a defect
will result in greater profitability. Quality awareness: This involves, through training and the
provision of visible evidence of the concern for quality improvement, making employees aware
of the cost to the company of defects. He stresses that this sharing process is a - or even the - key
step in his view of quality.
Corrective action: Discussion about problems will bring solutions to light and also raise other
elements for improvement. People need to see that problems are being resolved on a regular
basis. Corrective action should then become a habit. Establish an ad-hoc committee for the Zero
Defects Programme: Zero Defects is not a motivation programme its purpose is to communicate
and instill the notion that everyone should do things right first time. Supervisor training: All
managers should undergo formal training on the 14 steps before they are implemented. A
manager should understand each of the 14 steps well enough to be able to explain them to his or
her people. Zero Defects Day: It is important that the commitment to Zero Defects as the
performance standard of the company makes an impact, and that everyone gets the same
message in the same way. Zero Defects Day, when supervisors explain the programme to their
people, should make a lasting impression as a 'new attitude' day.
Goal setting: Each supervisor gets his or her people to establish specific, measurable goals to
strive for. Usually, these comprise 30-, 60-, and 90-day goals. Error cause removal: Employees
are asked to describe, on a simple, one-page form, any problems that prevent them from carrying
out error-free work. Problems should be acknowledged within twenty-four hours by the function

17
or unit to which the problem is addressed. This constitutes a key step in building up trust, as
people will begin to grow more confident that their problems will be addressed and dealt with.
Recognition: It is important to recognize those who meet their goals or perform outstanding acts
with a prize or award, although this should not be in financial form. The act of recognition is
what is important. Quality Councils: The quality professionals and team-leaders should meet
regularly to discuss improvements and upgrades to the quality programme. Do it over again:
During the course of a typical programme, lasting from 12 to18 months, turnover and change
will dissipate much of the educational process. It is important to set up a new team of
representatives and begin the programme over again, starting with Zero Defects day. This
'starting over again' helps quality to become ingrained in the organisation.
2.2.3 Joseph Juran's Theory
Juran (2008) was a charismatic figure, acknowledged worldwide for his extensive contribution to
quality management. While often referred to as one of the leading figures of total quality
management, much of his work actually preceded the total quality concept. He became a legend
in his own time, and has been instrumental in shaping many of our current ideas about quality.
He is recognized, along with Deming, as greatly accelerating the development of the quality
movement in Japan. His influence on manufacturing throughout the world has been substantial.
Pareto Principle: In his early days as a young engineer he noted that when a list of defects was
arranged in the order of frequency, relatively few types of defects accounted for the bulk of those
found. As his career in management progressed he noted the occurrence of this phenomenon in
other areas. The idea of 'the vital few and the trivial many' was forming. In the 1930s he was
introduced to the work of Pareto (1935) an Italian economist, who had produced a mathematical
model to explain the unequal distribution of wealth. Pareto had not promoted his model as a
universal one and did not talk of an 80:20 split, but in preparing the first edition of the Quality
control handbook he needed a form of shorthand to describe his idea. Remembering Pareto's
work he captioned his description as 'Pareto's principle of unequal distribution'. Since then 'the
Pareto Principle' has become a standard term to describe any situation where a relatively small
percentage of factors are responsible for the substantial percentage of effect. He later published
an explanation of his error in attributing more to Pareto than the latter had originally claimed, at
the same time recognizing the contribution of another economist, Lorenz (1916). He was, in
18
reality, the first to identify and popularize the 80:20 rules (as it has colloquially become known)
as a universal principle.
Breakthrough: In his classic work, Managerial breakthrough, He presented his general theory of
quality control. Central to this was the idea of an improvement breakthrough. He defines a
breakthrough as 'change, a dynamic, decisive movement to new, higher levels of performance'
(Juran, 1994). This he contrasts with control, which means 'staying on course, adherence to
standard, prevention of change' (Juran, 1994). Not all control is viewed as negative and not all
breakthroughs are expected to be for the good. Breakthrough and control are seen as part of a
continuing cycle of events. He highlighted the importance of managers' understanding of the
attitudes, the organisation and the methodology used to achieve breakthrough, and of how they
differ from those used to achieve control.
The Juran Trilogy and Quality Planning Road Map: His message on quality covers a number of
different aspects. He focused on the wider issues of planning and organisation, managerial
responsibility for quality, and the importance of setting targets for improvement. Intrinsic to
these, however, was his belief that quality does not happen by accident and needs to be planned.
The process of quality improvement is best summarized in his 'trilogy' concept, based on the
three financial management processes of financial planning, financial control and financial
improvement. Various interpretations of the trilogy have been published, and the following
represents one version.
Quality planning: Identify who the customers are, Determine the needs of those customers,
Translate those needs into our language and Optimize the product features so as to meet our
needs and customer needs. Quality control: Develop a process which is able to produce the
product and optimize the process. Quality improvement: Prove that the process can produce the
product under operating conditions and Transfer the process to operations. His road map
provides a more detailed approach to the steps within the quality planning element of the trilogy.
It is made up of a series of actions with corresponding outputs, and emphasizes the need for
measurement throughout. Juran on quality by design, He describes six activities in the road map:
Establish quality goals; identify the customer; determine customer needs; develop product
features; develop process features; establish process controls; and transfer to operations.
19
Quality campaigns: He has never been a fan of quality campaigns based on slogans and praise.
He viewed the Western quality crisis of the early 1980s as being a result of too many quality
initiatives based on campaigns with too little planning and substance. In his view planning and
action should make up 90% of an initiative, with the remaining 10% being exhortation. His
formula for success is: Establish specific goals to be reached, establish plans for reaching those
goals, Assign clear responsibility for meeting the goals, Base the rewards on the results achieved.
2.2.4 Ishikawa's Theory
Creator of the last theory, Isikawa (1985) is often known for his namesake diagram, but he also
developed a theory of how companies should handle their quality improvement projects.
Ishikawa takes a look at quality from a human standpoint. Kaoru Ishikawa wanted to change the
way people think about work. He urged managers to resist becoming content with merely
improving a product's quality, insisting that quality improvement can always go one step further.
His notion of company-wide quality control called for continued customer service. This meant
that a customer would continue receiving service even after receiving the product. This service
would extend across the company itself in all levels of management, and even beyond the
company to the everyday lives of those involved. According to Ishikawa, quality improvement is
a continuous process, and it can always be taken one step further.
With his cause and effect diagram (also called the "Ishikawa" or "fishbone" diagram) this
management leader made significant and specific advancements in quality improvement. With
the use of this new diagram, the user can see all possible causes of a result, and hopefully find
the root of process imperfections. By pinpointing root problems, this diagram provides quality
improvement from the "bottom up." Dr. W. Edwards Deming one of his colleagues adopted this
diagram and used it to teach Total Quality Control in Japan as early as World War II. Both him
and Deming use this diagram as one the first tools in the quality management process.
He also showed the importance of the seven quality tools: control chart, run chart, histogram,
scatter diagram, Pareto chart, and flowchart. Additionally, Ishikawa explored the concept of
quality circles- a Japanese philosophy which he drew from obscurity into world wide acceptance.
He believed in the importance of support and leadership from top level management. He
continually urged top level executives to take quality control courses, knowing that without the
support of the management, these programs would ultimately fail. He stressed that it would take

20
firm commitment from the entire hierarchy of employees to reach the company's potential for
success. Another area of quality improvement that he emphasized is quality throughout a
product's life cycle - not just during production. Although he believed strongly in creating
standards, he felt that standards were like continuous quality improvement programs -- they too
should be constantly evaluated and changed. Standards are not the ultimate source of decision
making; customer satisfaction is. He wanted managers to consistently meet consumer needs;
from these needs, all other decisions should stem.
2.3 The Effectiveness of OM Practices
The most commonly used OM practices meant to enhance quality of MBA programs will be
discussed. Operation Management practices are the procedures or methodological solutions
which is meant to improve efficiency. General approaches like the ―World Class Manufacturing‖
(WCM) approach which embraces detailed tools conceived to optimize workplace organization,
professional maintenance and so on are also considered. More specific practices are also
considered, such as the ―Total Quality Management‖ (TQM) approach with regard to quality
management and the ―Total Productive Maintenance‖ (TPM) approach, with regard to
maintenance practices, or the ―Just-in-Time‖ (JIT) approach, with regard to production
operations (Heijunka & Kanban, 2014).
As an example, the case of Total Quality Management (TQM) is described. The adoption of this
approach will be shown to be positively associated with the improvement of general
performance, with higher operation efficiency and with better financial results. Such a positive
association increases in the manufacturing sector, when managers use a reward system actually
based on OM process outcomes.
It is also a powerful ally for the optimal exploitation of economic assets and of human capital.
Yet, the statistical tools offered to control the production processes can bring about a positive
effect on the quality level perceived by the final customer (business or consumer) and can
dramatically reduce production waste this altogether leading to better economical results
(Battistoni, Bonacelli, Colladon, & Schiraldi, 2013). In order to succeed with TQM it is
extremely important to provide employees with a basic training in quality management.
21
2.4 Total Quality Management
Continuous and never ending improvements, Organizations using a TQM system engage in
incremental improvements continuously to affect the quality of the business’s processes and
products (Sallis, 2014). A continuous improvement approach requires employees to strive for
zero defects and efficiency in all processes. Continuous-improvement activities seek areas
requiring improvement in a proactive manner. External and internal customers are the focus of
TQM systems. External customers are businesses or individuals who place orders for products
from an organization. Internal customers in an organization are co-workers or departments that
accept work as it moves through the company. For example, in a production line, an internal
customer is the co-worker at the next stage in the manufacturing process. In a business that
practices Total Quality Management, each employee must identify his customers and determine
the best way to satisfy their quality needs (Oakland, 2014). Employees must identify their
suppliers and communicate their quality needs to the supplier.
TQM systems rely on the people working in an organization to improve quality and processes.
Every individual from top-level managers to the lowest level employee is involved in the
continuous improvement process in organizations using this system (Nawelwa, Sichinsambwe, &
Mwanza, 2015). Companies provide training in the tools, concepts and techniques of the quality
management system to all employees. TQM companies create an atmosphere of teamwork and
empower workers to take the initiative to improve processes and quality (Talib, Rahman, &
Qureshi, 2013). These systems cannot function without the involvement and encouragement of
upper management.TQM organizations use measurable data to make decisions for the company’s
improvement efforts. Tools such as statistical process control, process mapping and bar graphs
help employees and management identify quality issues and provide a method to measure the
success of a quality initiative (Dale, Bamford, Bamford, & Wiele, 2016). Flow charts help
quality improvement teams understand a process and identify weaknesses such as duplications of
steps in the workflow. Businesses use data to track quality defects and find areas that need
improvement.

22
2.4.1 Capacity Planning
Capacity Planning is the process of determining the production capacity needed by an
organization to meet changing demands for its products. In the context of capacity planning,
design capacity is the maximum amount of work that an organization is capable of completing in
a given period. Effective capacity is the maximum amount of work that an organization is
capable of completing in a given period due to constraints such as quality problems, delays,
material handling, etc, (Krajewski, Ritzman, and Larry 2005). A discrepancy between the
capacity of an organization and the demands of its customers results in inefficiency, either in
under-utilized resources or unfulfilled customers (Wairimu, 2014). The goal of capacity planning
is to minimize this discrepancy. Demand for an organization's capacity varies based on changes
in production output, such as increasing or decreasing the production quantity of an existing
product, or producing new products (Banker, Byzalov, & Dujowich, 2013). Better utilization of
existing capacity can be accomplished through improvements in overall enterprise efficiency.
When making capacity decisions, managers must answer the simple question, "How much?"
Determining the organization's capacity to produce goods and services involves both long-term
and short-term decisions. Long-term capacity decisions involve facilities and major
equipment investments.
2.4.1.1 Long-Term Capacity Planning
Capacity can be increased through introducing new techniques, equipment and materials,
increasing the number of workers or machines, increasing the number of shifts, or acquiring
additional production facilities Capacity Planning (Georgiadis, & Athanasiou, 2013).Over the
long term, capacity planning relates primarily to strategic issues involving the firm's major
production facilities. In addition, long-term capacity issues are interrelated with location
decisions (Fleischmann, Meyr, & Wagner, 2015). If the firm's addition of a third shift to its
current two-Technology and transferability of the process to other products is also intertwined
with long-term capacity planning. Long-term capacity planning may evolve when short-term
changes in capacity are insufficient shift plan still does not produce enough output, and
subcontracting arrangements cannot be made, one feasible alternative is to add capital equipment
and modify the layout of the plant (long-term actions) (Kerzner, 2013). It may even be desirable
to add additional plant space or to construct a new facility (long-term alternatives).

23
2.4.1.2 Short-Term Capacity Planning
In the short term, capacity planning concerns issues of scheduling, labor shifts, and balancing
resource capacities. The goal of short-term capacity planning is to handle unexpected shifts in
demand in an efficient economic manner. The time frame for short-term planning is frequently
only a few days but may run as long as six months (Fleischmann, Meyr, & Wagner,
2015).Alternatives for making short-term changes in capacity are fairly numerous and can even
include the decision to not meet demand at all (Chien, & Kuo, 2013). The easiest and most
commonly-used method to increase capacity in the short term is working overtime. This is a
flexible and inexpensive alternative. While the firm has to pay one and one half times the normal
labor rate, it foregoes the expense of hiring, training, and paying additional benefits. When not
used abusively, most workers appreciate the opportunity to earn extra wages. If overtime does
not provide enough short-term capacity, other resource-increasing alternatives are available
(Fleischmann, Meyr, & Wagner, 2015). These include adding shifts, employing casual or part-
time workers, the use of floating workers, leasing workers, and facilities subcontracting.
As internationalization becomes increasingly integral to university operations, it raises the
question of institutional capacity and whether the university is in fact able to respond to the new
challenges it is facing (Sahay, & Kumar, 2014). Capacity planning is often proposed as a key
tool for a more rational and systematic approach to bringing about the necessary changes for
greater internationalization in institutional direction and daily operations. However, many people
in universities are cynical about the value of capacity planning in higher education, believing that
it does not fit with academic cultures and traditions. When an appropriate model is adopted, it
not only aligns with the specific needs and behaviors of universities, but also has the potential to
turn what is often rhetoric into reality. While it is true that the practice of capacity planning has
been imported from the business world (which had adapted it from the original military model),
it is essential to take the specific nature and modes of operation of a university into consideration
if capacity planning is to be accepted and embraced both as a concept and a system that can
provide direction and facilitate progress (Fleischmann, Meyr, & Wagner, 2015).

24
2.4.2 Just In Time Teaching
Just-in-time teaching (JiTT) is a pedagogical strategy that uses feedback between classroom
activities and work that students do at home, in preparation for the classroom meeting (Duker,
Gawboy, Hughes, & Shaffer, 2015). Just in time teaching is an instructional strategy that
combines online study assignments with interactive classroom environment to improve student
learning and understanding (Clark, 2016).The goals are to increase learning during classroom
time, to enhance student motivation, to encourage students to prepare for class, and to allow the
instructor to fine-tune the classroom activities to best meet students’ needs (Tucker, 2013). These
are listed as some benefits. Do you observe that your students gain these or other benefits?
Maximizes the efficacy of the classroom session, where human instructors are present. Structures
the out of class time for maximum learning benefit and creates/sustains team spirit. Students and
instructors work as a team toward the same objective, to help all students pass the course and
retains maximum amount of knowledge (Li, & Xin, 2012).
Just-in-time teaching is very useful for effective use of class time and works as a good gauge to
ascertain where students are in their learning (Clark, 2016). It also helps identify common areas
of interest or confusion, and provides opportunities to define key areas that need further attention
not just for teachers but also for students themselves, since they get some time to connect new
knowledge with prior knowledge and make independent and personalized connections with the
material before hearing someone else's (trainer's or classmate's) views (Brame, 2013). This
facilitates self-regulated learning and meta-cognition. A further modification, which could be a
bit more time-consuming, could include a two-tier mechanism where they could work on their
own, provide feedback, and then have classmates add reflections or critiques to their feedback,
which could then be further refined and sharpened based on the interplay of ideas (Tucker,
2013). All this of course requires dedicated participation and a shared belief in punctuality and
collaborative support (McGraw, 2015).
Just-in-Time Teaching improves student learning and increases in-class teaching efficiency and
effectiveness. JiTT does this by incorporating research-based knowledge about effective teaching
and learning practices. Specifically, JiTT: Improves students' preparation for class, enhances
student motivation for learning, promotes ongoing formative assessment of student learning (by
both instructors and students), and informs in-class activities that target student learning gaps
25
(Borrego, Cutler, Froyd, Prince, & Henderson, 2011). Because of its flexibility this strategy can
be applied to variety of context, curriculum, and disciplines. It can be combined with other
innovative student-centered teaching practices including flipped classrooms, cooperative
learning strategies, peer instructions practices and interactive lecture demonstrations. Before
implementing the JiTT, the instructor must consider his or her own style, classroom setting and
use of technology (Clark, 2016). The instructor must decide which courses will use the strategy,
how often to assign the exercise, which technology tools will be used, and what teaching and
methods will be used to conduct the lessons.
2.4.3 Operational efficiency
Operational efficiency is the capability of an enterprise to deliver product or services to its
customers in the most cost-effective manner possible while still ensuring the high quality of its
products, service and support (Vangie, 2014). Operational efficiency is often achieved by
streamlining a company's core processes in order to more effectively respond to continually
changing market forces in a cost-effective manner. To attain operational efficiency a company
needs to minimize redundancy and waste while leveraging the resources that contribute most to
its success and utilizing the best of its workforce, technology and business processes (Muriuki,
2015). The reduced internal costs that result from operational efficiency enable a company to
achieve higher profit margins or be successful in highly competitive markets, (Vangie, 2014).
Leaders across the higher education space are under more pressure than ever before to do more
with less. After all, student expectations and needs are growing, as are external expectations for
the performance of higher education institutions. However, the operating budgets for institutions
across the country are dwindling. Improving operational efficiency and streamlining outdated
processes are emerging as silver bullets for the long-term viability of colleges and universities,
but what does it take to make efficiency effective? (Cathy, 2014). The most important thing for
Institutions to do is to focus on what they’re trying to achieve. The outcomes are to help students
learn, achieve and complete degrees and credentials and then we back up from there. What are
all the things that can make the process better and more efficient? To see higher education
leaders looking at the whole picture but definitely looking at some of the back-office operations
and ways they can be leaner, more efficient and deploy people in areas that actually add value to
the student experience.

26
The degree to which institutions are able to serve more students and help them progress in a
timely fashion toward their degrees and credentials will allow institutions to expand enrollments,
and that will increase revenues (Cathy, 2016). Overall, this will create a more financially
sustainable institution, one operating at peak efficiency. This will also allow institutions to have
some investment capital, R&D funding, in order to try innovative new practices. Operational
efficiencies and systems and so forth can help higher education. Another point is the importance
of all the data institutions are now collecting from different places and their ability to analyze
this data and to identify places where they can intervene that will make the most difference.
Here’s where they’d like to see a lot of growth, where there’s a lot of work in terms of learning
analytics, predictive analytics and more customized, personalized learning. This is helping more
students more quickly, more efficiently, more effectively gain mastery of the knowledge they
need in order to graduate and be successful, (Cathy, 2014).
2.4.4 Quality Assurance
Quality assurance is an organization’s guarantee that the product or service it offers meets the
accepted quality standards. It is achieved by identifying what "quality" means in context;
specifying methods by which its presence can be ensured; and specifying ways in which it can
be measured to ensure conformance (Eurostat, 2009). Quality is an important factor when it
comes to any product or service. With the high market competition, quality has become the
market differentiator for almost all products and services. Quality Assurance is a broad practice
used for assuring the quality of products or services. There are many differences between
quality control and quality assurance. In quality assurance, a constant effort is made to enhance
the quality practices in the organization.
Therefore, continuous improvements are expected in quality functions in the company. For this,
there is a dedicated quality assurance team commissioned. Sometimes, in larger organizations, a
'Process' team is also allocated for enhancing the processes and procedures in addition to the
quality assurance team (McLaughlin, McLaughlin, & Kaluzny, 2004). Quality assurance team
of the organization has many responsibilities. First and foremost responsibility is to define a
process for achieving and improving quality. Some organizations come up with their own
process and others adopt a standard processes. Quality assurance function of an organization
uses a number of tools for enhancing the quality practices. These tools vary from simple
techniques to sophisticated software systems. The quality assurance professionals also should

27
go through formal industrial trainings and get them certified (Gunasekaran, Korukonda,
Virtanen, & Yli-Olli, 1994). This is especially applicable for quality assurance functions in
software development houses. Since quality is a relative term; there is plenty of opportunity to
enhance the quality of products and services, (Eurostat, 2009.) The quality assurance teams of
organizations constantly work to enhance the existing quality of products and services by
optimizing the existing production processes and introducing new processes. Quality assurance
(QA) mechanisms used to be highly dependent on national administrative traditions but
nowadays there is a convergence of mechanisms. Compared to more developed higher
education (HE) systems in the world, QA systems in Africa are still at an infant stage and thus
confronted by many challenges (Odhiambo, 2014)
The Value of Student Engagement Data for Quality Assurance Interest in the quality of
university education has grown considerably over the last decade or two (Green, 2014).
Although the specification, assurance and enhancement of quality are often complex and
problematic, strong interest in the phenomenon has been stimulated and maintained by a range of
factors. Students need accurate information about educational quality to help them choose
between different courses of study (Brown, Bull, & Pendlebury, 2013). Academics and
university administrators need information to help them monitor and improve their courses and
programmes. Institutions need information about quality to help them benchmark and market
their performance. Governments and other bodies need information to assist with funding, policy
development and accountability.
For these and other reasons, quality assurance has become part of the fabric of many higher
education systems (Green, 2014). As the principles and practices of quality assurance become
more and more embedded in higher education, methodological questions about evaluating
quality become increasingly important. There is accordingly, an ongoing need to examine the
cogency of such indicators and to ensure that they are salient, sufficient and sound. While
universities routinely collect a considerable and often increasing amount of data for the purposes
of quality assurance, it is, at the same time, important to keep reviewing the indicators and other
measures that are at the heart of such routines (Coates, 2005).

28
2.4.4.1 Assurance of Learning Process Mapping
Many organizations use mapping to conceptualize and analyze processes for change
management initiatives (Busing & Palocsay, 2016). It is frequently used as a platform to devise
the best process with attention to both cost and quality. Diagramming a process often uncovers
inefficiencies (e.g., redundant operations, documentation, and other non–value added activities)
and can also be applied to new product or service development. Formal assurance of learning is
required for business school accreditation (Association to Advance Collegiate Schools of
Business International, 2013). Stakeholders believe that taking part in assurance of learning
activities improves the quality of their MBA programs. These objectives are developed by
gathering data from a variety of sources including potential employers, market analyses, and
faculty expert opinions. Program level learning objectives should be revisited for relevance every
two to three years or more often, if needed. Course-specific touch points associate learning
objectives with a class or group of classes in the curriculum and thus require faculty buy-in
(Brenton, 2015). Program-level learning objectives with corresponding touch points are used for
assurance of learning by 72% of MBA programs that responded to the survey.
Course-specific instruments are developed to measure students' mastery of the learning
objectives. Embedded measures such as exam questions are popular and, in OM process flow
terms, fall below the line of visibility for the student (Radnor & Osborne, 2016). Grading rubrics
are constructed prior to administering an assessment instrument to stipulate levels of proficiency.
Our survey indicated that learning objectives are evaluated with faculty-designed assessments in
58% of MBA programs. Pedagogical change(s) aimed at improving teaching effectiveness are
suggested based on assessment results. It is critical to document instructional reforms so that the
effects of any modifications can be measured and decisions about permanent adoption can be
made.
However, we found that faculty in only 36% of the MBA programs surveyed are currently
engaged in documenting pedagogical changes for assessment purposes. Faculty meetings bring
MBA instructors back together to discuss mastery of each learning objective, as evaluated by
multiple raters, in the last step before the entire process repeats itself. Ideas for how to better
achieve each learning objective via pedagogy are shared, vetted, and proposed for
experimentation and implementation (Busing, & Palocsay, 2016). This also provides an

29
opportunity to revisit course-specific touch points and ensure learning objectives are
appropriately tied to courses.
2.5 Faculty and Student Quality Circles
Quality circles, originally used in Japan and brought to the United States in the 1970s, offer a
voluntary way for employees to participate in resolving quality and productivity issues. Circle
members are normally charged with identifying problems' root causes and generating solutions.
In the United States, quality circles have had varying degrees of success. Based on extensive
survey research, (Gray, 1993) concluded that quality circles are dependent upon top management
support and involvement, organizational goals that are clearly defined and understood, a shared
responsibility for products and processes, and effective communication throughout the
organization.
Student quality circles have several potential benefits when evaluating MBA programs. Root
cause analysis can be effective as quality improvement for the program and simultaneously
provide engaged learning for the students (Busing, & Palocsay, 2016). A student circle was
especially helpful during the introductory stage of a redesigned MBA program at our institution.
This program was based on four 10-week quarters, while the rest of the university followed a 16-
week semester format. A student-led quality circle noted that many of the university's facilities,
such as libraries and food services, were sometimes unavailable to them. They also complained
about an overly complex financial aid process with significant delays and identified problems
with course registration and transcript updating by the registrar. The root cause of these problems
was determined to be the incompatibility of the MBA program schedule with university
operations. The quality circle proposed a change to eight-week blocks with Saturday sessions to
resolve the schedule conflicts and achieve equivalent class time.
Faculty quality circles can serve to enhance MBA program pedagogy, content, and delivery as
well as operations strategy. Shared teaching expertise and deliberation around competitive
priorities such as coping with changes in demand, technical support for online courses, and
meeting launch dates for new programs fall within their scope (Rubin & Dierdorff, 2013).
Bringing student and faculty circles together can also affect operational improvements. This is
promoted by (Currie & Knights, 2003), whose study suggested that management professors and
students, especially those with significant work experience, prefer to learn about problems and

30
work collaboratively to find solutions. Our survey results show that 65% of MBA programs are
currently incorporating faculty or student quality circles to support continuous improvement.
2.6 Scheduling for Predictable Flow of Students
(Back, 2012) postulates that there are two extremes to facilities layout and associated operations
flow: product orientation and process orientation. Product-oriented layout provides necessary
resources in a sequence that corresponds to the routing for the product or service. This is an
excellent choice when little or no customization in the product or service exists (e.g., electronics,
automobiles, airport security checkpoints). These operations are typically associated with
relatively high volumes and have the operational advantage of low cost. In contrast, process-
oriented layout allows the required steps for a product or service to be completed in almost any
sequence, allowing for more tailoring to customer preferences (Busing, & Palocsay, 2016).
While the main advantage of process-oriented flow is flexibility, it is generally not as cost
effective as product-oriented flow.
(Finch, 2008) explains that flow of students through the MBA program is one of the most critical
design features for cost effectiveness. A product orientation is characterized by cohort-style
MBA programs where students follow a pre-specified routing through the courses. It assists in
five important efficiencies: Students are more likely to stay on track for graduation, Faculty
requirements are known well in advance, Courses can be sequenced to balance instructors'
teaching schedules, Instructors in downstream courses can make assumptions about the KSAs of
incoming students, beyond that of prerequisite coursework and Classes can be filled closer to
their capacities.
(Allen, 2002) agrees that Cohort-based programs have the added benefit of fostering teamwork
and collaboration among students. From an operational perspective, consistent and logical
operational flow not only leads to efficiencies in terms of cost, but also increases quality of the
experience. However, only 46% of the respondents reported use of a cohort system for all MBA
programs. Another 22% do not have a predictable sequence of course offerings, while the
remainder employs a mixture, with students taking core courses in groups. Difficulty in
scheduling electives combined with inadequate faculty resources was frequently cited as
problematic.

31
2.7 Concurrent Engineering for Curriculum Design
To improve efficiency, many companies have embraced a concurrent engineering approach using
cross-functional teams for development and delivery of completed goods and services
(Stevenson, 2015). (Cooke & Barnard, 2013) show that new product development often fails as a
direct result of an organization's functional specialization or silo approach to product
development. Conversely, cross-functional design teams can serve to improve communication,
reduce errors, and speed up the design process; thus, significantly reducing time to market. A
study of Malaysian electronics manufacturers found that product development activities are
positively and significantly influenced by cross-functional teamwork in a parallel, integrated
mode (Ng & Jee, 2014). This collaboration is even more important in designing services since
customer contact occurs during the transformation process, where errors are not likely
discovered and corrected without their knowledge.
Outstanding MBA programs must have curriculum that is valued in the marketplace along with
effective instruction that is error-free in terms of delivery. Program development success
therefore depends upon input of faculty from all functional areas, thus integrating traditionally
silo disciplines (Navarro, 2008). (Haskins, 2005) described how University of Virginia's Darden
School faculty worked together to develop and continuously improve the required-curriculum
phase of the MBA program. The key to their successful design was a shared values statement
that is indicative of collaboration, communication, and cross-functional efforts. (Barker, 2011)
further described this as a culture where the MBA program is central to the school's mission as a
catalyst for world-class programs.
An equally important participant group on the cross-functional design team is those who will
ultimately employ the program graduates. They are, perhaps, in the best position to help predict
the KSAs that are critical for expert business leadership. As (Molinero & Portillo, 2010) noted,
global companies have varying KSA needs for employees, depending on region. Additionally,
most programs fail to cultivate a global view of business among their graduates (Bareket, 2011).
Therefore, the program should explicitly incorporate needs of employers from all geographical
regions served by the program. Involving employers in program design also has the potential for
valuable partnerships between degree-granting institutions and industry.
32
Some have argued that prospective students should have a hand in the curriculum design process
because of their professional work and international savvy (Wilson, 2002). These individuals
may indeed offer valuable input on program structure (e.g., scheduling, location, balance of
online vs. face-to-face class time). Supporting this point, (Rydzewski, Eastman, & Bocchi, 2010)
conducted a study of prospective MBA student perception. Results of that research indicate that
actual courses offered are of less importance to prospects than are all other factors, including
program quality, length, and cost.
MBA curriculum design is mainly done by administrators (associate dean and/or MBA director).
In most programs, faculty from management (92%), finance (92%) marketing (89%), and
accounting (84%) also participate. Representation from other business disciplines included
economics (65%), information systems (65%), and international business (49%). But
surprisingly, only about half of the programs currently integrate employers or executive advisory
boards into the design process for external validation. The primary means of obtaining input
from advisory boards are periodic campus visits (76%) and surveys (52%). Student involvement
is more limited with approximately 20% of programs using current students and/or alumni and
5% using prospective students.
Life cycles describe the behavior of products and services from conception through end of
existence. The typical stages of a life cycle (Stevenson, 2015) as they relate to MBA
concentrations or programs: an initial phase with small enrollments followed by steep growth,
maturity, and eventually decline. At our institution, life cycles for both MBA curricula and
program structure have become shorter due to competition for student enrollment, a need for
online delivery of management education, changing accreditation standards, and an increased
emphasis on building programs in response to employers' changing needs (Thomas &
Corneul, 2011). (Schlegelmilch & Thomas, 2011) described the MBA of the future as quite
different in content and delivery mode. They predict greater emphasis on corporate social
responsibility, ethics, and soft skills that allow complex dialog between business and multiple
stakeholder groups. From an operational standpoint, shorter life cycles will require agility and
speed in both curriculum development and execution (Busing, & Palocsay, 2016).
33
2.8 Research Gap
The master of business administration (MBA) degree continues to grow in popularity in response
to organizational needs for employees who can navigate the complexities of current and future
business environments (Byrne, 2014). However, serious questions have been raised about the
value of today’s MBA program offerings (Bruce, 2010; Prince, Burns, & Manolis, 2014).
Overall, however, discussion or demonstration of OM practices in higher education sector in
Kenya has not been adequately addressed in available literature. To fill this gap, this study
identified major objectives for MBA programs (Rubin & Dierdorff, 2013) and maps them to
well-grounded OM methods (Jacobs & Chase, 2014; Stevenson, 2015).

34
2.9 Conceptual Framework
The study was guided by a conceptual framework, which identifies the independent and
dependent variables. The independent variables were Just in Time practices, Operation
Efficiency, Quality Assurance and Capacity Planning. The dependent variable was Quality of
MBA Programs.
Independent Variables Dependent Variable
(Operations Management Practices) (Quality of MBA Programs)
Figure 2.1: Conceptual Framework
Source: Researcher (2016)
Quality of MBA Programs
Increased Enrollments
Ranking
Research output
Market acceptability
Timely completion
Just-In-Time Teaching
Increase flexibility/efficiency
Create/sustain team spirit
Time reduction
Provide feedback
Quality Assurance
Compliance to standards
Industrial acceptability
Capacity Planning
Hard (quantitative) indicators
Soft(qualitative) indicators Moderating Variables
Regulatory bodies
International Competition
Government policies
Operational Efficiency
Turnaround time
Effectiveness

35
CHAPTER THREE
RESEARCH METHODOLOGY
3.1 Introduction
This chapter covers the methodology, procedures that was used, a description of the research
area, an outline of the study population, sample size, sampling techniques, data sources, research
instruments, data collection procedures, data analysis and presentation.
3. 2 Research Design
This study will used descriptive survey design to describe the characteristics of the variables
under the study. This design is appropriate for this study because it analyzed the relationship
between operations management practices and quality of MBA Programs. The study
concentrated on universities offering MBA within Nakuru town. The data was gathered at a
particular point in time with the intention of describing the nature of the existing conditions,
identifying the standards against which existing conditions can be compared and determining the
relationship that exists between specific events (Orodho, 2009).
3.3 The Study Area
The study was carried out in Universities based in Nakuru Town, Kenya. This area of the study
is chosen as it has witnessed an increase in the number of universities setting up in Nakuru Town
in the last ten years and is dubbed to be the fastest growing towns in Africa much of which is
attributable to educational and commercial activities as well as being a metropolitan city, a
melting pot of diverse cultures and economic sectors.
3.4 Target Population
Mugenda and Mugenda (2008) describe a population as a complete set of individuals, cases or
objects with some common observable characteristics. The total population comprised (60 staffs)
of all universities within Nakuru town offering MBA. .
3.5 Sampling Design and Procedures
The study was a census of all universities within Nakuru town offering MBA. This study used
purposive sampling technique to select sixty respondents from the target population. The
population was stratified into two stratum, public and private Universities and form each stratum,
six respondents was selected. This sampling technique was appropriate since these respondents
are the one responsible in making MBA programs for Universities. The survey addressed six (6)
36
individuals at each of the 10 business schools offering MBA in Nakuru town in the sample, with
a title of Deans, HODs, CODs, Coordinators and two (2) senior lecturers of School of Business
teaching MBA courses. To encourage openness, survey answers were anonymous unless
respondents choose to indicate school affiliation. The following section details how a particular
OM practices can be instrumental in achieving the framework's corresponding MBA program
objective.
3.6 Data Collection Instruments and procedures
The data collection instruments are tools to collect information from the intended target
population (sample size). The data collection instruments to be used in this study were developed
by the researcher. The study used questionnaires for data collection. This is a collection of items
to which a respondent is expected to react in writing. The designed questions or items were
distributed to the respondents. This method collects a lot of information over a short period of
time. The method is suitable when the information needed can be easily described in writing and
if time is limited. In this study, the respondents were given enough time to complete the
questionnaires before they can be used for analysis. The questionnaire included both structured
and semi-structured questions. This enabled the respondents to give their own/institutional
opinions. The questionnaires were in three parts. The first part sought to highlight demographic
data; the next part to obtain specific information in relation to factors affecting MBA
effectiveness and the third part was the questions on MBA program success. Likert scales and
semantic differentials also incorporated to gauge the attitudes of the respondents.
3.7 Validity and Reliability of rresearch iinstruments
3.7.1 Validity of Research Instruments
Validity is the degree to which results obtained from analysis of the data actually represent the
phenomenon under study (Best and Khan, 1993). It is the accuracy and meaningfulness of
inferences, based on research results; agreement between value of measurements and its true
value. Validity is quantified by comparing measurements with values that are as close to the true
values as possible. Poor validity also degrades the precision of a single measurement, and it
reduces the ability to characterize relationships between variables in descriptive studies. The
researcher will ensure the content validity of the questionnaire by involving the supervisors and
other consultants to ensure relevance, preciseness and clarity of questions.

37
In order to ascertain validity of the research instruments, the researcher will pilot the instruments
by distributing ten (10) questionnaires to other learning institutions in Kericho and Naivasha
towns, which are not part of the sample. The results of the pilot questionnaires enabled the
researcher to determine the consistency of responses to be made by respondents and adjust the
items accordingly by revising the document.
3.7.2 Reliability of the Research Instruments
Reliability is the measure of the degree to which a research yields consistent results or data after
repeated trials, degree of consistency that the research instruments or procedures demonstrate. It
is qualified by taking several measurements on the same subjects. Poor reliability degrades the
precision of a single measurement and reduces the ability to track changes in measurement in a
study (Mislevy, 2004). The reliability of data collection instruments was determined from the
pilot study as well as use of Cronbach’s alpha. The research instruments were administered to the
same respondents twice in a span of two weeks. Pearson correlation was used to test the
reliability of research instruments. The reliability statistics reveals a reliability coefficient that
exceeds 0.70 which is acceptable.
3.8 Data Analysis and Presentation
The data was analyzed using, using descriptive statistics and inferential statistics, Correlation and
chi square test for goodness of fit and agreement was used for frequency distribution. The
analysis was done using SPSS and the results presented in frequency tables and graphs and
percentages. For inferential statistics, multiple regression and correlations was used.
The regression model:
iXXXXY 443322110
Where;
Y= MBA success
0 =constant
= parameter estimates
X1 = Just-In-Time Teaching
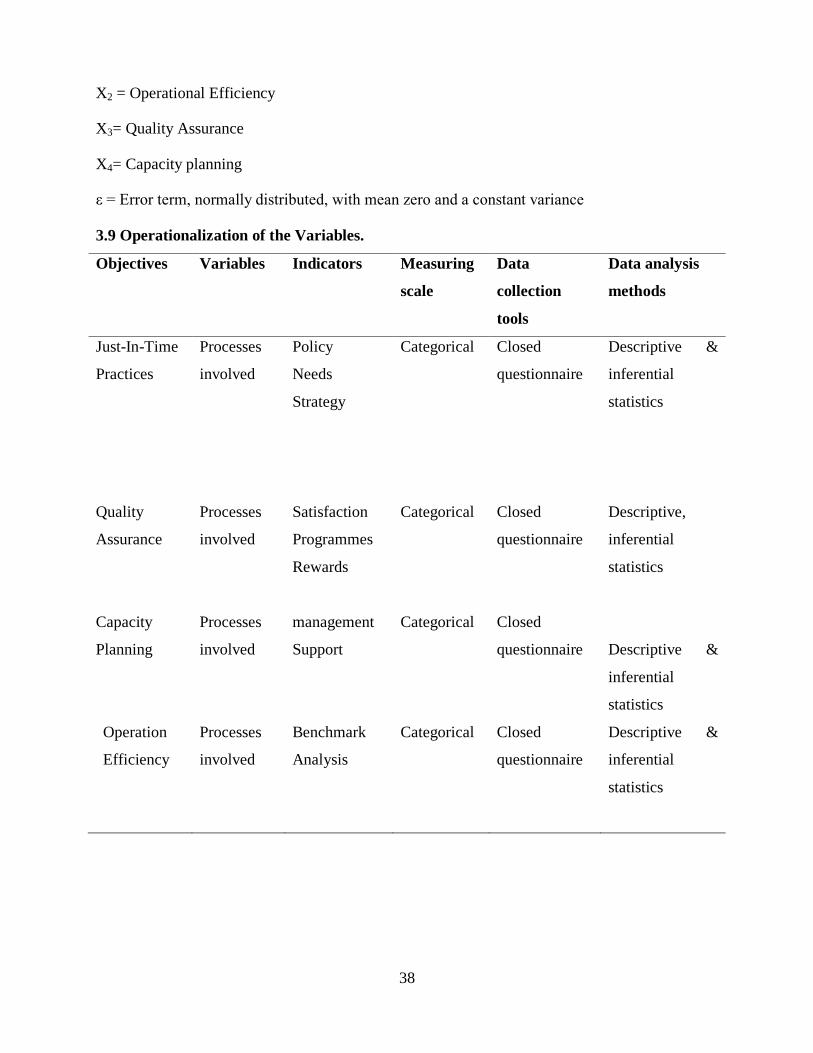
38
X2 = Operational Efficiency
X3= Quality Assurance
X4= Capacity planning
ε = Error term, normally distributed, with mean zero and a constant variance
3.9 Operationalization of the Variables.
Objectives Variables Indicators Measuring
scale
Data
collection
tools
Data analysis
methods
Just-In-Time
Practices
Processes
involved
Policy
Needs
Strategy
Categorical
Closed
questionnaire
Descriptive &
inferential
statistics
Quality
Assurance
Processes
involved
Satisfaction
Programmes
Rewards
Categorical Closed
questionnaire
Descriptive,
inferential
statistics
Capacity
Planning
Processes
involved
management
Support
Categorical Closed
questionnaire
Descriptive &
inferential
statistics
Operation
Efficiency
Processes
involved
Benchmark
Analysis
Categorical Closed
questionnaire
Descriptive &
inferential
statistics

39
CHAPTER FOUR
DATA ANALYSIS, INTERPRETATIONS AND DISCUSSIONS
4.1 Introduction
This chapter presents the results of the findings and discussions on the
4.2 Response Rate
The study used purely primary data collection. This was through the use of questionnaires,
whereby 60 questionnaires were issued. However, only 52 were returned translating to a
response rate of 87%. This population size was good enough and justified as it was in line with
Mugenda and Mugenda, (2008) assentation.
4.3 Background information
4.3.1 Gender of the respondents
This section sought to establish the respondents’ gender. The results obtained as presented by
Figure 4.1 show that 82% were male while 18% were female. This thus implies that their
responses obtained that there was male dominance among the respondents.
Source; Research data (2016)
Figure 4. 1 Gender of the respondents

40
4.3.2 Age of the respondents
This section aimed at establishing the respondents’ age. The results are as presented by Figure
4.1. This shows that most of the respondents were above 30 years, and thus gave valid and
accurate information.
Figure 4. 2: Age
Source; Research data (2016)
4.3.3 Position in organization
This section aimed at establishing the respondents’ position in their respective organizations. The
results that were obtained are as represented by Figure 4.3. This thus shows that majority of the
respondents held managerial positions and was thus well conversant of the organization’s
operations.

41
Figure 4. 3 Position in organization
Source; Researcher, 2016
4.3.4 Education level
This section sought at determining the education qualifications of the respondents. The results
obtained are as presented by Figure 4.4. This implies that most of the respondents were well
qualified of their respective positions. Thus they provided accurate information.
Figure 4. 4 Education level
Source; Research (2016)
4.4 Effects of operations management on MBA Programs.
4.4.1 Just-In-Time Teaching and Quality
The study sought to determine how Just-In-Time Teaching and Quality affects the MBA
programs’ quality. The results obtained are as per Table 4.1.

42
Table 4.1 Just-In-Time Teaching and Quality
JITT and Quality SD D N A SA Chisq P>Chisq
We maximize the or
effectiveness efficiency of
classroom sessions
16.07% 21.42% 12.5% 35.71% 14.28% 9.89 0.05
We create and sustain team
spirit among faculty;
3.57% 16.07% 26.78% 32.14% 21.42% 13.4 0.025
Students together with our
faculty/instructors work as
a team toward the same
objectives
10.71% 21.42% 17.85% 32.14% 17.85% 6.85 <0.01
We structure out-of-class
time for maximum learning
benefit.
1.78% 3.57% 37.5% 33.92% 23.21% 31.14 <0.01
We start with Warm-up
(student assignments) in
preparation for the
classroom activity.
3.57% 3.57% 19.64% 39.28% 33.92% 30.96 <0.01
We structure the out-of-
class time for maximum
learning benefit.
16.07% 21.42% 12.5% 46.42% 3.57% 29.17 <0.01
Our MBA program is
complemented by the
availability of online
services
1.78% 3.57% 14.27% 44.64% 35.714% 41.67 <0.01
(Keys: SD-Strongly Disagree, D-Disagree, N- Neutral, A-Agree, SA- Strongly agreed)
Source; Research data (2016)
The findings as presented in table 4.1 shows that (50%) of the respondents (strongly agree and
agree) significantly )05.0,89.9( 2 p that implies they maximize the effectiveness efficiency
of classroom sessions. Majority (80%) of the respondents (agreed and strongly agreed)

43
significantly )01.0,67.41( 2 p that MBA program is being complemented by the
availability of online services. 54% of the respondents (strongly agreed and agreed)
significantly )025.0,4.13( 2 p that the sustain team spirit among faculty members. Majority
(50%) of the respondents (strongly agreed and agreed) significantly )01.0,85.6( 2 p that
students work together with our faculty/instructors as a team toward the same. 73% of the
respondents (strongly agreed and agreed) significantly )01.0,96.30( 2 p that starting with
Warm-up (student assignments) in preparation for the classroom activity about. On structuring
out-of-class time for maximum learning benefit, 57% of the respondents (agreed and strongly
agreed) )01.0,14.31( 2 p . Majority (53%) of the respondents (agreed and strongly agreed)
significantly )025.0,4.13( 2 p that there was a team spirit among faculty. 60% of the
respondents (agreed and strongly agreed) significantly )05.0,85.9( 2 p that maximizing the
effectiveness/efficiency of classroom sessions.
This thus implies that the MBA program being online had the greatest impact Just-In-Time
Teaching and Quality while maximizing the classroom effectiveness/efficiency had the least.
The p-values obtained were all less than 0.5 thus showing a positive relationship between the
variable and the MBA success. This positive relationship is due to Just-in-time teaching being
very useful for effective use of class time and works as a good gauge to ascertain where students
are in their learning (Clark, 2016). This in return helps in identification of common areas of
interest or confusion, and provides opportunities to define key areas that need further attention
not just for teachers but also for students themselves. Similarly, Borrego et al, (2011) established
that it improves students' preparation for class, enhances student motivation for learning and
promotes ongoing formative assessment of student learning.
4. 4. 2 Quality assurance and student experience
The study sought to determine how quality assurance and student experience affects the MBA
programs’ quality. The results obtained are as per Table 4.2;

44
Table 4.2 Quality assurance and student experience
Statement SD D N A SA Chisq P>Chisq
We support student
learning (initiatives
helping students to work
efficiently).
5.35% 7.12% 23.21% 39.28% 25% 22.03 <0.01
We support teaching and
learning environment
(libraries, computing
facilities, virtual learning
12.5% 8.92% 16.07% 58.92% 3.57% 55.42 <0.01
We ensure Quality
assurance of teaching
staff, facilities and
resources.
14.28% 21.42% 14.28% 42.85% 7.14% 21.14 <0.01
We focus on student
satisfaction and steered
towards a market-
oriented environment
8.92% 17.85% 21.42% 33.92% 17.85% 9.17 0.005
Our keys stakeholders are
able to anonymously
report any events likely to
compromise Quality of
our programs
8.92% 17.87% 26.78% 32.14% 14.28% 9.89 0.005
There is continuous open
door policy with regards
to stakeholder
engagement thus they are
assured of quality
3.57% 17.85% 21.42% 51.78% 5.35% 42.03 <0.01
(Keys: SD-Strongly Disagree, D-Disagree, N- Neutral, A-Agree, SA- Strongly agreed)
Source; Research data (2016)

45
The findings as presented show that majority (61%) of the respondents (agreed and strongly
agreed) significantly )01.0,42.55( 2 p that on supporting student learning (initiatives
helping students to work efficiently). About 54% of the respondents (agreed and strongly agreed)
significantly )0001.0,03.42( 2 p that there being a continuous open door policy with
regards to stakeholder engagement thus they are assured of quality. 50% of the respondents
(agreed and strongly agreed) significantly )05.0,89.9( 2 p that focus on student satisfaction
and steered towards a market-oriented environment. Majority (51%) of the respondents (strongly
agreed and agreed) significantly )05.0,17.9( 2 p that focus on student satisfaction and
steered towards a market-oriented environment. About 56% of the respondents (agreed and
strongly agreed) significantly )025.0,4.13( 2 p that the keys stakeholders being able to
anonymously report any events likely to compromise Quality of our programs. About 57% of the
respondents (agreed and strongly agreed) significantly )025.0,4.13( 2 p that ensuring
Quality assurance of teaching staff, facilities and resources.
Thus meaning all the practices had moderate impacts on Quality assurance and student
experience. This is attributed to the fact that academics and university administrators need
information to help them monitor and improve their courses and programmes. The quality
assurance teams of organizations constantly work to enhance the existing quality of products and
services by optimizing the existing production processes and introducing new processes
Institutions need information about quality to help them benchmark and market their
performance. This is in line with Green, (2014) who established the same in his study. The p-
values obtained were all less than 0.5 thus showing a positive relationship between the variable
and the MBA success.
4. 4. 3 Capacity Planning influences Quality of MBA Programs
The study sought to determine how capacity planning influences quality of MBA Programs. The
results obtained are as per Table 4.3;

46
Table 4. 3 Capacity Planning influences Quality of MBA Programs
Statement SD D N A SA Chisq P>Chisq
Capacity Planning
positively influences
the Quality of our
MBA Program
0% 17.85% 21.42% 46.42% 14.28% 31.85 <0.01
We are more involved
with long-term
capacity planning for
successful MBA
program
0% 0% 44.64% 37.5% 17.85% 48.10 <0.01
We are more involved
with long-term
capacity planning for
successful MBA
program
1.78% 23.21% 0% 46.42% 28.57% 42.39 <0.01
We closely examine
the services and the
cost of services offered
to their customers
when making capacity
decisions
16.07% 17.85% 17.85% 48.21% 0% 34.17 <0.01
(Keys: SD-Strongly Disagree, D-Disagree, N- Neutral, A-Agree, SA- Strongly agreed)
Source; Research data (2016)
The findings as presented show that on being involved with long-term capacity planning for
successful MBA program about 60% of the respondents (agreed and strongly agreed)
significantly )01.0,85.31( 2 p . On capacity planning positively influences the Quality of
our MBA Program about 55% of the respondents (agreed and strongly agreed)

47
significantly )01.0,10.48( 2 p . On closely examining the services and the cost of services
offered to their customers when making capacity decisions about 48% of the respondents (agreed
and strongly agreed) significantly )01.0,17.34( 2 p . About 75% of the respondents
(strongly agreed and agreed) significantly )0001.0,39.42( 2 p that they are more involved
with long-term capacity planning for successful MBA program
Thus showing that closely examine the services and the cost of services offered to their
customers when making capacity decisions had the least impact on capacity planning influences.
The p-values obtained were all less than 0.05 thus showing a positive relationship between the
variable and the MBA success. This is because capacity planning is often proposed as a key tool
for a more rational and systematic approach to bringing about the necessary changes for greater
internationalization. However, it is essential to take the specific nature and modes of operation of
a university into consideration if capacity planning is to be accepted and embraced both as a
concept and a system in operations.
4.4.4 Operational Efficiency and Quality
The study sought to determine how operational efficiency influences quality of MBA Programs.
The results obtained are as per Table 4.4.

48
Table 4. 4 Operational efficiency and Quality
Statement SD D N A SA Chisq P>Chisq
We produce quality MBA
students readily acceptable in
the job market
16.07% 17.85% 25% 37.5% 3.57% 17.39 0.001
We develop a long-term plan 10.71% 5.35% 21.42% 57.14% 5.35% 53.10 <0.01
We improve our faculty
Retention and satisfaction
8.92% 14.28% 17.85% 58.92% 0% 58.10 <0.01
Our turn-around time is the
shortest in the market
8.92% 14.28% 21.42% 51.78% 3.57% 40.25 <0.01
We are a market leader in terms
of efficiency/effectiveness of
service
1.78% 10.71% 25% 48.21% 14.28% 35.60 <0.01
We are fully compliant with
CUE standards on curriculum
content
8.92% 14.28% 26.78% 44.64% 5.35% 28.64 <0.01
(Keys: SD-Strongly Disagree, D-Disagree, N- Neutral, A-Agree, SA- Strongly agreed)
Source; Research data (2016)
The findings as presented show that majority 48% of the respondents (strongly agreed and
agreed) significantly )01.0,5.35( 2 p that our most respondents agreed on being a market
leader in terms of efficiency/effectiveness of service. 54% of the respondents (agreed and
strongly agreed) significantly )01.0,25.40( 2 p that the turn-around time being the shortest
in the market about 49% of the respondents (agreed and strongly agreed)
significantly )01.0,64.28( 2 p that they have fully compliant with CUE standards on
curriculum content. About 40% of the respondents (strongly agreed and agreed)
significantly )01.0,39.17( 2 p that they producing quality MBA students’ readily acceptable
in the market

49
This shows that none of the practices had a great extent of impact on the operational efficiency
and quality. The p-values obtained were all less than 0.5 thus showing a positive relationship
between the variable and the MBA success. This concurs with Vangie, (2014) argue that the
reduced internal costs that result from operational efficiency enable a company to achieve higher
profit margins or be successful in highly competitive markets. Overall, this will create a more
financially sustainable institution, one operating at peak efficiency.
4.5 Quality MBA program
This section sought to establish the quality of MBA programs being offered in the universities.
The results obtained are as shown by Table 4.5.
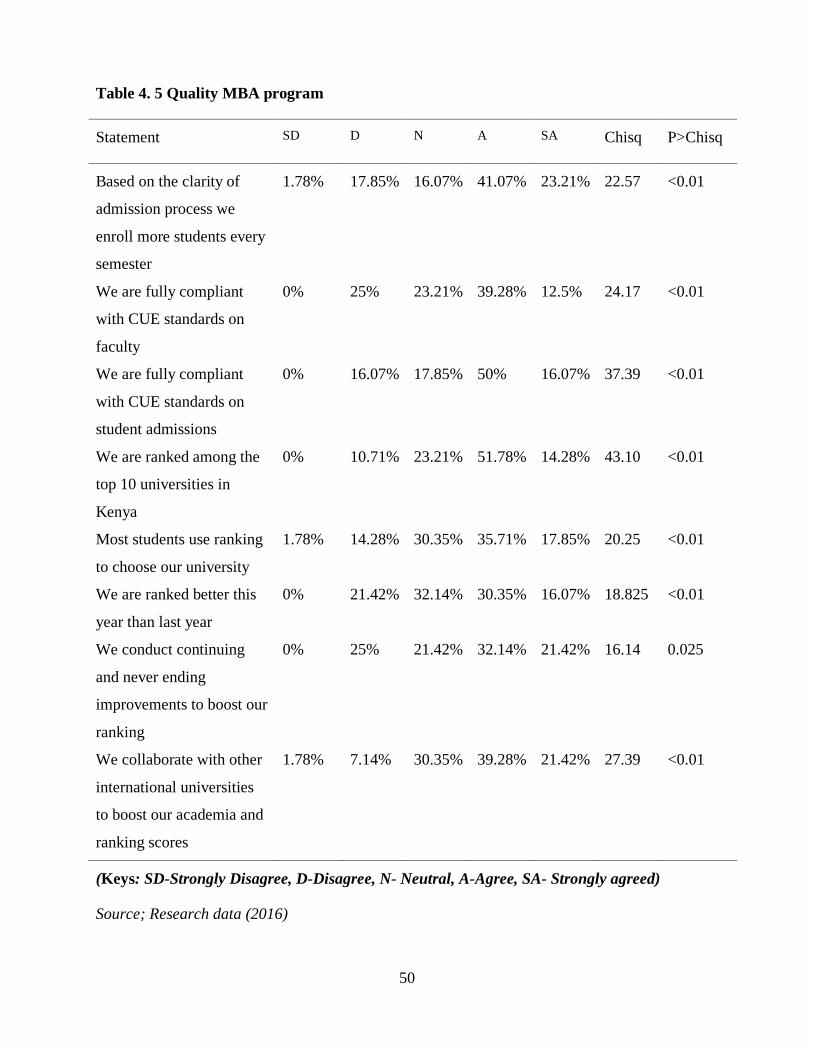
50
Table 4. 5 Quality MBA program
Statement SD D N A SA Chisq P>Chisq
Based on the clarity of
admission process we
enroll more students every
semester
1.78% 17.85% 16.07% 41.07% 23.21% 22.57 <0.01
We are fully compliant
with CUE standards on
faculty
0% 25% 23.21% 39.28% 12.5% 24.17 <0.01
We are fully compliant
with CUE standards on
student admissions
0% 16.07% 17.85% 50% 16.07% 37.39 <0.01
We are ranked among the
top 10 universities in
Kenya
0% 10.71% 23.21% 51.78% 14.28% 43.10 <0.01
Most students use ranking
to choose our university
1.78% 14.28% 30.35% 35.71% 17.85% 20.25 <0.01
We are ranked better this
year than last year
0% 21.42% 32.14% 30.35% 16.07% 18.825 <0.01
We conduct continuing
and never ending
improvements to boost our
ranking
0% 25% 21.42% 32.14% 21.42% 16.14 0.025
We collaborate with other
international universities
to boost our academia and
ranking scores
1.78% 7.14% 30.35% 39.28% 21.42% 27.39 <0.01
(Keys: SD-Strongly Disagree, D-Disagree, N- Neutral, A-Agree, SA- Strongly agreed)
Source; Research data (2016)
51
The findings as presented show that (35%) of the respondents (strongly agreed and agreed)
significantly )01.0,85.18( 2 p that they have ranked better this year than last year. About
49% of the respondents (strongly agreed and agreed) significantly )01.0,39.27( 2 p that
they are collaborating with other international universities to boost the academia and ranking
scores. About 64% of the respondents (strongly agreed and agreed) significantly
)01.0,5.22( 2 p that basing the clarity of admission process we enroll more students every
semester about. Majority (66%) of the respondents (strongly agreed and agreed)
significantly )01.0,4.37( 2 p that they are fully complying with CUE standards on student
admissions. 60% of the respondents (strongly agreed and agreed) )025.0,14.16( 2 p that
they conduct continuing and never ending improvements to boost our ranking. About 66% of the
respondents (strongly agreed and agreed) significantly )01.0,1.43( 2 p that they are ranked
among the top 10 universities in Kenya. About 54% of the respondents (strongly agreed and
agreed) significantly )01.0,25.20( 2 p that most students using ranking to choose our
university.
This thus implies that though most universities were ranked well than last year, they are yet to be
fully compliant with CUE standards on faculty as it had the lowest mean. This is in line with
Datar, et al (2014) who established that despite the enhanced importance of the MBAs', the
desired quality is yet to be attained. This may be largely due to most of the MBA programs in
Kenya have not embraced the best practices that can enable learners acquire techniques for
basing their decisions and action on careful analyzed pertinent data, rendering them without any
leadership philosophy. In addition, massification; overcrowding; ever-growing demand; erosion
of technical colleges due to acquisitions and takeovers by public universities in search of space;
crumbling infrastructure; poor governance; rigid management structures pose major challenges
to the provision of quality MBAs. This indicates the need to improve the MBA quality if the
desired effect were to be attained.
4.5.1 Research output
This section aimed at establishing the research output in the universities as measure of their
reliability. The results obtained are as shown by table 4.6.

52
Table 4. 6 Research output
Statement SD D N A SA Chisq P>Chisq
Our In-house journals attract
outside researchers
16.07% 25% 7.14% 39.28% 12.5% 17.75 0.01
Our academia and teaching
staff are world renowned
14.28% 16.07% 8.92% 46.42% 14.28% 25.25 0.01
Our MBAs are peer reviewed
by international peers
1.785% 14.28% 28.57% 41.07% 14.28% 25.60 <0.01
Our Faculty are involved in
peer reviewing international
scholars and scholarly works
1.78% 7.14% 33.92% 41.07% 16.07% 32.21 <0.01
(Keys: SD-Strongly Disagree, D-Disagree, N- Neutral, A-Agree, SA- Strongly agreed)
Source; Researcher (2016)
The findings as presented show that; 55% % of the respondents (agreed and strongly agreed)
significantly )01.0,6.25( 2 p that the MBAs being peer reviewed by international peers
while about 57% of the respondents (strongly agreed and agreed) significantly
)01.0,21.32( 2 p the faculty being involved in peer reviewing international scholars and
scholarly works. 50% (strongly agreed and agreed) significantly )01.0,25.25( 2 p and the
in-house journals attracting outside researchers with about 51% (agreed and strongly
agreed) )01.0,75.17( 2 p that the academia and teaching staff being world renowned.
The research forms a crucial part in any MBA project. However, it still proves to be a milestone
in most students. The universities therefore ought to put in place more measures so as to improve
its knowledge ability among students. Hence shows moderate impact of all the variables on the
research output. The p-values obtained were all less than 0.5 thus showing a positive relationship
between the variable and the MBA success.
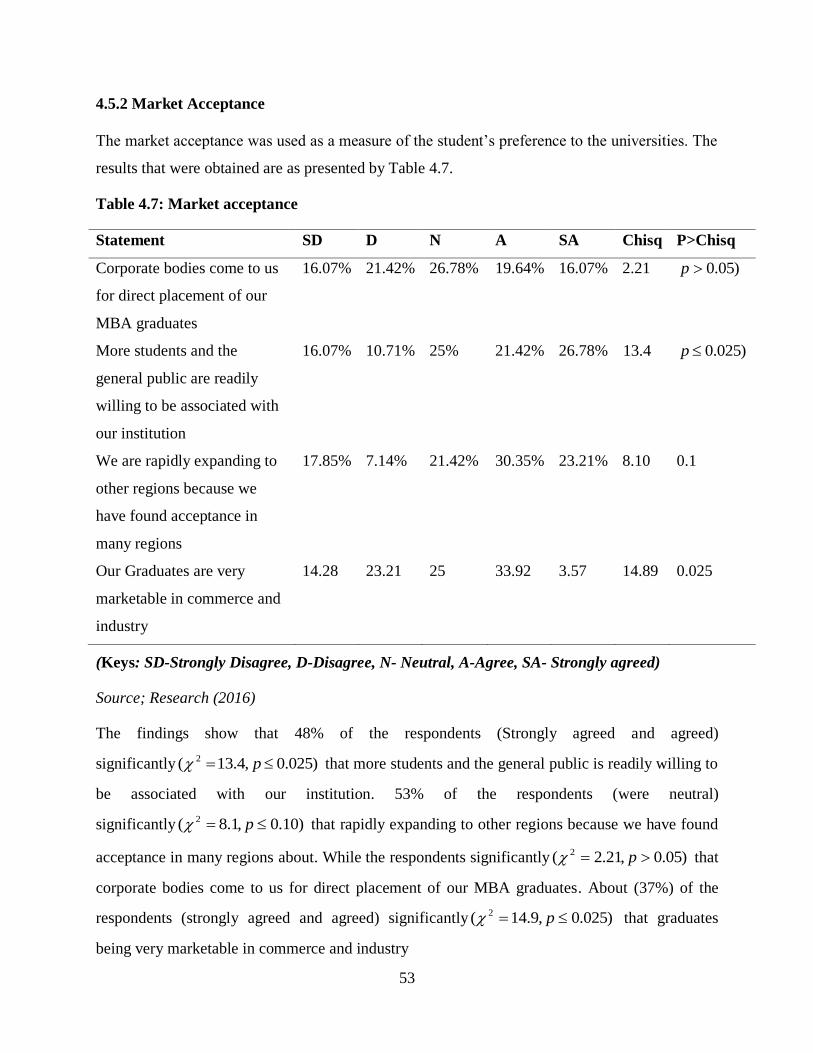
53
4.5.2 Market Acceptance
The market acceptance was used as a measure of the student’s preference to the universities. The
results that were obtained are as presented by Table 4.7.
Table 4.7: Market acceptance
Statement SD D N A SA Chisq P>Chisq
Corporate bodies come to us
for direct placement of our
MBA graduates
16.07% 21.42% 26.78% 19.64% 16.07% 2.21 )05.0p
More students and the
general public are readily
willing to be associated with
our institution
16.07% 10.71% 25% 21.42% 26.78% 4.13 )025.0p
We are rapidly expanding to
other regions because we
have found acceptance in
many regions
17.85% 7.14% 21.42% 30.35% 23.21% 8.10 0.1
Our Graduates are very
marketable in commerce and
industry
14.28 23.21 25 33.92 3.57 14.89 0.025
(Keys: SD-Strongly Disagree, D-Disagree, N- Neutral, A-Agree, SA- Strongly agreed)
Source; Research (2016)
The findings show that 48% of the respondents (Strongly agreed and agreed)
significantly )025.0,4.13( 2 p that more students and the general public is readily willing to
be associated with our institution. 53% of the respondents (were neutral)
significantly )10.0,1.8( 2 p that rapidly expanding to other regions because we have found
acceptance in many regions about. While the respondents significantly )05.0,21.2( 2 p that
corporate bodies come to us for direct placement of our MBA graduates. About (37%) of the
respondents (strongly agreed and agreed) significantly )025.0,9.14( 2 p that graduates
being very marketable in commerce and industry

54
Hence shows that the graduates being marketable had the least impact on market acceptance.
Without the market acceptance, the MBAs the value of MBA attained get diminished. This thus
necessitates those universities to put various approaches so as to ensure acceptance not only
locally but also internationally.
4.6 Reliability Test
Reliability test was conducted using Cronbach Alpha, the results obtained are as shown in Table
4.8. Just-In-Time teaching had a Cronbach alpha of 0.788, operation efficiency had 0.773, and
quality assurance had 0.715, while capacity planning had 0.755. This shows that all the variables
passed the reliability test and could be able to explain the relationship that existed between the
variables.
Table 4. 8 Reliability Test
Variable Cronbach Alpha Decision
Just-In-Time teaching 0.788 Accepted
Operation efficiency 0.773 Accepted
Quality Assurance 0.715 Accepted
Capacity planning 0.755 Accepted
Source: Research datas (2016)
4.7. Correlation Analysis
Correlation analysis was used to determine the nature of the relationship between study variables
and hence achieve the specific objectives. Correlation was used to establish the the relationship
that exists between operations management practices and quality MBA programs. Correlation
analysis results are presented in Table 4.8.
Just-In-Time Teaching had a Pearson Correlation 0.758 and p-value of 0.001. The positive
correlation indicated Just-In-Time Teaching had positive effect on MBA Quality. The coefficient
of correlation is greater than 0.5 indicating that the relationship was strong. The p-value obtained
on 0.001 indicated that the positive relationship between Just-In-Time Teaching and Quality

55
MBA programs was significant at 95% confidence level since it was less than 0.05. Therefore,
Just-In-Time Teaching practices were key in ensuring that universities had Quality MBA
programs.
Operational Efficiency had a Pearson Correlation of 0.333 and a p-value of 0.031. This indicated
that the operational efficiency had positive relationship with Quality MBA programs though the
relationship was not very strong since it was less than 0.5. The p-value of 0.031 implied that the
relationship between operational efficiency and Quality MBA programs was significant at 95%
confidence level.
Quality Assurance had a Pearson Correlation of 0.465 and p-value of 0.002. The coefficient of
correlation of 0.465 which is positive indicated that Quality Assurance positively affects Quality
MBA programs at the universities. Hence, observing maintaining quality assurance at
universities will greatly improve the MBA quality. The p-value of 0.002 indicates that Quality
Assurance significantly affected Quality MBA programs at 95% confidence level.
Capacity planning had a Pearson Correlation of 0.750 and a p-value of 0. This indicated that the
capacity planning had positive relationship with Quality MBA programs. The relationship
established was very strong since it was greater than 0.5. The p-value of 0 implied that the
relationship between capacity planning and Quality MBA programs was significant at 95%
confidence level. This thus shows that all the independent variables had a positive relation with
the MBA quality. This relates to Wambui, et al (2016) who established the same in their study on
factors affecting the quality of university education in public universities in Kenya.

56
Table 4. 9 Correlation Analysis
Just-In-
Time
Teaching
Operational
Efficiency
Quality
Assurance
Capacity
Planning
Just-In-Time
Teaching
Pearson
Correlation .758** 1
Sig. (2-tailed) 0.001
Operational
Efficiency
Pearson
Correlation .333* .693** 1
Sig. (2-tailed) 0.031 0.000
Quality
Assurance
Pearson
Correlation .465** .718** .642** 1
Sig. (2-tailed) 0.002 0 0
Capacity
planning
Pearson
Correlation .750** 0.156 .635**
.370*
1
Sig. (2-tailed) 0 0.323 0 0.016
N 52 52 52 52
**. Correlation is significant at the 0.01 level (2-tailed).
Source: Research data (2016)
4.8 Regression Analysis
Multiple regression analysis was used to establish the relationship that exists between operations
management practices and quality MBA programs. The multiple linear regression model was
used as it allows simultaneous investigation of the effect of two or more independent variables
on a dependent variable.
The following are the results of the fitted model.
Table 4. 10 Model Summary
R R Square
Adjusted
R Square Std. Error of the Estimate
.763a 0.755 0.741 0.03999
Predictors: (Constant), Just-In-Time Teaching, Operational Efficiency, Quality Assurance
and Capacity planning (Source: Research Data, 2016)

57
The adjusted R square value is 0.741 implying that about 74.1% of the variation seen in MBA’s
quality is explained by the variables in the regression model. This further means that only 25.9%
of the variation seen in MBA’s quality is unexplained by other variables which are not in the
model.
Table 4. 11 Model Analysis of Variance
Sum of Squares d.f Mean Square F Sig.
Regression 1.608 4 0.402 322.00 .000a
Residual 0.058 48 0.001
Total 1.666 52
a. Predictors: (Constant), Just-In-Time Teaching, Operational Efficiency, Quality Assurance
and Capacity planning
b. Dependent Variable: MBA success
Source: Research Data, (2016)
From Table 4.9 above, results indicate that overall, the model is highly significant. This is
because the p-value obtained of 0.000 is less than both 0.01 and 0.05. Thus implying that at 5%
level of significance, at least one of the variables included in the model is useful in predicting the
MBA’s quality.
The model coefficients obtained by the study are shown in table 4.10. As shown in the model,
Just-In-Time teaching has Pearson coefficients of 0.0100 and a p-value of 0.0050. This thus
implies it had a significant positive impact at 5% level on MBA quality since p-value is less than
0.05. Operational efficiency has Pearson coefficients of 0.0130 and a p-value of 0.0260. This
thus implies it had a significant positive impact at 5% level on MBA quality since p-value is less
than 0.05. Quality assurance has Pearson coefficients of 0.4320 and a p-value of 0.1310. This
thus implies it had a no significant positive impact at 5% level on MBA quality since p-value is
more than 0.05. Capacity planning has Pearson coefficients of 0.9920 and a p-value of 0.000.

58
This thus implies it had a significant positive impact at 5% level on MBA quality since p-value is
less than 0.05.
This thus shows that all the models except quality assurance are significant at 5% level since
their p-values are less than 0.05. These finding compares with that of Bloom, et al, (2016) who
established the same in their study. The predictive model thus developed by the study is Y = -
0.5230 + 0.0100 Just-In-Time Teaching + 0.0130 Operational Efficiency + 0.4320 Quality
Assurance + 0.9920 Capacity planning.
Table 4. 12: Model Coefficients
Standard
Coefficients
Multicollinearity
Unstructured
coefficients B
Std.
Error Beta t Sig. Tolerance VIF
(Constant) -0.5230 0.2940
-1.7810 0.0830
Just-In-Time
Teaching 0.0100 0.0030 0.1100 2.9910 0.0050 0.618 1.409
Operational
Efficiency 0.0130 0.0060 0.1330 2.3250 0.0260 0.545 1.618
Quality assurance 0.4320 0.2800 0.1210 1.5450 0.1310 0.506 1.834
Capacity planning 0.9920 0.0890 1.0290 11.1210 0.000 0.71 1.976
a. Dependent Variable: MBA success
Source: Research Data, (2016)
4.9 Hypothesis Testing
Hypothesis is a specific statement of prediction. It describes in concrete terms what researcher
expects will happen in the study. Based on the results and formulation of the hypotheses the
decision to accept or reject the null hypothesis is made. The results of hypothesis testing show

59
that all the four hypothesized relationships were significant. This meant that the all the variables
significantly contributed to quality MBA programs. The hypothesized relationship on Just-In-
Time Teaching, Operational Efficiency and Capacity planning were statistically significant at 5%
α-level. Summary of the hypothesis testing results are shown in Table 4.12
Table 4. 13 Summary of Hypotheses Testing
Hypothesis
Std.
Error t P-Value Conclusion
H01: Just in Time practices has no
significant impact on the improvement of
the quality of MBA programs. 0.003 2.991 0.005 Reject H01
H02: Operation efficiency has no significant
effect on the quality of MBA programs. 0.006 2.325 0.026 Reject H02
H03: Quality assurance has no significant
effect on the quality of MBA programs. 0.28 1.545 0.131 Reject H03
H04: Capacity planning has no significant
effect on the emergence of high quality
MBA program. 0.089 11.121 0 Reject H04
Source: Research Data, (2016)
Ho1: Just in Time practices has no significant impact on the improvement of the quality of
MBA programs.
According to the results, the p-value .005 is less than 0.05 (p<0.05). The hypothesis was
therefore rejected and concluded that Just in Time practices have significant effect on the quality
of MBA programs. Additionally, the ANOVA test was done to establish the overall significance
of the regression model which confirmed a significance of .003 which is less than 0.05(P<0.05).
The null hypothesis was therefore rejected and concluded that Just in Time practices have
significant effect on the quality of MBA.

60
H02: Operation efficiency has no significant effect on the quality of MBA programs
According to the results, the p-value .026 is less than 0.05 (p<0.05). The hypothesis was
therefore rejected and concluded that operation efficiency have significant effect on the quality
of MBA programs. Additionally, the ANOVA test was done to establish the overall significance
of the regression model which confirmed a significance of .006 which is less than 0.05(P<0.05).
The null hypothesis was therefore rejected and concluded that operation efficiency have
significant effect on the quality of MBA.
H03: Quality assurance has no significant effect on the quality of MBA programs.
According to the results, the p-value 0.131 is more than 0.01 (p<0.05). The hypothesis was
therefore accepted and concluded that quality assurance has no significant effect on the quality of
MBA programs. Additionally, the ANOVA test was done to establish the overall significance of
the regression model which obtained a significance of 0.28 which is more than 0.05(P<0.05).
This indicates that the model was not significant in establishing the relationship that exists. The
null hypothesis was therefore accepted and concluded that quality assurance practices have no
significant effect on the quality of MBA.
H04: Capacity planning has no significant effect on the emergence of high quality MBA
program.
According to the results, the p-value .00 is less than 0.01 (p<0.05). The hypothesis was therefore
rejected and concluded that capacity planning practices have significant effect on the quality of
MBA programs. Additionally, the ANOVA test was done to establish the overall significance of
the regression model which confirmed a significance of 0.089 which is more than 0.05(P<0.05).
This indicates that the model was not significant in establishing the relationship that exists.The
null hypothesis was therefore rejected and concluded that capacity planning practices have
significant effect on the quality of MBA.

61
CHAPTER FIVE
SUMMARY, CONCLUSION AND RECOMMENDATIONS
5.1 Introduction
This chapter contains summary of the study, conclusion and recommendation for policy and
areas for further research. Data analysis and summary and conclusions were made in line to the
study objective which was to determine the the relationship that exists between operations
management practices and quality MBA programs in universities.
5.2 Summary of the Findings
The study sought to determine effect of the relationship that exists between operations
management practices and quality MBA programs. The data was gathered using the
questionnaire as the research instrument of which a response rate of 87% was obtained. The
study was a census of all universities within Nakuru town offering MBA. This study used
purposive sampling technique to select sixty respondents from the target population. Descriptive
and correlation and regression analysis was used present the result in tables and figures.
The study also aimed at establishing the various practices put in place by the universities. The
findings obtained showed that Just-In-Time Teaching, Operational Efficiency, Quality Assurance
and Capacity planning. Particularly, MBA program being online had the greatest impact Just-In-
Time Teaching and Quality while maximizing the classroom effectiveness/efficiency had the
least. On the quality assurance and research output, all the practices had moderate impacts.
While on quality planning, closely examine the services and the cost of services offered to their
customers when making capacity decisions had the least impact while none of the practices had a
great extent of impact on the operational efficiency and quality. Whereas graduates being
marketable had the least impact on market acceptance. In addition, the findings implied that
though most universities were ranked better than last year, they are yet to be fully compliant with
CUE standards on faculty as it had the lowest mean. Hence showing moderate impact of all the
variables on the research output. Hence showing that the practices put is a huge pre-determining
factor on how the success of MBA projects.

62
The regression analysis was further used to establish the direction of relationship that existed
between the dependent and independent variables. The R square value was 0.755 implying that
about 75.5% of the variation seen in MBA’s quality is explained by the variables in the study.
This further means that only 24.5% of the variation seen in MBA’s quality is explained by other
variables which are not in the model. The relationship was significant as the p value obtained
was less than 0.5. Additionally, the model co efficients obtained revealed that all the variables
had significant positive relationship with MBAs success and quaility. Whereby; Just-In-Time
teaching has 0.0100, operational efficiency 0.0130, quality assurance 0.4320 and capacity
planning 0.9920. The constant on the other hand is the predicted value when all the other
predictors are set to zero (B= -0.5230) The positive coefficient shows that all the variables have
a positive effect on the MBA’s success. This implies that an increase in these variables would
result in increased MBA’s quality. All the models except quality assuarance are significant at
95% since their p-values are less than 0.05. The predictive model thus developed by the study is
Y = -0.5230 + 0.0100 Just-In-Time Teaching +0.0130 Operational Efficiency + 0.4320 Quality
Assurance + 0.9920 Capacity planning.
5.3 Conclusion of the study
The study concludes that Just-In-Time Teaching, Operational Efficiency, Quality Assurance and
Capacity planning are the main practices put in place in ensuring the MBA quality. This is
mainly because these practices are aimed to overcome the challenges facing the universities,
mainly massification; overcrowding; ever-growing demand; erosion of technical colleges due to
acquisitions and takeovers by public universities in search of space; insufficient/declining public
funding; curricula that are not responsive to modern-day needs of the labor market; declining
quality; crumbling infrastructure; poor governance; rigid management structures which affect
quality education in Kenyan universities. On the relationship that exists between operations
management practices and quality MBA programs, the study concludes that a significant
positive relationship exists. This is because all the variables were established to have positive co
efficients. Hence so as to improve the quality of MBA projects the universities ought to put in
place proper operational strategies.
5.4 Recommendations
From the findings, several recommendations are made. The study established that the MBA
quality may be determined greatly by the type operational practices employed. The study thus

63
recommends that the implementation process of these operation strategies should be given top
priority during the strategy formulation process. Particularly, adequate time and resources
should be allocated in ensuring that the practices are implemented succefully. Additionally, the
organizations should focus more on the practices that are likely to accrue more benefits. This will
go a long way in not only boosting but also improving the MBA quality at large.
5.5 Suggestions for Further Research
Despite the research questions being well answered, several areas remain unclear and require
further research. The study only focused the operation strategies, without giving much
consideration how they were implemented. The study thus suggests further research should be
done on the implementation process of the operation strategies, also investigating the various
challenges that may occur. The study was only limited to universities in Nakuru County. So as to
enable generalization of the findings, the study suggests that further study to be conducted on
universities in other parts of the country. Additionally, a study could be conducted on other
organizations other than the universities so as to establish whether the similar phenomena
prevails in these organizations
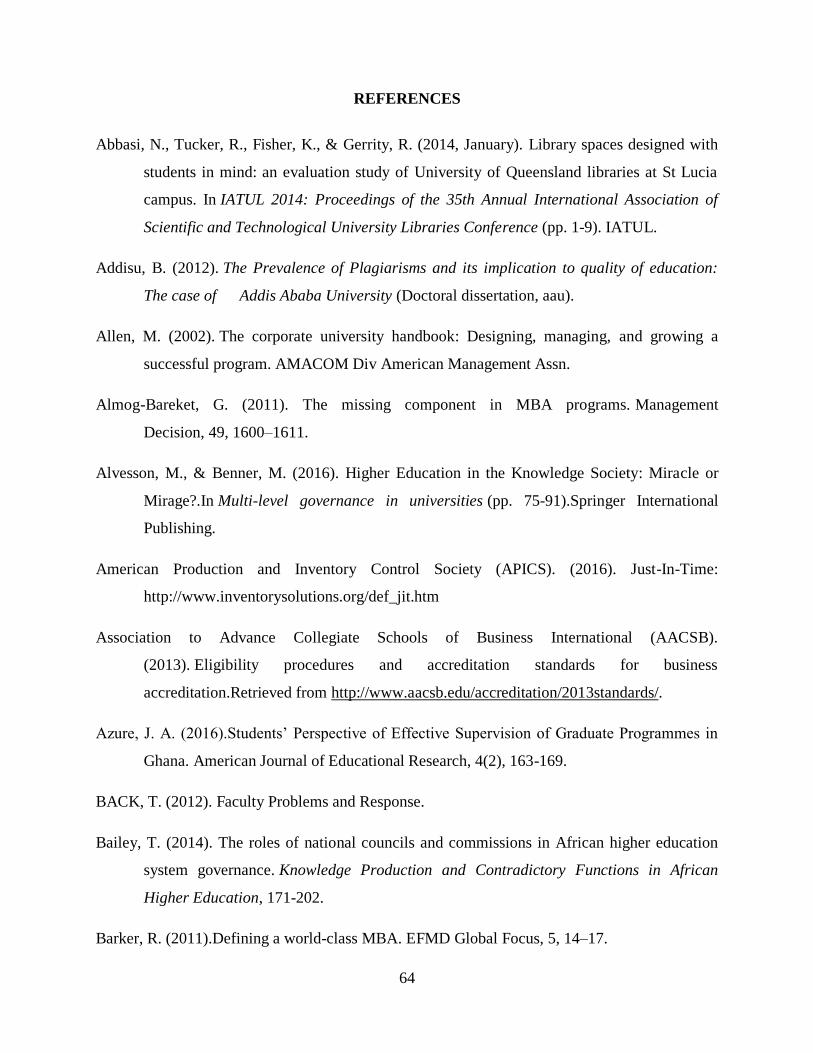
64
REFERENCES
Abbasi, N., Tucker, R., Fisher, K., & Gerrity, R. (2014, January). Library spaces designed with
students in mind: an evaluation study of University of Queensland libraries at St Lucia
campus. In IATUL 2014: Proceedings of the 35th Annual International Association of
Scientific and Technological University Libraries Conference (pp. 1-9). IATUL.
Addisu, B. (2012). The Prevalence of Plagiarisms and its implication to quality of education:
The case of Addis Ababa University (Doctoral dissertation, aau).
Allen, M. (2002). The corporate university handbook: Designing, managing, and growing a
successful program. AMACOM Div American Management Assn.
Almog-Bareket, G. (2011). The missing component in MBA programs. Management
Decision, 49, 1600–1611.
Alvesson, M., & Benner, M. (2016). Higher Education in the Knowledge Society: Miracle or
Mirage?.In Multi-level governance in universities (pp. 75-91).Springer International
Publishing.
American Production and Inventory Control Society (APICS). (2016). Just-In-Time:
http://www.inventorysolutions.org/def_jit.htm
Association to Advance Collegiate Schools of Business International (AACSB).
(2013). Eligibility procedures and accreditation standards for business
accreditation.Retrieved from http://www.aacsb.edu/accreditation/2013standards/.
Azure, J. A. (2016).Students’ Perspective of Effective Supervision of Graduate Programmes in
Ghana. American Journal of Educational Research, 4(2), 163-169.
BACK, T. (2012). Faculty Problems and Response.
Bailey, T. (2014). The roles of national councils and commissions in African higher education
system governance. Knowledge Production and Contradictory Functions in African
Higher Education, 171-202.
Barker, R. (2011).Defining a world-class MBA. EFMD Global Focus, 5, 14–17.

65
Banker, R. D., Byzalov, D., & Plehn-Dujowich, J. M. (2013). Demand uncertainty and cost
behavior. The Accounting Review, 89(3), 839-865.
Baruch, Y., & Holtom, B. (2008).Survey response rate levels and trends in organizational
research. Human Relations, 61, 1139–1160.
Basu, S. D. (2016). Executive MBA degree may catapult your career.
Battistoni, E., Bonacelli, A., Colladon, A. F., & Schiraldi, M. M. (2013). An analysis of the
effect of operations management practices on performance. International Journal of
Engineering Business Management, 5, 44.
Bedford, D. (2013). A case study in knowledge management education–historical challenges and
future opportunities. Electronic Journal of Knowledge Management, 11(3), 199-213.
Bloom, D. E., Canning, D., Chan, K. J., & Luca, D. L. (2014). Higher education and economic
growth in Africa. International Journal of African Higher Education, 1(1), 22-57.
Bonnie, R. J., Stroud, C., Breiner, H., & Council, N. R. (2015). Education and Employment.
Borg, S. (2015). Teacher cognition and language education: Research and practice. Bloomsbury
Publishing.
Boyle, D. M., Hermanson, D. R., &Mensah, M. O. (2011). Addressing the accounting and
auditing faculty shortage: Practitioners' perceptions of academia. Current Issues in
Auditing, 5(1), A70-A85.
Brame, C. J. (2013). Flipping the classroom. Retrieved, August, 29, 2013.
Brenton, S. (2015). Effective online teaching and learning.In H. Fry, S. Ketteridge& S. Marshall
(Eds.), A handbook for teaching & learning in higher education: Enhancing academic
practice (pp. 139–151). New York, NY: Routledge.
Borrego, M., Cutler, S., Froyd, J., Prince, M., & Henderson, C. (2011). Faculty use of research
based instructional strategies. In Australasian Association for Engineering Education
Conference 2011: Developing engineers for social justice: Community involvement,
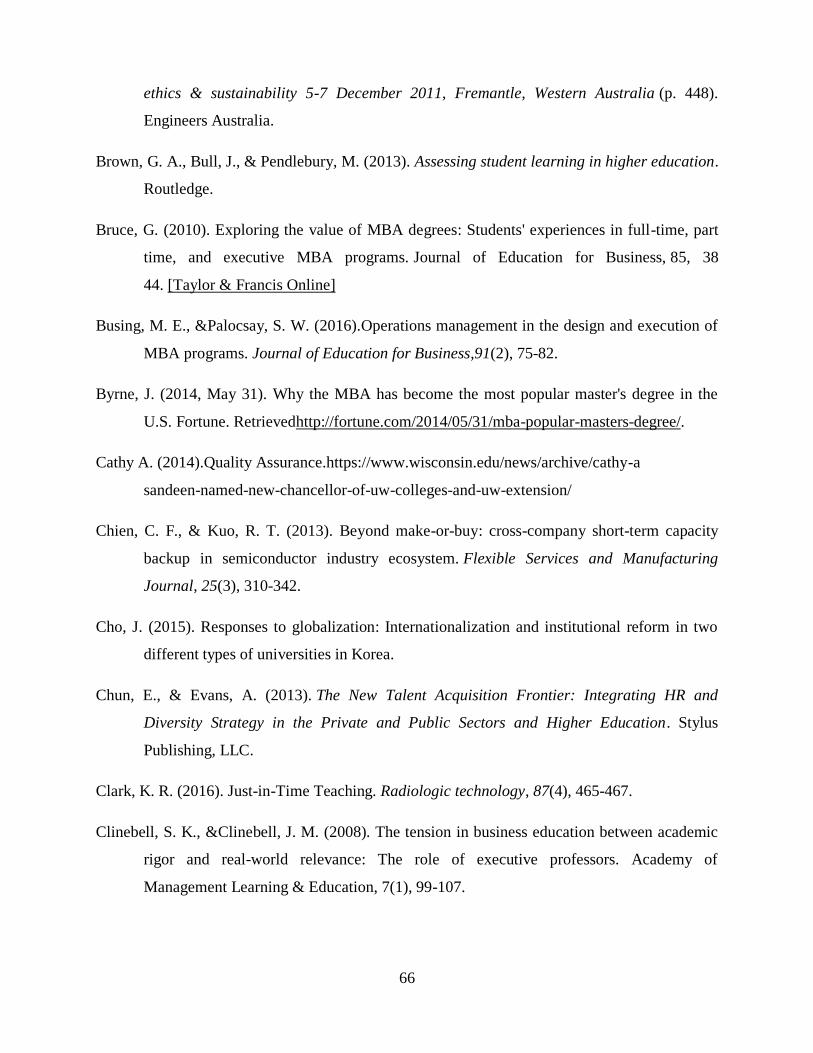
66
ethics & sustainability 5-7 December 2011, Fremantle, Western Australia (p. 448).
Engineers Australia.
Brown, G. A., Bull, J., & Pendlebury, M. (2013). Assessing student learning in higher education.
Routledge.
Bruce, G. (2010). Exploring the value of MBA degrees: Students' experiences in full-time, part
time, and executive MBA programs. Journal of Education for Business, 85, 38
44. [Taylor & Francis Online]
Busing, M. E., &Palocsay, S. W. (2016).Operations management in the design and execution of
MBA programs. Journal of Education for Business,91(2), 75-82.
Byrne, J. (2014, May 31). Why the MBA has become the most popular master's degree in the
U.S. Fortune. Retrievedhttp://fortune.com/2014/05/31/mba-popular-masters-degree/.
Cathy A. (2014).Quality Assurance.https://www.wisconsin.edu/news/archive/cathy-a
sandeen-named-new-chancellor-of-uw-colleges-and-uw-extension/
Chien, C. F., & Kuo, R. T. (2013). Beyond make-or-buy: cross-company short-term capacity
backup in semiconductor industry ecosystem. Flexible Services and Manufacturing
Journal, 25(3), 310-342.
Cho, J. (2015). Responses to globalization: Internationalization and institutional reform in two
different types of universities in Korea.
Chun, E., & Evans, A. (2013). The New Talent Acquisition Frontier: Integrating HR and
Diversity Strategy in the Private and Public Sectors and Higher Education. Stylus
Publishing, LLC.
Clark, K. R. (2016). Just-in-Time Teaching. Radiologic technology, 87(4), 465-467.
Clinebell, S. K., &Clinebell, J. M. (2008). The tension in business education between academic
rigor and real-world relevance: The role of executive professors. Academy of
Management Learning & Education, 7(1), 99-107.

67
Coetzee, J. (2011). The postmodern MBA: Curriculum design principles. EFMD Global
Focus, 5, 56–59.
Cooke, J., & Barnard, S. (2013). Five reasons why new product developments fail.Retrieved
fromhttp://www.scbuk.com/5reasons.pdf.
Currie, G., & Knights, D. (2003).Reflecting on a critical pedagogy in MBA
education. Management Learning, 34, 27–49.
Dale, B. G., Bamford, J., Bamford, D., & Wiele, A. (2016). Chapter Fourteen Managing
Quality: The Future. Managing Quality: An Essential Guide and Resource Gateway, 311.
Darley, W., & Luethge, D. (2015).The Role of Faculty Research in the Development of a
Management Research and Knowledge Culture in African Educational Institutions.
Academy of Management Learning & Education, amle-2013.
Datar, S. M., Garvin, D. A., & Cullen, P. G. (2014). Rethinking the MBA: Business education at
a crossroads. Journal of Management Development, 30(5), 451-462.
De los Reyes, G., Kim, T. W., & Weaver, G. (2016). Teaching ethics in business schools: A
conversation on disciplinary differences, academic provincialism, and the case for
integrated pedagogy. Academy of Management Learning & Education, amle-2014.
Deming's Theory of Management: http://maaw.info/DemingMain.htm European Union,
Regulation (EC) No 223/2009 of the European Parli
Díaz-Méndez, M., & Gummesson, E. (2012). Value co-creation and university teaching quality:
Consequences for the European Higher Education Area (EHEA). Journal of Service
Management, 23(4), 571-592. ament and of the Council of 11 March 2009 on European
statistics (Official Journal of the European Union No L 87, 31.3.2009, p.164 - 173)
Duker, P., Gawboy, A., Hughes, B., & Shaffer, K. P. (2015). Hacking the Music Theory
Classroom: Standards-Based Grading, Just-in-Time Teaching, and the Inverted
Class. Music Theory Online, 21(1).

68
Deming, W. E., & Edwards, D. W. (1982). Quality, productivity, and competitive position (Vol.
183). Cambridge, MA: Massachusetts Institute of Technology, Center for advanced
engineering study.
Finch, B. J. (2008). Operations now: Supply chain profitability and performance (3rd ed.). New
York: McGraw-Hill.
Flanigan, S., & Morse, R. (2015, March 9). Methodology: 2016 best business schools
rankings. U.S. News & World Report.http://www.usnews.com/education/best-graduate
-schools/articles/business-schools methodology.
Fleischmann, B., Meyr, H., & Wagner, M. (2015). Advanced planning. In Supply chain
management and advanced planning (pp. 71-95). Springer Berlin Heidelberg.
Friga, P. N., Bettis, R. A., & Sullivan, R. S. (2003).Changes in graduate management education
and new business school strategies for the 21st century. Academy of Management
Learning & Education, 2(3), 233-249.
Georgiadis, P., & Athanasiou, E. (2013). Flexible long-term capacity planning in closed-loop
supply chains with remanufacturing. European Journal of Operational Research, 225(1),
44-58.
Githinji, F. W. (2014). Mentoring and Academic Advising Needs of Institutional Based Students
in Kenyatta University (Doctoral dissertation).
Gray, G. (1993). Quality circles: An update. SAM Advanced Management Journal, 58(2), 41–47.
Green, D. (2014). What is quality in higher education?.
Gunasekaran, A., Korukonda, A. R., Virtanen, I., & Yli-Olli, P. (1994). Improving productivity
and quality in manufacturing organizations. International journal of production
economics, 36(2), 169-183.
Hamish, C. (2005) The Value of Student Engagement for Higher Education Quality
assurance, Quality in Higher Education, 11:1, 25-36, DOI:

69
Haskins, M. (2005).A planning framework for crafting the required-curriculum phase of an
MBA program. Journal of Management Education, 29, 82–110.
Heese, H., & Swaminathan, J. (2006).Product line design with component commonality and
cost-reduction effort.Manufacturing& Service Operations Management, 8, 206–219.
Heijunka & Kanban. (2014).A Conceptual Model for Production Leveling :
https://hal.archives-ouvertes.fr/hal-01055905/document
Heizer, J., Render, B., & Munson, C. (2016). Principles of operations management:sustainability
and supply chain management. Pearson Higher Ed.
Henning, J. M. (2015). The perceived impact of an MBA degree on the salary and career
progression of a graduate of the University of Stellenbosch Business School (Doctoral
dissertation, Stellenbosch: Stellenbosch University).
Hillmer, S., & Kocabasoglu, C. (2008). Using qualitative data to learn about customer needs:
Understanding employer desires when designing an MBA program. Quality Management
Journal, 15(2), 51–63.
Hopkins, D. (2014). A teacher's guide to classroom research. McGraw-Hill Education (UK).
Ishikawa's Theory: http://www.cwiep.org.uk/trim/files/ISHIWAKA-THEORY.pdf
https://www.kenyaplex.com/courses/13-master-of-business-administration-mba.aspx
Jöns, H., & Hoyler, M. (2013). Global geographies of higher education: The perspective of world
university rankings. Geoforum, 46, 45-59.
Jacobs, F., & Chase, R. (2014). Operations and supply chain management (14th ed.). New York,
NY: McGraw-Hill.
Kearney, M. L., & Lincoln, D. (2013). Research universities: networking the knowledge
economy. Studies in Higher Education, 38(3), 313-315.
Kerzner, H. R. (2013). Project management: a systems approach to planning, scheduling, and
controlling. John Wiley & Sons.

70
Kilonzo, S. M., & Magak, K. (2013). Publish or Perish: Challenges and Prospects of Social
Science Research and Publishing in Institutions of Higher Learning in
Kenya. International Journal of Sociology, 43(1), 27-42.
Kimani, S. W. (2015). Exploring Quality of Learning and Teaching Experiences in Higher
Education using the Theory of Constraints: Kenya and New Zealand.
Kimathi, K. J., & Henry, E. E. (2014). An Evaluation of Quality of University Education in
Kenyan Massification Era. Mediterranean Journal of Social Sciences, 5(5), 345.
Kivunja, C. (2016). How to Write An Effective Research Project For Higher Degree Research
in Higher Education: Lessons From Practice. International Journal of Higher
Education, 5(2), p163.
Kleiman, L., & Kass, D. (2007). Giving MBA programs the third degree. Journal of
Management Education, 31, 81–103.
Kleindorfer, P. (1994). TQM at the University of Pennsylvania. Managing Quality, 4(4), 20–23.
Kleindorfer, P., & Saad, G. (2005). Managing disruption risks in supply chains. Production and
Operations Management, 14, 53–68.
Krajewski, Lee J.; Ritzman, Larry P. (2005). Operations Management: Processes and Value
Chains. Upper Saddle River, New Jersey: Prentice Hall.
Kremer, M., Brannen, C., & Glennerster, R. (2013). The challenge of education and learning in
the developing world. Science, 340(6130), 297-300.
Kumar, S., Himes, K., & Kritzer, C. (2014).Risk assessment and operational approaches to
managing risk in global supply chains. Journal of Manufacturing Technology
Management, 25 (6), 873–890.
Lacy, M. (Ed.). (2014). The Slow Book Revolution: Creating a New Culture of Reading on
College Campuses and Beyond: Creating a New Culture of Reading on College
Campuses and Beyond. ABC-CLIO.
Larsson, K., & Hansson, H. (2013). Anti-plagiarism strategies: How to manage it with quality in
large-scale thesis productions. International Journal for Educational Integrity, 9(2).
71
Liu, X. (2015). Teaching data envelopment analysis in production operations management
through an undergraduate research project based on real-world data. International
Journal of Information and Operations Management Education, 6(1), 14-23.
Li, W., & Xin, G. (2012, July). Research and practice of program design teaching mode based on
JiTT concept. In Computer Science & Education (ICCSE), 2012 7th International
Conference on (pp. 1897-1899). IEEE.
Magutu, P. (2010). Business Process Reengineering for Competitive Advantage: Key Factors
that may lead to the success or failure of the BPR implementation.
Magutu, P. (2015). Managing operations.
Magutu, P. O. (2011). A survey of benchmarking practices in higher education in Kenya: the
case of public universities. IBIMA Business Review.
Magutu, P., & Onserio, N. (2009).Quality Management in Higher Education in Kenya.
Mariampillai, J. K. (2014). Collaborative provision within UK higher education: perceptions of
stakeholders of UK and Sri Lankan colleges offering university degrees in business and
management (Doctoral dissertation, The University of West London).
Marshall, N. (2012). The use of sessional teachers in universities: Faculty of the built
environment, University of New South Wales Australia. Journal of International
Education Research, 8, 197–206.
Mason, F. (1997). Mapping a better process. Manufacturing Engineering, 118(4), 58–68.
Mbirithi, D. M. (2013). Management Challenges Facing Kenya's Public Universities and
Implications For the Quality Of Education (Doctoral dissertation).
McGraw, G. M. (2015). Multimodality in the Higher Learning Classroom. Human Anatomy &
Physiology Society, 20(1).
McLaughlin, C. P., McLaughlin, C., & Kaluzny, A. D. (2004). Continuous quality improvement
in health care: theory, implementation, and applications. Jones & Bartlett Learning.

72
Mintzberg, H. (2004). Managers, not MBAs: A hard look at the soft practice of managing and
management development. Berrett-Koehler Publishers.
Molinero, C., & Portillo, F. (2010).Analysing the success of MBA programmes. Journal of
Strategic Management Education, 6, 119–133.
Monk, J. J., Foote, K. E., & Schlemper, M. B. (2012). Graduate education in US geography:
Students’ career aspirations and faculty perspectives. Annals of the Association of
American Geographers, 102(6), 1432-1449.
Mumanyi, E. A. L. (2014). Challenges and opportunities facing SACCOs in the current devolved
system of government of Kenya: A case study of Mombasa County. International
Journal of Social Sciences and Entrepreneurship, 1(9), 288-314.
Muriuki, J. W. (2015). International procurement and operational efficiency in major logistics
multi-national firms in Mombasa, Kenya (Doctoral dissertation, University of Nairobi).
Mwangi, S. W., & Owino, S. O. (2012). Beyond Quantity: Higher Education in
Kenya. Universités, universitaires en Afrique de l'Est, 223.
Navarro, P. (2008). The MBA core curricula of top-ranked U.S. business schools: A study in
failure? Academy of Management Learning & Education, 7, 108–123.
Nawelwa, J., Sichinsambwe, C., & Mwanza, B. G. (2015). An analysis of total quality
management (TQM) practices in Zambian secondary schools: A survey of Lusaka
district. The TQM Journal, 27(6), 716-731.
Nettles, T. A. (2015). The Experience of Master-Level Graduate Students with Prior Professional
Experience Enrolled in Student Affairs Graduate Programs.
Ng, P., & Jee, K. (2014).Concurrent knowledge sharing and its importance in product
development. Journal of Applied Sciences, 14, 2978–2985.
73
Ng’ang’a, S. I., Kabethi, J. M., PM, K., & Leonard, O. (2015). Technological Innovation: Higher
Education, Small Manufacturing Enterprises Growth and the Five (i) Technological
Development Model In Kenya. IJITR, 3(4), 2301-2315.
Nyamwange, O. S., Magutu, P. O., Nyaoga, R. B., Mbeche, I. M., &Ombati, T. O. Quality
Management Practices In Kenyan Educational Institutions: University Of Nairobi.
Nyangau, I. N. (2016). Evaluating how industry collaboration affects growth of business
incubators in Nairobi County (Doctoral dissertation, Strathmore University).
Nyaoga, R. B., Chepkuto, K. S., Kipchumba, S. K., &Magutu, P. O. (2010).Knowledge
management as source of sustainable competitive advantage.
Nyasani, J. A. (2015). The impact of International Standards Organization 9001: 2008 standards
certification on the performance of public universities in Kenya (Doctoral dissertation,
University of Nairobi).
Oakland, J. S. (2014). Total quality management and operational excellence: text with cases.
Routledge.
Oanda, I. O. (2013). University Expansion and the Challenges to Social Development in Kenya:
Dilemmas and Pitfalls.
Odhiambo, G. (2014). The challenges and future of public higher education leadership in Kenya.
Journal of Higher Education Policy and Management, 36(2), 183-195.
Odhiambo, G. (2016). Higher education in Kenya: an assessment of current responses to the
imperative of widening access. Journal of Higher Education Policy and
Management, 38(2), 196-211.
Odhiambo, J. (2006). Advancing the Quality of Higher Education through Internationalization.
Page, R., & Nodoushani, O. (2006). MBA academic strategy: A competing values
approach. Competition Forum, 4, 522–527.
Pereira-Moliner, J., Pereira-Moliner, J., Pertusa-Ortega, E. M., Pertusa-Ortega, E. M., Tarí, J. J.,
& Molina-Azorín, J. F. (2016). Organizational design, quality management and

74
competitive advantage in hotels. International Journal of Contemporary Hospitality
Management, 28(4), 762-784.
Peters, M. J., Howard, K., & Sharp, M. J. A. (2012). The management of a student research
project. Gower Publishing, Ltd..
Peterson Obara Magutu (2016) http://www.standardmedia.co.ke/article/2000090412/universities
churning-out-half-baked-MBAS.
Prince, M., Burns, D., & Maonolis, C. (2014). The effects of part-time MBA programs on
students: The relationships between students and their employers. Journal of Education
for Business, 89, 300–309.
Radnor, Z., & Osborne, S. (2016). Operationalising lean in services: Rediscovering service
blueprinting. In Z. Radnor, N. Bateman, A. Esain, M. Kumar, S. Williams, & D. Upton
(Eds.), Public service operations management: A research handbook (pp. 294–309). New
York, NY: Routledge.
Reuben, N. Z. (2014). Convergence of Distance Education and Conventional Learning:
Innovations and Developments at the Open University of Tanzania. In Special Issue:
Edited Proceedings of the Third DEATA (Distance Education Association of Tanzania)
Conference Held at Moshi University College of Cooperative and Business Studies
(MUCCOBS), Kilimanjaro, Tanzania on 22 nd to 23 rd August 2013 (p. 11).
Richards-Wilson, S. (2002). Changing the way MBA programs do business—Lead or
languish. Journal of Education for Business, 77, 296–300.
Rodkin, J. (2014, November 10). Best business schools 2014: how they were ranked. Bloomberg
Businessweek.Retrieved from http://www.bloomberg.com/bw/articles/2014-11-10/best
business-schools-2014-methodology-for-ranking-schools.
Rubin, R., & Dierdorff, E. (2013). Building a better MBA: From a decade of critique toward a
decennium of creation.Academy of Management Learning & Education, 12, 125–141.
Rydzewski, D., Eastman, J., & Bocchi, J. (2010). Important characteristics in an MBA program:
The perceptions of online MBA students. Journal of Business Education, 3, 33–41.

75
Safieddine, F. (2015). Student's Guide: Final Year Project Thesis: BSc, MSc, MA, and MBA.
CreativeSpace.
Sahay, M., & Kumar, K. (2014). Strategy Formation for Higher Education Institutions Using
System Dynamics Modeling. International Journal of Intelligent Technologies and
Applied Statistics, 7(3), 207-227.
Saint, W. (2015). Tertiary education and economic growth in sub-Saharan Africa: The World
Bank report. International Higher Education, (54).
Sallis, E. (2014). Total quality management in education. Routledge.
Schlegelmilch, B., & Thomas, H. (2011). The MBA in 2020: Will there still be one? Journal of
Management Development, 30, 474–482.
Schönsleben, P. (2016). Integral logistics management: Operations and supply chain
management within and across companies. CRC Press.
Scott & Bellows http://www.businessdailyafrica.com/Why-Kenya-ranks-low-on-quality-of
academic-research/-/539444/2821354/-/9gtika/-/index.html
Scott Bellows New Economy Venture Accelerator (NEVA) USIU’s Chandaria School of
Business, available at http://www.ScottProfessor.com accessed 30th
July 2015
Sila, H. M., & Gichinga, L. (2016). Role of Strategic Leadership on Strategy Implementation in
Public Universities in Kenya-A Case Study of JKUAT Main Campus. International
Journal of Innovative Research and Development, 5(6).
Stevenson, W. (2015). Operations management (12th ed.). New York, NY: McGraw-Hill.
Sultan, P., & Wong, H. (2012). Service quality in a higher education context: An integrated
model. Asia Pacific Journal of Marketing and Logistics, 24, 755–784.
Talam, P. (2014). Integration and use of institutional repositories in public universities: the case
of the university of Nairobi (Doctoral dissertation, University of Nairobi).

76
Talib, F., Rahman, Z., & Qureshi, M. N. (2013). An empirical investigation of relationship
between total quality management practices and quality performance in Indian service
companies. International Journal of Quality & Reliability Management, 30(3), 280-318.
Taylor, N. G., Jaeger, P. T., McDermott, A. J., Kodama, C. M., & Bertot, J. C. (2012). Public
libraries in the new economy: Twenty-first-century skills, the internet, and community
needs. Public Library Quarterly, 31(3), 191-219.
Thomas, H., & Corneul, E. (2011). Business school futures: Evaluation and perspectives. Journal
of Management Development, 30, 444–450.
Thomas, H., Thomas, L., & Wilson, A. (2013). The unfulfilled promise of management
education (ME): The role, value and purposes of ME. Journal of Management
Development, 32, 460–476.
Total Quality Management (TQM) http://asq.org/learn-about-quality/total-quality-
management/overview/overview.html
Tries chmann, J. S., Dennis, A. R., Northcraft, G. B., & Nieme, A. W. (2000).Serving
constituencies in business schools: MBA program versus research performance. Academy
of Management Journal, 43(6), 1130-1141.
Tucker, T. (2013). Just In Time Teaching: What it is, how it looks, why it works…. Teaching
and Learning Innovations, 15.
Vangie B., (2016).Quin Street Enterprise: Operations Efficiency http://www.webopedia.com
TERM/O/operational_efficiency.html.
Wairimu, N. A. (2014). Capacity management strategies and service quality in petroleum
distribution firms in Kenya.
Wambui, T. W., Ngari, J. M., & Waititu, A. (2016). Teaching Experience of part Time
Lecturers Affect the Quality of University Education in Public Universities in
Kenya. European Journal of Research and Reflection in Educational Sciences Vol, 4(6).
Weinstein, G. C. (2013). Bombay Central: A Journey Into Indian Higher Education (Doctoral
dissertation, Ohio University).

77
Wisker, G. (2012). The good supervisor: Supervising postgraduate and undergraduate research
for doctoral theses and dissertations. Palgrave Macmillan.
Zikmund, W. G., Babin, B. J., Carr, J. C., & Griffin, M. (2013). Business research methods.
Cengage Learning.

78
APPENDIX I: LETTER OF INTRODUCTION
KABARAK UNIVERSITY,
PRIVATE BAG – 20157,
NAKURU, KENYA.
October 2016.
Dear Respondent,
RE: REQUEST TO CARRY OUT A RESEARCH STUDY.
I am a Master of Business Administration student at Kabarak University doing a research on the
effects of Operations Management Practices on the Quality of MBA Programs of Kenyan
Universities, survey based in Nakuru town. As an empirical investigation constitutes a major
portion of the study, your assistance will go a long way in making this study a success. Your
identity, information provided was treated with utmost confidentiality and will not be used for
any other purposes other than this academic paper. Your participation and cooperation was
highly appreciated.
Thank you in advance.
Yours faithfully,
Bosco J Verbs
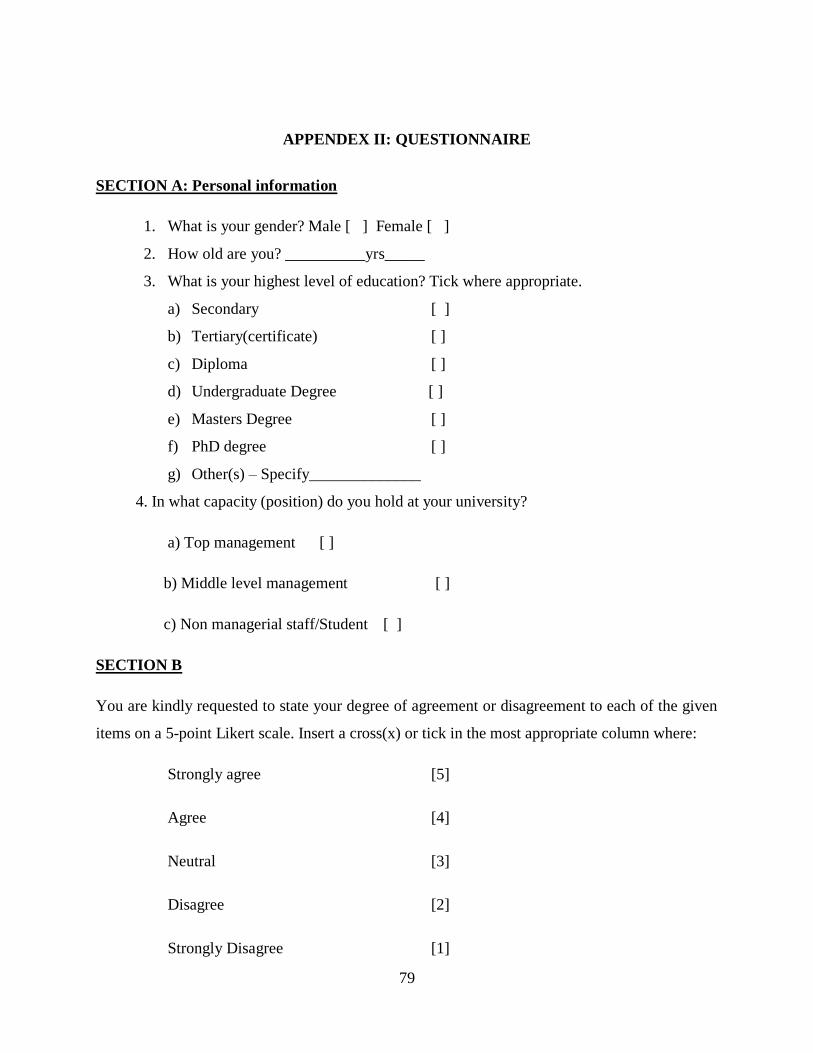
79
APPENDEX II: QUESTIONNAIRE
SECTION A: Personal information
1. What is your gender? Male [ ] Female [ ]
2. How old are you? __________yrs_____
3. What is your highest level of education? Tick where appropriate.
a) Secondary [ ]
b) Tertiary(certificate) [ ]
c) Diploma [ ]
d) Undergraduate Degree [ ]
e) Masters Degree [ ]
f) PhD degree [ ]
g) Other(s) – Specify______________
4. In what capacity (position) do you hold at your university?
a) Top management [ ]
b) Middle level management [ ]
c) Non managerial staff/Student [ ]
SECTION B
You are kindly requested to state your degree of agreement or disagreement to each of the given
items on a 5-point Likert scale. Insert a cross(x) or tick in the most appropriate column where:
Strongly agree [5]
Agree [4]
Neutral [3]
Disagree [2]
Strongly Disagree [1]

80
Part 1: EFFETS OF OPERATIONS MANAGEMENT ON MBA PROGRAMS.
To what extent do you agree about the following statements?
Just-In-Time Teaching Strongly
disagree
Disagree Neutral Agree Strongly
agree
We maximize the
effectiveness/efficiency of
classroom sessions
□1 □2 □3 □4 □5
We create and sustain team
spirit among faculty;
□1 □2 □3 □4 □5
Students together with our
faculty/instructors work as a
team toward the same
objectives
□1 □2 □3 □4 □5
We start with Warm-up
(student assignments) in
preparation for the classroom
activity.
□1 □2 □3 □4 □5
We structure the out-of-class
time for maximum learning
benefit.
□1 □2 □3 □4 □5
Our MBA program is
complemented by the
availability of online services
□1 □2 □3 □4 □5
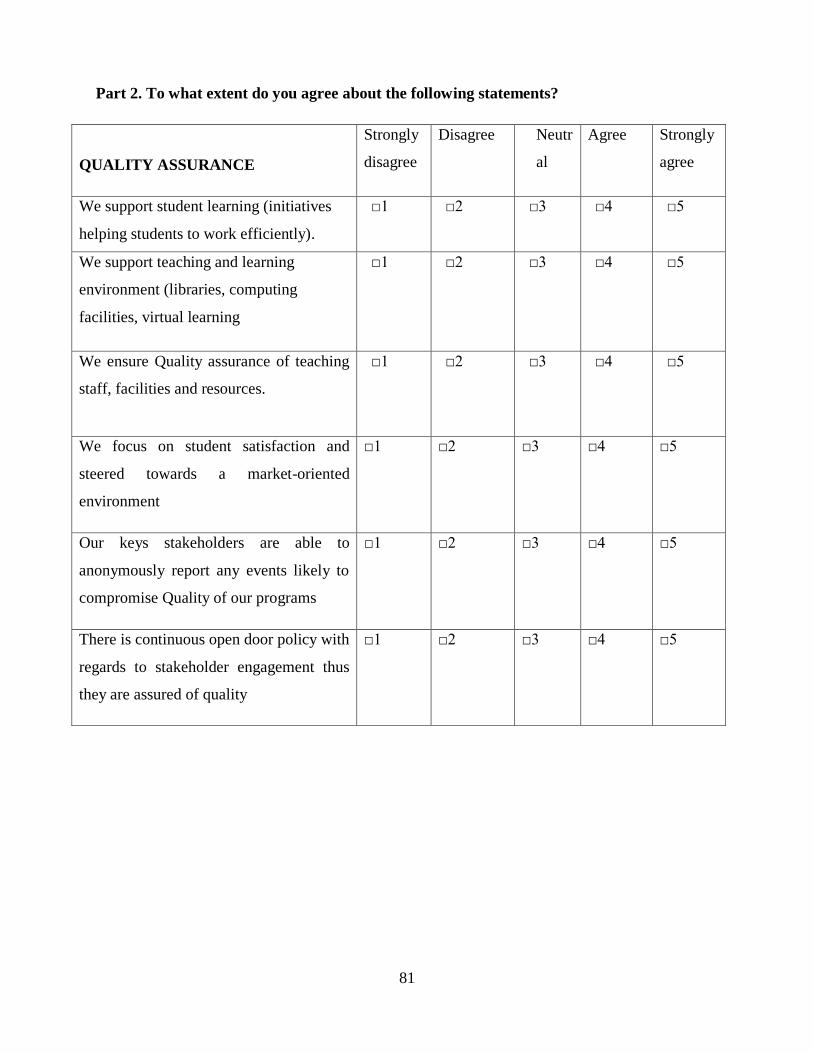
81
Part 2. To what extent do you agree about the following statements?
QUALITY ASSURANCE
Strongly
disagree
Disagree Neutr
al
Agree Strongly
agree
We support student learning (initiatives
helping students to work efficiently).
□1 □2 □3 □4 □5
We support teaching and learning
environment (libraries, computing
facilities, virtual learning
□1 □2 □3 □4 □5
We ensure Quality assurance of teaching
staff, facilities and resources.
□1
□2
□3
□4
□5
We focus on student satisfaction and
steered towards a market-oriented
environment
□1 □2 □3 □4 □5
Our keys stakeholders are able to
anonymously report any events likely to
compromise Quality of our programs
□1 □2 □3 □4 □5
There is continuous open door policy with
regards to stakeholder engagement thus
they are assured of quality
□1 □2 □3 □4 □5
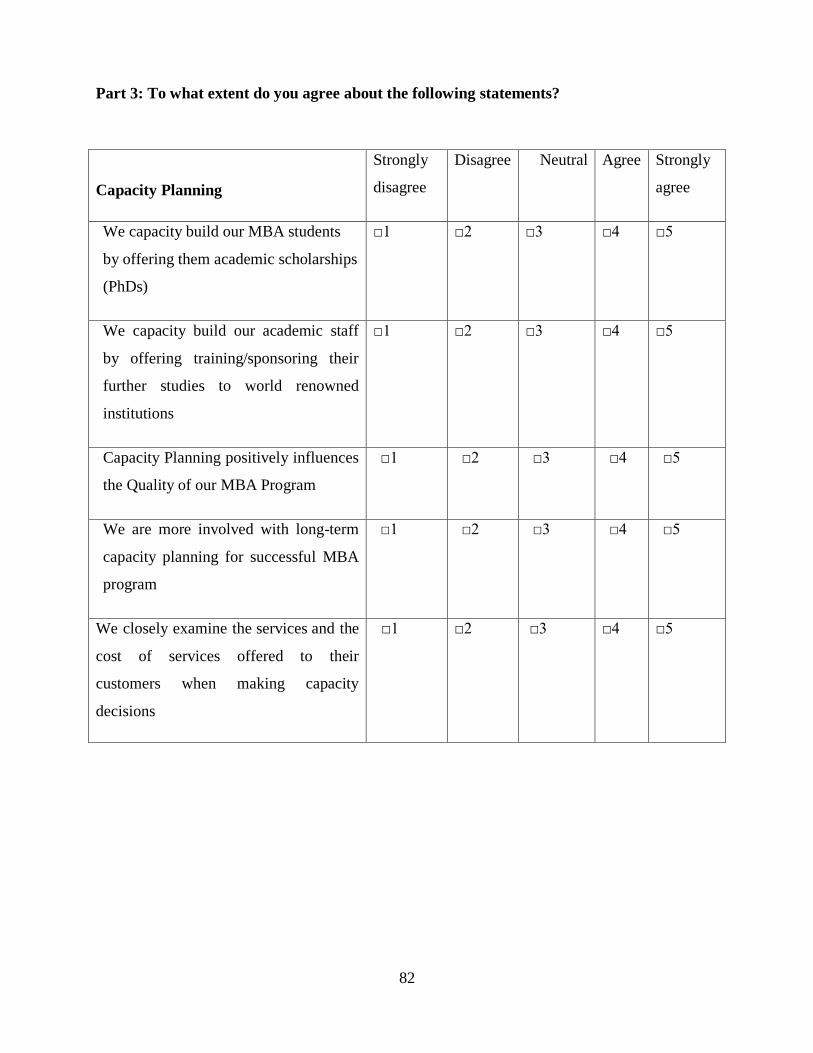
82
Part 3: To what extent do you agree about the following statements?
Capacity Planning
Strongly
disagree
Disagree Neutral Agree Strongly
agree
We capacity build our MBA students
by offering them academic scholarships
(PhDs)
□1 □2 □3 □4 □5
We capacity build our academic staff
by offering training/sponsoring their
further studies to world renowned
institutions
□1 □2 □3 □4 □5
Capacity Planning positively influences
the Quality of our MBA Program
□1 □2 □3 □4 □5
We are more involved with long-term
capacity planning for successful MBA
program
□1
□2 □3 □4 □5
We closely examine the services and the
cost of services offered to their
customers when making capacity
decisions
□1
□2
□3
□4
□5

83
Part4. To what extent do you agree about the following statements?
Operational Efficiency
Strongly
disagree
Disagree Neutral Agree Strongly
agree
We offer professional
course to complement our
MBA program
We are competitive in this
Highly dynamic market
□1 □2 □3 □4 □5
We produce quality MBA
students readily acceptable
in the job market
□1 □2 □3 □4 □5
We develop a long-term plan
We improve our faculty
Retention and satisfaction
Our turn-around time is the
shortest in the market
We are a market leader in
terms of
efficiency/effectiveness of
service
□4 □5
We are fully compliant with
CUE standards on
curriculum content
□1 □2 □3 □4 □5

84
Part5: QUALITY MBA PROGRAM
To what extent do you agree about the following statement?
Increased Enrollments Strongly
disagree
Disagree Neutral Agree Strongly
agree
We have both online and class room
MBA programs
We have enrolled more students
because of our quality programs
Based on the clarity of admission
process we enroll more students
every semester
We are fully compliant with CUE
standards on faculty
We are fully compliant with CUE
standards on student admissions
To what extent do you agree about the following statement?
Ranking Strongly
disagree
Disagree Neutral Agree Strongly
agree
We are ranked among the top 10
universities in Kenya
□1
□2
□3
□4
□5
Most students use ranking to choose
our university
□1
□2
□3
□4
□5

85
We are ranked better this year than
last year
□1
□2
□3
□4
□5
We conduct continuing and never
ending improvements to boost our
ranking
□1 □2 □3 □4 □5
We collaborate with other
international universities to boost
our academia and ranking scores
□1 □2 □3 □4 □5
To what extent do you agree about the following statement?
Research output Strongly
disagree
Disagree Neutral Agree Strongly
agree
Our institution publishes research
papers in international journals
□1
□2
□3
□4
□5
Our In-house journals attract outside
researchers
□1
□2
□3
□4
□5
Our academia and teaching staff are
world renowned
□1
□2
□3
□4
□5
Our MBAs are peer reviewed by
international peers
□1 □2 □3 □4 □5

86
Our Faculty are involved in peer
reviewing international scholars and
scholarly works
□1 □2 □3 □4 □5
To what extent do you agree about the following statement?
Market acceptance Strongly
disagree
Disagree Neutral Agree Strongly
agree
We satisfy the needs of our key
stakeholders
□1
□2
□3
□4
□5
Based on the quality of our MBA we
are competitive as compared to other
institutions
□1
□2
□3
□4
□5
Corporate bodies come to us for direct
placement of our MBA graduates
□1
□2
□3
□4
□5
More students and the general public
are readily willing to be associated
with our institution
□1 □2 □3 □4 □5
We are rapidly expanding to other
regions because we have found
acceptance in many regions
□1 □2 □3 □4 □5
Our Graduates are very marketable in
commerce and industry
□1 □2 □3 □4 □5

87
APPENDIX III: UNIVERSITIES OFFERING MBA IN NAKURU TOWN
Source: KenyaPlex, (2016)
Institution Name Campuses Category
1. Egerton University Nakuru Public
2. Jomo Kenyatta University of Agriculture and Technology Nakuru Public
3. Kabarak University Nakuru Private
4. Kenya Methodist University Nakuru Private
5. Kenyatta University Nakuru Public
6. Laikipia University Nakuru Public
7. Mount Kenya University Nakuru Private
8. PCEA University Nakuru Private
9. St. Paul's University Nakuru Private
10. University of Nairobi Nakuru Public