effects of obliquity and water vapor/trace gas … of obliquity and water vapor/trace gas...
TRANSCRIPT

Effects of obliquity and water vapor/trace gas greenhousesin the early martian climate
Michael A. Mischna,1 Victor Baker,2 Ralph Milliken,3 Mark Richardson,4 andChristopher Lee4
Received 11 July 2012; revised 15 November 2012; accepted 18 January 2013; published 31 March 2013.
[1] We explore possible mechanisms for the generation of warm, wet climates on earlyMars as a result of greenhouse warming by both water vapor and periodic volcanic traceemissions. The presence of both water vapor (a strong greenhouse gas) and other tracegreenhouse gases (such as SO2) in a predominantly CO2 atmosphere may act, under certainconditions, to elevate surface temperatures above the freezing point of liquid water, at leastepisodically. Variations in obliquity are explored to investigate whether these periodicvariations in insolation at Mars can broaden the regions or seasons where warmtemperatures can exist. We use the Mars Weather Research and Forecasting generalcirculation model to perform several simulations of the conditions of the early martianatmosphere containing these gases and find global temperatures to be cooler than the elevatedlevels suggested by at least one recent study by Johnson et al. (2008). While achievingtemperatures above 273K globally remains challenging, the additional warming bygreenhouse gases under certain obliquity states can permit for widespread seasonally warmconditions, which can help to explain the presence of fluvial surface features (e.g., valleynetworks) and hydrous minerals of post-Noachian age, a period when alternate methods donot convincingly explain the sustainability of liquid water. Furthermore, we find that globalwarming can be achieved with the presence of a darker surface globally, which is consistentwith both widespread exposure of unweathered basaltic bedrock or the presence of a largesurface ocean or sea.
Citation: Mischna, M. A., V. Baker, R. Milliken, M. Richardson, and C. Lee (2013), Effects of obliquity and watervapor/trace gas greenhouses in the early martian climate, J. Geophys. Res. Planets, 118, 560–576, doi:10.1002/jgre.20054.
1. Introduction
[2] There is widespread support for the argument thatduring the earliest period of martian history, the Noachian(>3.7Ga), the planet was substantially warmer and wetterthan at present day [e.g., Pollack et al., 1987; Craddockand Howard, 2002; Hoke and Hynek, 2009]. The mecha-nism by which the climate of Mars was maintained in apossible “warm, wet” state, however, remains unclear.[3] Many of these arguments invoke thicker and, hence,
warmer CO2-based atmospheres in order to achieve surfacetemperatures at or above the melting point of water. These
early atmospheres would have subsequently eroded to spaceor otherwise diminished. Varied attempts to explain surfaceconditions at or above these temperatures through enhancedgreenhouse warming in the atmosphere have all sufferedfrom complications, especially under the reduced solarluminosity of the young Sun [Gough, 1981; Sackmann andBoothroyd, 2003] (resulting in the so-called “faint youngSun” paradox). A thick (multibar) CO2 atmosphere appearsto be incapable of providing the required warming [Kasting,1991; Wordsworth et al., 2013]. Additional contributionsfrom a range of atmospheric gases and aerosols have beensuggested, but these, too, suffer from seemingly fatal flawsthat have precluded their widespread acceptance as key com-ponents of the early martian climate. Gases such as ammoniaand methane [Kuhn and Atreya, 1979; Kasting, 1982] haveshort photochemical lifetimes, which require steady replen-ishment to maintain any extended greenhouse role. Organichazes [Sagan and Chyba, 1997] are unlikely to be producedin the oxidizing martian atmosphere, whereas sulfur dioxide[Postawko and Kuhn, 1986; Yung et al., 1997] is highlysoluble and may precipitate quickly. The presence ofIR-scattering CO2 ice clouds [Forget and Pierrehumbert,1997; Mischna et al., 2000; Forget et al., 2013] have likewisebeen proposed, but the scenario requires a large fractionalcloud cover that is not expected from the dynamics of the early
1Jet Propulsion Laboratory, California Institute of Technology,Pasadena, California, USA.
2Department of Planetary Sciences, Lunar and Planetary Laboratory,University of Arizona, Tucson, Arizona, USA.
3Department of Geological Sciences, Brown University, Providence,Rhode Island, USA.
4Ashima Research, Pasadena, California, USA.
Corresponding author: Michael A. Mischna, Jet Propulsion Laboratory,California Institute of Technology, Pasadena, CA 91109, 4800 OakGrove Dr., M/S 183–601, Pasadena, CA 91109, USA. ([email protected])
©2013. American Geophysical Union. All Rights Reserved.2169-9097/13/10.1002/jgre.20054
560
JOURNAL OF GEOPHYSICAL RESEARCH: PLANETS, VOL. 118, 560–576, doi:10.1002/jgre.20054, 2013
martian atmosphere. Interestingly, it was noted more than adecade ago in Carr [1996], “. . .current climate models cannotbe satisfactorily reconciled with the concept of an early, warmand wet Mars.” Despite great advances in Mars climatemodeling between then and now, this statement remains astrue today as when written.[4] In an attempt to address this seemingly intractable
problem, other suggestions for the provenance of surficialfluvial features dated to the Noachian have been intro-duced, each of which attempts to explain how such mor-phology could be established in the absence of long-termwarm conditions. Squyres and Kasting [1994] put forththe idea that hydrothermal convection beneath the surfaceis responsible for the production of liquid water at thesurface and that such episodic and localized surface watercould flow for tens to hundreds of kilometers beforefreezing, explaining the observed valley systems. Seguraet al. [2002, 2008] have suggested that moderate-to-large-sized impactors (>30 km), which would have beenmore frequent during earlier periods of martian history,would have produced periodic warm and rainy conditionsfor the years to decades following impact and near-surfacetemperatures above 273K for even longer—a process thatcan provide a source of liquid for the many observedfeatures on the surface.[5] Recently, a study by Ehlmann et al. [2011] suggested
that the observed clay minerals at the martian surface couldall have been formed through interactions with subsurfacewater and subsequently exposed through surface erosion,precluding the need for interaction with the near-surfacehydrological cycle and the warm, wet conditions suggestedby its presence. While a novel assertion, it does not appearto be able to explain the presence of all the clays observedat the surface. Ehlmann et al. [2011] used the detection ofobserved hydrated minerals to understand climate in theNoachian on Mars, but minerals serve as poor proxies forthe local climatic conditions because it cannot be deter-mined if they are detrital in nature and formed in the deepcrust (consistent with the cold climate hypothesis) or authi-genic and formed generally in place at the surface (whichsupports the warm, wet hypothesis). Without question,some of the clay minerals were formed in sedimentaryrocks created at the surface, and therefore, they must haveformed in wet (and, hence, warm) environments. A studyby Halevy et al. [2011] of carbonate inclusions in theALH84001 meteorite found that, based upon isotopicfractionation, the inclusions were formed at a surface tem-perature of ~18�C in a near-surface aqueous environment,pointing to a warm environment for at least some time.As one of the few direct data points of the early martianclimate, it points strongly towards and environment thatwas somewhat clement, although the duration of suchconditions cannot be precisely known.[6] Apart from the alternative arguments presented above,
the notion that early Mars had a warmer and wetter environ-ment due to greenhouse warming by one or more gasesremains, perhaps, the most widely explored means of explain-ing the observed surface geochemistry and geomorphology.[7] The idea that sulfur-bearing gases may have contrib-
uted to an early greenhouse is an intriguing one that has beenboth periodically and recently revisited [Postawko andKuhn, 1986; Yung et al., 1997; Halevy et al., 2007; Johnson
et al., 2008, 2009; Tian et al., 2010]. The behavior of suchspecies (specifically, SO2 and H2S) is sufficiently complexthat there is little certainty as to the net effect of sulfur inthe early martian atmosphere and the effect may be timevarying. The presence of sulfur-bearing gases in the earlymartian atmosphere is expected; both sulfur dioxide andhydrogen sulfide are common products from volcanic out-gassing on Earth and are similarly expected from outgassingand eruptive volcanic events on Mars. Indeed, sulfur-bearingminerals appear to be an important component of thegeologic rock record on Mars and point to an active sulfurcycle [McLennan and Grotzinger, 2008; King andMcLennan, 2010]. Both sulfur dioxide and hydrogen sulfidegas are absorbing in the infrared, identifying them aspossible greenhouse candidates. Suggestions that sulfurdioxide (SO2) in particular may have acted as an effectivegreenhouse warmer have been around for some time. Earlyresults from Postawko and Kuhn [1986] with a 1-D, annu-ally averaged model indicated that levels of 1000 ppm couldcontribute to as much as 8–10K of warming, although, as a1-D model, that study was limited to globally averagedconditions and did not generally explore the possibility oflocalized niches becoming warmer or exceeding the 273Kthreshold for liquid water.[8] More recently, Johnson et al. [2008] performed a mod-
eling investigation of the warming influence of volcanicallyintroduced SO2 into the early martian atmosphere using a3-D GCM. For background atmospheres of both 50mband 500mb CO2, and in the presence of water vapor, therole of SO2 as an additional greenhouse gas was explored.Unlike prior investigations, these results showed a poten-tially significant feedback cycle between water vapor andSO2 (although the feedback was not strictly limited toSO2). Specifically, the warming contribution of SO2 wasthought to act as a “trigger” in the climate system, raisingthe mean global surface temperature enough such thatsignificantly greater abundances of water vapor could enterthe atmosphere, with the water vapor ultimately acting asthe dominant greenhouse gas. These results were surprisingand did not agree with the prior investigations, leading to apotential avenue by which early Mars could have sustainedwarmer temperatures.[9] Here, we re-evaluate, in part, the work in Johnson
et al. [2008] using an improved version of the radiation codeused in that study along with a consideration of relevantorbital parameters. The improvements to the radiation codeare based on more recent suggestions of appropriate lineshape parameters and collision-induced absorption andcontinuum functions than were used previously [Halevyet al., 2009; Wordsworth et al., 2010]. We use a correlated-kapproach [Mischna et al., 2012] to solve the equations ofradiative transfer for multiple-gas atmospheres (CO2+H2O+SO2) using the same atmospheric conditions studied inJohnson et al. [2008].[10] In section 2, we provide a brief discussion of the
evidence for warm conditions during early Mars history. Insection 3, we discuss the underlying concept of a trace gas/obliquity-regulated greenhouse cycle. A description of boththe climate model and radiation algorithms is presented insection 4, and section 5 presents results from our model fora range of conditions possible on early Mars. We interpretthese results in section 6.
MISCHNA ET AL.: OBLIQUITY/TRACE GAS GREENHOUSES ON MARS
561
2. Background
[11] While they may seem, prima facie, wholly indepen-dent, greenhouse warming and obliquity have a closelylinked role in regulating climate through martian history.While at present, the climate is modified predominantly bychanges in obliquity with a minimal role for volcanism andgreenhouse warming, during the Noachian, especiallyduring the development of the Tharsis rise, the reverse waslikely true, and obliquity oscillations played a secondary rolewithin a volcanically dominated martian climate. The transi-tional period between these two end-member conditions wasextensive, and findings of post-Noachian fluvial formationson the surface [Mangold et al., 2004, 2008] point to a Hesperianclimate where obliquity may have played a significant rolein regulating the climate by serving as the “switch” thattransitioned Mars between cold/dry and warm/wet periods.
2.1. Geologic Evidence for Warm Conditions ThroughMartian History
[12] The role of water during the early periods of martianhistory was likely substantial. There is widespread evidenceof aqueous alteration of hydrous minerals present in terrainsthat date to the Noachian period (4.5 to 3.7Ga). Results fromOMEGA (Observatoire pour la Mineralogie, l’Eau, les Glaceset l’Activité) on board Mars Express reveal the widespreadpresence of phyllosilicate minerals [Poulet et al., 2005; Bibringet al., 2006] mapped to the oldest, Noachian-aged surfaces.More recent results from Carter et al. [2010] have identifiedancient hydrated silicates in crustal outcrops of the martiannorthern plains. These hydrous materials, which may repre-sent aqueous alteration of igneous rocks or direct precipita-tion out of fluids, point to a global warm and wet Noachianperiod on Mars. Following the Late Heavy Bombardment(~3.8Ga), it is generally believed that there was a gradualcooling of the surface environment, due to decreased inter-nal heat flux and a steady erosion of the atmosphere, suchthat by ~3.5Ga the character of the surface environmenthad changed substantially. Whereas many Noachian-agedsurfaces contain phyllosilicate (clay) mineral assemblages,whose formation requires the presence of water, there arefewer terrains of Hesperian age that show the clear signatureof enduring water. Discovery of Hesperian-aged hydratedsilicates such as opal in regions adjacent to Valles Marineris[Milliken et al., 2008] do require the presence of water toform; however, the low abundance of quartz on the surfacealong with enhanced levels of opal-A and opal-CT indicatesthat the conversion to quartz was incomplete, and, hence, theduration of water interaction at the surface was limited afterthe opal was formed [Tosca and Knoll, 2009]. Regional val-ley networks [Mangold et al., 2004, 2008] that cut throughHesperian-aged terrain adjacent to Echus and Melas Chas-mata also suggest precipitation during the Late Hesperian,and thus warmer conditions at least periodically during thisperiod. The presence of these younger fluvial features onthe surface indicates at least the temporary presence of liquidwater at the surface on either a regional or global scale.
2.2. Post-Noachian Fluvial Activity:Competing Hypotheses
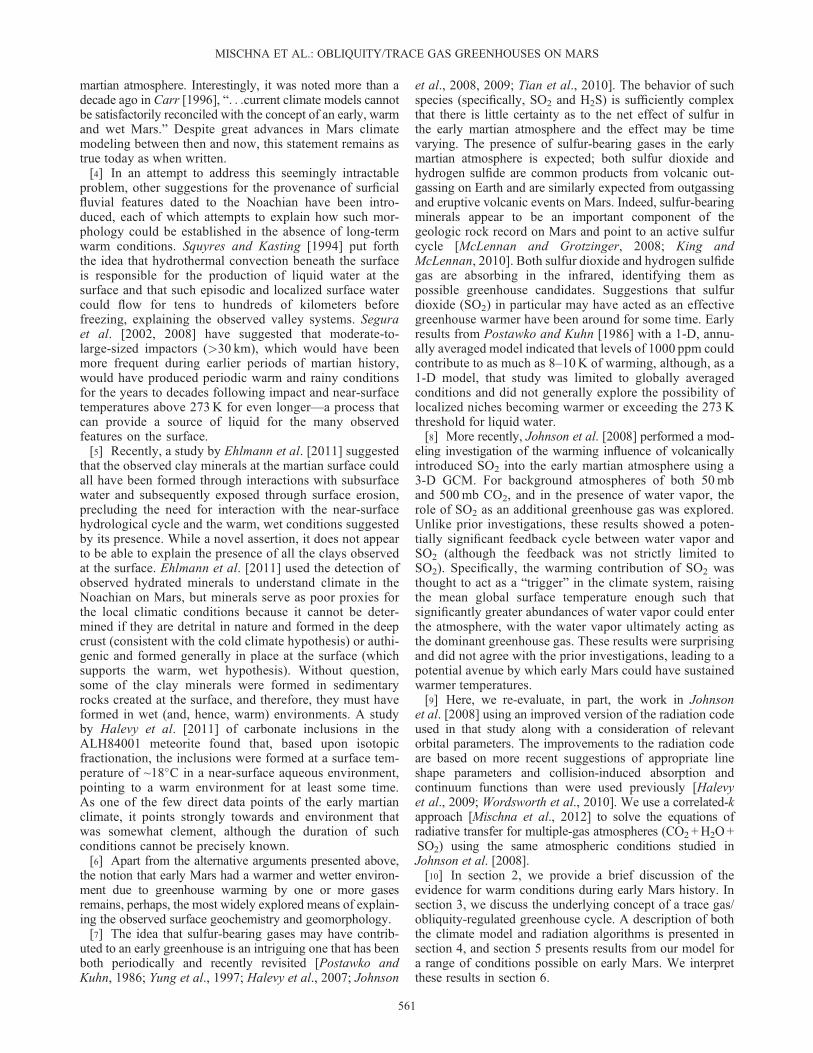
[13] Multiple hypotheses [e.g., Clifford and Parker, 2001;Baker, 2009] present differing scenarios of how the climate
may have evolved during this period of martian history(Figure 1); there are two leading explanations for the forma-tion of fluvial surface features in the post-Noachian terrains.The first argues that a secular decrease in internal heatingproduced a martian climate that was largely cold and dryby the time of the Noachian-Hesperian transition. Fluvialsurface features dated to the post-Noachian are explainedas being a response to local enhancements in hydrothermalcirculation or subsurface heat flow [Squyres and Kasting,1994; Gulick, 2001]. In other words, these features are aresponse to local, rather than global, climate change. Thenear-surface environment has responded to this decrease ininternal heating by the gradual thickening of the cryosphereover time [Clifford and Parker, 2001], reducing the likeli-hood of water at the surface. This theory can be visualizedin terms of the relative “ease” of supporting surface liquidby the “Secular Decrease” curve in Figure 1.[14] The second theory was originally conceived by Baker
et al. [1991] and is known by the moniker Mars EpisodicGlacial Atmospheric Oceanic Upwelling by ThermotectonicFLood Outburst (“MEGAOUTFLO”). The MEGAOUTFLOtheory argues for episodic enhancements in heat flow andvolcanism, which result in short-duration periods throughoutmartian history that are globally warmer and wetter than thoseat present (Baker [2009]; Figure 1, “MEGAOUTFLO” curve).The presence of post-Noachian fluvial erosion in the highlandvalleys [Baker and Partridge, 1986; Bradley et al., 2002],valley networks on Alba Patera [Baker et al., 1991] and adja-cent to Valles Marineris [Mangold et al., 2004], young fluvialformations in Medusa Fossae [Bradley et al., 2002] and manyapparently warm-based glacial features [Baker, 2001] are allseen as consistent with these periodic warming episodes inthe martian climate during the post-Noachian period. MarsExpress High-Resolution Stereo Camera observations of Marshave bolstered this idea of episodic volcanic activity spanningmost of post-Noachian martian history [Neukum et al., 2004;Werner, 2009]. In MEGAOUTFLO, thermal and/or tectoniceffects associated with large mantle plumes result in therelease of large amounts of radiatively active gases (in theoriginal MEGAOUTFLO concept, these gases are primarilyCO2 and CH4), which produce massive, explosive outburstsof water and sediment, flooding the martian Northern Plainswith a large-scale northern ocean and initiating a widespreadgreenhouse effect across the planet from the once-subsurfacereservoirs of CO2, H2O and other trace gases. These periodicoutbursts are short-lived (103-105 years) and the age of theobserved landforms seems to suggest that these episodes werelonger in duration during the Noachian, and have grownprogressively shorter with time.
3. Trace Gas/Obliquity Interaction
[15] As discussed in section 1, there have been no com-pletely satisfactory explanations for how a greenhouse atmo-sphere, alone, could have maintained a wet early Mars in lightof the reduced solar luminosity [Gough, 1981; Sackmann andBoothroyd, 2003] expected during the Noachian. One investi-gation using a GCM to study an early Mars environment withmoderate CO2 atmospheres and high levels of atmosphericSO2 [Johnson et al., 2008] produced an interesting result.Confirming previous investigations [e.g., Postawko and Kuhn,1986], the individual greenhouse roles of H2O and SO2 were
MISCHNA ET AL.: OBLIQUITY/TRACE GAS GREENHOUSES ON MARS
562

found to be small at low martian temperatures, even in a back-ground atmosphere of tens to hundreds of millibars of CO2.However, the volcanic emission of certain greenhouse gases,while themselves not sufficient to provide the warmingrequired for surface liquid, appeared to have acted as a“trigger” to elevate the mean atmospheric temperature to apoint at which water vapor became the dominant greenhousegas, and could have remained so for some time followingphotochemical loss or rainout of the initial volcanic species.[16] Conditions expected during the Late Noachian-Early
Hesperian period provide such an avenue by which highlevels of water vapor can be sustained for not-insignificantperiods of time. The initial rise in temperature from thevolcanic outgassing imparts the needed warming to spurgreater influx of water vapor into the atmosphere from extantsurface and near-surface reservoirs. Paleoclimate photochem-ical modeling by Johnson et al. [2009] estimates the lifetimeof the large amounts of SO2 in the early martian atmosphere,from Johnson et al. [2008], to be 103-104 years, providingan extended period under which large-scale surface waterreservoirs can develop. For lesser SO2 abundances, theatmospheric lifetime would be correspondingly shorter, butthe actual abundance that could be reached during an individ-ual outgassing episode still remains an open question and was,presumably, episodically variable. So long as the atmosphereis in contact with this surface water, the atmosphere will re-main humid. (Liquid water is not strictly necessary, but itspresence implies higher atmospheric temperatures and thus alarger water vapor capacity). Following the eventual loss ofthe volcanic trace gases, atmospheric temperatures will returnto their pre-“trigger” values, buffered somewhat by thetransient presence of any surface water as the overall systemslowly cools.[17] Conventional wisdom argues that a species like SO2
(and H2S, through its oxidation) would make a poor green-house gas because of its high solubility and participationin photochemical pathways that lead to sulfate aerosols.Such aerosols have a penchant for scattering incoming sun-light and thus are thought to act as a net cooling mechanism
[e.g., Tian et al., 2010]. The photochemical modeling ofJohnson et al. [2009] indicates, however, that this mightnot be the case in an ancient martian atmosphere that wasmore reduced than today. The chemical pathway from SO2
to SO4 aerosols requires radical species (primarily OH-) inorder to proceed. Under the thicker (and more reducing)ancient martian conditions, these radical species would behighly depleted below the ancient martian tropopause.Therefore, even though SO2 would have been be abundant,there would be too few available oxidants for efficientconversion of SO2 into sulfate, and thus minimal scattering(and cooling) of the atmosphere. Further, loss of SO2
dissolved in rainwater would be limited by surface watersaturated in SO2 [Johnson et al., 2009].[18] In contrast, Tian et al. [2010], using an approach that
considered the radiative effects of sulfate aerosols, arguedthat the transient warming period should be on the orderof months, not years (nor centuries), due to the eventualcooling effect introduced by scattering from airborne sulfateaerosols. Both approaches concede that numerous volcanicevents (up to ~104) are consistent with best estimates oftotal maximum sulfur outgassing from the formation of theTharsis province [Halevy et al., 2007].[19] Today, martian climate is largely controlled by the
planet’s obliquity, or axial tilt. While presently at a moderate25�, the obliquity of Mars oscillates with a period of~105 years and, within the past 20Myr, has ranged between15� and 45� [Laskar et al., 2004]. There is substantialevidence that these shifts in obliquity are the key drivers ofrecent martian climate. GCM modeling of Haberle et al.[2003], Mischna et al. [2003] and Forget et al. [2006] findthat under periods of higher obliquity (> ~ 35�), polarsurface ice is mobilized and transported to lower latitudes,where it is thermodynamically stable. These studies confirmthe early predictions of Jakosky and Carr [1985]. At obliqui-ties of 45� and higher, ice is stable at the equator. Geomorpho-logical evidence of mid-latitude glacial deposits [Christensen,2003; Milliken et al., 2003; Head et al., 2005; Plaut et al.,2009], mantled and desiccated terrain [Mustard et al., 2001;
Noachian Hesperian Amazonian
Tem
pera
ture
Obliquity DominatedVolcanically Dominated
Punctuated Warming
Secular Decrease
Time
War
mer
Col
der
Volatile Influx
105 yr obliquitycycles
Figure 1. Two possible timelines for the level of aqueous activity at the martian surface: a steady,secular decrease with time having little aqueous activity since the Late Hesperian or the MEGAOUTFLOscenario with generally low, but episodically high, water activity throughout history. Both scenarios envisiona warm, wet, volcanically dominated Noachian beginning with the early influx of volatiles from planetarybombardment and are consistent with a present-day obliquity-dominated climate. Changes in aqueousactivity today are controlled by shifts in axial tilt over the 105 year obliquity cycle (enlargement).
MISCHNA ET AL.: OBLIQUITY/TRACE GAS GREENHOUSES ON MARS
563
Head et al., 2003], and the regularity of polar layereddeposit sequences [Milkovich and Head, 2005; Limayeet al., 2012] strongly point to control of surface volatilesby this 105 year cycle.[20] It is not unreasonable, then, to assume that obliquity
played a role in modifying martian climate from the outset.Today, in the presence of a thin CO2 atmosphere and withno widespread volcanism, the amount of water vapor in theatmosphere is relatively small, even at high obliquities, andthis has likely helped to sustain the cold/dry climate duringthe Amazonian. During the more geologically activeNoachian, however, volcanism was more widespread andthere were stronger contributions from greenhouse gasesin the thicker atmosphere.[21] Through its control on the amount of atmospheric
water vapor, the obliquity cycle acts as a natural regulatorfor the strength of the water vapor greenhouse on Mars.The regular oscillations in Mars’ axial tilt bring the planetinto and out of periods of alternating wetter and drier condi-tions. Under the present-day obliquity (and under presentatmospheric conditions), the atmosphere is dry, and theavailability of moisture is controlled by the temperature ofwater ice exposed in the northern polar cap. During periodsof higher obliquity, the annual average polar temperaturesalso rise, increasing the level of water vapor released intothe atmosphere [Jakosky and Carr, 1985; Mischna et al.,2003; Mischna and Richardson, 2005]. Jakosky and Carr[1985] suggest water vapor levels over the poles ~50-100times greater than the present-day value for an obliquity of45�. While peak levels may be somewhat overestimatedbased on the development of sediment lag deposits over time[Mischna and Richardson, 2005], there will still be a greaterabundance of water in the atmosphere at higher obliquities.Conversely, as the obliquity decreases to zero, the polesact as cold traps, which efficiently removes water vapor fromthe atmosphere. However, regardless of the obliquity andamount of atmospheric water vapor, the current martianclimate system remains too cold to sustain liquid water atthe surface.[22] The same cannot be said for earlier epochs when a
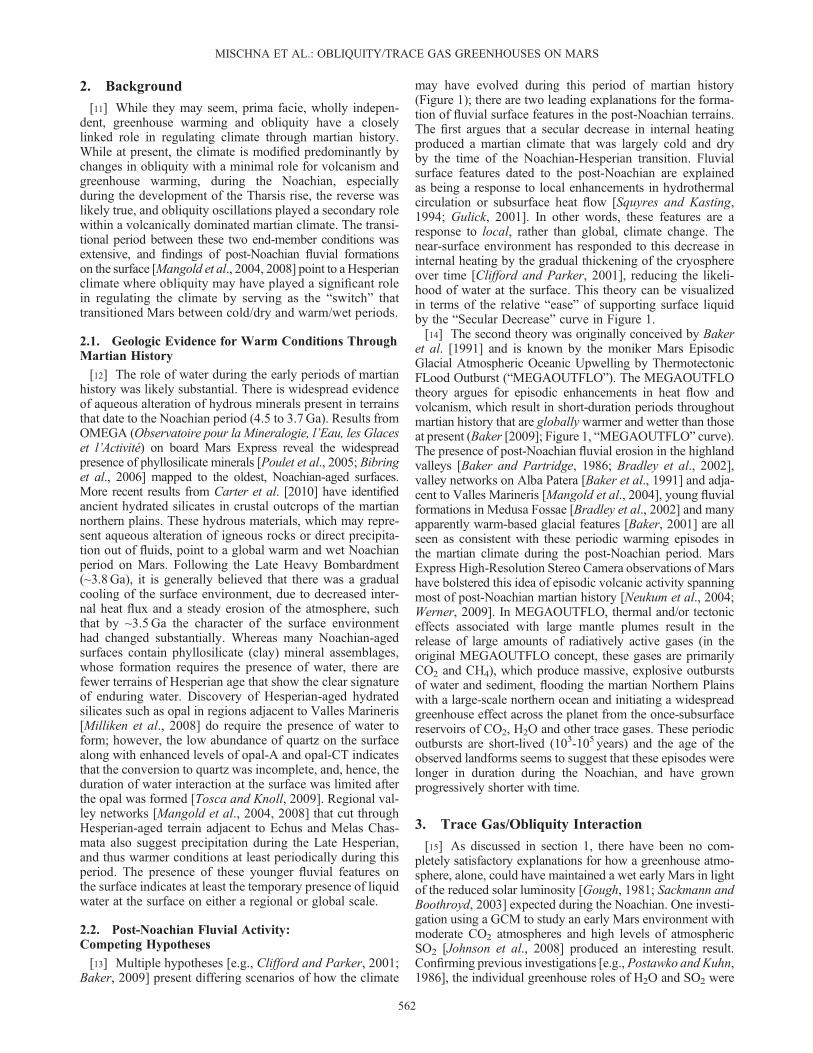
somewhat thicker CO2 atmosphere and more vigorousvolcanic activity elevated atmospheric temperatures to thepoint that these oscillations in obliquity may have had a realand significant control on whether the system fell above orbelow the nominal freezing point. Conceptually, the controlof obliquity on temperature is illustrated in Figure 2. In theabsence of widespread volcanic emissions, such as today,the mean global surface temperature (red, dashed curves)varies only slightly over obliquity cycles, and it remains atleast several tens of degrees below the nominal freezingpoint (a portion of an identical, “nominal” obliquity cycleis illustrated at the top for each of the three martian epochs.)During periods of increasing or sustained high obliquity,higher water vapor levels are supported in the atmosphere.If, during this high obliquity period, there is an event thatelevates volcanic trace gas levels, even more water vaporcan enter the atmosphere, raising temperatures (lower solidblack curves) above the freezing point. This effect is negligi-ble in the cold/dry Amazonian climate, and thereforesustained liquid water is not possible. During the Noachian,prolonged volcanism (and a thicker CO2 atmosphere) wouldhave overwhelmed the modifying effects of obliquity,
allowing the presence of liquid water by this method almostregardless of tilt. It is during the Hesperian that surfacetemperatures are most dramatically influenced by shifts inobliquity. Once high, temperatures above the melting pointof water ice can be temporarily sustained so long as obliquityremains high and surface water is available to humidify theatmosphere. As obliquity begins to decrease and surfacereservoirs freeze, water vapor levels fall and the entire system“crashes” back to a cold, dry state.[23] Our avenue for exploring this proposed idea involves
the use of a 3-D GCM that is capable of modeling theclimate conditions believed to be present during early martianhistory. By setting the most influential orbital parameters andadjusting the amount of water vapor present in the atmosphere,we can examine the range of conditions that are plausiblein the early martian climate both during and after one ofthese large volcanic events and on the timescales of theorbital cycles.
4. Model Description
4.1. MarsWRF General Circulation Model
[24] Atmospheric circulation on Mars is simulated usingthe Mars Weather Research and Forecasting (MarsWRF)GCM. MarsWRF is a global model derived from theterrestrial mesoscale WRF model [Michalakes et al., 2004;Skamarock et al., 2005; Skamarock and Klemp, 2008] andis a Mars-specific implementation of the PlanetWRF GCM[Richardson et al., 2007]. MarsWRF solves the primitiveequations using a finite difference model on an Arakawa C
Obl
iqui
tyTe
mpe
ratu
re
Melting Point
CO2 only
AmazonianHesperianNoachian
CO2+H2O+volcanic
Critical Obliquity
Figure 2. The role of the water vapor feedback effect ineach of the three martian epochs for a similar obliquitycycle. In the Noachian, CO2-only temperatures (red line)are near the melting point and change minimally over thecycle. Introduction of volcanic gases “activates” the watervapor feedback, sustaining warm temperatures until obliquityfalls below some “critical” value. In the Hesperian, periodicvolcanism similarly raises temperatures but may be morestrongly limited by the obliquity phase. The presence ofsurface water sustains higher vapor levels (and consequentwarming) for some time after loss of volcanic gas. Thisfeedback is maximized at high obliquity (allowing liquidwater) and squelched as obliquity drops. In the Amazonian,temperatures remain below the melting point, regardless ofobliquity, and stable liquid is not possible.
MISCHNA ET AL.: OBLIQUITY/TRACE GAS GREENHOUSES ON MARS
564
grid. The horizontal resolution of the model is variable andselectable at runtime, and the vertical grid follows a modi-fied-sigma (terrain-following) coordinate with resolutionalso selectable at runtime. For validation purposes, the totalpresent-day atmospheric CO2 budget has been tuned [Guoet al., 2009] to fit the Viking Lander annual pressure curves(~6.1mb) before the pressure is scaled upwards to reflect thethicker early martian atmosphere. Surface albedo andthermal inertia are matched to MGS-TES observations[Christensen et al., 2001; Putzig et al., 2005] except wherenoted for specific investigations. Water ice albedo andemissivity are fixed at 0.45 and 1.0, respectively, whilecorresponding values for CO2 ice are independently cho-sen for each hemisphere [Guo et al., 2009], althoughthis does not appreciably affect our results. Underthese thicker-atmosphere conditions, we do not impose apermanent south polar CO2 ice cap but replace it with apermanent H2O ice cap of similar size. We use a modelresolution of 5� � 5� � 40 vertical layers, (from 0–80 km).Orbital and axial parameters are readily adjusted inMarsWRF, which makes it straightforward to examine Marsat conditions of varying obliquity. At different obliquities,surface albedo and thermal inertia maps are modified inresponse to the deposition of ice on the surface at eachlocation. This process follows from Mischna et al. [2003].A basic water cycle is present in MarsWRF, allowing forthe formation of water ice clouds (although they are notradiatively active here), including particle sedimentationand transport.
4.2. KDM Radiation Code
[25] We have developed a multigas, two-stream radia-tion referred to as the KDM model [Mischna et al.,2012] loosely based on the structure outlined in Edwardsand Slingo [1996] but modified to use the k-distributionradiative transfer method. This method retains much ofthe accuracy of line-by-line calculations but is signifi-cantly faster, making it ideal for computationally expen-sive 3-D global models. Details about the correlated-kmethod are widely found in the literature [e.g., Lacis andOinas, 1991; Fu and Liou, 1992], and information aboutthe particular implementation used here may be found inMischna et al. [2012]. We provide only a brief description ofthe approach here.[26] Conceptually, the “trick” to the correlated-k method
involves partitioning the solar/IR spectrum into distinctspectral bands and resorting the absorption curve withineach band (which is highly variable as a function ofwavelength) to produce a smooth curve of line strength thatis more conducive to numerical approximation. In thepresent implementation, the full solar/IR spectrum ispartitioned into 14 bands (seven solar, seven IR, from 0.24to 1000 mm) of varying widths. The absorptivities withineach band are then sorted by strength. This sorted curveno longer maps line intensity directly to wavelength butinstead maps intensity to the cumulative probability func-tion, i.e., “What fraction of the intensities are smaller thanthe given intensity?” Atmospheric transmissivity, Tr, iscalculated by numerical integration of this smooth curveusing a 32-point double Gaussian quadrature (split at0.95) according to
Tr ¼X32
i¼1
aiexp �kiu½ �
where ki are the absorption coefficients at each of the 32quadrature points, ai are the corresponding weights obtainedfrom the Gaussian quadrature (which are fixed across allspectral bands and all atmospheric conditions), and u is themass of the absorbing gas in the optical path (ku is morecommonly known as t—atmospheric opacity).[27] Absorption coefficients are stored offline in a LUT.
Coefficients are stored from 50 to 400K with 20K spacingand from 10�4 to 106 Pa with log(p) = 0.4 spacing. Watervapor is allowed to vary in the climate model, and gas mix-tures with variable water vapor amounts from 10�7 to 10�1
(by decade) along with a water-free mixture are stored inthe LUT. We assume a fixed amount of SO2 present in theatmosphere, a 2.45� 10�4 mixing ratio, mimicking the highlimit used in Johnson et al. [2008] for a 500mb atmosphere,based on estimate ofWilson and Head [2002]. Our choice hereis designed to provide the best-case scenario for achievingwarm conditions. Lesser amounts of SO2, such as the lowerlimit used in Johnson et al. [2008] (still a significant concen-tration requiring a high level of volcanic outgassing), willproduce less warming. In this sense, if warm temperaturescannot be achieved in our present model, then they likelycannot be achieved with lesser SO2 abundances.[28] The radiation code has been incorporated into the
MarsWRF general circulation model and the GCM is runforward for two martian years with output every 3 hours.Results are analyzed for the second Mars year. Simulations(not shown) of surface temperatures have been run out foras much as seven Mars years and show no appreciabledifferences beyond the second year. Solar luminosity hasbeen reduced to 75% of the present-day value to reproducethe faint young Sun experienced in early martian history, anddust is excluded from the atmosphere as the abundance anddistribution of dust is unknown in the earlyMars environment.
5. Model Runs
5.1. Present Obliquity (25�)[29] Our choice of SO2 mixing ratio is based on the
maximum estimated abundance from Johnson et al. [2008]for a 500mb baseline CO2 atmosphere (245 ppm), whichyielded the maximum level of warming among their scenarios.By choosing atmospheric conditions that maximize greenhousewarming, we can provide an upper limit on not only the globalaverage temperatures that may be obtained but also localizedvariations that may provide isolated regions of enhancedwarming.5.1.1. Baseline[30] For the baseline simulation, we have run the MarsWRF
GCM with an atmosphere of 500mb CO2 and no other radia-tively active atmospheric gases. Annually averaged surfacetemperatures for the last year of the simulation are shown inFigure 3a. Peak annually averaged equatorial temperaturesreach ~235K, with a globally averaged value of 219K(Table 1). This is within a couple degrees of the value obtainedby Johnson et al. [2008] and not too dissimilar from the cur-rent average surface temperature. The increased greenhousepotential of the thicker CO2 atmosphere is offset by the reduc-tion in solar luminosity.
MISCHNA ET AL.: OBLIQUITY/TRACE GAS GREENHOUSES ON MARS
565
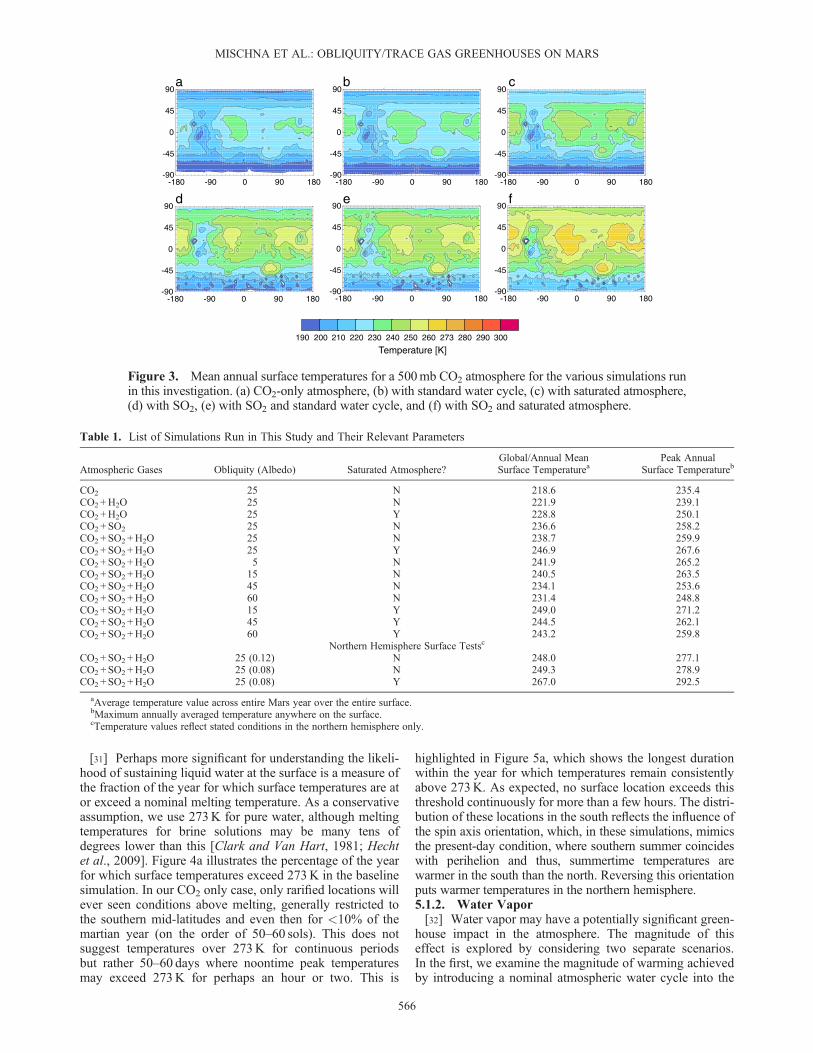
[31] Perhaps more significant for understanding the likeli-hood of sustaining liquid water at the surface is a measure ofthe fraction of the year for which surface temperatures are ator exceed a nominal melting temperature. As a conservativeassumption, we use 273K for pure water, although meltingtemperatures for brine solutions may be many tens ofdegrees lower than this [Clark and Van Hart, 1981; Hechtet al., 2009]. Figure 4a illustrates the percentage of the yearfor which surface temperatures exceed 273K in the baselinesimulation. In our CO2 only case, only rarified locations willever seen conditions above melting, generally restricted tothe southern mid-latitudes and even then for <10% of themartian year (on the order of 50–60 sols). This does notsuggest temperatures over 273K for continuous periodsbut rather 50–60 days where noontime peak temperaturesmay exceed 273K for perhaps an hour or two. This is
highlighted in Figure 5a, which shows the longest durationwithin the year for which temperatures remain consistentlyabove 273K. As expected, no surface location exceeds thisthreshold continuously for more than a few hours. The distri-bution of these locations in the south reflects the influence ofthe spin axis orientation, which, in these simulations, mimicsthe present-day condition, where southern summer coincideswith perihelion and thus, summertime temperatures arewarmer in the south than the north. Reversing this orientationputs warmer temperatures in the northern hemisphere.5.1.2. Water Vapor[32] Water vapor may have a potentially significant green-
house impact in the atmosphere. The magnitude of thiseffect is explored by considering two separate scenarios.In the first, we examine the magnitude of warming achievedby introducing a nominal atmospheric water cycle into the
190 200 210 220 230 240 250 260 273 280 290 300
0
45
90
-45
-90-180 -90 0 90 180
0
45
90
-45
-90-180 -90 0 90 180
0
45
90
-45
-90-180 -90 0 90 180
0
45
90
-45
-90-180 -90 0 90 180
0
45
90
-45
-90-180 -90 0 90 180
0
45
90
-45
-90-180 -90 0 90 180
Temperature [K]
a b c
d e f
Figure 3. Mean annual surface temperatures for a 500mb CO2 atmosphere for the various simulations runin this investigation. (a) CO2-only atmosphere, (b) with standard water cycle, (c) with saturated atmosphere,(d) with SO2, (e) with SO2 and standard water cycle, and (f) with SO2 and saturated atmosphere.
Table 1. List of Simulations Run in This Study and Their Relevant Parameters
Atmospheric Gases Obliquity (Albedo) Saturated Atmosphere?Global/Annual MeanSurface Temperaturea
Peak AnnualSurface Temperatureb
CO2 25 N 218.6 235.4CO2 +H2O 25 N 221.9 239.1CO2 +H2O 25 Y 228.8 250.1CO2 +SO2 25 N 236.6 258.2CO2 +SO2 +H2O 25 N 238.7 259.9CO2 +SO2 +H2O 25 Y 246.9 267.6CO2 +SO2 +H2O 5 N 241.9 265.2CO2 +SO2 +H2O 15 N 240.5 263.5CO2 +SO2 +H2O 45 N 234.1 253.6CO2 +SO2 +H2O 60 N 231.4 248.8CO2 +SO2 +H2O 15 Y 249.0 271.2CO2 +SO2 +H2O 45 Y 244.5 262.1CO2 +SO2 +H2O 60 Y 243.2 259.8
Northern Hemisphere Surface Testsc
CO2 +SO2 +H2O 25 (0.12) N 248.0 277.1CO2 +SO2 +H2O 25 (0.08) N 249.3 278.9CO2 +SO2 +H2O 25 (0.08) Y 267.0 292.5
aAverage temperature value across entire Mars year over the entire surface.bMaximum annually averaged temperature anywhere on the surface.cTemperature values reflect stated conditions in the northern hemisphere only.
MISCHNA ET AL.: OBLIQUITY/TRACE GAS GREENHOUSES ON MARS
566

martian system. This simple cycle allows water vapor tosublime off polar caps (present in both hemispheres) andinto the atmosphere. Where saturated, water ice can formin the atmosphere and fall to the surface. We do not includethe radiative effect of water ice clouds in this situation as weare considering gas phase warming only. Figure 6 illustratesthe column-integrated annual water vapor abundance for thissimple water cycle model (referred to as the “standard”Marswater cycle).[33] Net warming over the CO2-only atmosphere is shown
in Figure 7a and reveals only nominal warming planet-wide,with slightly higher warming of about 5–6K in the northpolar regions adjacent to the large residual polar cap. Watervapor is being sublimed off the residual polar caps duringtheir respective summers, which manifests itself as seasonalmaxima at these latitudes during the summer seasons. This
behavior is not unlike present-day Mars but without thepresence of a residual CO2 ice cap in the south, whichinhibits water vapor sublimation during southern summer.[34] To determine the upper limit of warming from water
vapor, the second scenario prescribes a time-dependent andlocation-dependent mixing ratio at each model grid pointequal to the local saturation vapor pressure (determinedby the local temperature). Again, cloud formation isignored, although more likely to occur under these (con-trived) conditions than in our standard Mars water cyclescenario. Such a saturated atmosphere provides substan-tially more warming to the early Mars climate than thestandard water cycle, with increases of ~20K found in thenorthern polar regions (Figure 7b). The warming distributiongenerally follows the topography and overall atmosphericcolumn depth.
1 5 10 20 30 40 50 60 70 80 90 100
0
45
90
-45
-90-180 -90 0 90 180
0
45
90
-45
-90-180 -90 0 90 180
0
45
90
-45
-90-180 -90 0 90 180
0
45
90
-45
-90-180 -90 0 90 180
0
45
90
-45
-90-180 -90 0 90 180
0
45
90
-45
-90-180 -90 0 90 180
Time Above 273 K [%]
a b c
d e f
Figure 4. Fraction of the year for which surface temperatures exceed 273K for the same simulations asin Figure 3. Areas in white experience such temperatures <1% of the martian year.
0
45
90
-45
-90-180 -90 0 90 180
0
45
90
-45
-90-180 -90 0 90 180
0
45
90
-45
-90-180 -90 0 90 180
0
45
90
-45
-90-180 -90 0 90 180
0
45
90
-45
-90-180 -90 0 90 180
0
45
90
-45
-90-180 -90 0 90 180
0.1 0.2 0.5 1 2 5 10 20 50 100 200 500
Longest Duration > 273 K [sols]
a b c
d e f
Figure 5. Longest duration (in sols) over which temperatures continuously exceed 273K for the samesimulations as in Figure 3. Areas in white experience such temperatures at no point during the martian year.
MISCHNA ET AL.: OBLIQUITY/TRACE GAS GREENHOUSES ON MARS
567
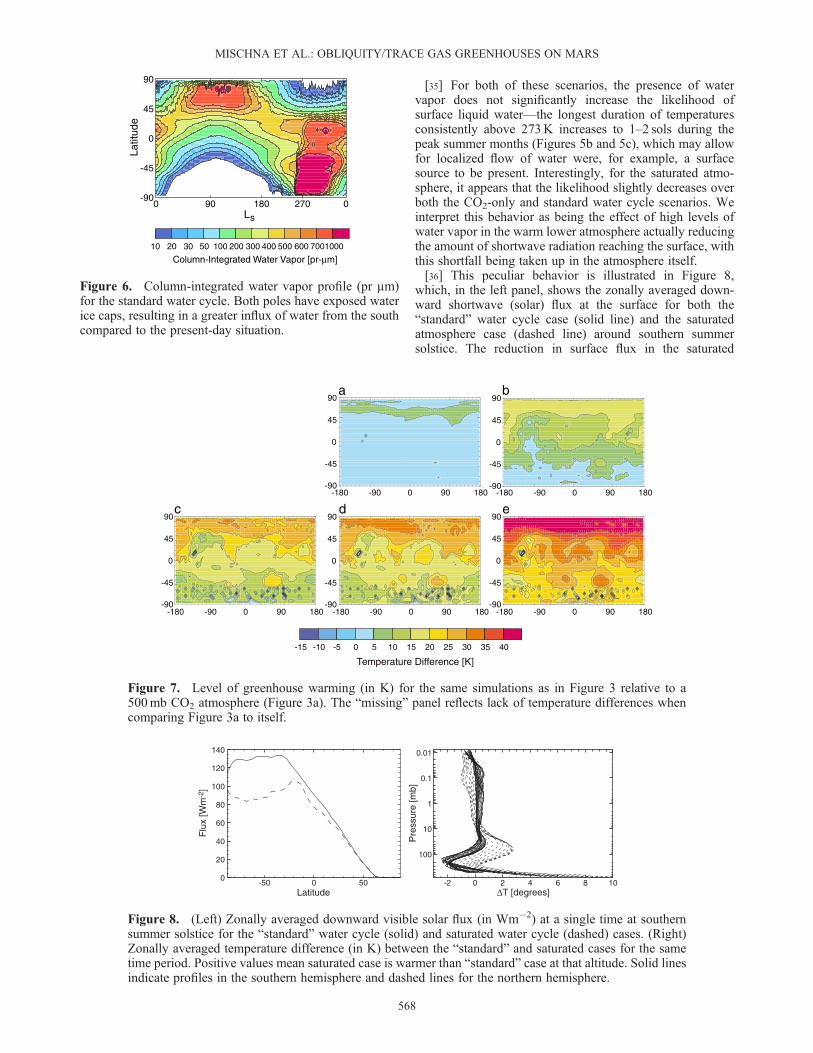
[35] For both of these scenarios, the presence of watervapor does not significantly increase the likelihood ofsurface liquid water—the longest duration of temperaturesconsistently above 273K increases to 1–2 sols during thepeak summer months (Figures 5b and 5c), which may allowfor localized flow of water were, for example, a surfacesource to be present. Interestingly, for the saturated atmo-sphere, it appears that the likelihood slightly decreases overboth the CO2-only and standard water cycle scenarios. Weinterpret this behavior as being the effect of high levels ofwater vapor in the warm lower atmosphere actually reducingthe amount of shortwave radiation reaching the surface, withthis shortfall being taken up in the atmosphere itself.[36] This peculiar behavior is illustrated in Figure 8,
which, in the left panel, shows the zonally averaged down-ward shortwave (solar) flux at the surface for both the“standard” water cycle case (solid line) and the saturatedatmosphere case (dashed line) around southern summersolstice. The reduction in surface flux in the saturated
0
45
90
-45
-900 90 180 0270
10 20 30 50 100 200 300 400 500 600 7001000
Latit
ude
Ls
Column-Integrated Water Vapor [pr-μm]
Figure 6. Column-integrated water vapor profile (pr mm)for the standard water cycle. Both poles have exposed waterice caps, resulting in a greater influx of water from the southcompared to the present-day situation.
0
45
90
-45
-90
0
45
90
-45
-90
0
45
90
-45
-90
0
45
90
-45
-90
0
45
90
-45
-90-180 -90 0 90 180
-180 -90 0 90 180 -180 -90 0 90 180
-180 -90 0 90 180 -180 -90 0 90 180
-15 -10 -5 0 5 10 15 20 25 30 35 40
Temperature Difference [K]
a b
c d e
Figure 7. Level of greenhouse warming (in K) for the same simulations as in Figure 3 relative to a500mb CO2 atmosphere (Figure 3a). The “missing” panel reflects lack of temperature differences whencomparing Figure 3a to itself.
-2 0 2 4 6 8 10ΔT [degrees]
100
10
1
0.1
0.01
Pre
ssur
e [m
b]
-50 0 50Latitude
0
20
40
60
80
100
120
140
Flu
x [W
m-2
]
Figure 8. (Left) Zonally averaged downward visible solar flux (in Wm�2) at a single time at southernsummer solstice for the “standard” water cycle (solid) and saturated water cycle (dashed) cases. (Right)Zonally averaged temperature difference (in K) between the “standard” and saturated cases for the sametime period. Positive values mean saturated case is warmer than “standard” case at that altitude. Solid linesindicate profiles in the southern hemisphere and dashed lines for the northern hemisphere.
MISCHNA ET AL.: OBLIQUITY/TRACE GAS GREENHOUSES ON MARS
568

atmosphere is evident in the southern hemisphere wheretemperatures are warmest and water vapor content of thesaturated atmosphere is greatest. The zonally averagedtemperature difference (ΔT) in each of the 36 model latitudebands between the two simulations during the same timeperiod is shown in the right panel of Figure 8. The solidlines, corresponding to latitudes in the southern hemisphere,show a distinct pattern, with slightly positive values above~50mb (positive indicates the saturated case is warmer)and mostly negative values below, including at the surface,which is reflected in the results of Figures 7b and 7c, forwhich the likelihood of surface liquid water is slightlygreater for the drier “standard” water cycle. At pressuresabove ~200mb, the trend in ΔT reverses, and values tendtowards the positive; however, the higher elevation of thesouthern hemisphere (having, hence, lower surface pressures)prevents the saturated case from again being warmer at thesurface. A similar overall behavior is observed in the northern(wintertime) hemisphere, which is represented by the dashedlines, but the effect of the lower topography can be seen bythemore strongly positive temperature differences at the surface.As the north is the winter hemisphere in this case, we wouldnot expect either scenario to yield temperatures>273K duringthis season, which is consistent with Figure 7a or 7b.5.1.3. Sulfur Dioxide[37] Next, we explore the magnitude of the greenhouse
contribution from SO2 alone by adding SO2 into the modelatmosphere and excluding water vapor. Figure 7c illustratesthe warming contribution of SO2, which is more significantthan that of water vapor. Peak temperatures in this simulationmay be as much as 35K warmer than CO2 only, in line with,but greater than, the ~27K warming seen in Johnson et al.[2008, Figure 4d]. As with water vapor, the pattern of warm-ing generally mimics the surface topography, indicating thatSO2 is not optically thick at these abundances. There is a slightgrowth in the area for which surface temperatures exceed273K but not significantly greater than our previous cases.[38] Despite the northern hemisphere experiencing the
greatest relative warming, it remains the southern hemispherethat is, overall, the warmest. The deep Hellas basin has becomea clear region of warm temperatures—above 273K for ~20%of the year, all of which occurs contiguously during thesouthern summer, with localized subregions of Hellas main-taining warm temperatures for up to 100 consecutive sols.[39] In Figures 7d and 7e, we reintroduce water vapor into
the atmosphere using the standard water cycle and a saturatedatmosphere, respectively. In the latter case, warming of>40Kis found throughout the northern hemisphere high latitudesand warming of >20K globally. For these conditions, webegin to see conditions more conducive to the presence ofliquid water. Much of the planet experiences conditions>273K for 10% of the year (Figures 4e and 4f), with the Hellasbasin exhibiting such temperatures for nearly half of the year.With the exception of the Tharsis region, warm temperaturesare achieved globally for at least a portion of the year.[40] These results, however, are counter to the spectacular
warming found by Johnson et al. [2008] which showed amaximum ΔT of ~70K for the CO2 + SO2 +H2O simulationand nearly ubiquitous conditions above 273K. The presentradiation model is a significant improvement over the oneused in Johnson et al. [2008] and incorporates severalmodifications that better capture the nature of the radiative
transfer, including incorporation of collision-induced absorp-tion and continuum effects, a finer discretization of the spectralgrid and better characterization of the 15mm CO2 band.[41] Mischna et al. [2012] performed a rigorous validation
of the present KDM scheme and found it to provide resultsconsistent with line-by-line spectral models for both present-day and early Mars atmospheres. A reanalysis of the absorp-tion model used in Johnson et al. [2008] shows similarresults for present-day conditions but somewhat significantdepartures (relative to line-by-line models) for conditionsof thicker and wetter atmospheres, resulting in an excessof atmospheric absorption and excessive surface tempera-tures. We are confident that the results presented here aresuperior to those in Johnson et al. [2008] and conclude thatthe results from Johnson et al. [2008], which were notadequately validated, incorrectly overestimated the amountof warming expected under these wet, thick atmosphereconditions, as they are noticeably distinct from both recentresults and other, earlier work.
5.2. Obliquity Cycle
[42] In the previous section, we have seen that even underthe most optimistic cases, at present-day obliquity and with a500mb atmosphere of CO2, H2O, and SO2, it is difficult tosustain warm temperatures at the martian surface exceptfor limited niches. The situation is further compounded bythe orbital configuration of the planet. Under varying orbitalconditions, the distribution of insolation varies markedly,which modifies the surface temperature distribution andhence the local saturation vapor pressure, which will impactthe peak warming one can expect at the surface.[43] Martian obliquity has a periodic cycle of ~124,000 years
and oscillates regularly, with swings of as much as 30–40� percycle. Numerical integrations have calculated martian obliquityback as far as 20Myr [Laskar et al., 2004] and have providedprobability functions of martian obliquity (which is chaoticon longer timescales) throughout its history. At higher obliq-uity, during the summer months, the high latitudes are bathedin perpetual sunlight and achieve higher peak surface tempera-tures than at lower obliquities. Under these circumstances, thetropical regions of the planet serve as the atmospheric “coldtrap,” with the corresponding migration of surface ice fromthe poles to the more stable equatorial region [Mischnaet al., 2003]. As we have seen in the previous section, it isthe high northern latitudes that generally receive the greatestdifferential warming at present obliquity. It is worth investi-gating, then, what additional effect to localized warmingmay be contributed by a shift in obliquity.[44] At first glance, it is clear that greater insolation at high
obliquity will lead to warmer surface temperatures in thepolar regions during the summer months. Additionally, theincreased sublimation of surface ice at the poles will contributea greater amount of water vapor to the atmosphere, increasingthe warming effect. Conversely, at low obliquity, the polesremain in perpetual twilight or darkness and cold trap bothatmospheric water and CO2. Figure 9 shows the annuallyaveraged temperatures for an atmosphere at (a) 5�, (b) 15�,(c) 25�, (d) 45�, and (e) 60� obliquity, with SO2 and a standardwater cycle—all other model parameters are identical to thoseillustrated previously. Globally averaged surface tempera-tures are little changed through the obliquity cycle, as themean distance to the Sun has not changed—this is expected.
MISCHNA ET AL.: OBLIQUITY/TRACE GAS GREENHOUSES ON MARS
569
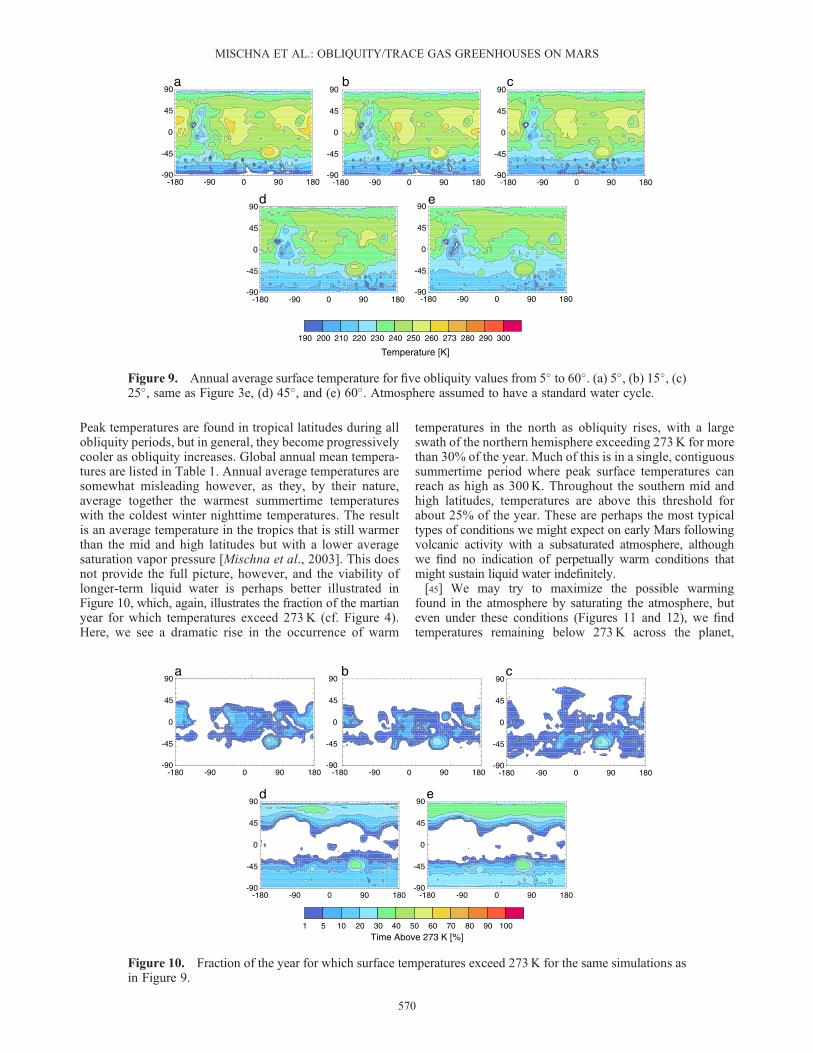
Peak temperatures are found in tropical latitudes during allobliquity periods, but in general, they become progressivelycooler as obliquity increases. Global annual mean tempera-tures are listed in Table 1. Annual average temperatures aresomewhat misleading however, as they, by their nature,average together the warmest summertime temperatureswith the coldest winter nighttime temperatures. The resultis an average temperature in the tropics that is still warmerthan the mid and high latitudes but with a lower averagesaturation vapor pressure [Mischna et al., 2003]. This doesnot provide the full picture, however, and the viability oflonger-term liquid water is perhaps better illustrated inFigure 10, which, again, illustrates the fraction of the martianyear for which temperatures exceed 273 K (cf. Figure 4).Here, we see a dramatic rise in the occurrence of warm
temperatures in the north as obliquity rises, with a largeswath of the northern hemisphere exceeding 273K for morethan 30% of the year. Much of this is in a single, contiguoussummertime period where peak surface temperatures canreach as high as 300K. Throughout the southern mid andhigh latitudes, temperatures are above this threshold forabout 25% of the year. These are perhaps the most typicaltypes of conditions we might expect on early Mars followingvolcanic activity with a subsaturated atmosphere, althoughwe find no indication of perpetually warm conditions thatmight sustain liquid water indefinitely.[45] We may try to maximize the possible warming
found in the atmosphere by saturating the atmosphere, buteven under these conditions (Figures 11 and 12), we findtemperatures remaining below 273K across the planet,
190 200 210 220 230 240 250 260 273 280 290 300
0
45
90
-45
-90-180 -90 0 90 180
0
45
90
-45
-90-180 -90 0 90 180
0
45
90
-45
-90-180 -90 0 90 180
0
45
90
-45
-90-180 -90 0 90 180
0
45
90
-45
-90-180 -90 0 90 180
Temperature [K]
a b
d e
c
Figure 9. Annual average surface temperature for five obliquity values from 5� to 60�. (a) 5�, (b) 15�, (c)25�, same as Figure 3e, (d) 45�, and (e) 60�. Atmosphere assumed to have a standard water cycle.
1 5 10 20 30 40 50 60 70 80 90 100
0
45
90
-45
-90-180 -90 0 90 180
0
45
90
-45
-90-180 -90 0 90 180
0
45
90
-45
-90-180 -90 0 90 180
0
45
90
-45
-90-180 -90 0 90 180
0
45
90
-45
-90-180 -90 0 90 180
Time Above 273 K [%]
a b c
d e
Figure 10. Fraction of the year for which surface temperatures exceed 273K for the same simulations asin Figure 9.
MISCHNA ET AL.: OBLIQUITY/TRACE GAS GREENHOUSES ON MARS
570
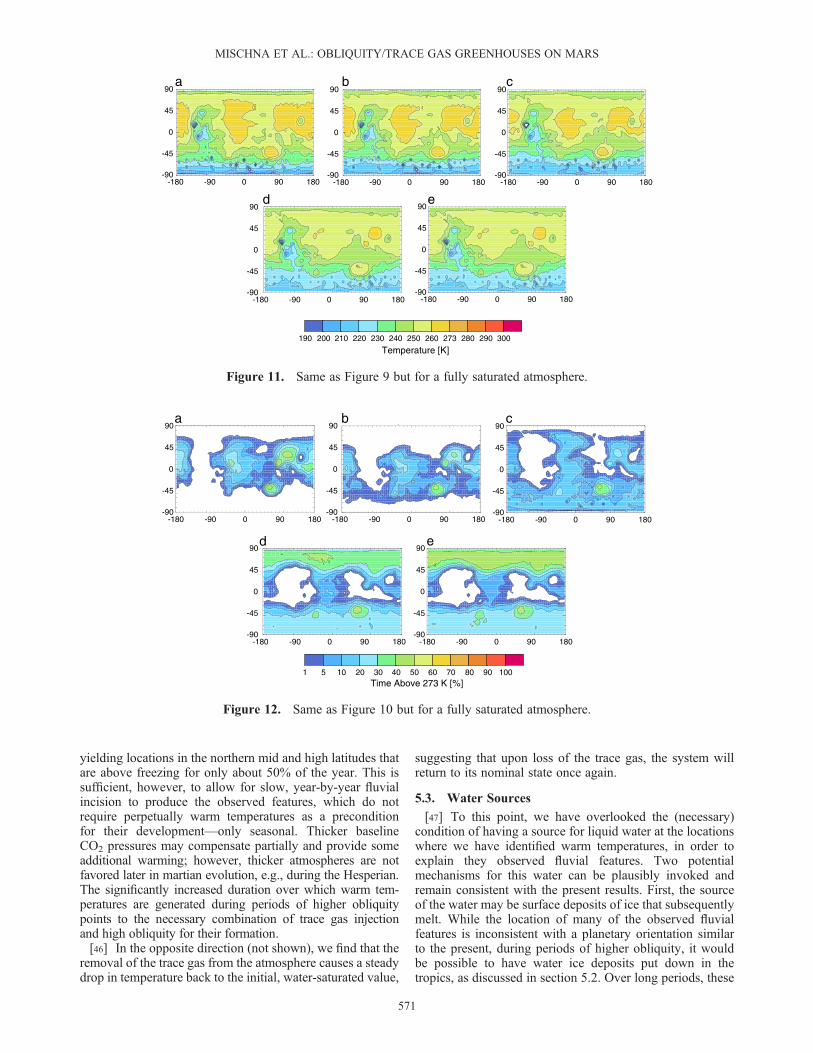
yielding locations in the northern mid and high latitudes thatare above freezing for only about 50% of the year. This issufficient, however, to allow for slow, year-by-year fluvialincision to produce the observed features, which do notrequire perpetually warm temperatures as a preconditionfor their development—only seasonal. Thicker baselineCO2 pressures may compensate partially and provide someadditional warming; however, thicker atmospheres are notfavored later in martian evolution, e.g., during the Hesperian.The significantly increased duration over which warm tem-peratures are generated during periods of higher obliquitypoints to the necessary combination of trace gas injectionand high obliquity for their formation.[46] In the opposite direction (not shown), we find that the
removal of the trace gas from the atmosphere causes a steadydrop in temperature back to the initial, water-saturated value,
suggesting that upon loss of the trace gas, the system willreturn to its nominal state once again.
5.3. Water Sources
[47] To this point, we have overlooked the (necessary)condition of having a source for liquid water at the locationswhere we have identified warm temperatures, in order toexplain they observed fluvial features. Two potentialmechanisms for this water can be plausibly invoked andremain consistent with the present results. First, the sourceof the water may be surface deposits of ice that subsequentlymelt. While the location of many of the observed fluvialfeatures is inconsistent with a planetary orientation similarto the present, during periods of higher obliquity, it wouldbe possible to have water ice deposits put down in thetropics, as discussed in section 5.2. Over long periods, these
190 200 210 220 230 240 250 260 273 280 290 300
0
45
90
-45
-90-180 -90 0 90 180
0
45
90
-45
-90-180 -90 0 90 180
0
45
90
-45
-90-180 -90 0 90 180
0
45
90
-45
-90-180 -90 0 90 180
0
45
90
-45
-90-180 -90 0 90 180
Temperature [K]
a b c
d e
Figure 11. Same as Figure 9 but for a fully saturated atmosphere.
1 5 10 20 30 40 50 60 70 80 90 100
0
45
90
-45
-90-180 -90 0 90 180
0
45
90
-45
-90-180 -90 0 90 180
0
45
90
-45
-90-180 -90 0 90 180
0
45
90
-45
-90-180 -90 0 90 180
0
45
90
-45
-90-180 -90 0 90 180
Time Above 273 K [%]
a b c
d e
Figure 12. Same as Figure 10 but for a fully saturated atmosphere.
MISCHNA ET AL.: OBLIQUITY/TRACE GAS GREENHOUSES ON MARS
571
deposits could become substantially thick, possibly provid-ing a periodic source for meltwater during the lowerobliquity phases. During a subsequent obliquity excursion,the process would repeat, consistent with the complex his-tory observed in the bedrock, which appears to require mul-tiple episodes of erosion and incision to form terraced andlayered deposits. Fluvial systems are much more widespreadacross the ancient highlands and crust than those originallyobserved by Viking, and the locations of warm temperaturesthat are found in Figures 9–12 are consistent with some butnot all of the fluvial features observed at the surface; thus,we cannot conclusively dismiss or accept that meltwater isthe sole mechanism for establishing liquid surface water.[48] The second source of the water may arise from
the subsurface as a result of large-scale, periodic volcanicactivity. The originating phase of this water, then, wouldbe liquid, leading to a different evolutionary development.This mechanism is consistent with the MEGAOUTFLOhypothesis discussed in section 2.2 and the periodic, obliq-uity-regulated warming episodes we observe in our simula-tions. Under MEGAOUTFLO, the “initial state” for theperturbed surface environment can begin with a substantialamount of liquid water rather than smaller trickles of surfacemelt. The subsequent greenhouse conditions produced bythe elevated levels of volcanic gases (H2O and trace gasesincluded) would be able to sustain this liquid water for atleast some time. This introduces a mechanism by whichliquid water is made available to the surface—one that doesnot strictly require warm temperatures but, given such, canbenefit by remaining liquid for extended periods, even throughcold seasons when meltwater would not be produced.
5.4. Surface Properties
[49] The question of surface temperatures able to supportliquid water (i.e., T roughly equal to or above 273K) is,as we have seen, critically dependent on the amount ofgreenhouse warming, but it is also strongly controlled bythe radiative properties of the surface itself. This latter pointhas thus far received much less attention than accordedto other forcing factors. The current albedo of Mars is deter-mined by the local, relatively bright, dust cover fraction overa much darker (largely basaltic) surface. Dust cover lifts thealbedo to about 0.25–0.35 whereas surface albedo can fallbelow 0.15 for minimally dusty regions. The presence of anydark material on the surface, such as unweathered basalt, oreven liquid water can result in even lower surface albedos—open water on Earth exhibits an albedo as low as 8%.[50] We cannot say with conviction what the surface prop-
erties of early Mars were, nor is it clear what the long-termweathering profile of the exposed surface material was.Certainly, it is plausible that aeolian erosion has been a con-sistent player on Mars since its earliest days, leading to dusty(and, by extension, bright) conditions since the Noachian.However, it is at least equally plausible that on early Mars,with a warmer, thicker, potentially more humid atmosphereand a shorter geologic period over which aeolian erosionwould have taken place, the surface was less physicallyweathered with a brightness significantly lower than thepresent day. Further, the level of chemical weathering ofsurface basalt is uncertain on earlyMars. Chemical weatheringof basalt tends to form palagonite, clays, zeolites, and otheramorphous forms in addition to iron oxides (e.g., hematite),
which tend to appear brighter than the source material.However, in the absence of an oxidizing atmosphere, oxida-tive weathering will be suppressed, and the formation of manyforms of bright material will be minimized. While MeridianiPlanum shows widespread formation of hematite dated to theNoachian/Hesperian boundary, no widespread evidence ofiron oxides has been found inmore ancient, Noachian, terrains.[51] To test the sensitivity to surface properties, particularly
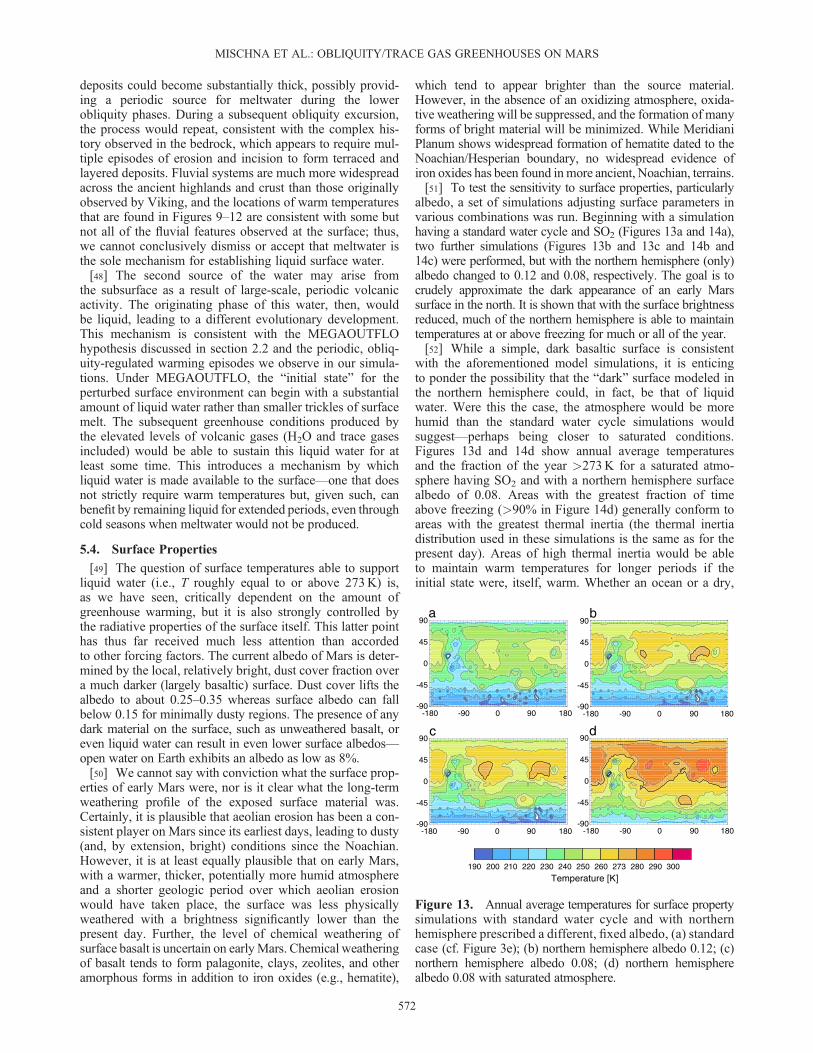
albedo, a set of simulations adjusting surface parameters invarious combinations was run. Beginning with a simulationhaving a standard water cycle and SO2 (Figures 13a and 14a),two further simulations (Figures 13b and 13c and 14b and14c) were performed, but with the northern hemisphere (only)albedo changed to 0.12 and 0.08, respectively. The goal is tocrudely approximate the dark appearance of an early Marssurface in the north. It is shown that with the surface brightnessreduced, much of the northern hemisphere is able to maintaintemperatures at or above freezing for much or all of the year.[52] While a simple, dark basaltic surface is consistent
with the aforementioned model simulations, it is enticingto ponder the possibility that the “dark” surface modeled inthe northern hemisphere could, in fact, be that of liquidwater. Were this the case, the atmosphere would be morehumid than the standard water cycle simulations wouldsuggest—perhaps being closer to saturated conditions.Figures 13d and 14d show annual average temperaturesand the fraction of the year >273K for a saturated atmo-sphere having SO2 and with a northern hemisphere surfacealbedo of 0.08. Areas with the greatest fraction of timeabove freezing (>90% in Figure 14d) generally conform toareas with the greatest thermal inertia (the thermal inertiadistribution used in these simulations is the same as for thepresent day). Areas of high thermal inertia would be ableto maintain warm temperatures for longer periods if theinitial state were, itself, warm. Whether an ocean or a dry,
0
45
90
-45
-90-180 -90 0 90 180
0
45
90
-45
-90-180 -90 0 90 180
0
45
90
-45
-90-180 -90 0 90 180
0
45
90
-45
-90-180 -90 0 90 180
190 200 210 220 230 240 250 260 273 280 290 300
Temperature [K]
a b
c d
Figure 13. Annual average temperatures for surface propertysimulations with standard water cycle and with northernhemisphere prescribed a different, fixed albedo, (a) standardcase (cf. Figure 3e); (b) northern hemisphere albedo 0.12; (c)northern hemisphere albedo 0.08; (d) northern hemispherealbedo 0.08 with saturated atmosphere.
MISCHNA ET AL.: OBLIQUITY/TRACE GAS GREENHOUSES ON MARS
572

dark surface, the argument remains the same, although forthe former, the presence of a phase-changing substance doespresent some additional complexities.[53] It has recently been recognized that the geomorphology
of valley networks in the southern Mars highlands impliessignificant episodes of rainfall for their genesis [Craddockand Howard, 2002; Barnhart et al., 2009; Hoke et al.,2011]. Moreover, much of the network development occurredduring a relatively brief episode of martian history around thetime of the Noachian/Hesperian boundary [Howard et al.,2005; Irwin et al., 2005; Mangold et al., 2012].[54] It is also observed that the spatial distribution of the valley
networks is not uniform, as might be expected if, for example,impacts into the southern highlands were responsible forepisodic formation of the networks [Toon et al., 2010].Instead, the distribution is consistent with what would beexpected for a precipitation source associated with a northernplains ocean [Luo and Stepinski, 2009; Stepinski and Luo, 2010].This relationship of valleys to the margins of the northern edgeof the heavily cratered terrain of the southern highlands hasbeen confirmed by an independent study that quantified thespatial distribution of drainage densities [Hynek et al., 2010].The distribution also corresponds to the locations of deltas thatare graded to the base level of a northern plains ocean[DiAchille and Hynek, 2010], to the concentrations of sedimen-tary rocks on Mars [Malin and Edgett, 2000; Delano andHynek, 2011], and to the presence of high-Al clay minerals indeep weathering profiles [Le Deit et al., 2012; Loizeau et al.,2012]. The latter would require intense leaching in a surficialenvironment for their formation. Moreover, such a leachingepisode would occur at the Noachian/Hesperian boundary[Loizeau et al., 2012], corresponding to the same episodeof precipitation recognized in regard to the valley networks.[55] Fairén et al. [2012] have explored the ramifications
of a dark, near-global surface ocean on early Mars with a0-D energy balance model derived from the work ofWilliams and Kasting [1997]. Their conclusions indicate thatit becomes difficult to obtain warm (>273K) global tempera-tures for all but the most globally ocean-covered scenarios,
even with a 3 bar CO2 atmosphere. For most situations, globaltemperatures remain below freezing. To this end, our modelagrees with their findings, as our global temperatures do notever exceed 273K (Table 1), and even with a dark, globalocean and a 3 bar CO2 atmosphere (not shown), our glob-ally, annually averaged temperatures never exceed 243 K(cf. 228.8 K at 500mb); however, as we have noted, thisdoes not preclude the possibility of periodic and localizedwarm conditions, which appear widespread in our 3-Dmodel and which cannot be reproduced in an energy balancemodel. There are multiple reasons that the ability to obtainwarm conditions appears not to be as dire as suggested byFairén et al. [2012] and by the global average values inour model. First, in the aforementioned study, heat transportis modeled with a simplified diffusion parameterization,which neglects the true atmospheric circulation, which wefind important. Second, the Fairén et al. [2012] radiativetransfer scheme neglects the important radiative heatingfrom SO2 or other trace gases, which, as we find, contributesnon-negligible warming to the atmosphere.[56] In summary, surface albedo and thermal inertia are
crucial, but largely overlooked, aspects of ancient martianclimate. Simple calculations suggest the plausibility of adark, high thermal inertia surface sustaining warm tempera-tures for prolonged periods. There may be multiple originsof this putative dark surface, and we have presentedevidence that suggests that large surface water deposits,potentially emplaced during warmer phases in martianhistory, are not inconsistent with the amount of warmingobserved in our climate model studies nor is the presenceof large deposits of unweathered, dry, basaltic material.Further work is needed, but any declaration of Mars beingcold and dry on the basis of climate model results alone isprobably premature.
6. Discussion
[57] The results shown here contrast strongly with recentresults from Johnson et al. [2008] and do not showwidespreadglobal warming introduced by the presence of water vapor andSO2 in the martian atmosphere. Rather, such warming may befound in localized environments for relatively short periods oftime. Nevertheless, the behavior of the climate system isconsistent with one for which the water cycle is influencedby the orbital cycles of the planet. We specifically note twothings. First, the water cycle has a markedly different naturebetween low and high obliquities, as expected. As obliquitydecreases, the level of atmospheric water vapor drops precipi-tously, and the atmosphere is incapable of sustaining warmtemperatures in all but the most limited tropical regions forthe shortest of periods. In brief, we cannot expect conditionsconducive to stable liquid water anywhere, even in thepresence of IR-active trace gases such as SO2.[58] Second, we note that the role of a trace gas “trigger”
is a necessary component of this model, without which, thesystem never gets sufficiently warm to initiate widespreadsublimation from the extant polar caps (or surface liquidwater reservoirs). As obliquity rises (Figure 14), and theatmosphere becomes more humid, temperatures will riseglobally. In the absence of other trace gases, the warminginfluence of water vapor alone is quite moderate and thesurface rarely exceeds the 273K threshold. More specifically,
0
45
90
-45
-90-180 -90 0 90 180
0
45
90
-45
-90-180 -90 0 90 180
1 5 10 20 30 40 50 60 70 80 90 100
0
45
90
-45
-90-180 -90 0 90 180
0
45
90
-45
-90-180 -90 0 90 180
Time Above 273 K [%]
a b
c d
Figure 14. Same conditions as Figure 13 but for fraction ofyear with temperatures >273K.
MISCHNA ET AL.: OBLIQUITY/TRACE GAS GREENHOUSES ON MARS
573
even in those circumstances when it does, there will be insuf-ficient water vapor in the atmosphere to produce a greenhouseeffect large enough to maintain warm temperatures throughthe diurnal cycle. Nighttime temperatures are cool, and muchof the daytime water vapor is lost, reducing the greenhousewarming even further.[59] Conversely, in the presence of a trace gas such as
SO2, the overall warming, particularly in the warmest loca-tions, is elevated to a point where even during the nighttimehours, it may remain high enough to support elevated levelsof water vapor, and the warm temperatures are maintainedthroughout the day. Thus, it seems that three components arenecessary to invoke a global climate conducive to large-scalewarmth—volcanic activity that releases an IR-active tracegas such as SO2, a significantly humid atmosphere to provideample warming, and high obliquity to enable periods oflong-term warming.[60] The idea of a darker surface is an interesting one that
deserves future study. Our initial simulations reveal signifi-cant warming with the presence of a darker surface globally.It seems necessary in our modeling system to decreasethe planetary albedo in order to obtain perpetually warmtemperatures in this greenhouse atmosphere. As mentionedpreviously, the same general conditions can be reached byinvoking a dark liquid water ocean or by assuming thewidespread presence of low-albedo rock. The ubiquitouspresence of Fe-oxide-bearing dust on the surface of Marsis likely an evolving feature, and in Mars’ early history,there may have been significantly less dust on the surfacedue to a reduced period in which such fine-grained, brightmaterial could have accumulated. Further, in a more humidenvironment, the accumulation and aeolian transport ofunconsolidated dust would likely be less due to greaterprecipitation, increased cementation of dust, and sedimenta-tion within any bodies of standing water. Or, more simplyput, dust and other fine-grained materials may have had agreater probability of becoming part of the rock record asopposed to remaining as unconsolidated sediment.[61] In conclusion, it seems difficult to generate widespread
surface warming in a CO2+H2O+SO2 atmosphere of anyplausible composition, although seasonal warming is foundacross much of the surface, for at least brief periods, and insome locations for a significant fraction of the Mars year.Warm conditions can be further enhanced by the presence ofa darker surface than the present day. Such periodic warmingis, as we have discussed in section 2, wholly consistent withboth the geochemical [Milliken et al., 2008] and geomorpho-logical [Mangold et al., 2004, 2008] record during theHesperian, which indicates only periodic, but not perpetual,warming. Changes in obliquity do provide modest changesin the likelihood of surface water due in large part to theincrease in water vapor content introduced by the exposureof the polar caps. This warming is triggered by the presenceof a trace gas such as SO2 and modulated by the oscillationsin the obliquity cycle. In the absence of any of these threecomponents (available water vapor, trace gas trigger, and highobliquity), the cycle does not perpetuate. We have intention-ally neglected some significant negative feedbackmechanismsin the present work—most specifically the existence of waterclouds and sulfur aerosols in the atmosphere—both of whichmay have a significant cooling effect on overall climate. Thedifficulty with which warm conditions are obtained under
the more “standard” simulations without any such coolingeffects makes the likelihood of obtaining surface water evermore challenging if such factors are incorporated. In thisway, our simulations provide perhaps very optimistic esti-mates for the plausibility of liquid water on Mars. Futurework should continue to examine the role of atmosphericclouds and aerosols and more deeply explore the possiblerole of a northern ocean on early Mars.
[62] Acknowledgments. Resources supporting this work wereprovided by the NASA High-End Computing Program through the NASAAdvanced Supercomputing Division at Ames Research Center as well asfrom the JPL Office of the Chief Information Officer. MAM, VB, RM,and CL were supported by a NASA Mars Fundamental Research Programgrant NNH10ZDA001N to JPL. Additional support for CL and MIR wasprovided by a NASA Planetary Atmospheres grant NNX10AB42G toAshima Research. Part of this research was carried out at the Jet PropulsionLaboratory, California Institute of Technology, under a contract with theNational Aeronautics and Space Administration.
ReferencesBaker, V. R. (2001), Water and the martian landscape, Nature, 412, 228–236.Baker, V. R. (2009), Megafloods and global paleoenvironmental change onMars and Earth, in Preservation of Random Megascale Events onMars and Earth: Influence on Geologic History, Geological Society ofAmerica Special Paper 453, edited by M. G. Chapman, and L. Keszthelyi,pp. 25–36, doi:10.1130/2009.453(03).
Baker, V. R., and J. Partridge (1986), Small martian valleys: Pristine anddegraded morphology, J. Geophys. Res., 91, 3561–3572.
Baker, V. R., R. G. Strom, V. C. Gulick, J. S. Kargel, G. Komatsu, andV. S. Kale (1991), Ancient oceans, ice sheets and hydrological cycle onMars, Nature, 352, 589–594.
Barnhart, C. J., A. D. Howard, and J. M. Moore (2009), Long-term precip-itation and late-stage valley network formation: Landform simulationsof Parana Basin, Mars, J. Geophys. Res., 114, E01003, doi:10.1029/2008JE003122.
Bibring, J.-P., et al. (2006), Global mineralogical and aqueous Mars historyderived from OMEGA/Mars Express data, Science, 312, 400–404.
Bradley, B. A., S. E. H. Sakimoto, H. Frey, and J. R. Zimbelman (2002),Medusa Fossae Formation: New perspectives from Mars Global Sur-veyor, J. Geophys. Res., 107, doi:10.1029/2001JE001537.
Carr,M.H. (1996),Water onMars, 229pp., OxfordUniversity Press, NewYork.Carter, J., F. Poulet, J.-P. Bibring, and S. Murchie (2010), Detection ofhydrated silicates in crustal outcrops in the northern plains of Mars,Science, 328, 1682–1686.
Christensen, P. R. (2003), Formation of recent martian gullies throughmelting of extensive water-rich snow deposits, Nature, 422, 45–58.
Christensen, P. R., et al. (2001), Mars Global Surveyor Thermal EmissionSpectrometer experiment: Investigation description and surface scienceresults, J. Geophys. Res., 106, 23,823–23,871.
Clark, B. C., and D. C. Van Hart (1981), The salts of Mars, Icarus, 45,370–378.
Clifford, S. M., and T. J. Parker (2001), The evolution of the martian hydro-sphere: Implications for the fate of a primordial ocean and the currentstate of the northern plains. Icarus, 154, 40–79.
Craddock, R. A., and A. D. Howard (2002), The case for rainfall on awarm, wet early Mars, J. Geophys. Res., 107(E11), 5111, doi:10.1029/2001JE001505.
Delano, K., and B. M. Hynek (2011), Intracrater layered deposits supportancient ocean on Mars, 42nd Lunar and Planetary Science Conference,held March 7–11, 2011 at The Woodlands, Texas. LPI ContributionNo. 1608, 2636 pp.
DiAchille, G., and B. M. Hynek (2010), Ancient ocean on Mars supportedby global distribution of deltas and valleys, Nat. Geosci., 3, 459–463.
Edwards, J. M., and A. Slingo (1996), Studies with a flexible new radiationcode, I: Choosing a configuration for a large-scale model, Quart. J. R.Meteorol. Soc., 122, 689–719.
Ehlmann, B. L., J. F. Mustard, S. L. Murchie, J.-P. Bibring, A. Meunier, A.A. Fraeman, Y. Langevin (2011), Subsurface water and clay mineralformation during the early history of Mars, Nature, 479, 53–60.
Fairén, A. G., J. D. Haqq-Misra, and C. P. McKay (2012), Reduced albedoon early Mars does not solve the climate paradox under a faint young Sun.Astron. Astrophys., 540, doi:10.1051/0004-6361/201118527.
Forget, F., and R. T. Pierrehumbert (1997), Warming early Mars withcarbon dioxide clouds that scatter infrared radiation, Science, 278,1273–1276.
MISCHNA ET AL.: OBLIQUITY/TRACE GAS GREENHOUSES ON MARS
574
Forget, F., R. M. Haberle, F. Montmessin, B. Levrard, and J. W. Head(2006), Formation of glaciers on Mars by atmospheric precipitation athigh obliquity, Science, 311, 368–371.
Forget, F., R. Wordsworth, E. Millour, J.-B. Madeleine, L. Kerber, J. Leconte,E. Marcq, and R. M. Haberle (2013), 3D modeling of the early martianclimate under a denser CO2 atmosphere: Temperatures and CO2 ice clouds,Icarus, 222, 81–99.
Fu, Q., and K. N. Liou (1992), On the correlated k-distribution method forradiative transfer in nonhomogeneous atmospheres, J. Atmos. Sci., 49,2139–2156.
Gough, D. O. (1981), Solar interior structure and luminosity variations,Solar Phys., 74, 21–34.
Gulick, V. (2001), Origin of the valley networks on Mars: A hydrologicalperspective, Geomorphology, 37, 241–268.
Guo, X., W. G. Lawson, M. I. Richardson, and A. Toigo (2009), Fitting theVikig lander surface pressure cycle with a Mars General CirculationModel, J. Geophys. Res., 114, E07006, doi:10.1029/2008JE003302.
Haberle, R. M., J. R. Murphy, and J. Schaeffer (2003), Orbital changeexperiments with a Mars general circulation model, Icarus, 161, 66–89.
Halevy, I., M. T. Zuber, and D. P. Schrag (2007), A sulfur dioxide climatefeedback on early Mars, Science, 318, 1903–1907.
Halevy, I., R. T. Pierrehumbert, and D. P. Schrag (2009), Radiativetransfer in CO2-rich paleoatmospheres, J. Geophys. Res., 114, D18112,doi:10.1029/2009JD011915.
Halevy, I., W. W. Fischer, and J. M. Eiler (2011), Carbonates in the martianmeteorite Allan Hills 84001 formed at 18� 4 �C in a near-surface aqueousenvironment, Proc. Nat. Acad. Sci., 108, doi:10.1073/pnas.1109444108.
Head, J. W., J. F. Mustard, M. A. Kreslavsky, R. E. Milliken, and D. R.Marchant (2003), Recent ice ages on Mars, Nature, 426, 797–802.
Head, J. W., et al. (2005), Tropical to mid-latitude snow and ice accumula-tion, flow and glaciation on Mars, Nature, 434, 346–351.
Hecht, M. H., et al. (2009), Detection of perchlorate and the soluble chemistryof martian soil at the Phoenix landing site, Science, 325, 64–67.
Hoke, M. R. T., and B. M. Hynek (2009), Roaming zones of precipitationon ancient Mars as recorded in valley networks, J. Geophys. Res., 114(E08002), doi:10.1029/2008JE003247.
Hoke, M. R. T., G. Tucker, and B. M. Hynek (2011), Formation timescalesof large Martian valley networks, Earth Planet. Sci. Lett., 312, 1–12.
Howard, A. D., J. M. Moore, and R. P. Irwin, III (2005), An intenseterminal epoch of widespread fluvial activity on early Mars: 1. Valleynetwork incision and associated deposits, J. Geophys. Res., 110, E12S14,doi:10.1029/2005JE002459.
Hynek, B. M., M. Beach, and M. R. T. Hoke (2010), Updated global map ofMartian valley networks and implications for climate and hydrologicprocesses. J. Geophys. Res., 115, E09008, doi:10.1029/2009JE003548.
Irwin, R. P. III, A. D. Howard, R. A. Craddock, and J. M. Moore (2005), Anintense terminal epoch of widespread fluvial activity on early Mars: 2.Increased runoff and paleolake development, J. Geophys. Res. 110,E12S15, doi:10.1029/2005JE002460.
Jakosky, B. M., and M. H. Carr (1985), Possible precipitation of ice at lowlatitudes of Mars during periods of high obliquity, Nature, 315, 559–561.
Johnson, S. S., M. A. Mischna, T. L. Grove, and M. T. Zuber (2008),Sulfur-induced greenhouse warming on early Mars, J. Geophys. Res.,113, E08005, doi:10.1029/ 2007JE002962.
Johnson, S. S., A. A. Pavlov, and M. A. Mischna (2009), Fate of SO2 in theancient martian atmosphere: Implications for transient greenhousewarming, J. Geophys. Res., 114, E11011, doi:10.1029/2008JE003313.
Kasting, J. F. (1982), Stability of ammonia in the primitive terrestrialatmosphere, J. Geophys. Res., 87, 3091–3098.
Kasting, J. F. (1991), CO2 condensation and the climate of early Mars,Icarus, 94, 1–13.
King, P. L., and S. M. McLennan (2010), Sulfur on Mars, Elements, 6,doi:10.2113/gselements.6.2.107.
Kuhn, W. R., and S. K. Atreya (1979), Ammonia photolysis and the green-house effect in the primordial atmosphere of the Earth, Icarus, 37, 207–213.
Lacis, A. A., and V. Oinas (1991), A description of the correlated k-distribution method for modeling nongray gaseous absorption, thermalemission, and multiple scattering in vertically inhomogeneous atmo-spheres, J. Geophys. Res., 96, 9027–9074.
Laskar, J., M. Gastineau, F. Joutel, P. Robutel, B. Levrard, and A. Correia(2004), Long term evolution and chaotic diffusion of the insolation quan-tities of Mars, Icarus, 170, 343–364.
Le Deit, L., J. Flahaut, C. Quantin, E. Hauber, D. Mège, O. Bourgeois,J. Gurgurewicz, M. Massé, and R. Jaumann (2012), Extensive surfacepedogenic alteration of the Martian Noachian crust suggested by plateauphyllosilicates around Valles Marineris, J. Geophys. Res., 117, E00J05,doi:10.1029/2011JE003983.
Limaye, A., O. Aharonson, and J. T. Perron (2012), Detailed stratigraphyand bed thickness of the Mars north and south polar layered deposits,J. Geophys. Res., 117, E06009.
Loizeau, D., S. C. Werner, N. Mangold, J.-P. Bibring, and J. L. Vago(2012), Chronology of deposition and alteration in the Mawrth Vallisregion, Mars, Planet. Space Sci., doi:10.1016/j.pss.2012.06.023.
Luo, W., and T. F. Stepinski (2009), Computer-generated global map ofvalley networks on Mars, J. Geophys. Res., 114, E11010, doi:10.1029/2009JE003357.
Malin, M. C., and K. S. Edgett (2000), Sedimentary rocks of early Mars,Science, 290, 1927–1937.
Mangold, N., C. Quantin, V. Ansan, C. Delacourt, and P. Allemand (2004),Evidence for precipitation on Mars from dendritic valleys in the VallesMarineris area, Science, 305, 78–81.
Mangold, N., V. Ansan, P. Masson, C. Quantin, and G. Neukum (2008),Geomorphic study of fluvial landforms on the northern Valles Marinerisplateau. Mars, J. Geophys. Res., 113, E08009.
Mangold, N., S. Adeli, S. Conway, V. Ansan, and B. Langlais (2012), Achronology of early Mars climatic evolution from impact crater degrada-tion, J. Geophys. Res., 117, E04003, doi:10.1029/2011JE004005.
McLennan, S. M., and J. P. Grotzinger (2008), The sedimentary rock cycleof Mars, in The Martian Surface – Composition, Mineralogy, and Physi-cal Properties, edited by J. F. Bell, pp. 541–577, Cambridge UniversityPress, Cambridge.
Michalakes, J., J. Dudhia, D. Gill, T. Henderson, J. Klemp, W. Skamarock,and W. Wang (2004), The weather research and forecast model: Softwarearchitecture and performance, in Proceedings of the 11th ECMWFWork-shop on the Use of High Performance Computing In Meteorology, editedby G. Mozdzynski, pp. 156–168, Eur. Cent. for Medium-Range WeatherForecasts, Reading, U.K.
Milkovich, S. M., and J. W. Head, III (2005), North polar cap of Mars: Polarlayered deposit characterization and identification of a fundamental climatesignal, J. Geophys. Res., 110, E01005, doi:10.1029/2004JE002349.
Milliken, R. E., et al. (2008), Opaline silica in young deposits on Mars,Geology, 36, 847–850.
Milliken, R. E., J. F. Mustard, and D. L. Goldsby (2003), Viscous flowfeatures on the surface of Mars: Observations from high-resolution MarsOrbiter Camera (MOC) images, J. Geophys. Res., 108(E6), doi:10.1029/2002JE002005.
Mischna, M. A., J. F. Kasting, A. Pavlov, and R. Freedman (2000), Influ-ence of carbon dioxide clouds on early martian climate, Icarus, 145,546–554.
Mischna, M. A., M. I. Richardson, R. J. Wilson, and D. J. McCleese (2003),On the orbital forcing of Martian water and CO2 cycles: A generalcirculation model study with simplified volatile schemes, J. Geophys.Res., 108(E6), 5062, doi:10.1029/ 2003JE002051.
Mischna, M. A., and M. I. Richardson (2005), A reanalysis of waterabundances in the martian atmosphere at high obliquity, Geophys. Res.Lett., 32, L03201, doi:10.1029/2004GL021865.
Mischna, M. A., C. Lee, and M. I. Richardson (2012), Development of afast, accurate radiative transfer model for the martian atmosphere, pastand present, J. Geophys. Res., 117, E10009, doi:10.1029/2012JE004110.
Mustard, J. F., C. D. Cooper, and M. K. Rifkin (2001), Evidence for recentclimate change on Mars from the identification of youthful near-surfaceground ice, Nature, 412, 411–414.
Neukum, G., et al. (2004), Recent and episodic volcanic and glacial activityon Mars revealed by the High Resolution Stereo Camera, Nature, 432,971–979.
Plaut, J. J., A. Safaeinili, J. W. Holt, R. J. Phillips, J. W. Head, R. Seu, N. E.Putzig, and A. Frigeri (2009), Radar evidence for ice in lobate debrisaprons in the mid-northern latitudes of Mars, Geophys. Res. Lett. 36,L02203, doi:10.1029/2008GL036379.
Pollack, J. B., J. F. Kasting, S. M. Richardson, and K. Poliakoff (1987), Thecase for a warm wet climate on early Mars, Icarus, 71, 203–224.
Postawko, S. E., andW. R. Kuhn (1986), Effect of the greenhouse gases (CO2,H2O, SO2) on martian paleoclimate, J. Geophys. Res., 91, D431–D438.
Poulet, F., J.-P. Bibring, J. F. Mustard, A. Gendrin, N. Mangold, Y.Langevin, R. E. Arvidson, B. Gondet, C. Gomez, and the OMEGA Team(2005), Phyllosilicates on Mars and implications for early martianclimate, Nature, 438, 623–627.
Putzig, N. E., M. T. Mellon, K. A. Kretke, and R. E. Arvidson (2005),Global thermal inertia and surface properties of Mars from the MGSmapping mission, Icarus, 173, 325–341.
Richardson, M. I., A. D. Toigo, and C. E. Newman (2007), PlanetWRF: Ageneral purpose, local to global numerical model for planetary atmo-spheric and climate dynamics, J. Geophys. Res., 112, E09001,doi:10.1029/2006JE002825.
Sackmann, I. J., and A. I. Boothroyd (2003), Our Sun. V. A bright youngSun consistent with helioseismology and warm temperatures on ancientEarth and Mars, Ap. J., 583, 1024–1039.
Sagan, C., and C. Chyba (1997), The early faint Sun paradox:Organic shielding of ultraviolet-labile greenhouse gases, Science,276, 1217–1221.
MISCHNA ET AL.: OBLIQUITY/TRACE GAS GREENHOUSES ON MARS
575
Segura, T. L., O. B. Toon, A. Colaprete, and K. Zahnle (2002),Environmental effects of large impacts on Mars, Science, 298,1977–1980.
Segura, T. L., O. B. Toon, and A. Colaprete (2008), Modeling theenvironmental effects of moderate-sized impacts on Mars, J. Geophys.Res., 113, E11007, doi:10.1029/2008JE003147.
Skamarock, W. C., J. B. Klemp, J. Dudhia, D. O. Gill, D. M. Barker, W.Wang, and J. G. Powers (2005), A description of the Advanced ResearchWRF Version 2, NCAR Tech. Note 468+STR, Natl. Cent. for Atmos.Res., Boulder, Colo.
Skamarock, W. C., and J. B. Klemp (2008), A time-split nonhydrostatic at-mospheric model for weather research and forecasting applications,J. Comp. Phys., 227, 3465–3485.
Squyres, S. W., and J. F. Kasting (1994), Early Mars: How warm and howwet?, Science, 265, 744–749.
Stepinski, T. F., and W. Luo (2010), Global pattern of dissection on Marsand the northern ocean hypothesis, 41th Lunar and Planetary ScienceConference, The Woodlands, Texas, March 1–5, 2010. LPI ContributionNo. 1533, 1350 pp.
Tian, F., M. W. Claire, J. D. Haqq-Misra, M. Smith, D. C. Crisp, D. Catling,K. Zahnle, and J. F. Kasting (2010), Photochemical and climate
consequences of sulfur outgassing on early Mars, Earth Planet. Sci. Lett.,295, 412–418.
Toon, O. B., T. Segura, and K. Zahnle (2010), The formation of martianriver valleys by impacts, Ann. Rev. Earth Planet. Sci., 38, 303–322.
Tosca, N. J., and A. H. Knoll (2009), Juvenile chemical sediments and thelong term persistence of water at the surface of Mars, Earth Planet. Sci.Lett., 286, 379–386.
Werner, S. C. (2009), The global martian volcanic evolutionary history,Icarus, 201, 44–68.
Williams, D. M., and J. F. Kasting (1997), Habitable planets with highobliquities, Icarus, 129, 254–267.
Wilson, L., and J. W. Head, III (2002), Tharsis-radial graben systems as thesurface manifestation of plume-related dike intrusion complexes: Modelsand implications, J. Geophys. Res., 107, 5057, doi:10.1029/2001JE001593.
Wordsworth, R., F. Forget, and V. Eymet (2010), Infrared collision-inducedand far-line absorption in dense CO2 atmospheres, Icarus, 210, 992–997.
Wordsworth, R., F. Forget, E. Millour, J. W. Head, J.-B. Madeleine, and B.Charnay (2013), Global modeling of the early martian climate under adenser CO2 atmosphere: Water cycle and ice evolution, Icarus, 222, 1–19.
Yung, Y. L., H. Nair, and M. F. Gerstell (1997), CO2 greenhouse in the earlymartian atmosphere: SO2 inhibits condensation. Icarus, 130, 222–224.
MISCHNA ET AL.: OBLIQUITY/TRACE GAS GREENHOUSES ON MARS
576