effects of negative keying and wording in attitude
TRANSCRIPT
James Madison UniversityJMU Scholarly Commons
Dissertations The Graduate School
Spring 2013
Effects of negative keying and wording in attitudemeasures: A mixed-methods studyChris M. ColemanJames Madison University
Follow this and additional works at: https://commons.lib.jmu.edu/diss201019Part of the Psychology Commons
This Dissertation is brought to you for free and open access by the The Graduate School at JMU Scholarly Commons. It has been accepted for inclusionin Dissertations by an authorized administrator of JMU Scholarly Commons. For more information, please contact [email protected].
Recommended CitationColeman, Chris M., "Effects of negative keying and wording in attitude measures: A mixed-methods study" (2013). Dissertations. 73.https://commons.lib.jmu.edu/diss201019/73
Effects of Negative Keying and Wording in Attitude Measures:
A Mixed-Methods Study
Chris M. Coleman
A dissertation submitted to the Graduate Faculty of
JAMES MADISON UNIVERSITY
In
Partial Fulfillment of the Requirements
for the degree of
Doctor of Philosophy
Department of Graduate Psychology
May 2013
Acknowledgments
First and foremost, I would like to express my deep gratitude to Debbi Bandalos,
advisor extraordinaire. My doctoral journey began a long time ago, at a university far, far
away, when Debbi allowed me to sit in on her (crowded) introductory SEM class. In the
years since then, I have been privileged to benefit from her wisdom, knowledge,
encouragement, creativity, kindness, and sense of humor. I have also enjoyed spending
time with Sparky and Zoomie, who are wonderful therapists for students immersed in an
intensive graduate program. With regard to this dissertation, Debbi’s insight and
guidance have been invaluable.
Next, I wish to thank my committee members: Christine DeMars, Sara Finney,
and Dena Pastor. They have been instrumental in both the execution of the current project
and the completion of my doctoral studies. I consider myself extremely fortunate to have
had access to such phenomenal teachers and mentors, all of whom continue to be
exceptionally generous with their time, advice, and support. I am particularly grateful to
Dena, without whose help the collection of my dissertation data would simply not have
been possible. And I am forever in the debt of Sara, my amazing academic sister, whose
efforts on my behalf have far exceeded what any reasonable person could expect. She
made my transition to JMU a seamless one, cultivated wonderful externship and
internship opportunities, and contributed mightily to the quality of the current project.
Finally, I want to acknowledge the support that family and friends in many places
have provided during my seemingly never-ending academic career. There is neither time
nor space to list everyone who has helped me along the way, but to all of you I say:
Thank you! I promise I’m finished with school now.
ii
Preface
THE VOICE YOU HEAR WHEN YOU READ SILENTLY is not silent, it is a speaking- out-loud voice in your head; it is *spoken*, a voice is *saying* it as you read. It's the writer's words, of course, in a literary sense his or her "voice" but the sound of that voice is the sound of *your* voice. Not the sound your friends know or the sound of a tape played back but your voice caught in the dark cathedral of your skull, your voice heard by an internal ear informed by internal abstracts and what you know by feeling, having felt. It is your voice saying, for example, the word "barn" that the writer wrote but the "barn" you say is a barn you know or knew. The voice in your head, speaking as you read, never says anything neutrally- some people hated the barn they knew, some people love the barn they know so you hear the word loaded and a sensory constellation is lit: horse-gnawed stalls, hayloft, black heat tape wrapping a water pipe, a slippery spilled *chirr* of oats from a split sack, the bony, filthy haunches of cows... And "barn" is only a noun- no verb or subject has entered into the sentence yet! The voice you hear when you read to yourself is the clearest voice: you speak it speaking to you. -Thomas Lux
iii
Table of Contents
Acknowledgments………………………………………………………………………...ii
Preface…………………………………………………………………………………....iii
List of Tables…………………………………………………………………………….vii
List of Figures………………………………………………………………………..…viii
Abstract…………………………………………………………………………………..ix
I. Introduction ......................................................................................................................1
Purpose ...........................................................................................................................10
II. Review of the Literature ................................................................................................14
Response Styles ..............................................................................................................14
Acquiescence ..................................................................................................................15
Balanced Scales and Negative Items ..............................................................................19
Psychometric Consequences of Including Negative Items on Scales ............................22
Validation Studies ......................................................................................................23
Manipulation Studies ..................................................................................................30
Additional Studies ......................................................................................................39
Cognitive/Psycholinguistic Processing of Negation ......................................................40
Explanations for the Differential Processing of Negative and Positive Items ...............42
The Substantive Explanation ......................................................................................43
The Method Variance Explanation .............................................................................45
The Item Extremity Explanation ................................................................................47
The Careless Responding Explanation .......................................................................50
The Response Style/Personality Explanation .............................................................51
The Individual Differences in Cognition/Reading Explanation .................................54
iv
Evidence from Qualitative Studies .................................................................................58
Study 1 Research Questions ...........................................................................................59
Study 2 Research Question ............................................................................................61
III. Study 1 .........................................................................................................................63
Method ...........................................................................................................................63
Participants .................................................................................................................63
Materials .....................................................................................................................63
Procedure ....................................................................................................................66
Analyses .....................................................................................................................68
Results ............................................................................................................................78
Item-Level Descriptive Statistics ...............................................................................78
Confirmatory Factor Analyses ...................................................................................78
Discussion of Study 1 .....................................................................................................93
Research Question #1 .................................................................................................93
Research Questions #2 and #3 ....................................................................................96
Research Question #4 .................................................................................................98
Study 1 Limitations ....................................................................................................99
III. Study 2 .......................................................................................................................101
Method .........................................................................................................................101
Participants ...............................................................................................................101
Materials ...................................................................................................................101
Procedure ..................................................................................................................101
Analyses ...................................................................................................................103
Results ..........................................................................................................................105
Global Theme 1: Reading Skill ................................................................................106
Global Theme 2: Personality ....................................................................................114
Global Theme 3: Style of Responding .....................................................................121
Discussion of Study 2 ...................................................................................................125
Study 2 Limitations ..................................................................................................129
v
V. General Discussion .....................................................................................................130
Implications ..................................................................................................................135
Appendix A ......................................................................................................................137
Appendix B ......................................................................................................................142
Appendix C ......................................................................................................................151
Appendix D ......................................................................................................................154
Appendix E ......................................................................................................................158
Appendix F.......................................................................................................................160
Appendix G ......................................................................................................................164
References ........................................................................................................................171
vi
List of Tables
Table 1…………..……………………………………………………………………….64
Table 2…………………………………………………………………………………...79
Table 3…………..……………………………………………………………………….80
Table 4…………………………………………………………………………………...83
Table 5…………..……………………………………………………………………….88
Table 6…………………………………………………………………………………...92
Table F1..………..……………………………………………………………………...160
Table F2..……………………………………………………………………………….160
Table F3..………..……………………………………………………………………...161
Table F4..……………………………………………………………………………….162
Table G1..………..……………………………………………………………………..164
Table G2..………………………………………………………………………………164
Table G3..………..……………………………………………………………………..165
Table G4..………………………………………………………………………………165
Table G5..………..……………………………………………………………………..166
Table G6..………………………………………………………………………………167
Table G7..………..……………………………………………………………………..168
Table G8..………………………………………………………………………………169
vii
List of Figures
Figure 1..………..……………………………………………………………………….71
Figure 2..………………………………………………………………………………...72
Figure 3…..……..……………………………………………………………………….73
Figure 4..………………………………………………………………………………...74
Figure 5………………………………………………………………………………...107
viii
Abstract
Researchers often collect data on attitudes using “balanced” measurement
scales—that is, scales with comparable numbers of positive and negative (i.e., reverse-
scored) items. Many previous measurement studies have found the inclusion of negative
items to be detrimental to scale reliability and validity. However, these studies have
rarely distinguished among negatively-worded items, negatively-keyed items, and items
with negative wording and keying. The purpose of the current study was to make those
distinctions and investigate why the psychometric properties of balanced scales tend to be
worse than those of scales with uniformly positive wording/keying.
A mixed-methods approach was employed. In Study 1 (quantitative), item
wording and keying were systematically varied in adaptations of two published attitude
measures that were administered to a large college student sample. Reliability and
dimensionality of the resulting data were examined across the measures in each of four
wording/keying configurations. Study 2 (qualitative) incorporated a mix of the same four
wording/keying conditions in an adapted measure that was administered individually to a
small sample of college students. A think-aloud design was implemented to elicit
verbalizations that were subsequently analyzed using a thematic networks approach.
Study 1 findings indicated that reliability estimates were generally highest for
scales where all items were positively worded/keyed and lowest for scales with balanced
keying (or balanced keying and wording). Regarding dimensionality, method variance
was more evident when keying was balanced than when keying was consistent. This
tended to be the case whether wording was balanced or consistent. Study 2 revealed a
number of factors that could contribute to differences in the response patterns elicited by
negative and positive items. These factors included the relative difficulty of processing
ix
negatively-worded statements, respondent characteristics such as reading skill and
frustration tolerance, and idiosyncratic response styles. Among previously posited
explanations for the differential functioning of negative and positive items, results from
the studies supported some explanations (e.g., method variance; careless responding)
more than others (e.g., the substantive explanation). Overall, it appeared that the
psychometric consequences of balanced keying are no less substantial than those of
balanced wording. An important question raised by the findings is whether the apparent
advantage of consistent keying (in terms of reliability and dimensionality) came at the
expense of validity, since careless responding and other forms of satisficing may be
masked when keying is not balanced.
x
I. Introduction
Often in the social sciences, the object of study/measurement is an attitude or
trait. For example, a researcher may decide to investigate people’s opinions about taxes;
or a clinician may wish to gauge the amount of anxiety being experienced by a patient. In
either case, a self-report measurement instrument is likely to be used (in isolation or as
part of a broader examination) to measure the target construct. On the surface, the idea of
administering such an instrument seems logical and straightforward—by asking specific
taxation-related questions, for example, one should be able to ascertain individuals’
attitudes about that topic in an efficient manner.
Alas, the efficiency advantage of self-report attitude scales can be offset by a host
of potential disadvantages. Some of these pitfalls stem from the fact that as objects of
measurement, “attitudes” may be nebulous (i.e., multidimensional) and moving (i.e.,
fluctuating) targets; this problem is not unique to data collection methods that involve
self-report instruments. Other potential sources of error come under the general heading
of method variance—that is, variance in scores that is due to the measurement method
rather than the substantive object of measurement (Podsakoff, MacKenzie, Lee, &
Podsakoff, 2003).
One much-discussed subcategory of method variance has been variously referred
to as response sets, response styles, or response biases. The three terms have often been
used interchangeably. According to Cronbach (1946), a response set involves any
consistent response tendency that is independent of content. For example, the tendency to
agree with the statements on an instrument, regardless of the content of the individual
statements, would constitute a response set. Cronbach noted that his definition was
2
theoretical rather than practical, since it is not possible to truly separate an item’s content
from its form. In subsequent studies, response styles were conceptualized as consistencies
in responding associated with general item characteristics such as direction of wording
and level of social desirability—features distinct from item content (Bentler, Jackson, &
Messick, 1971, 1972). In short, a distinction was drawn between content (the “signal” in
an individual’s response to an item; his or her self-perceived level of the target trait) and
style (“noise” in the response attributable to an individual’s consistent response
tendency—for example, the tendency to give socially desirable responses). Bentler,
Jackson, and Messick (1971) opined that a response style is “…a potentially measurable
personality variable or trait” (p. 188) distinct from but possibly related to the target
constructs of personality/attitude measures.
During the 20th century, the response style that received the most attention from
researchers and methodologists was probably acquiescence, which Cronbach (1946)
initially described as a tendency to answer True rather than False (or vice versa). The
concept extends to measurement instruments using Likert scales (i.e., more than two
response alternatives). Although acquiescence as a measurement term is often associated
with (or at least exemplified as) a respondent’s tendency to agree or say yes (i.e., yea-
saying), it can also refer to the opposite tendency (i.e., nay-saying). For example, an
individual who tended to agree with positively-keyed items on a happiness scale might
tend to disagree with positively-keyed items on an unhappiness scale. Thus acquiescence
has sometimes been referred to as “monopolar” responding (McPherson & Mohr, 2005).
Some early researchers questioned the existence (e.g., Rorer, 1965; Samelson, 1972) or
importance (e.g., Block, 1971) of acquiescence—or of response styles as a
3
phenomenon—but since that time, the idea that response styles (including acquiescence)
can result in method variance has gained general acceptance (e.g., Bentler, Jackson, &
Messick, 1972; Crocker & Algina, 1986; DiStefano, Morgan, & Motl, 2012; Krosnick,
1991; Podsakoff et al., 2003; Tourangeau & Rasinski, 1988).
By definition, acquiescence—a phenomenon involving the respondent and the
response scale—is distinct from the object of measurement, content (i.e., the amount of
the target trait the respondent possesses). Lorge (1937), as cited in Cloud and Vaughn
(1970), used an example (paraphrased here) to illustrate how individuals might differ in
their use of the same response scale: One participant might endorse “I like…” items for
every activity he did not positively dislike, while another might endorse such items only
for activities toward which he felt a strong affinity. Either style would manifest as
acquiescence and result in systematic error and undesirable effects on reliability and
validity (e.g., Cronbach, 1946). According to Bentler et al. (1972), “Response styles can
obscure or drastically modify the observed interrelationships of content traits, and this
variance ought to be identified and controlled” (p. 109). Even Block (1971), who
questioned the usefulness of efforts to understand the nature of acquiescence, stated that
it should be addressed by either methodological or statistical means.
Over the years, various recommendations have been made regarding identification
of and/or correction for acquiescent responding. Perhaps the most-heeded advice on the
matter, judging by the frequency of its application in the literature, has been the use of
balanced scales—that is, scales designed to have an equal number of positive (i.e.,
positively-keyed) and negative (i.e., negatively-keyed) items. Negatively-keyed items can
be (grammatically) negatively worded (e.g., “I am not healthy”) or (grammatically)
4
positively worded (e.g., “I am ill”); in the latter example, the adjective ill might be
considered a polar opposite of healthy. Regardless of the manner in which items are made
negative, they are reverse-scored. The purpose of balanced scales is not to dissuade or
eliminate acquiescent responding (though it is possible that they have a reductive effect
on another response style, careless responding). Rather, the approach is intended to
ensure that on a given scale, acquiescent respondents receive a summated score near the
scale mean (e.g., Cloud & Vaughn, 1970). In other words, any response tendency toward
one end of the response scale (e.g., Agree) will “balance out” when the respondent’s
score for the positive items is summed with her score for the (reverse-scored) negative
items, assuming that tendency is consistent across both sets of items. As a result, the logic
goes, the mean score for the overall sample will not be biased. However, the accuracy
and interpretability of individuals’ scores may be affected. The balanced scales approach
is not without controversy (e.g., Billiet & McClendon, 2000; McPherson & Mohr, 2005),
but it continues to be recommended and used.
An implicit assumption underlying the use of balanced scales is that negative
items (regardless of wording direction) are psychometrically comparable to positive
items. That is, after reverse scoring, the response elicited by a negative item (e.g., “I am
not healthy”) should be the same as the response elicited by the corresponding positive
item (e.g., “I am healthy”). If such is not the case—for example, due to inexpert crafting
of items, response sets/styles, or for other, more esoteric reasons (e.g., some have
suggested that there is no such thing as a true polar reversal, due to semantic connotations
and the subtle changes in meaning that can result from altered syntax)—then the

5
balancing method itself will introduce construct-irrelevant variance and acquiescence
may appear to be present when in fact it is not (Block, 1971).
Unfortunately, evidence from a preponderance of studies calls into question the
assumption that parallel positive and negative statements will elicit congruent responses.
As will be explicated below, negative and positive items on attitude and personality
measures tend to function differentially in terms of factor structure, internal consistency,
and correlation with external variables. Forty years ago, Bentler et al. (1972) cited “…no
fewer than 15 separate analyses of diverse populations [in which] a factor separating true-
and false-keyed subscales has appeared” (p. 111). That trend has only continued;
published findings based on a variety of populations and measures suggest that balanced
scales designed to be unidimensional yield two factors rather than one, with positively-
and negatively-keyed items loading onto different factors (e.g., Barnette, 2000; Lai, 1994;
Marsh, 1986; Motl, Conroy, & Horan, 2000; Pilotte & Gable, 1990; Schriesheim & Hill,
1981). The differential functioning of negatively-worded items, and their tendency to
exhibit lower internal consistency than positively-worded items, led one researcher to
describe the word not–typically the operative agent by which reversals are
accomplished—as an “insidious grammatical element” that “contaminated” scale items
(Ahlawat, 1985). Some studies have found no differences between the negative and
positive items within a balanced scale, but such published findings have been rare (e.g.,
Borgers, Hox, & Sikkel, 2004; Finney, 2001).
In short, the dominant theme among factor-analytic studies of balanced scales is
the emergence of two factors that are essentially defined by item wording or keying
(positive versus negative). The two-factor solution has sometimes been interpreted
6
substantively (e.g., as “optimism” and “pessimism” subscales within the Life Orientation
Test); in other studies, it has been presumed to reflect the presence of a method effect or
measurement artifact. Regarding the former (substantive) interpretation, the implied
conceptual stance—that, say, optimism and pessimism are separable constructs or
dimensions rather than opposite ends of a continuum—seems neither intuitive nor
parsimonious. Spector, Van Katwyk, Brannick, and Chen (1997) explicitly cautioned
against such claims. Regarding the latter (artifactual) interpretation, fundamental
questions remain about the nature of the variance associated with negative items. To what
extent might such variance be a function of individual characteristics or response styles,
either stable or transient? On the other hand, to what extent might such variance reflect
general cognitive or psycholinguistic phenomena—for example, that disagreeing with a
negated reversal may not be the same as agreeing with its affirmative equivalent? It
seems likely that these possibilities (respondent-related and item-related characteristics)
are not mutually exclusive (e.g., Kuncel, 1977; Holden, Fekken, & Cotton, 1991;
Tourangeau & Rasinski, 1988).
One posited explanation for the differential functioning of negative and positive
items is item extremity (e.g., Simpson, Rentz, & Shrum, 1976). Stated simply, some
items are worded more strongly than others. Spector et al. (1997) demonstrated that if
scale items are extreme (e.g., “I loathe my job”; “I am in love with my job”) relative to
where most respondents fall on the underlying construct, people will vary in the
consistency with which they (validly) respond to items on opposite ends of the spectrum
(i.e., positive and negative): “If a scale contains only extreme items…some people might
disagree with all items because the items are too far from the people on the continuum of
7
interest” (Spector et al., p. 662; emphasis added). For example, respondents who are not
particularly satisfied or dissatisfied with their jobs might well disagree with both “I loathe
my job” and “I am in love with my job,” yielding seemingly incongruent responses after
reverse scoring. Such respondents will likely have consistent responses within item types
(positive and negative), but not across them. The presence of such respondents within a
larger participant sample (at least some of whom respond to oppositely-keyed items in a
seemingly congruent manner) means that “[c]orrelations between items at opposite ends
of the continuum will be attenuated, while correlations between items at the same end
will be relatively strong. As a result, artifactual [CFA] factors would appear based on the
response patterns to these items” (Spector et al., p. 664). A related issue involves the
reversal of items; some have argued that creating true (i.e., semantically parallel)
reversals is difficult if not impossible (e.g., Samelson, 1972). To the extent that any lack
of comparability between types of items is systematic within a balanced scale (e.g., as
written, the negative items are consistently harder to disagree with), artifactors (i.e.,
method effects) are likely to result.
Another phenomenon that could contribute to wording-related method variance is
careless responding, or a lack of attention to item content/polarity. Studies have shown
that if at least 10% of a sample were to respond carelessly to negative items (i.e., respond
as if the items were not negatively keyed) on a balanced scale measuring a
unidimensional construct, the resulting data would likely yield a two-factor solution
rather than the (true) one-factor solution (Schmitt & Stults, 1985; Woods, 2006). Such a
scenario is not implausible, given that research data are often collected from participants
who may have minimal interest in the research and little incentive to give thorough
8
attention and consideration to individual items. The term “satisficing” has been used to
describe response strategies that are characterized by less-than-optimal engagement in the
stages of the cognitive response process (e.g., Krosnick, 1991). For instance, a satisficing
respondent might expend suboptimal effort in reading/interpreting the items, searching
her memories/feelings related to the target construct, and/or responding with precision.
Careless responding would constitute a strong (i.e., extreme) form of satisficing.
Cognitive or psycholinguistic factors have also been indicated as possible
contributors to observed differences between negative and positive items. In other words,
there may be language-based reasons for differential positive/negative responding across
respondents. For example, it is well-established that relative to affirmative statements,
grammatically negative statements take longer to process and are more likely to be
misinterpreted (e.g., Peterson & Peterson, 1976; Wason, 1959, 1961). Thus it has been
suggested that the differential functioning of negatively-worded items may be attributable
to the cognitive/linguistic processing demands inherent in such items (e.g., Ahlawat,
1985; Schuman & Presser, 1981). In short, method effects result because, holding other
things equal (or as equal as possible), responding to an affirmative statement is not the
same as responding to a negatively-worded reversal. Although etiologically distinct from
the “careless responding” hypothesis described earlier, the cognitive/psycholinguistic
mechanism could have the same consequence: differential correlations within and
between subsets of items, leading to factors defined by wording direction.
In a related explanation, Marsh (1996) found that reading ability was associated
with a “negative wording” method factor. Specifically, children and adolescents with less
well-developed reading skills tended to have difficulty responding accurately to
9
negatively-worded items. Other studies involving adults have reached similar
conclusions—that respondents with lower levels of education or cognitive ability are
more likely to respond to negative items in a way that seems inconsistent with their
responses to positive items (e.g., Cordery & Sevastos, 1993; Juni, Hanson, &
Ottomanelli, 1996; Krosnick, Narayan, & Smith, 1996; Melnick & Gable, 1990). Thus it
seems probable not only that negative items are processed differently by the general
population, but that individuals may vary in their ability to respond accurately to those
items. Such a combination of potentially interacting mechanisms exemplifies the
complexity entailed in the cognitive processing model proposed by Tourangeau (e.g.,
Tourangeau & Rasinski, 1988), a model that will be described in detail in the next
chapter.
Most of the published research studies on balanced scales and negative items have
used a quantitative methodology. Empirical studies are extremely valuable because they
allow for direct testing of theories about factor structure and wording effects based on
item-level response data. As noted above, such research has established that, in general,
the positive and negative items on balanced scales do not elicit equivalent responses.
Quantitative research has also contributed to our understanding of the possible
mechanisms underlying that lack of equivalence (e.g., respondent characteristics;
psycholinguistic factors). However, there is as yet no consensus regarding the nature of
the differential functioning of positive and negative items. In short, although several
explanations have been offered, the mechanisms that drive differential responses to
positive and negative items on self-report scales are not completely understood. We do
10
not know for sure why individuals tend to respond differently to positive items than to
negative items on self-report scales.
Given that many of the hypothesized explanations for wording effects involve the
behavior of respondents, surprisingly little research has been published (excluding
hypothetical illustrative examples and anecdotal asides) in which respondents were given
the opportunity to provide their own opinions/insights related to response processes and
styles. A think-aloud protocol, which entails individuals talking through their response
process as they complete a self-report measure, has been used to investigate phenomena
such as item context effects (i.e., item responses being affected by the content of
preceding items) (Harrison, McLaughlin, & Coalter, 1996) and construct validity or the
extent to which score-based inferences are justifiable (Gadermann, Guhn, & Zumbo,
2011). However, a search revealed no published qualitative studies specifically related to
negative wording/keying of self-report items. In the absence of qualitative research about
response processes and balanced scales, a fuller understanding of the nature of negative
wording effects may prove elusive. It is entirely possible, for example, that an individual
suspected (based on observed responses) of being a “careless” or “acquiescent”
respondent (i.e., giving invalid responses due to satisficing) has in fact given earnest and
valid responses—we simply do not understand the process/logic by which those
responses were generated.
Purpose
The purpose of the current project is to investigate, using a mixed-methods
approach, the functioning of negative and positive items on self-report attitude scales. In
the quantitative part of the project (Study 1), the wording of two attitude scales will be
11
systematically varied to investigate the effects of negative keying and negative wording
on scale dimensionality and internal consistency. In previous CFA studies of balanced
scales, a two-factor solution (or a correlated traits-correlated uniquenesses model) has
usually been found to provide a better fit than a one-factor model to data collected on
instruments designed to measure a unidimensional construct (e.g., Corwyn, 2000; Marsh,
1986; Pohl & Steyer, 2010; Tomás & Oliver, 1999). Prior studies in which wording
schemes have been systematically varied across parallel versions of the same measure
have generally found that scale versions characterized by consistent wording (all positive
or all negative items) yield better-fitting one-factor models and/or higher internal
consistency than do versions in which wording direction is balanced (e.g., Barnette, 2000;
Benson & Hocevar, 1985; Greenberger, Cheng, Dmitrieva, & Farruggia, 2003; Pilotte &
Gable, 1990), although there have been exceptions (e.g., Finney, 2001).
The use of multiple measures in Study 1 will constitute an advantage over studies
whose findings have been based on a single instrument. Because the two measures
selected for this project vary in length (8 items versus 19 items) and substantive
dimensionality (one substantive factor versus four), it will be possible to examine
measurement trends over those conditions. The design will also allow for the testing of
factorial models in which method effects related to negative wording/keying are
hypothesized to be evident across measurement instruments. Prior studies have found
evidence in support of the stability of response styles across measures and over time (e.g.,
Billiet & McClendon, 2000; Horan, DiStefano, & Motl, 2003; Marsh, Scalas, &
Nagenast, 2010; Pohl & Steyer, 2010).
12
Regarding wording, at least one novel condition will be explored in the current
study: a version of the scales in which all items are negatively keyed (i.e., reverse-
scored), but only half are negatively worded. This condition is important because it has
the potential to yield insight into the heretofore unaddressed question of whether the
well-documented psychometric effects of “negative items” are a function of wording
rather than keying. Dimensionality and reliability will be investigated for that condition
as well as for three others: (1) all positive wording/keying; (2) half positive wording/
keying and half negative wording/keying; and (3) half positive wording/keying and half
positive wording/negative keying. In addition, the association between method effects
related to negative keying will be estimated across instruments.
In the qualitative part of the project (Study 2), a think-aloud protocol will be used
to explore the response processes of a small subsample of participants. Of particular
interest is the question of why negative items tend to elicit non-parallel responses to their
positively-keyed equivalents, even when such pairs have been carefully crafted to be
opposite in meaning. As noted earlier, qualitative information about this question is
sorely lacking in the literature. It is expected that the think-aloud method will yield
insight into the way respondents process and respond to different types of items (e.g.,
positively worded and keyed; negatively worded and keyed) and shed light on the nature
of the positive and negative “artifactor” issue. For example, do reading/attentional errors
lead to different response distributions for negative and positive items? Does the reversal
of positively-worded items alter meaning/extremity and thereby elicit non-parallel
responses? It is likely that the answers to such questions will vary by individual. It should
be noted that the think-aloud format may preclude the detection of certain response
13
behaviors that might occur in other, more typical data collection conditions (e.g.,
participants in large-group sessions responding to items without reading them).
Regarding participants, the availability of a large sample of matriculating college
freshmen entails both limitations and advantages. Factors such as education level and age
are essentially controlled, limiting generalizability but also decreasing within-group
(error) variance. For variables related to cognitive ability, ranges may be relatively
restricted since all participants are incoming freshmen at the same institution. In an effort
to ensure a range of cognitive ability in the qualitative study sample, participants will be
randomly selected within two categories based on SAT Critical Reading scores (average
and high). As noted earlier, previous research has indicated that individuals with lower
verbal/reading skills may be more likely to respond differentially to positive and negative
self-report items. It is hoped that the think-aloud approach will reveal some organic
examples of this phenomenon and elicit respondent insights into why it might happen.
Finally, it is expected that college students, regardless of verbal ability, may have greater
potential than other populations (e.g., children) to provide insight into their own response
processes.
II. Review of the Literature
This section will begin with brief summaries of the measurement literature on
response styles in general and acquiescence in particular. Terminology related to
balanced measurement scales and negative items will be delineated. Previous studies of
balanced scales and reversed items will then be reviewed with an emphasis on the
psychometric consequences of including negative (i.e., reverse-scored) items on
measurement instruments. Finally, posited explanations for observed differences in the
functioning of negative and positive items will be discussed in turn.
Response Styles
Podsakoff et al. (2003) defined method variance as “...variance that is attributable
to the measurement method rather than to the constructs the measures represent” (p. 879).
According to some estimates, more than 25% of the observed variance in a typical study
might be attributable to systematic method variance (Cote & Buckley, 1987; Williams,
Cote, & Buckley, 1989). Response styles—also referred to synonymously as response
sets or response biases—constitute one form of systematic method variance. Cronbach
(1946) defined a response set as “…any tendency causing a person consistently to give
different responses to test items than he would when the same content is presented in a
different form” (p. 476). Examples of hypothesized response styles include socially-
desirable responding, extreme responding, and acquiescent responding (Holden &
Troister, 2009). Several researchers have suggested that such response styles may be
stable and related to personality characteristics (e.g., Cronbach, 1946, 1950; Jackson et
al., 1971; Weijters, Geuens, & Schillewaert, 2010). Perhaps the best place to begin is
15
with a discussion of acquiescence, which has been much debated and has led to the
prevalent use of balanced scales in modern measurement practice.
Acquiescence
When a respondent encounters an item on an attitude scale with constrained
answer choices (e.g., a Likert scale), how exactly does he or she arrive at a response?
The cognitive process model proposed by Tourangeau provides a framework for
understanding the response process. As described in Tourangeau and Rasinski (1988), the
theoretical model concerns attitudes or “...networks of interrelated beliefs. ...[W]e use this
term [beliefs] loosely to encompass memories of specific experiences, general
propositions, images, and feelings” (p. 299). The model includes four stages:
(1) interpretation of the attitude question; (2) retrieval of relevant beliefs/feelings from
memory; (3) rendering of a judgment based on the retrieved information; and
(4) mapping the judgment onto one of the response choices.
According to Krosnick et al. (1996), satisficing occurs when respondents give
suboptimal effort in one or more of the above stages. For example, a respondent might
proceed through the entire sequence of stages but be less than thorough in some of them
(e.g., searching for relevant memories); this approach would be a “weak” form of
satisficing. “Strong” satisficing would involve the skipping of one or more response
stages (e.g., random responding). Acquiescence may constitute a weak form of
satisficing in which a respondent tends to lean in a certain direction (e.g., “Agree”) when
mapping judgments onto the response choices (Krosnick et al., 1996).
Cronbach (1946) defined acquiescence as follows: “When students are offered
two alternatives, as ‘True’ versus ‘False,’ ‘Like’ versus ‘Dislike,’ ‘Agree’ versus
16
‘Disagree,’ etc., some use one more than the other” (p. 479). Extending this idea to a
Likert scale, the acquiescent respondent is one who, regardless of item content, favors
one side of the response scale. Cronbach (1946) noted that the respondent might or might
not be aware of the tendency, which would be most likely to manifest in “ambiguous or
unstructured situations” (p. 483)—for example, in response to unclear or difficult items—
and would compromise reliability and validity. Thus his recommendations for controlling
response sets included maximizing clarity in instructions and items. Cronbach (1950)
later stated that a response set such as acquiescence could be conceptualized as stemming
from three respondent-related sources, combined in some proportion: “1. Chance
variance; resulting from purely random excess of choice of one or another alternative.
2. Internally consistent but momentary response tendencies; sets operating throughout
one testing, but shifting on a retest at another time. 3. Stable response tendencies; sets
operating consistently even when the same test is given at different times” (p. 17).
Subsequent acquiescence research has focused on response patterns that are consistent
within or across measures.
Bentler et al. (1971) suggested that there might be two possible kinds of
acquiescence: agreement and acceptance. They defined agreement acquiescence as the
tendency to agree with items, regardless of content; they defined acceptance
acquiescence as “…individual differences in the tendency to consider characteristics as
descriptive” (p. 190). Either category (agreement or acceptance) might manifest in either
direction. Regarding acceptance acquiescence, for example, individuals might be extreme
accepters (agreeing with all affirmative items describing personality characteristics) or
extreme rejecters (disagreeing with all items denying personality characteristics). The
17
acquiescence subtypes proposed by Bentler et al. (1971) were inferred through observed
correlations in Minnesota Multiphasic Personality Inventory (MMPI) data. The
distinction between agreement and acceptance acquiescence is not central to the current
review, but it was debated rather contentiously in the field during the 1960s and 1970s.
Not all accepted the notion of acquiescence as a measurement phenomenon. There
has been debate about the extent to which response distributions are a function of the
measurement items, the respondent, or both. Rorer (1965) drew a distinction between
response sets (conscious or unconscious attempts to portray oneself a certain way via
response choices) and purported response styles such as yea-saying or nay-saying (the
tendency to favor a certain response category). He argued that response styles, being a
test-specific function of item ambiguity and having nothing to do with item content, were
“of no more than trivial importance” as response mechanisms. Samelson (1972) criticized
Bentler et al.’s (1971) operational definitions of acquiescence/response styles as being
unclear and ill-conceived. He argued that their conceptions of acquiescence were based
on a false premise (that oppositely-keyed items are equal in strength) that led to an
erroneous analysis of seemingly inconsistent response patterns: “The root of the problem
seems to be that the experimenters mistake their own interpretation, based on an
oversimplified model, for the (actual or functional) item content and then define all
discrepant responses as acquiescence” (p. 13).
Block (1971) took issue with Bentler et al.’s (1971) theory of acquiescence
subtypes, dismissing it as mere “post hoc conjecture” (p. 209). While he did not dispute
the existence of response styles, he doubted that acquiescence could have an appreciable
effect on responses to personality inventories. Thus Block concluded that, “[f]or most
18
purposes of psychological assessment, it is not necessary to study why certain response
tendencies obscure relationships—the reasons may be uninteresting or trivial or
idiosyncratic ones” (p. 210). Rather, he advocated for addressing the issue via preventive
strategies (e.g., better instrument design/administration) or statistical adjustment of
scores. In their response, Bentler et al. (1972) countered that response styles were worth
researching; in the absence of efforts to understand them, “…attempts at identification
and control of response styles will flounder, content will remain difficult to verify, and
controversy will persist” (p. 112).
Although there remain naysayers, the existence of acquiescence as a measurement
phenomenon seems to have gained general acceptance (e.g., Crocker & Algina, 1986;
Holden & Troister, 2009; Podsakoff et al., 2003; Tourangeau & Rasinski, 1988) and its
nature continues to be investigated (e.g., DiStefano, Morgan, & Motl, 2012). Theory and
research suggest that a number of factors, and interactions among these factors, may
contribute to acquiescence and other response styles. Trott and Jackson (1967), for
example, observed that acquiescence can be experimentally manipulated. They found it
to be “elicited more readily” when item saturation (an item characteristic) was weak and
when respondent exposure to items (a respondent characteristic) was reduced,
presumably leading to decreased attention/comprehension (p. 278). Many researchers
have suggested that the propensity for acquiescent responding may vary based on person
characteristics such as individual differences in education (e.g., Krosnick et al., 1996),
personality (e.g., Cronbach, 1946, 1950), or other variables. Recent research has
indicated that response styles such as acquiescence may be more/less prevalent among
different countries or cultures (e.g., Lindwall et al., 2012; Yang, Harkness, Chin, &
19
Villar, 2010). Thus researchers have suggested that apparent response styles may stem
from item-related characteristics, person-related characteristics, culture-related
characteristics, and/or characteristics specific to the testing context.
Various suggestions for dealing with the potential measurement problems posed
by response styles have been offered since the 1940s or earlier. Some suggestions involve
design strategies intended to minimize method variance; others are statistical in nature
and pertain to identifying or adjusting for response styles. Cronbach (1946, 1950), for
example, advised scale developers to anticipate potential response sets and discourage
them by reducing ambiguity in items, response scales, and instructions (e.g., encouraging
respondents to give an answer even when in doubt). He also recommended the use of
post-hoc control strategies as needed, including the weighting of scores (to adjust for
response tendencies) and the removal of data generated by individuals demonstrating
extreme response sets. Other suggested approaches have involved partialing out
acquiescence from substantive scores based on separate (e.g., Bass, 1956; Couch &
Keniston, 1960) or embedded (e.g., Watson, 1992) acquiescence measures. Interestingly,
in one of his recommendations for reducing or eliminating acquiescence, Bass (1956)
advised researchers to employ “more intelligent and critical subjects” (p. 299). By and
large, however, reviews of the literature indicate that the most pervasive advice on
controlling acquiescence has been the recommendation to use balanced scales (Finney,
2001; McPherson & Mohr, 2005).
Balanced Scales and Negative Items
Acquiescence involves the tendency to give responses that are biased toward one
end of the response scale, regardless of item content and wording direction. Imagine, for
20
example, an attitude scale with ten items—all worded positively—and a response scale
ranging from 1 (Disagree) to 5 (Agree). A yea-saying acquiescent respondent would tend
to agree with all statements, leading to an artificially inflated total score (close to 50) that
would also distort the group mean score. A long-established practice for addressing this
problem is the use of item reversals. Continuing with the above example, five of the ten
items on the attitude scale could be rewritten so as to be “reversed” in polarity (e.g., “I
like cookies” might be rewritten as “I do not like cookies”). This version of the measure
would be a balanced scale—that is, it would consist of equal numbers of positively-
keyed and negatively-keyed items. After reverse scoring of the negatively-keyed items,
the yea-saying respondent (who would tend to agree with positive and negative items
alike) would receive a total score near the middle of the scale (~30), and the mean score
for the overall sample would not be biased. Thus the purpose of balanced scales is not to
prevent acquiescent responding, but to identify and control for it (Cloud & Vaughn,
1970; Crocker & Algina, 1986; Grove & Geerken 1977; Nunnally, 1978).
At this juncture, some clarification of terminology is warranted; as noted by
Finney (2001), descriptors related to item wording/polarity have been used inconsistently
in the literature and at times confounded with aspects of social desirability. Most notably,
many studies have used “keying” and “wording” interchangeably. Relevant terms in the
literature (all referring to items or item stems) include the following:
• negatively keyed: written to be reverse-scored. For example, on an anxiety scale
where higher ratings/scores indicate greater anxiety, an item such as “I feel calm” would
be negatively keyed. Throughout this document, the descriptor “negative” (where
otherwise undifferentiated) refers to negative keying.
21
• positively keyed: written to be scored directly. An item such as “I feel anxious”
would be positively keyed on a scale where higher ratings/scores indicate greater anxiety.
Throughout this document, the descriptor “positive” (where otherwise undifferentiated)
refers to positive keying.
• negatively worded: containing a grammatically negative marker that negates or
reverses the meaning a sentence would otherwise convey. Most commonly in item
writing, negation is accomplished by the insertion of not or do not. Note that negatively-
worded items may be keyed positively (e.g., “I do not feel calm”) or negatively (e.g., “I
do not feel anxious”).
• positively worded: grammatically affirmative or unmarked; containing no
negative syntactic (sentence-level) markers (e.g., “I feel calm”; “I feel anxious”; “I feel
free of anxiety”).
• polar opposites: adjectives/sentences thought to be precisely opposite in semantic
value (e.g., “I am happy” versus “I am sad”). Problematically, language is not like math,
where +6 and -6 are true opposites identical in absolute value. Due to the connotations
inherent in words/phrases and individual differences in lexical representations, paired
adjectives or statements “intended” to be opposite in meaning may well lack equivalence
(e.g., Biber, 1988; Chang, 1995a; Pinker, 1994; Samelson, 1972).
The above descriptors are not the only ones encountered in the literature. For
example, Chang (1995a, 1995b) proposed classifying items as “connotatively consistent”
or “connotatively inconsistent” rather than positive or negative. On a given scale, the
keying direction shared by the majority of items would define the connotatively
consistent category, while the remaining items would be connotatively inconsistent. It
22
was not clear, however, how the labels should be used for equally balanced scales. Some
researchers (e.g., Holden, Fekken, & Jackson, 1985) have made distinctions between
syntactic negations using “not,” syntactic negations using adverbs such as “never,” and
reversals accomplished via “implicit negatives” or words containing prefixes such as
“im-“ or “-un” (e.g., “I am unhappy”).
Balanced scales have been the focus of two primary types of research studies. In
the first type (validation), the dimensionality, validity, and/or reliability of a balanced
scale (e.g., the Life Orientation Test or the Rosenberg Self-Esteem Scale) is investigated
using data from one or more convenience samples. Often, one of the goals of such a study
is to determine the presence or absence of method effects associated with item wording or
keying. In the second type of study (manipulation), the item wording within a measure is
systematically manipulated to create different versions (e.g., all items positive keyed; all
items negatively keyed) whose psychometric properties can be compared based on
participant responses. Representative examples of both kinds of studies (and variations on
them) will be reviewed in the following section. It should be noted that in some studies,
the manner of balancing scales and reversing items has been either lopsided (e.g., highly
discrepant numbers of negative and positive items) or unspecified. Additionally, as noted
earlier, descriptors related to item wording have not always been used clearly. Thus the
accuracy and generalizability of some reported findings may be questionable.
Psychometric Consequences of Including Negative Items on Scales
As suggested by Steinberg (2001), it may be impossible to know what form of an
instrument (with regard to response scale, item wording, item order, etc.) will do the best
job of eliciting a respondent’s “true” level of the target construct. However, the literature
23
strongly suggests that the inclusion of negative items can be detrimental to scale
reliability/validity and introduce method variance that is largely or entirely unrelated to
the object of measurement. Regarding balanced scales, Trott and Jackson (1967)
observed that “…the method of scoring used pits acquiescence against content” (p. 285).
Research has indicated that the inclusion of even one (scored) negative item can be
detrimental to scale functioning (Horan, DiStefano, & Motl, 2003; Ibrahim, 2001).
Evidence of differences between negative and positive items has been provided in
the form of internal consistency estimates (e.g., Barnette, 2000), item-total correlations
(e.g., Juni et al., 1996), predictive validity (e.g., Lai, 1994), and factor-analytic solutions
(e.g., Ebesutani et al., 2012; Pilotte & Gable, 1990). Regarding the latter area, earlier
studies tended to focus on a limited number of competing models (e.g., one factor versus
two); more recently, researchers have begun to compare a wider range of models—for
example, multiple variants of correlated trait, correlated methods (CTCM) and correlated
trait, correlated uniquenesses (CTCU) models. Several CFA studies have used CTCM
models to explore potential relationships between response style and measures of
reading/cognitive ability (e.g., Marsh, 1996) and personality (e.g., DiStefano & Motl,
2006). Selected validation and manipulation studies (and additional studies using
alternative or hybrid designs) that have shed light on the psychometric properties of
balanced scales are reviewed below.
Validation Studies. The Life Optimism Test (LOT), a measure of dispositional
optimism, was first introduced by Scheier and Carver (1985). The LOT uses a 5-point
Likert scale (Strongly Disagree to Strongly Agree) and includes eight substantive items
plus four “filler” items whose intended purpose was “…to disguise (somewhat) the
24
underlying purpose of the test” (p. 224). Of the eight substantive items, half are positively
keyed and half are negatively keyed. Of the four reversed items, three are negated via
adverbs (e.g., “I hardly ever expect things to go my way”) and the other contains no
negative markers (“If something can go wrong for me, it will”). Using data collected
from 624 undergraduates, Scheier and Carver (1985) performed an exploratory factor
analysis (EFA) that yielded two factors defined by keying direction. They then used
confirmatory factor analysis (CFA) techniques on the same data to test the fit of a one-
factor model versus a two-factor model. In both models, correlated error terms were
apparently included (a) among the positive items and (b) between the affirmatively-
phrased negative item noted above and one of the positive items. Results indicated an
acceptable fit for both models, with a nested χ2 test favoring the two-factor solution.
However, the authors argued that the LOT could “just as reasonably be considered
unidimensional” for the following reasons: in the EFA, all items had loadings of at least
.50 on the first unrotated factor; and in the two-factor CFA solution, there was a “high
positive correlation” of .64 between the factors (p. 227). Ignoring for the moment
concerns about the authors’ analytic methods and interpretations, the study provided
evidence of differential functioning across the negatively-keyed and positively-keyed
LOT items.
Similar findings were reported by Lai (1994), who administered the LOT to a
sample of 202 undergraduates in Hong Kong (the English language proficiency of the
participants was not discussed). An EFA based on the data yielded two factors, one
associated with positively-keyed items and the other with negatively-keyed items. The
correlation between the factors (.18) was much lower than that found by Scheier and
25
Carver (1985). Lai also found that the positive and negative “subscales” differed in terms
of both internal consistency estimates (coefficient alpha = .71 and .66, respectively) and
correlations (unadjusted for reliability) with scores on health-related symptom checklists
(e.g., -.31 versus .12).
Using archival data from two samples (1,967 male US Air Force trainees; 415
high school students), Bernstein and Eveland (1982) investigated the factor structure of
the State Trait Anxiety Inventory (STAI; Spielberger, Gorsuch, & Lushener, 1970). The
20-item STAI was designed to measure two distinct constructs: state (i.e., transitory)
anxiety and trait (i.e., stable or chronic) anxiety. The STAI is a balanced scale, as half the
items are negatively keyed. Based on an oblique multiple-groups (OMG) CFA approach,
Bernstein and Eveland advocated for a four-factor solution defined by the two
hypothesized substantive constructs and keying (State+, State-, Trait+, Trait-). The
pattern of correlations between factors was of interest. In both samples, the strongest
relationship was between State+ and State- (.59 to .65); the relationship between Trait+
and Trait- factors was considerably weaker (.27 to .49) and, in fact, less strong than the
correlations between factors with the same keying direction (positive: .58 to .61;
negative: .49 to .55).
In another CFA study, Magazine, Williams, and Williams (1996) administered
Meyer and Allen’s (1984) Affective and Continuance Commitment Scales (ACS and
CCS) to a sample of library and bank employees (N = 333). Both the ACS and the CCS
contain eight items. On the ACS, four items are negatively keyed (three of which are
negatively worded); on the CCS, two items are negatively keyed (both negatively
worded). Of the four competing (theory-based) models the authors fit to the combined
26
data (two- and three-factor models with and without method factors), none exhibited
acceptable fit based on χ2 and Comparative Fit Index (CFI) statistics. However, the
models with “reverse coding” method factors fit significantly better than the models
without them. Based on the results, Magazine et al. (1996) raised the question of whether
it might be beneficial to replace the negative ACS and CCS items with positively-keyed
equivalents.
In a study based on a 7-item version of the Rosenberg Self-Esteem Scale (RSE;
Rosenberg, 1989), Marsh (1996) investigated the lingering question of its factor structure.
He tested the fit of six competing CFA models to data collected in 1988 (nominal N =
8,764) and 1990 (nominal N = 4,251) as part of the National Education Longitudinal
Study of 1998 (the response scale was not specified, but historically the RSE has been
operationalized with a four-point Likert scale). For both data sets, the best fit was
obtained with a one-factor model that included method effects (correlated errors among
all three negatively-keyed items and between two of the four positively-keyed items). In
addition, Marsh conducted follow-up analyses involving a two-factor model (positive
versus negative items) and concurrent measures of verbal/reading ability. The positive
and negative “factors” became less distinct as reading ability increased, lending support
to the hypothesis that “…the underlying separation between two empirically identified
[RSE] factors may reflect method effects…” rather than substantively meaningful
differences (p. 817). In his conclusions, Marsh (1996) proposed (as he had in 1986) an
alternative way to control/screen for response biases in attitude and personality
questionnaires: Include a small number of negative items, but do not count them (or,
alternatively, weight them less) in calculating scale scores. This approach, he argued,
27
would serve to “…disrupt potential response biases…” (p. 817). It was not clear in
Marsh’s argument whether the disruption of potential response biases would result from
encouraging respondents to pay attention to item wording (through the intermittent
inclusion of negative items), screening out aberrant response patterns post hoc, or both
mechanisms.
In a similar study, Corwyn (2000) investigated the factor structure of the full, 10-
item RSE based on five data sets. This form of the RSE was balanced (five negatively-
keyed items, two of them negatively worded) and included a four-point Likert scale
(Strongly Agree to Strongly Disagree). Consistent with prior studies of the RSE, all
models incorporating method effects related to keying direction fit the data better than
did models without method effects. The best-fitting model was a full bifactor model that
included one substantive factor (self-esteem) and two method factors (positive and
negative keying). In this model, (standardized) substantive factor loadings were
consistently higher for the positive items whereas uniquenesses (i.e., error variances)
were consistently higher for the negative items. This pattern would suggest that the
positive items were of higher quality and validity than the negative items as indicators of
the target construct (self-esteem).
Motl and colleagues have published several studies of method effects associated
with negative items. In Motl, Conroy, and Horan (2000), the dimensionality of the 12-
item Social Physique Anxiety Scale (SPAS; Hart, Leary, & Rejeski, 1989) was examined.
The studied version of the SPAS used a 5-point response scale (Not At All to Extremely).
It appeared that seven of the 12 items were positively keyed (i.e., higher responses
reflecting higher levels of anxiety) while the other five were negatively keyed (e.g., “I
28
never worry about wearing clothes that might make me look too thin or overweight”).
Eight competing CFA models, including CTCM and CTCU variants, were tested with
archival data from four samples (N = 1,053). Results favored models with a single, global
substantive factor and (substantively irrelevant) method effects (modeled as correlated
uniquenesses, a positive method factor, or a negative method factor). In their conclusions,
the authors emphasized the need to model method effects for personality scales on which
the direction of item wording (keying) varies.
Horan, DiStefano, and Motl (2003) used National Educational Longitudinal
Sample (NELS 1988-1994) data to investigate the factor structure of the RSE (the same
7-item version used by Marsh [1996]), an Attitude toward School scale (10 items, 7
positively keyed and 3 negatively keyed) and a Locus of Control scale (6 items, one
positively keyed and 5 negatively keyed). Each measure had a four-point response scale
(Strongly Disagree to Strongly Agree), and negative items were reverse-scored prior to
analyses. For all scales, models that included method effects (method factors or
correlated uniquenesses) for either positive or negative items fit the data better than
models that did not; the best-fitting variants were those that modeled method effects for
negative items.
To investigate the relationships of wording/keying effects across the three
instruments, Horan et al. (2003) tested additional CFA models that included three
substantive factors and (a) no wording effects, (b) three correlated negative-wording
factors, and (c) a single negative-wording factor operating across all measures. Results
favored the second model, which was deemed to have adequate fit statistics. Correlations
among the three substantive factors ranged from .38 to .76, while correlations among the
29
method factors ranged from .31 to .43. Thus although the model with a single method
effect (across all measures) was not supported, there was evidence of similarity in the
differential functioning of negative and positive items across measures. The presumed
“negative wording” effect was present across measures but manifested differently on
each. A structural model based on RSE data from three time points suggested that the
method effects were also stable over time.
Method effects associated with negatively-keyed items have been reported in
numerous other validation studies using different scales and populations. For example,
Hazlett-Stevens, Ullman, and Craske (2004) investigated the factor structure of the Penn
State Worry Questionnaire (PSWQ; Meyer, Miller, Metzger, & Borkovec, 1990) using
data from two college samples. Their results indicated the presence of a single
substantive factor (worry) plus a method factor to account for differential responding to
negative items. Chen, Rendina-Gobioff, and Dedrick (2010), using data from two
Taiwanese elementary school samples, found evidence of method effects associated with
negatively-worded items on a Chinese measure of self-esteem. Similar results were
reported by Ebesutani et al. (2012), who investigated the factor structure of the
Loneliness Questionnaire (LQ; Asher, Hymel, & Renshaw, 1984) using data from U.S.
children in grades 2-12.
Few published validation-type studies of balanced (or mixed) scales have reported
a lack of method variance associated with wording/keying. In one such example,
Bernstein and Garbin (1985) used an OMG CFA approach to test various proposed
subscales of MMPI Scale 2 (Depression); data came from a small outpatient sample (N =
76) and a large job applicant sample (N = 3,808). It should be noted that the MMPI has a

30
dichotomous response scale (True/False). None of the proposed structures, including
subscales based on keying, adequately reproduced the observed inter-item correlation
matrix. Thus there was no evidence that positive and negative items were functioning
differentially, though there was also no evidence that they were functioning comparably.
In a more recent example, Borgers, Hox, and Sikkel (2004) analyzed internet-
based survey responses to a simplified Dutch version of the RSE and another well-being
scale from 202 children (aged 8-16). Contrary to expectations, there was no effect of
negatively-keyed items on the internal consistency of the responses. In discussing these
results, the authors suggested that their analytic approach (the use of reliability estimates
as dependent variables) may have obscured differences between responses to negative
and positive items. They noted that for more than half of all possible comparisons,
significant mean differences were found between oppositely-keyed items.
Manipulation Studies. Benson and Hocevar (1985) examined the effects of item
wording on the responses of elementary schoolers (grades 4-6, N = 522) to an attitude
measure. The study was designed to test two assumptions implicit in recommendations to
use “balanced” scales: (1) that positive and negative items measure the same construct;
and (2) that balancing yields a more valid index of the target construct. Each student was
administered one of three versions of a 15-item scale assessing attitudes about school
integration: all positively worded; all negatively worded; and mixed (8 and 7 items,
respectively). Item order was consistent across forms, and all negative items were created
by adding the word “not.” The all-positive and all-negative forms were shown to have
different item means, item variances, and factor loadings. The pattern of means suggested
that it was “…difficult for the students to indicate agreement by disagreeing with a
31
negative statement” (p. 231). Factor analyses of the mixed-form responses supported a
two-factor solution defined by item wording.
In a study of the effects of “negative valence” items, Ahlawat (1985) analyzed the
responses of 501 Jordanian teenagers (grades 8-9) to a version of the STAI that had been
expanded and then translated into Arabic. The measure included a 5-point Likert scale
and 92 items—23 each of four types that were classified as semantically and
grammatically positive (e.g., “I feel happy”), semantically positive and grammatically
negative (e.g., “I do not feel happy”), semantically negative and grammatically positive
(e.g., “I feel sad”), and semantically and grammatically negative (e.g., “I do not feel
sad”). The data were found to have good overall internal consistency (.90), but patterns of
means, standard deviations, and correlations suggested marked differences in the
functioning of the four types of items within each of four sample subgroups (rural girls,
urban girls, rural boys, and urban boys). In interpreting the results, the author concluded
that some types of items “…were contaminated by the introduction of an insidious
grammatical element, the negative” (p. 97). It should be noted that Ahlawat’s (1985) use
of item descriptors (“positive” and negative”) seemed to confound semantics and social
desirability.
Schriesheim and colleagues conducted several studies involving the systematic
manipulation of wording/keying (Schriesheim & Eisenbach, 1995; Schriesheim,
Eisenbach, & Hill, 1991; Schriesheim & Hill, 1981). Each study investigated
psychometric consequences of using different proportions of item reversals on two
subscales from the Leader Behavior Description Questionnaire (LBDQ; Stogdill, 1963).
Items from the Initiating Structure (IS) subscale were alternated with items from the
32
Consideration (C) subscale, yielding an instrument with 16-20 items; the response scale
had five options (Always to Never). The research design addressed a perceived weakness
in other wording-related studies of attitude scales: “…there was no known referent or
objective standard against which subject responses could be compared; the validity of
subjects’ responses could, as a consequence, be only inferred” (Schriesheim et al., 1991,
p. 70). Thus in each study, participants were asked to carefully read a one-page
description of behaviors displayed by a fictitious supervisor; after they had finished
reading, they were asked to turn the description face down and (from memory) rate the
supervisor’s behaviors. Through substitution of adverbs, two versions of the description
were created: one in which the IS behaviors were high, and one in which they were low
(Consideration behaviors were neutral across both versions). Different variations of the
response instrument were used in each study.
In Schriesheim and Hill (1981), three versions of the 20-item response instrument
were created: one in which all items were positively worded; one in which all items were
reversed (usually this was accomplished by the insertion of “not” or a prefix like “un-”);
and one in which half of the items on each subscale were reversed (“mixed”). Participants
(N = 150 undergraduates) were randomly assigned to one of the six (2x3) conditions. The
focus of analysis was the IS subscale, on which participants were expected to give
extreme responses (because they read descriptions in which these behaviors were either
frequent or rare). Internal consistency, as estimated by coefficient alpha, was highest
when all survey items were positively worded (.96) and slightly lower in the all-negative
(.91) and mixed (.89) conditions; in the latter condition, the subset of five negative items
was much less reliable than the subset of five positive items (.70 versus .91). To equate
33
responses from the high- and low-IS conditions, the authors calculated accuracy scores
for each response (1 for perfect accuracy, 5 for extreme inaccuracy). For example, the
fictitious supervisor in the high-IS script should have received the highest possible scores
from respondents (5) on IS items. Similarly, the supervisor in the low-IS script should
have received the lowest possible score on each IS item. Accuracy scores were computed
as the difference between expected and observed IS item scores (i.e., 5 - X for the high-IS
condition and X - 1 for the low-IS condition). Descriptive statistics for these scores
suggested that the mixed and negative item wording conditions resulted in about 50
percent more inaccuracy (and more variability) than that observed in the all-positive
condition. A one-way ANOVA revealed statistically significant effects of item wording
on accuracy. Based on the results, the authors concluded that “…although the inclusion
of negatively stated items may theoretically control or offset agreement response
tendencies, their actual effect is to reduce response validity” (p. 1113).
Holden, Fekken, and Jackson (1985) questioned the claim that the use of balanced
scales necessarily compromises response validity: “Although the balancing of scales may
serve to reduce acquiescent response biases, nowhere has it been put forth that this must
be accomplished through the use of negative wording. It appears that Schriesheim and
Hill [1981] have not drawn a proper distinction between negative wording and negative
keying” (Holden et al., 1985, p. 387). Holden et al. (1985) suggested that the two
dimensions are mutually exclusive and could be varied to create four kinds of items
(examples reproduced from p. 387): “He mixes with others” (positive wording, positive
keying); “He doesn’t mix with others” (negative wording, negative keying); “He keeps to
himself” (positive wording, negative keying); and “He doesn’t keep to himself” (negative
34
wording, positive keying). In an effort to explore those item subtypes, the authors
conducted a correlational study on 80 items from a Likert-based personality measure (the
Personality Research Form or PRF). Studied features of the items included length (three
proxies), negative keying (yes/no), judged face validity, judged subtlety, and three types
of negative wording (use of “not”; use of negative qualifiers such as “rarely”; and use of
implicit negatives such as the prefix in “unpleasant”). Another variable, “item criterion
validity,” was based on “…point biserial correlations of individual items with multiple
criterion scores [that] represented unweighted composites of self-evaluations on a rating
scale, an adjective endorsement list, and an experimental preference rating” (p. 388).
These values were calculated based on data from two prior studies involving the PRF.
An initial and predictable finding in Holden et al. (1985) was that criterion
validity decreased for lengthier items (correlations between -.14 and -.23). After item
length was partialed out (because negatively-worded items tend to be longer than
positively-worded ones), use of negative wording (all types combined) remained
significantly associated with reduced criterion validity (-.22). By contrast, the correlation
between negative keying and criterion validity was not statistically significant (.01;
presumably this was calculated as a point-biserial correlation). None of the three types of
negative wording was significantly correlated with criterion validity on its own (“not”:
-.16; negative qualifiers: -.07; implicit negatives: -.08). Due to the correlational approach
of the study, the import and generalizability of its findings are uncertain. However, it
raised important questions about item keying and wording that influenced subsequent
research.
35
In Schriesheim et al. (1991), for example, the authors refined their previous
research design (Schriesheim & Hill, 1981) to include four wording conditions for the
response instrument (which was also shortened to 16 items): all items positively
worded/keyed (“regular”); half items regular, half positively worded/negatively keyed
(“polar opposite”); half items regular, half negatively worded/positively keyed (“negated
polar opposite”); and half items regular, half negatively worded/negatively keyed
“negated regular”). Participants, 280 undergraduates, were randomly assigned to one of
the eight (2x4) conditions. As was the case in the 1981 study, internal consistency
estimates for the IS subscale (8 items) were higher for the all-positive condition (.94)
than for the mixed conditions (.77-.89). A one-way ANOVA indicated that item wording
had a significant effect on accuracy. Post-hoc comparisons revealed that accuracy scores
were significantly higher (p < .05) for regular and negated regular items than for polar
opposite and negated polar opposite items.
A very similar data collection design was adopted in Schriesheim and Eisenbach
(1995), though the response instrument was returned to its original length (20 items) and
four versions of the supervisor description were used. Based on data from 496
undergraduates, EFA and CFA analyses were conducted to investigate possible method
effects. The best-fitting CFA model included a single (IS) trait factor and four method
factors, one for each wording condition. Correlations between the method factors were
generally nonsignificant, with the exception of that involving the two types of reverse-
scored items (.42). The results indicated that method effects can result not only from
keying differences, but also from different wording strategies, as had been suggested by
Holden et al. (1985).
36
Barnette (2000) examined the effects of both item wording (2 conditions) and
response scale presentation (3 conditions) on means, variances, and reliability estimates.
Participants (a mix of high school students, undergraduates, graduate students, and in-
service teachers; N = 915) were administered one of six versions of a 20-item
questionnaire designed by the author to assess attitudes about year-round schooling.
Items were either (a) all “direct-worded” (i.e., positively keyed and worded) or (b) half
direct-worded and half reverse-worded (reversals were accomplished by the insertion of
an underlined “not”). The 5-point response scales were presented as (a) Strongly
Disagree to Strongly Agree, (b) Strongly Agree to Strongly Disagree, or (c) a randomly-
determined half-and-half mix of the two (varying by item). After reverse-scoring, items
presented in the “mixed wording” format had higher means and lower variances than
items presented in the “all-direct” format. Reliability estimates were higher for the all-
direct wording condition (.81-.85) than the mixed wording condition (.65-.73), and the
highest internal consistency was observed when items were all positively worded and the
response scale varied from item to item. Barnette concluded that “…using a bidirectional
response set of alternatives [i.e., varying the direction of the response scale from item to
item, as opposed to keeping the response scale constant and including negatively worded
items] does not result in a loss of internal consistency but would permit the possible
detection of acquiescence or response set bias.” (p. 369). The author did not explain
precisely how said detection should be carried out.
Several other wording-manipulation studies have reported differences in the
psychometric properties of scale versions with different proportions of negative and
positive items. For example, Chang (1995a) administered four versions of the LOT to
37
university students. CFA results indicated a two-factor solution for balanced versions and
a one-factor solution for versions with all-positive or all-negative keying. Miller and
Cleary (1993), analyzing loneliness scale data from undergraduate and graduate students,
found that balanced versions yielded a factor defined by negatively-keyed items. Similar
results were reported by Höfling, Moosbrugger, Schermelleh-Engel, and Heidenreich
(2011), who examined the factor structure of a balanced version of the Mindfulness
Attention and Awareness Scale (MAAS; Brown & Ryan, 2003), and by Greenberger et
al. (2003), who created three versions of the 10-item RSE (all positive, all negative,
balanced) to be administered to university students.
Occasionally, published manipulation studies have found the psychometric
functioning of negative and positive items to be comparable. For example, Jackson and
Lay (1968) crossed wording and keying conditions for selected PRF items that were then
administered (in one of two questionnaires) to 158 female university students on two
occasions (one week apart). Participants also completed separate measures of
acquiescence and social desirability. Correlational results suggested that participants
“…generally had little difficulty in responding appropriately to positively and negatively
worded variations of the same item” (p. 326). Similarly, EFA results yielded substantive
factors and “negligible” relationships between PRF items and acquiescence/desirability
scores.
In two parallel studies with college student samples (total N ~ 1,000), Finney
(2001) investigated measurement consequences of using negative items on a Likert-based
test anxiety scale (the TAI). In both studies, approximately half of the sample completed
the standard version of the 8-item scale (which contained only positively-worded items)
38
while the other half completed an adapted “mixed” version in which the word “not” was
added to four items, making them negatively worded and negatively keyed. Additional
measures were subsequently completed by all participants. The main difference between
the two studies involved data collection procedures: In Study 1, the procedure was highly
structured (e.g., participants completed one measure at a time and were not permitted to
move on until everyone was ready); in Study 2, participants were allowed to work at their
own pace and depart once they had finished.
In describing her analyses (primarily t-tests and CFAs), Finney (2001) reported
that while the two studies yielded similar results, the data collection procedures in Study
2 resulted in “...a general deterioration of the [questionnaire’s] psychometric properties”
(p. 142). Regarding the primary research hypotheses, some were supported. First,
negative items were less reliable than positive items. Also, the presence of negative items
decreased the reliability of positive items when participants were allowed to proceed at
their own pace. Some findings were contrary to both expectations and results from other
studies. Most notably, the negative items did not exhibit lesser validity than positive
items, did not have a detrimental effect on mixed-form validity coefficients for positive
items, and did not adversely impact the factor structure of the data. It was unclear
whether the unexpectedly adequate fit of a one-factor (trait) model to balanced-scale data
was due to the cognitive ability of the sample (i.e., they were not confused by negative
wording) or some interaction among respondent characteristics, item characteristics, and
data collection procedures. Finney also raised the possibility that the directions of her
hypotheses may have been biased by the “file drawer problem” (i.e., previous studies that
failed to find significant wording/keying effects may not have been published).
39
Additional Studies. Most published studies of wording-related method effects
have used either a validation or a manipulation approach (or both). Exceptions include
Melnick and Gable (1990), in which an attitude questionnaire was completed by parents
of 3,328 elementary schoolers in an urban school district. The instrument used a five-
point Likert scale (Strongly Agree to Strongly Disagree). Analyses were based on pairs of
parallel items—that is, pairs of items deemed to be equivalent in meaning but opposite in
keying direction. For each item pair, respondents were classified into groups depending
on whether their two responses were “consistent” (e.g., Agree/Strongly Agree for the
positive item and Disagree/Strongly Disagree for the negative item) or “inconsistent”
(e.g., Agree/Strongly Agree for both items). T-tests revealed that the consistent
responders had significantly higher mean scores than the inconsistent responders on all
questionnaire subscales (Home/School Relations; Clear School Mission; High
Expectations; Safe and Orderly Environment; Instructional Leadership; Frequent
Monitoring of Student Leadership). In addition, chi-square tests indicated that for each
pair of items studied, the consistent responders had a higher education level than did the
inconsistent responders. The authors concluded that balanced scales might be particularly
confusing for adults with lower levels of education.
Chang (1995b) conducted a generalizability study to examine the comparability of
positively- and negatively-keyed (connotatively consistent and inconsistent) items. A
Likert-based attitude scale created by the author (related to math/statistics) was
administered on two occasions (one week apart) to 102 graduate students enrolled in a
research methods course. The study was based on eight items from the scale (four
positive, four negative), each of which was rewritten to have opposite keying at the
40
second occasion. Thus the initial design was partially nested with three facets: wording,
scale version (i.e., occasion), and item. The main effect for wording was nearly zero
(0.5% of total variance), but the variance components were more substantial for the two-
way interaction between person and wording (5.5%) and the three-way interaction
between person, wording, and scale version (9.1%). Because the largest variance
component was associated with the interaction between person and scale (26.1%),
indicating that the relative standing of individuals varied markedly across the two scale
versions, the two versions were subsequently analyzed separately. Large variance
components for the person-wording interaction (14 and 16%) indicated that wording
impacted the relative standing of individuals. Finally, follow-up decision studies revealed
that positively worded items had higher G coefficients (reliability) than their reversed
counterparts. Thus Chang’s (1995b) conclusions were consistent with those of most other
wording-related studies: Positive and negative items do not elicit equivalent responses.
Cognitive/Psycholinguistic Processing of Negation
Before various measurement-related explanations for the non-equivalence of
positive and negative items are discussed, it may be informative to review the findings of
experimental studies of cognitive/psycholinguistic processing of negated statements. As
noted by Block (1971), “The use of ‘negation reversals’ avoids the trap of ‘polar
reversals’ which possibly are not received by respondents as psychological reversals” (p.
206). For example, the word healthy has a number of antonyms that could be used as
reversals (e.g., ill; sick; unhealthy; unwell). Are any of those antonyms likely to be
perceived as true “polar” opposites, identical in absolute value? Given the nuances of
semantics (e.g., denotative and connotative aspects of meaning), the answer is probably
41
no. And even if one person felt strongly that healthy and ill were precise opposites,
another person might perceive a lack of symmetry (e.g., on a state-versus-trait
connotative dimension). Words are not numbers, and individual representations and
perceptions of words vary (e.g., Pinker, 1994). Thus sentence-level negation (e.g.,
reversing a measurement item by adding “not”) has been an appealing strategy for
researchers constructing balanced attitude/affective scales. However, the literature
strongly suggests that negated items present challenges of their own.
Wason (1959, 1961) conducted several experimental studies in which
undergraduate and graduate students responded to four types of (printed) statements: true
affirmatives (e.g., “Ice is cold”); false affirmatives (e.g., “Ice is hot”); true negatives (e.g.,
“Ice is not hot”) and false negatives (e.g., “Ice is not cold”). Performance was measured
in terms of both accuracy and speed. Results consistently showed that affirmative
statements were processed more quickly, and with fewer errors, than negative statements.
These trends were congruent with observations volunteered by participants (e.g., during
self-assessments of performance across conditions). Wason (1959) concluded that there
was “…considerable evidence to suggest that responding to negative information in the
logically sufficient way is detrimental to the assessment of performance” (p. 101).
The same four wording conditions were used by Peterson and Peterson (1976),
who asked adults to answer (from memory) true-false statements about reading passages.
Analyses of variance for accuracy data confirmed that negative statements yielded more
errors than did affirmative ones. Response times were not measured in the study.
Sherman (1973, 1976) conducted several studies investigating the effects of
different kinds of negation on sentence-level comprehension. Participants were asked to
42
read statements and indicate for each whether it made sense (half of the statements were
reasonable, while half were not). Performance was measured in terms of both accuracy
and speed. Consistent with expectations, “unmarked” (i.e., affirmative) sentences were
processed more quickly and accurately than negated sentences. Among subtypes of
negated sentences, those including “not” were the most problematic for respondents.
Those with implicit (prefix-based) negation (e.g., “I am unhappy”) and adjectival
negation (e.g., “I am sad”) had “…little effect on comprehension in an otherwise
affirmative context… [but] a consistent and substantial effect when added to [an
otherwise] negative sentence [e.g., “I am not unhappy”] (1976, p. 143). Finally, sentence
comprehension became increasingly more difficult with increasing numbers of negative
markers (regardless of subtype).
In summary, it is well-established that negated statements are processed more
slowly and less accurately than corresponding affirmative statements. The effect appears
to be strongest when negation is accomplished via overt syntactic markers (e.g., “not”).
Linguistic factors impacting working memory—such as sentence length, sentence
structure, and number of negative markers—can also affect comprehension (e.g.,
Angleitner, John, & Löhr, 1986; Carpenter & Just, 1975; Foss & Hakes, 1978).
Explanations for the Differential Functioning of Negative and Positive Items
The measurement literature on balanced scales suggests that negative and positive
items tend to function differentially, often leading to undesirable consequences for scale
dimensionality, reliability, and validity. The “blame” for those consequences has
typically been laid at the doorstep of the “insidious” negative items, which appear to be
more difficult to process than affirmatively-worded items, particularly for respondents
43
with lower levels of cognitive ability, reading skill, and/or education. As yet, however,
there is no consensus regarding the exact nature of the difficulty negative items seem to
present for both respondents and researchers. Why is it that confirmatory factor analysis
of data from scales designed to be unidimensional so often supports a model with two
factors defined by item wording/keying? Previously posited explanations for that
phenomenon are reviewed below.
The Substantive Explanation. According to this line of reasoning, a two-factor
model fits or emerges from the data because both factors reflect independent constructs
or dimensions of a construct. The systematic variance modeled by the “negative” factor
is, like that of the “positive” factor, substantive (rather than artifactual) in nature. As
summarized by Finney (2001), “…some researchers have hypothesized that the negative
item wording may tap into different or additional affective or attitudinal constructs than
the positive item wording” (p. 37).
As described earlier, Bernstein and Eveland (1982) examined the dimensionality
of the STAI, a balanced scale, using a multiple-groups approach with data from two
samples (high school students and Air Force trainees). Results supported a solution with
four factors defined by positively-keyed State items, negatively-keyed State items,
positively-keyed Trait items, and negatively-keyed Trait items. The authors offered a
substantive interpretation of the structure, suggesting that STAI respondents “…tend to
perceive items describing the symptoms of anxiety [i.e., negatively-keyed items] and the
symptoms of positive moods [i.e., positively-keyed items] as being at least as different as
items describing the immediate present (state) and the long term (trait)” (p. 371).
44
The possibility of a substantive explanation for negative/positive differences was
also raised by Mook, Kleijn, and van der Ploeg (1991), who investigated the factor
structure of balanced scales measuring anxiety (a Dutch trait-only version of the STAI)
and depression symptoms. Each measure consisted of 20 items, half of which were
negatively keyed (it was unclear how many were negatively worded). A principal
components analysis (PCA) was conducted using pooled data on both measures collected
from four groups of adults (N = 1,409). Results supported a two-component solution
defined entirely by keying direction—that is, all negatively-keyed anxiety and depression
items loaded on one component, while all positively-keyed anxiety and depression items
loaded on the other. These components were tentatively referred to as “absence of
positive affect” and “presence of negative affect.” The authors suggested that their results
might be due to stylistic responding (e.g., social desirability), but favored an alternative
explanation: “…our consistent positive-negative differences reflect the workings of two
independent dimensions of positive and negative affect” (p. 558).
Mook and colleagues (1992) conducted a similar study of a Dutch version of the
LOT dispositional optimism scale (8 items, half negatively keyed). A PCA of data from
two adult samples (N = 404) yielded two components defined by keying direction; the
correlation between the two components was .31. As in their previous (1991) study, the
authors favored a substantive interpretation of the apparent multidimensionality of the
LOT. It was suggested that the two components reflected optimism (i.e., presence of
positive affect) and pessimism (i.e., absence of negative affect).
More recently, Alessandri, Vecchione, Tisak, and Barbaranelli (2011)
investigated the dimensionality of a revised (and translated) version of the LOT (LOT-r).
45
The measure (6 items: half positively keyed, half negatively keyed) was administered to a
sample of 372 Italian adults, with 372 matched acquaintances serving as informants.
Participants gave self-ratings, while each informant independently rated the participant
with whom he or she was acquainted. In addition to the LOT-r, participants and
informants gave ratings on measures of Big Five personality traits (40 adjectives) and
egoistic bias (7 items). Results of five competing CFAs for each group yielded three
plausible models, of which Model 4 (one trait factor plus a “specific factor” associated
with positively-worded items) was favored for theoretical reasons. The Model 4 variance
was then decomposed into three components (self-report: optimism = 29%, specific =
23%, error = 48%; other-report: 31%, 24%, 46%). Scores from the six personality
indicators were included, along with the optimism factor and the specific factor, in a
CTCU model. The set of personality measures explained similar amounts of variance for
each factor (.41 and .50), supporting the researchers’ hypothesis that “…the tendency to
endorse positively worded items represents a personality characteristic linked to
individual adjustment (i.e., emotional stability) and to a specific facet of social
desirability” (p. 638). In other words, a substantive interpretation of the second
(“specific”) factor was favored.
The Method Variance Explanation. Proponents of this explanation posit that for
balanced scales, multiple factors may emerge due to wording-based method variance—
that is, because negative and positive items elicit different response distributions. The
method variance, while systematic, is not of substantive interest; it is merely noise that
should be partitioned from the measurement signal (e.g., via CFA/SEM techniques). This
explanation is at odds with the substantive interpretation of wording-based variance.
46
Russell and Carroll (1999), for example, argued that research studies had provided little
support for the idea that the relationship between positive affect and negative affect might
be independent rather than bipolar (i.e., opposite ends of a unidimensional spectrum).
According to Carmines and Zeller (1979), evidence of spurious (i.e., artifactual) factors
based on keying/wording would include (1) high correlations between the “positive” and
“negative” factors, and (2) similar correlational patterns of these with external (criterion)
variables.
This approach is illustrated in Roberts, Lewinsohn, and Seeley (1993), who
investigated the dimensionality of the UCLA Loneliness scale (Russell, Peplau, &
Cutrona, 1980) using data collected from 1,710 high school students. The measure
consisted of eight items, half negatively keyed (one negatively worded) and half
positively keyed (again, one negatively worded); there were four response options
ranging from Never to Often. The sample was randomly split into halves so that an initial
PCA could be followed up with a CFA. As hypothesized, results of the PCA yielded two
components defined by item keying direction; in the follow-up two-factor CFA, the
correlation between the factors was high (.72). Roberts and colleagues then used
theoretically relevant external variables (e.g., depression; social skills; social
competence) to determine whether the observed factor structure might be artifactual (as
recommended by Carmines and Zeller). For almost all variables, there was little variation
among correlations with Loneliness scores based on all items, positive items, and
negative items. Thus the authors concluded that the two-factor solution was “…largely an
artifact of the attempt to counter response set by using items with both negative and
positive valence” (p. 1388).
47
Several researchers have interpreted wording/keying-defined factors as artifactual
even in the absence of information about patterns of associations with external variables
(e.g., Motl et al., 2000; Schriesheim, Eisenbach, & Hill, 1991). In a study conducted by
Tomás and Oliver (1999), participants (640 high school students) completed Spanish
translations of the original 10-item RSE (balanced; 4-point Likert scale). Nine competing
CFA models were fit to the data, the best-fitting of which were Model 6 (CTCU) and
Model 9 (CTCM with two method factors; i.e., full bifactor). The authors suggested that
the results likely reflected the presence of method effects, but added a caveat: “To further
analyze this question, it would be useful to relate self-esteem as defined in each of the
models here to other trait measures with positively and negatively worded items.” (p. 95).
The Item Extremity Explanation. Spector and colleagues (1997) showed that
artifactual multidimensionality can result through a certain kind of interaction between
item and respondent characteristics. Naturally, respondents vary in the amount of a target
construct (e.g., job satisfaction) they possess. Similarly, measurement items vary in
strength of wording/content; “extreme” items are those that are so strongly worded that
they may be difficult for respondents to endorse (regardless of keying). The concept can
be illustrated with two extreme items used in the Spector et al. study: “I loathe my job”
and “I am in love with my job.” In the study, real and simulated data were used to
demonstrate that if items on a balanced scale are extreme relative to where most
respondents fall on the underlying construct, people’s valid responses may appear
inconsistent across negative/positive items. For example, a respondent very high on job
satisfaction might give “consistent” responses by agreeing with “I am in love with my
job” and disagreeing with “I loathe my job.” However, respondents with more moderate
48
levels of job satisfaction—who would presumably outnumber extreme responders—
would likely disagree with both items. As explained by Spector et al. (1997), this
combination of response patterns would likely result in higher correlations within items
sets (positive and negative) than across item sets, leading to an artifactual two-factor
solution:
Therefore, the appearance of two factors depends upon the joint distributions of
both items and people on the underlying measurement continuum. If the items are
extreme relative to where most people are..., and the people are spread throughout
the continuum, there will be a mix of people who are consistent and inconsistent
in agreeing with items on opposite ends of the continuum. Correlations between
items at opposite ends of the continuum will be attenuated, while correlations
between items at the same end will be relatively strong. As a result, artifactual
factors would appear based on the response patterns to these items. Specifically,
these factors merely reflect the greater magnitude of correlation within versus
across item type based on the distributions of responses to items rather than
multiple constructs. (p. 664)
According to Spector et al. (1997), the above scenario is quite plausible because “…the
use of [some] extreme items in bipolar scales of unidimensional constructs is often
necessary….when one intends to distinguish individuals who are extreme on the
construct from those who are moderate” (p. 676). Thus the above-described joint
distribution of people and items, which is likely to be the rule rather than the exception,
can be expected to result in artifactual multidimensionality.
49
An interaction between item keying and item extremity was also evident in a
study by McPherson and Mohr (2005). Participants (N=277; mostly women) were
students enrolled in undergraduate psychology courses. Each participant was
administered either the original LOT or a “moderate” version of it (LOT-M) created by
the replacement or insertion of words (e.g., “I’m always optimistic” became “I’m usually
optimistic”). A validity check of the relative extremity of the LOT and LOT-M items
(embedded among other items) was performed by graduate students. Both scales were
balanced (eight items total) and used a 5-point response scale. Based on an initial
ANOVA, “The hypothesis that negatively keyed item means tend to become larger
relative to positively keyed item means as item extremity increases [was] thus supported.
The tendency for this effect to be reversed as items become less extreme [was] also
evident” (p. 124). Next, monopolar “disagreeing” and “agreeing” respondents were
identified as those whose raw positive and negative subscale scores fell to the same side
of the subscales’ midpoint. In other words, individuals who tended to agree with all items
(or disagree with all items) regardless of wording direction were flagged as exhibiting a
monopolar (i.e., acquiescent) response style. Results (more disagreeing respondents on
the LOT; more agreeing respondents on the LOT-M) “supported the suggestion that the
less extreme items in the LOT–M could also result in a greater tendency for respondents
to agree with items keyed in both directions” (p. 125).
McPherson and Mohr (2005) then tested one- and two-factor CFA models with
both data sets. The unidimensional model fit the LOT-M data better than the LOT data,
though fit statistics were not acceptable with either data set (the fit of the model to the
LOT data did improve after removal of data from “disagreeing” respondents). The two-
50
factor model (factors defined by keying) represented a better fit to both data sets; based
on the chi-square statistic, the fit to the LOT-M data was adequate while the fit to the
LOT data was not. The interfactor correlation was also higher for the LOT-M (.70) than
for the LOT (.59), lending support to the claims of Spector et al. (1997). In other words,
data from both balanced scales yielded two wording-based artifactors; but for the version
of the LOT with the more extreme items, the two factors were more distinct.
The Careless Responding Explanation. Based on the results of an acquiescence
study, Couch and Keniston (1960) suggested that yea-saying response patterns might be
related to impulsivity. A similar idea was explored by Schmitt and Stults (1985), who
hypothesized that factors associated with negative keying could emerge due to careless
responding (i.e., strong satisficing). They defined a careless respondent as one who “…is
simply reading a few of the items in a measuring instrument, inferring what it is the items
are asking of the respondent, and then responding in like manner to the remainder of the
items in the instrument” (p. 367). Simulated data sets of 400 were generated based on
five careless responding conditions (0%, 5%, 10%, 15%, and 20%). Results indicated that
a negative keying factor would emerge if at least 10% of respondents used a consistently
careless response style. Schmitt and Stults (1985) acknowledged that their simulated
careless responding patterns might not be entirely realistic, but they encouraged
researchers to take steps to minimize, screen for, and control for careless responding.
The findings of the above study were confirmed by Woods (2006), who
conducted a CFA-based simulation study in which sample size (250; 500; 1,000) and
proportion of careless respondents (0%; 5%; 10% 20%; 30%) were systematically varied.
Data were generated for 23 items (10 negatively keyed) on a unidimensional measure
51
with two response options (e.g., True/False); item parameters were based on a 2PL IRT
model and drawn from a normal distribution. Careless responders were simulated by
switching 0 to 1 and 1 to 0 for the reverse-keyed items. One- and two-factor models were
fit to all data sets, and fit indices for each of the 15 conditions were averaged over 1,000
replications. In summarizing her results, Woods (2006) concluded that “…if at least
about 10% respond to [negatively-keyed] items carelessly, researchers are likely to reject
a one-factor model for [data based on] a unidimensional scale” (p. 189). Thus the
possibility of careless responding should be of concern to researchers, particularly when
administration conditions are relatively unstructured and participant motivation may be
suboptimal—circumstances that are likely to lead to satisficing (Krosnick, 1991).
The Response Style/Personality Explanation. It has long been suggested that
individual response styles might be related to personality and, therefore, stable across
time/measures (e.g., Bentler et al., 1971; Cronbach, 1946). According to the response
style/personality explanation for CFA solutions with wording-based factors, systematic
variance above and beyond that associated with the target construct results not from
balanced scales or item wording per se but from individual response styles (e.g.,
acquiescence). This variance is not presumed to reflect a substantive aspect of the target
construct (as in the distinction between “optimism” and “pessimism” factors on the
LOT), but neither is it considered mere measurement noise (as assumed under the method
variance explanation). Rather, it is of substantive interest because it reflects
“…characteristics of the individual stable from time to time, [as opposed to] …transient
sets which can only be regarded as errors in testing rather than personality
characteristics” (Cronbach, 1946, p. 10). Recently, some researchers have suggested that
52
variation in response styles may occur not only across individuals, but across cultures
(e.g., Lindwall et al., 2012; Yang et al., 2010).
Several studies have found support for the idea that response styles are stable over
time, evident across measures, and/or related to personality traits. As described earlier,
Horan et al. (2003) used national longitudinal data to investigate the factor structure of
three brief attitude/affective instruments (including a 7-item version of the RSE) with
varying proportions of negatively-keyed items. Results favored a model with three
substantive factors (intercorrelations ranged from .38 to .76) and three correlated method
factors defined by negative keying (intercorrelations ranged from .31 to .43). In their
interpretation of a separate structural model based on RSE data from three time points
(two-year intervals), the authors argued that wording/keying effects (which could not be
disentangled) were also stable over time, as stability coefficients ranged from .435 (time
1-2) to .438 (time 2-3). Horan et al. (2003) concluded that the findings were
“…consistent with the response-style hypothesis that…response effects represent a
personality trait of the respondent rather than a methodological artifact” (p. 449). The
possibility that methodological artifacts could also be stable over time was not addressed.
Similar results were reported by DiStefano and Motl (2006), who investigated
(simultaneously) the dimensionality of the RSE and the SPAS based on data from
students at two southeastern universities (N = 757). A CTCM model with two substantive
factors and two negative-wording method factors (intercorrelation = .37) fit the data
better than models with one or no method factors. In addition, scores from several
personality measures (based on summed responses to positively-worded items only) were
used to predict method effects in a series of structural path models. Most predictors (e.g.,
53
social desirability) had nonsignificant relationships with the negative method factor;
however, significant (negative) relationships were found for both fear of negative
evaluation and self-consciousness (path coefficients ranging from -.14 to -.20). Thus
there was evidence that response styles were both stable across content areas and related
to personality traits. Other studies using a similar analytic approach have also found
significant (if relatively weak) relationships between wording-based method effects and
personality traits such as emotional stability and conscientiousness (Quilty, Oakman, &
Risko, 2006) and fun seeking (DiStefano & Motl, 2009).
An alternative methodological approach was used by DiStefano, Morgan, and
Motl (2012), who analyzed responses to the RSE and seven personality scales from 752
students at two southeastern universities (it was not clear whether these were the same
data analyzed in DiStefano & Motl [2006]). A Rasch partial credit model, which assumes
unidimensionality, was employed to detect possible method effects. In addition, in a
variation on a long-established technique (e.g., Couch & Keniston, 1960), an RSE
acquiescence score was calculated for each participant (computed as the sum of all
responses, before reverse-coding, linearly transformed to a 1-100 scale). Positive RSE
items generally had higher means, more negative skewness, and more positive kurtosis,
providing “…initial evidence of agreement bias” (p. 48). The correlation between
acquiescence and global RSE scores was -.28, indicating that people with higher reported
self-esteem had lower acquiescence (i.e., yea-saying) scores. Correlations between
personality measures and RSE acquiescence scores were generally weak, though several
reached statistical significance at the .01 level (e.g., public self-consciousness: .17; fun
seeking: .12). Some correlational patterns differed by gender; for example, the correlation
54
between fun seeking and acquiescence was significant among males (.23) but not females
(.04). One shortcoming of the personality-based explanations reviewed here is the lack of
theoretical underpinnings—for example, why would fun seeking be associated with
acquiescence? In the next section, explanations based on cognitive theory are explored.
The Individual Differences in Cognition/Reading Explanation. As detailed
earlier, cognitive/psycholinguistic studies have consistently found that responding to
negated statements is more difficult than responding to affirmative statements.
Measurement researchers have provided evidence that, in addition, respondents with
lower levels of cognitive ability, reading skill, and/or education may be less able to cope
with the processing demands of negated or reversed scale items. These individual
differences may, like careless responding, affect item response distributions and lead to
wording/keying-based method factors. Aberrant responding to negative items is thought
to occur in (at least) two different ways. One is based on the satisficing theory of
Krosnick (e.g., 1991), who has consistently found that those with less education, need for
cognition, and perceived value of the measurement instrument/process are more likely to
satisfice. The second is that those with less cognitive skill are simply less able to
comprehend/respond to more complex syntactic structures.
In two studies of elementary schoolers’ responses to the Self Description
Questionnaire (SDQ; Shavelson & Marsh, 1986), Marsh (1986) investigated the extent to
which negative items (about one-sixth of the SDQ items) were associated with method
effects. Most of these items were negatively keyed but not negatively worded (e.g., “I
hate reading”). Marsh argued that in order to respond appropriately to negative items,
“…respondents may have to invoke a double negative logic that requires a higher level of
55
verbal reasoning than that required by positive items” (p. 37). Consistent with
expectations drawn from cognitive-developmental research, grade 2 students had much
more trouble with negative wording (near-zero correlations between positive and
negative items) than did older students (e.g., r = .60 for grade 5). At all grade levels, at
least some students appeared to respond aberrantly to negative items.
In a second study, Marsh (1986) conducted a series of CFAs based on SDQ
responses from a separate sample of fifth-graders (N = 559). Results supported a model in
which negative items were allowed to load on a method factor as well as their respective
substantive factors. When a reading ability factor (based on additional measures) was
added to the model, it correlated substantially (r = .42) with the method factor. Thus
children with weaker reading skills were more likely to have difficulty with negatively-
keyed items. Marsh advised that such items should not be counted in scoring because, at
least for children, “the variance in responses to negative items that is valid cannot easily
be separated from variance attributable to the bias” (p. 45). In subsequent studies, Marsh
(1996) found additional evidence that children and adolescents with less well-developed
reading skills tend to have difficulty responding accurately to negative items. The results
of Marsh (1996) were largely replicated by Dunbar, Ford, Hunt, and Der (2000), whose
research sample consisted of 812 Scottish adults.
Corwyn (2000), based on factor analysis of RSE data from five adolescent and
adult samples, reached a similar conclusion while investigating the factor structure of the
full, 10-item RSE based on five data sets. This version of the measure was balanced (five
negatively-keyed items, two of them negatively worded) and included a four-point Likert
scale (Strongly Agree to Strongly Disagree). Consistent with prior studies of the RSE, all
56
models incorporating method effects related to keying direction fit the data better than
did models without method effects. The best-fitting model was a full bifactor model that
included one substantive factor (self-esteem) and two method factors (positive and
negative keying). In the standardized solution for this model, substantive factor loadings
were consistently higher for the positive items whereas uniquenesses (i.e., error
variances) were consistently higher for the negative items.
Corwyn (2000) tested the claim that wording-based method effects decrease with
increasing verbal ability. Analyses involved a two-factor RSE model (positive versus
negative items) that demonstrated acceptable fit to five data sets. Based on a measure of
verbal ability that had been administered to the largest of the samples (several thousand
women aged 15-23 who participated in a national longitudinal study), cases were
separated into quartiles and the two-factor model was estimated for each subgroup.
Marsh’s finding was replicated: “As predicted, the correlation between the positive self-
esteem and negative self-esteem factors was higher with each consecutive increase in
verbal ability (.71, .76, .85, and .87 respectively)” (p. 367). Thus there is evidence that
among both adolescents and adults, individuals with stronger reading/verbal ability tend
to respond more consistently across positive and negative items.
One might consider educational level to be a proxy for cognitive, verbal, or
reading ability. Results from studies investigating the comparability of negative-item
responding across respondents of different educational levels have generally been
consistent with the results described above. For example, Cordery and Sevastos (1993)
investigated the dimensionality and reliability of two versions of the Job Diagnostic
Survey (JDS; Idaszak & Drasgow, 1987): the original version (15 items, five negatively
57
worded), and an all-positive revision. A form combining the two versions (the original 15
items followed by the reworded, positive versions of the five negative items) was
administered to a sample of Australian government employees (N = 3,044).
Approximately 40% of the participants had not completed high school, while the
remainder had a high school education or beyond. Data from 1,000 randomly selected
members of each subsample were analyzed. One-factor CFA results for both groups
favored the all-positive version of the JDS, which also yielded higher subscale-level
internal consistency estimates than did the original version. Analysis of consistency
scores (based on the five pairs of original-reworded items) indicated that the lower-
education group gave significantly more discrepant (i.e., incongruent) responses than did
the group with more education.
As described earlier, Melnick and Gable (1990) examined parents’ responses to
pairs of parallel items with opposite keying. They found that for all item pairs,
“consistent responders” had higher levels of education than did respondents who gave
seemingly incongruent responses. Juni et al. (1996) reported that negatively-keyed items
were problematic for a sample of inner-city clinical patients (N = 70 males; mean years of
education = 11) completing the Weak Opiate Withdrawal Scale (Haertzen, Meketon, &
Hooks, 1970). Item-total correlations were .10 or lower for 15 of 26 reversed items; for
seven of those items, item-total correlations were strongly negative (i.e., below -.15). It
was noted that “…the items with poor item-total correlations featured negative item
stems, forcing respondents to conceptualize double-negatives when choosing the ‘false’
option (Juni et al., 1996).
58
Finally, based on meta-analyses of numerous studies conducted by Schuman and
Presser (1981), Krosnick et al. (1996) found strong support for the idea that individuals
with low levels of formal education are more susceptible to acquiescent response patterns
(effect sizes for low, medium, and high levels of education: .33, .19, .18). In addition,
acquiescence effects (i.e., incongruent responding across positive and negative items)
were more prevalent among people who scored lower on a measure of nonverbal
reasoning. As noted earlier, the process of giving carefully-considered, accurate
responses on a measurement instrument requires cognitive effort (Tourangeau &
Rasinski, 1988). Individuals with lower levels of education and/or cognitive ability may
be less willing or able to expend the mental effort required; said differently, such
individuals may be more likely to satisfice. Recognition of this tendency no doubt
prompted Bass’s (1956) suggestion that researchers obtain higher-quality data by
sampling “more intelligent and critical” participants.
Evidence from Qualitative Studies
Given the variety of competing explanations posited for the differential
functioning of positive and negative items, surprisingly little research has been published
related to the cognitive processes in which respondents engage while completing
balanced attitude/affective scales. Wason (1959) reported that participants in his study
said they found negated statements more difficult to process than equivalent affirmative
statements, but this information was anecdotal in nature. Some construct validation
studies have used a think-aloud protocol with children (e.g., Cremeens, Eiser, & Blades,
2006; Gadermann, Guhn, & Zumbo, 2011), but these studies yielded little or no
information related to wording/keying effects. Certainly, scale developers use qualitative
59
approaches to explore response processes as they relate to the functioning of items;
however, it may be the case that such data do not make their way into publications. Thus
there is a need for formal qualitative research on the topic of wording/keying effects.
Study 1 Research Questions
The purpose of Study 1 is to investigate the psychometric consequences of using
negatively-worded and/or negatively-keyed items on attitude scales. Most prior studies
have neglected to distinguish between wording and keying, leaving critical measurement
questions unanswered. Is the oft-reported differential functioning of positive and negative
items related to wording direction, keying direction, or both? Specific research questions
are as follows:
• RQ#1: Do balanced scales exhibit the same psychometric properties as scales
where all items are keyed and worded in the same direction? Based on the
existing literature, it is expected that balanced scales will exhibit weaker
psychometric properties than non-balanced scales.
• RQ#2: Are there differences in the psychometric properties of balanced scales
that reverse items through the use of negative wording and keying and balanced
scales that do not? This question is important because it begins to address the
issue of whether statements such as “I feel calm,” “I do not feel calm,” and “I do
not feel anxious” elicit comparable responses from respondents. Based on the
existing literature related to balanced scales and the cognitive/linguistic
processing of grammatically negative statements, it is expected that balanced
scales using negative wording and keying will exhibit weaker psychometric
properties than balanced scales that use only one of those strategies.
60
• RQ#3: Are there differences in the psychometric properties of scales that are
balanced in terms of keying and scales that are balanced in terms of wording?
Again, this question addresses the issue of wording versus keying. Do statements
such as “I feel calm” and “I do not feel calm” elicit comparable responses? Given
the existing literature related to the cognitive/linguistic processing of
grammatically negative statements, it is expected that scales balanced in terms of
wording (but not keying) will exhibit weaker psychometric properties than scales
balanced in terms of keying (but not wording).
• RQ#4: To what extent are method effects associated with negative keying
apparent across instruments? This question can be answered for participants
completing balanced versions of multiple attitude surveys. Responses to the two
measures administered in this study will be modeled simultaneously (for a certain
subsample) in order to estimate the correlation between negative-keying method
factors across instruments. Specifically, the ODCS and SEE-R will be included in
a single confirmatory factor analytic model: The ODCS responses will be
represented by one substantive factor and one method factor based on negative
keying; the SEE-R responses will be represented by four correlated substantive
factors and one negative-keying method factor; and the two method factors will
be allowed to correlate. This approach has previously been used to estimate the
across-instrument effects of negative wording (e.g., DiStefano & Motl, 2006), but
not of negative keying. Based on prior linguistic studies demonstrating the relative
difficulty of processing grammatically negative constructions (e.g., Sherman,
1973, 1976; Wason, 1959, 1961), it seems likely that negative wording poses
61
more of a challenge to respondents than does negative keying. Thus it is expected
that the association of keying-based method effects across instruments will be
weaker than that reported by DiStefano and Motl (2006) for wording-based
method effects (.37).
Questions involving psychometric properties (research questions 1-3) will be addressed
for each of two attitude scales through analyses of dimensionality (i.e., how many factors
are supported in CFA analyses) and reliability (i.e., internal consistency) across four
wording/keying conditions. Based on the results of previous studies, it is hypothesized
that the various balanced configurations (where keying and/or wording are systematically
varied) will yield different CFA solutions (i.e., with method factors) and lower reliability
estimates than will the non-balanced configurations.
Study 2 Research Question
Why do measurement items with negative wording and/or keying elicit
differential response patterns than items that are positively worded/keyed? Given the
number of posited explanations for the differential functioning of negative and positive
items, it would be naïve to argue for a single explanatory mechanism. However, it seems
likely that response processes constitute a contributing factor. Thus the response
processes involved in completing balanced attitude scales will be explored using a think-
aloud protocol with college students. Based on the results of previous (quantitative)
cognitive/psycholinguistic studies, it is hypothesized that participants will report that the
process of responding to reversed/negated items is somehow different than the process of
responding to affirmative items. Regarding other posited explanations for the differential
functioning between positive and negative items, it seems possible that the qualitative
62
study may yield evidence related to careless responding, style/personality factors,
substantive differences between negative and affirmative items, and/or individual
differences in cognitive/reading skills (particularly given the selection criteria described
in the following section). It seems less likely that participant responses will provide
insight into such proposed phenomena as method variance and item extremity. However,
one of the benefits of qualitative research is that themes are permitted to emerge
organically, regardless of a priori expectations (Creswell & Plano Clark, 2011, p. 207).
III. Study 1
Method
Participants. Participants were incoming freshmen at a mid-sized university who
took part in mandatory, low-stakes, university-wide assessment activities in August of
2012. The measures pertinent to this study were administered to a total of 2,113 students.
Test forms were spiraled throughout testing rooms to ensure randomly representative
subsamples of comparable size. Demographic characteristics for each subsample (based
on four test conditions that will be described in detail) are presented in Table 1 below.
Materials. Two attitude measures were selected for use in the study: the 8-item
Openness to Diversity/Challenge Scale (ODCS; Pascarella, Bohr, Nora, Ranganathan,
Desler, & Bulakowski, 1994; Pascarella, Edison, Nora, Hagedorn, & Terenzini, 1996)
and a revised, 19-item version of Wang et al.’s (2003) Scale of Ethnocultural Empathy
(SEE-R; Gerstner, 2012). The ODCS, which has previously been shown to have a one-
factor structure and adequate reliability (.83) with college students, measures “…an
orientation toward enjoyment from being intellectually challenged by different ideas,
values, and perspectives as well as an appreciation of racial, cultural, and value diversity”
(Pascarella et al., 1996, p. 179). All eight ODCS items are positively keyed/worded.
The SEE, developed using a PCA approach, was designed to measure
“…empathy toward people of racial and ethnic backgrounds different from one’s own”
(Wang et al., 2003, p. 221). The SEE-R, modified by Gerstner (2012) using a CFA
approach, includes 19 of the original 31 items and has been shown to have four related
substantive factors (Acceptance of Cultural Differences; Empathic Perspective Taking;
Empathic Awareness; and Empathic Feeling and Expression) as well as a method factor
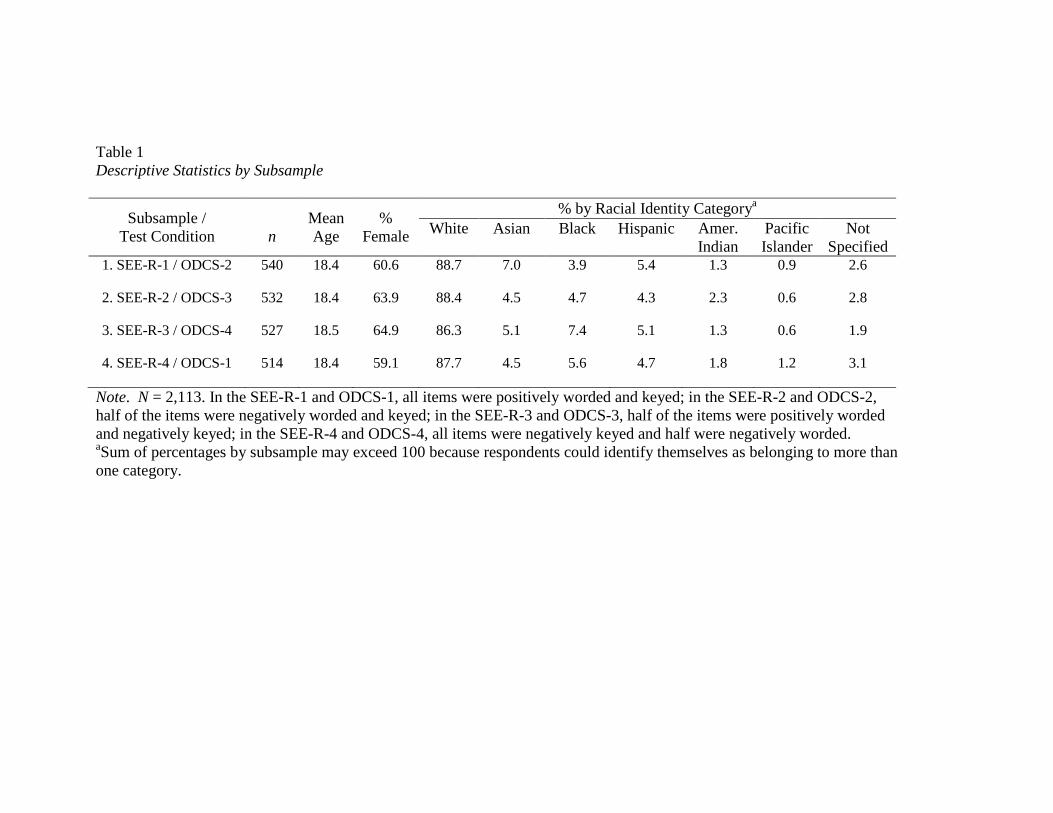
Table 1 Descriptive Statistics by Subsample
Subsample / Test Condition
n
Mean Age
% Female
% by Racial Identity Categorya White Asian Black Hispanic Amer.
Indian Pacific Islander
Not Specified
1. SEE-R-1 / ODCS-2 540 18.4 60.6 88.7 7.0 3.9 5.4 1.3 0.9 2.6
2. SEE-R-2 / ODCS-3 532 18.4 63.9 88.4 4.5 4.7 4.3 2.3 0.6 2.8
3. SEE-R-3 / ODCS-4 527 18.5 64.9 86.3 5.1 7.4 5.1 1.3 0.6 1.9
4. SEE-R-4 / ODCS-1 514 18.4 59.1 87.7 4.5 5.6 4.7 1.8 1.2 3.1
Note. N = 2,113. In the SEE-R-1 and ODCS-1, all items were positively worded and keyed; in the SEE-R-2 and ODCS-2, half of the items were negatively worded and keyed; in the SEE-R-3 and ODCS-3, half of the items were positively worded and negatively keyed; in the SEE-R-4 and ODCS-4, all items were negatively keyed and half were negatively worded. aSum of percentages by subsample may exceed 100 because respondents could identify themselves as belonging to more than one category.
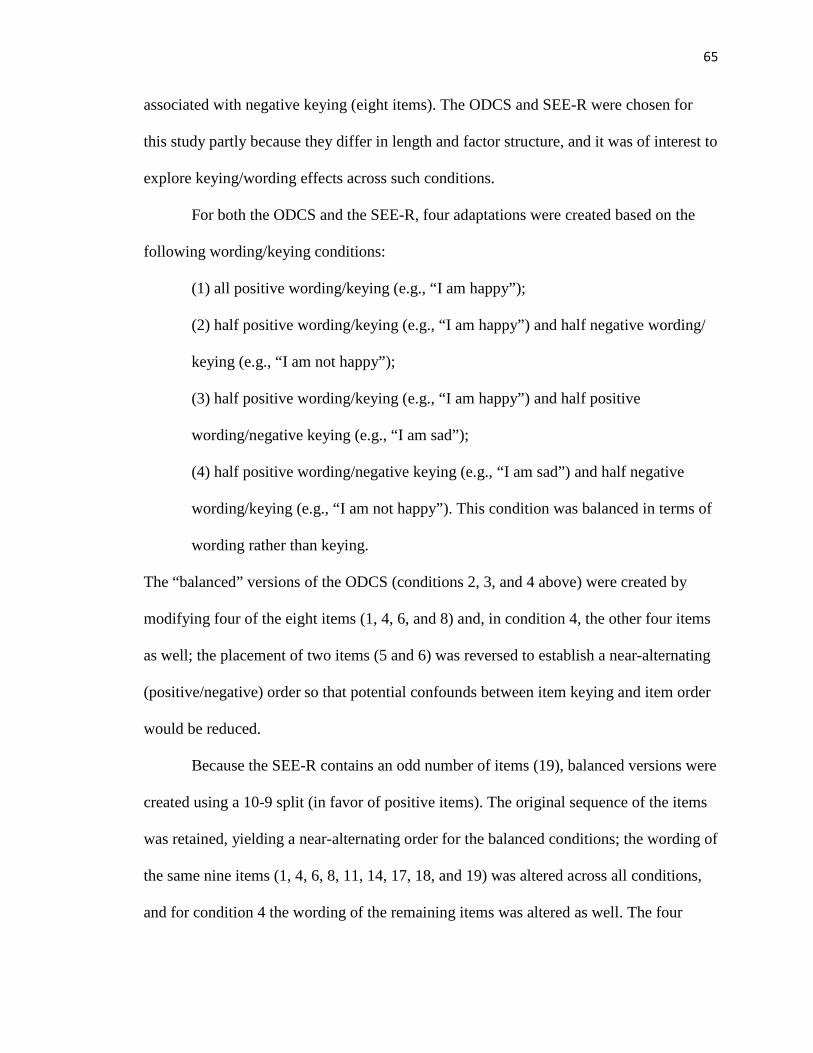
65
associated with negative keying (eight items). The ODCS and SEE-R were chosen for
this study partly because they differ in length and factor structure, and it was of interest to
explore keying/wording effects across such conditions.
For both the ODCS and the SEE-R, four adaptations were created based on the
following wording/keying conditions:
(1) all positive wording/keying (e.g., “I am happy”);
(2) half positive wording/keying (e.g., “I am happy”) and half negative wording/
keying (e.g., “I am not happy”);
(3) half positive wording/keying (e.g., “I am happy”) and half positive
wording/negative keying (e.g., “I am sad”);
(4) half positive wording/negative keying (e.g., “I am sad”) and half negative
wording/keying (e.g., “I am not happy”). This condition was balanced in terms of
wording rather than keying.
The “balanced” versions of the ODCS (conditions 2, 3, and 4 above) were created by
modifying four of the eight items (1, 4, 6, and 8) and, in condition 4, the other four items
as well; the placement of two items (5 and 6) was reversed to establish a near-alternating
(positive/negative) order so that potential confounds between item keying and item order
would be reduced.
Because the SEE-R contains an odd number of items (19), balanced versions were
created using a 10-9 split (in favor of positive items). The original sequence of the items
was retained, yielding a near-alternating order for the balanced conditions; the wording of
the same nine items (1, 4, 6, 8, 11, 14, 17, 18, and 19) was altered across all conditions,
and for condition 4 the wording of the remaining items was altered as well. The four
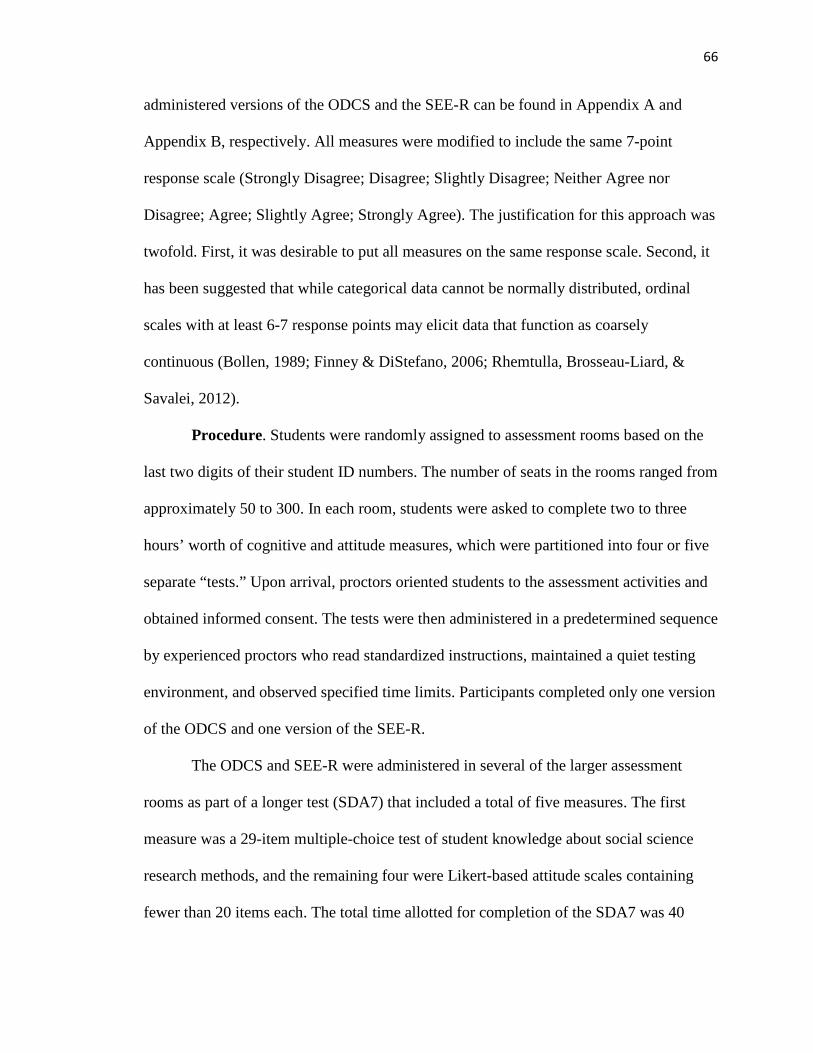
66
administered versions of the ODCS and the SEE-R can be found in Appendix A and
Appendix B, respectively. All measures were modified to include the same 7-point
response scale (Strongly Disagree; Disagree; Slightly Disagree; Neither Agree nor
Disagree; Agree; Slightly Agree; Strongly Agree). The justification for this approach was
twofold. First, it was desirable to put all measures on the same response scale. Second, it
has been suggested that while categorical data cannot be normally distributed, ordinal
scales with at least 6-7 response points may elicit data that function as coarsely
continuous (Bollen, 1989; Finney & DiStefano, 2006; Rhemtulla, Brosseau-Liard, &
Savalei, 2012).
Procedure. Students were randomly assigned to assessment rooms based on the
last two digits of their student ID numbers. The number of seats in the rooms ranged from
approximately 50 to 300. In each room, students were asked to complete two to three
hours’ worth of cognitive and attitude measures, which were partitioned into four or five
separate “tests.” Upon arrival, proctors oriented students to the assessment activities and
obtained informed consent. The tests were then administered in a predetermined sequence
by experienced proctors who read standardized instructions, maintained a quiet testing
environment, and observed specified time limits. Participants completed only one version
of the ODCS and one version of the SEE-R.
The ODCS and SEE-R were administered in several of the larger assessment
rooms as part of a longer test (SDA7) that included a total of five measures. The first
measure was a 29-item multiple-choice test of student knowledge about social science
research methods, and the remaining four were Likert-based attitude scales containing
fewer than 20 items each. The total time allotted for completion of the SDA7 was 40
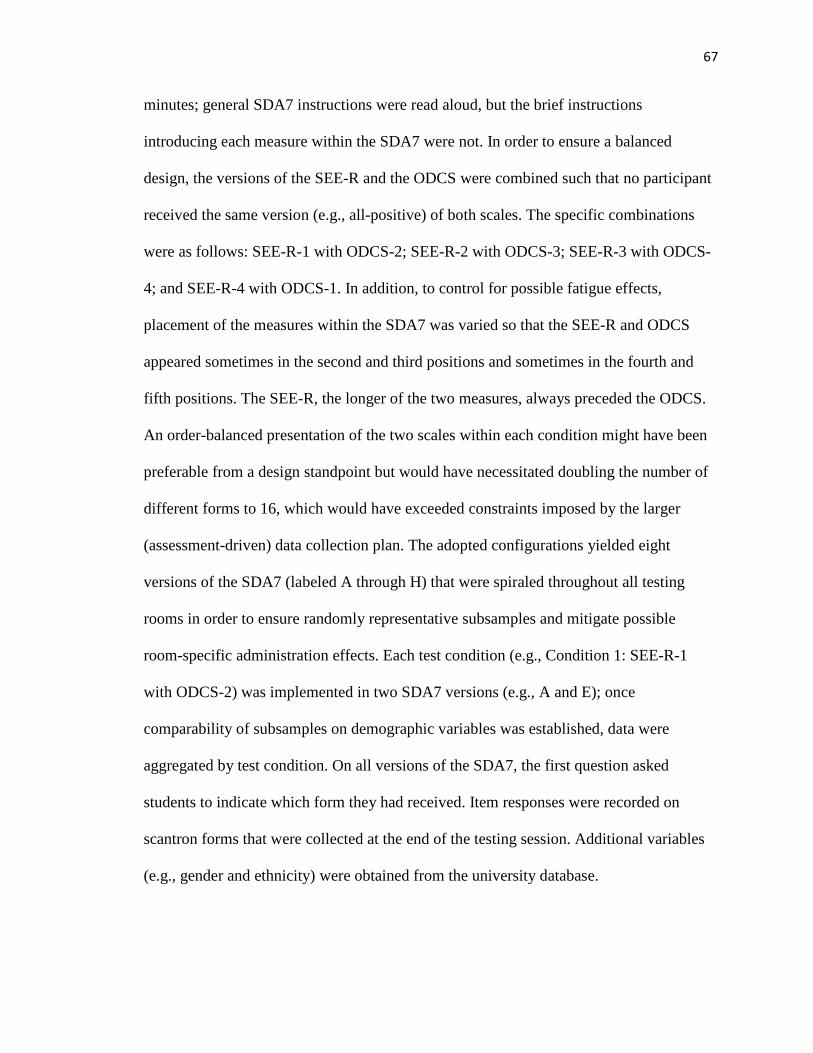
67
minutes; general SDA7 instructions were read aloud, but the brief instructions
introducing each measure within the SDA7 were not. In order to ensure a balanced
design, the versions of the SEE-R and the ODCS were combined such that no participant
received the same version (e.g., all-positive) of both scales. The specific combinations
were as follows: SEE-R-1 with ODCS-2; SEE-R-2 with ODCS-3; SEE-R-3 with ODCS-
4; and SEE-R-4 with ODCS-1. In addition, to control for possible fatigue effects,
placement of the measures within the SDA7 was varied so that the SEE-R and ODCS
appeared sometimes in the second and third positions and sometimes in the fourth and
fifth positions. The SEE-R, the longer of the two measures, always preceded the ODCS.
An order-balanced presentation of the two scales within each condition might have been
preferable from a design standpoint but would have necessitated doubling the number of
different forms to 16, which would have exceeded constraints imposed by the larger
(assessment-driven) data collection plan. The adopted configurations yielded eight
versions of the SDA7 (labeled A through H) that were spiraled throughout all testing
rooms in order to ensure randomly representative subsamples and mitigate possible
room-specific administration effects. Each test condition (e.g., Condition 1: SEE-R-1
with ODCS-2) was implemented in two SDA7 versions (e.g., A and E); once
comparability of subsamples on demographic variables was established, data were
aggregated by test condition. On all versions of the SDA7, the first question asked
students to indicate which form they had received. Item responses were recorded on
scantron forms that were collected at the end of the testing session. Additional variables
(e.g., gender and ethnicity) were obtained from the university database.
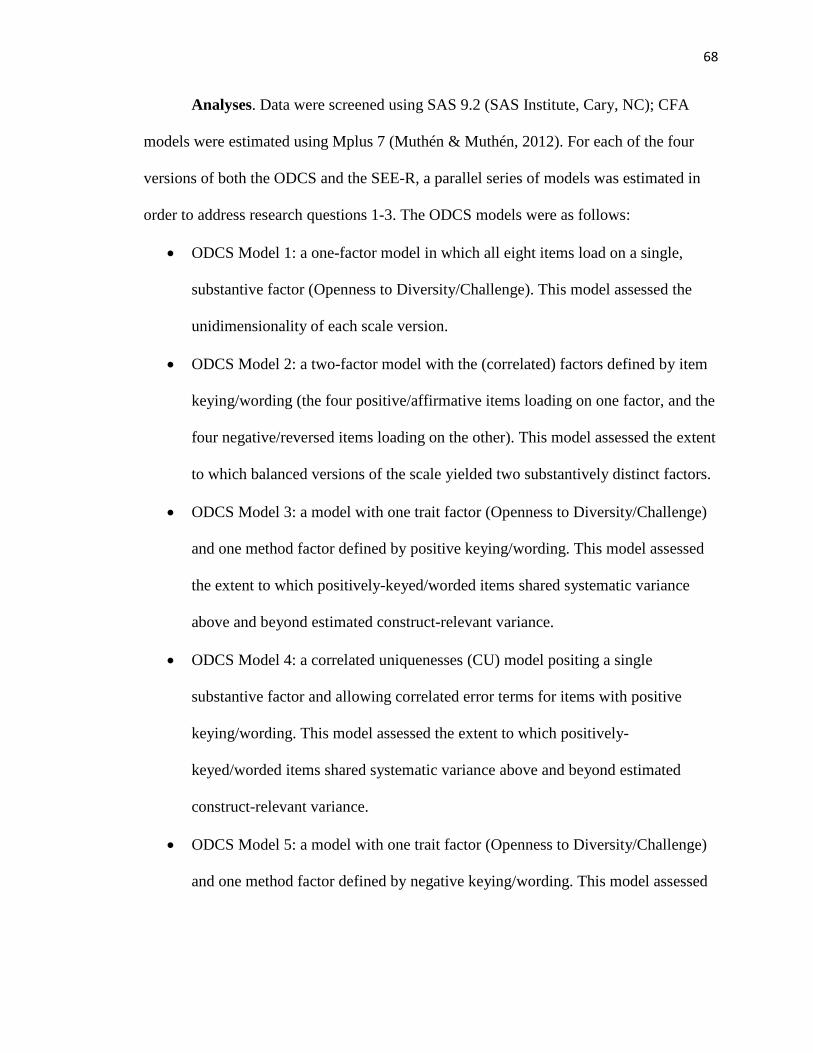
68
Analyses. Data were screened using SAS 9.2 (SAS Institute, Cary, NC); CFA
models were estimated using Mplus 7 (Muthén & Muthén, 2012). For each of the four
versions of both the ODCS and the SEE-R, a parallel series of models was estimated in
order to address research questions 1-3. The ODCS models were as follows:
• ODCS Model 1: a one-factor model in which all eight items load on a single,
substantive factor (Openness to Diversity/Challenge). This model assessed the
unidimensionality of each scale version.
• ODCS Model 2: a two-factor model with the (correlated) factors defined by item
keying/wording (the four positive/affirmative items loading on one factor, and the
four negative/reversed items loading on the other). This model assessed the extent
to which balanced versions of the scale yielded two substantively distinct factors.
• ODCS Model 3: a model with one trait factor (Openness to Diversity/Challenge)
and one method factor defined by positive keying/wording. This model assessed
the extent to which positively-keyed/worded items shared systematic variance
above and beyond estimated construct-relevant variance.
• ODCS Model 4: a correlated uniquenesses (CU) model positing a single
substantive factor and allowing correlated error terms for items with positive
keying/wording. This model assessed the extent to which positively-
keyed/worded items shared systematic variance above and beyond estimated
construct-relevant variance.
• ODCS Model 5: a model with one trait factor (Openness to Diversity/Challenge)
and one method factor defined by negative keying/wording. This model assessed
69
the extent to which negatively-keyed/worded items shared systematic variance
above and beyond estimated construct-relevant variance.
• ODCS Model 6: a correlated uniquenesses (CU) model positing a single
substantive factor (Openness to Diversity/Challenge) and allowing correlated
error terms for items with negative keying/wording. This model assessed the
extent to which negatively-keyed/worded items shared systematic variance above
and beyond estimated construct-relevant variance.
These six models are depicted graphically in Figure 1 (below).
As noted earlier, a parallel set of models was estimated for the SEE-R versions.
However, the SEE-R models differed from the ODCS models due to the more complex
structure of the SEE-R (four subscales):
• SEE-R Model 1: a four-factor model in which each of the 19 items loads on one
of four substantive (subscale) factors (Acceptance of Cultural Differences;
Empathic Perspective Taking; Empathic Awareness; Empathic Feeling and
Expression). This model assessed the extent to which data fit the “intended” (i.e.,
subscale-unidimensional) SEE-R structure. No cross-loadings were permitted.
• SEE-R Model 2: a two-factor model with the (correlated) factors defined by item
keying/wording (the ten positive/affirmative items loading on one factor, and the
nine negative/reversed items loading on the other). This model, which ignored
subscale designations, assessed the extent to which balanced versions of the scale
yielded two distinct factors defined solely by keying/wording direction. It was not
possible to assess this at the subscale level (i.e., by modeling a positive and a
70
negative factor within each subscale) because one SEE-R subscale consists of
only positive items and another consists of only negative items.
• SEE-R Model 3: a correlated traits, correlated methods (CTCM) model with four
correlated trait factors (one for each subscale) and one method factor defined by
positive keying/wording. This model assessed the extent to which positively-
keyed/worded items shared systematic variance above and beyond estimated
construct-relevant variance.
• SEE-R Model 4: a correlated traits, correlated uniquenesses (CTCU) model
positing four substantive factors (one for each subscale) and allowing correlated
error terms for items with positive keying/wording. This model assessed the
extent to which positively-keyed/worded items shared systematic variance above
and beyond estimated construct-relevant variance.
• SEE-R Model 5: a correlated traits, correlated methods (CTCM) model with four
correlated trait factors (one for each subscale) and one method factor defined by
negative keying/wording. This model assessed the extent to which negatively-
keyed/worded items shared systematic, non-subscale-driven variance.
• SEE-R Model 6: a correlated traits, correlated uniquenesses (CTCU) model
positing four correlated substantive factors (one for each subscale) and allowing
correlated error terms for items with negative keying/wording. This model
assessed the extent to which negatively-keyed/worded items shared systematic
variance above and beyond estimated construct-relevant variance.
SEE-R Models 1 and 5 are depicted graphically in Figures 2 and 3 (below). To save
space, the remaining SEE-R models are not depicted.
71
Model 1 Model 2
Model 3 Model 4
Model 5 Model 6
Figure 1. ODCS Models: Model 1 = one factor; Model 2 = two factors (Positive and Negative); Model 3 = one trait factor (ODC) and one method factor (Positive); Model 4 = one trait factor (ODC) and correlated uniquenesses (CU) among positive items; Model 5 = one trait factor (ODC) and one method factor (Negative); Model 6 = one trait factor (ODC) and correlated uniquenesses (CU) among negative items. For simplicity of presentation, error variances are not depicted. For all models, factor scaling was accomplished by setting the variance of the factors to a value of 1.0.
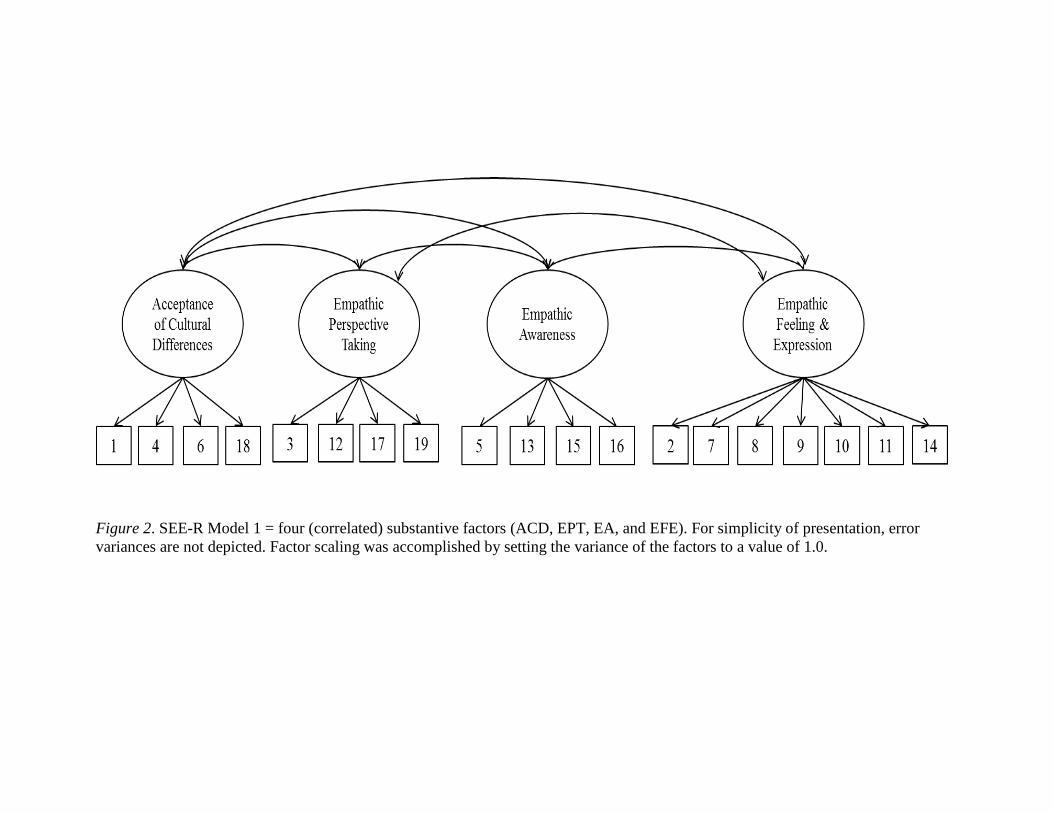
Figure 2. SEE-R Model 1 = four (correlated) substantive factors (ACD, EPT, EA, and EFE). For simplicity of presentation, error variances are not depicted. Factor scaling was accomplished by setting the variance of the factors to a value of 1.0.
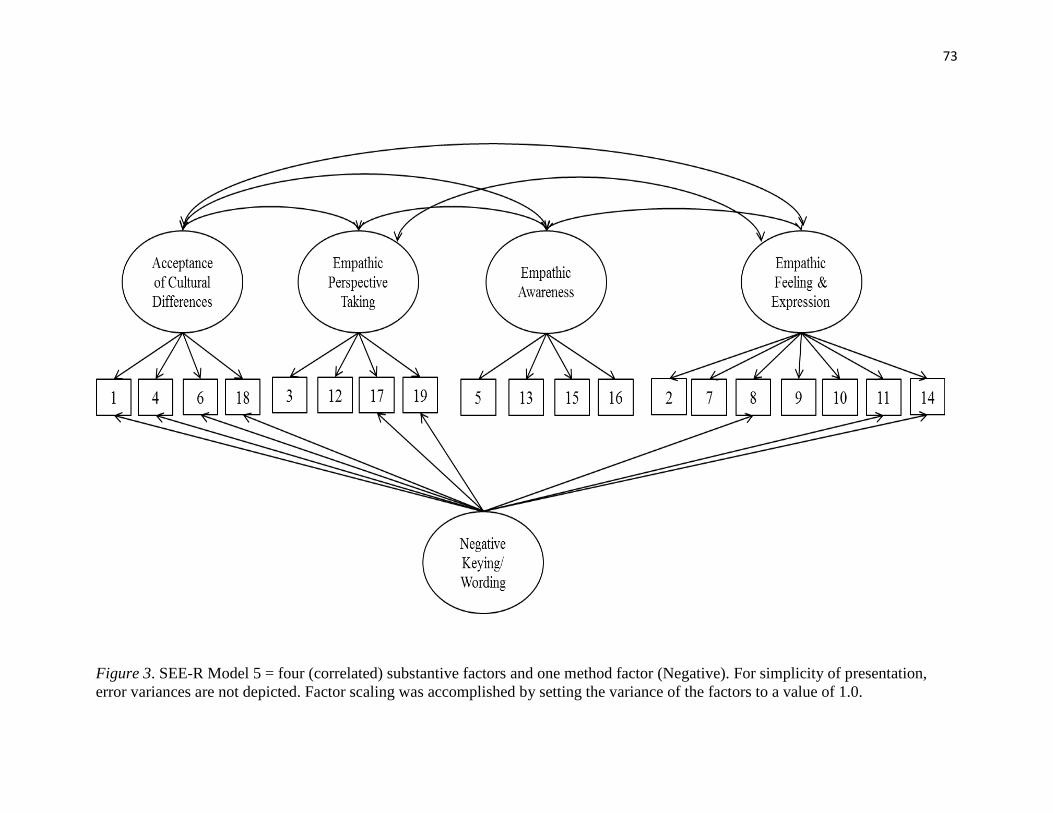
73
Figure 3. SEE-R Model 5 = four (correlated) substantive factors and one method factor (Negative). For simplicity of presentation, error variances are not depicted. Factor scaling was accomplished by setting the variance of the factors to a value of 1.0.
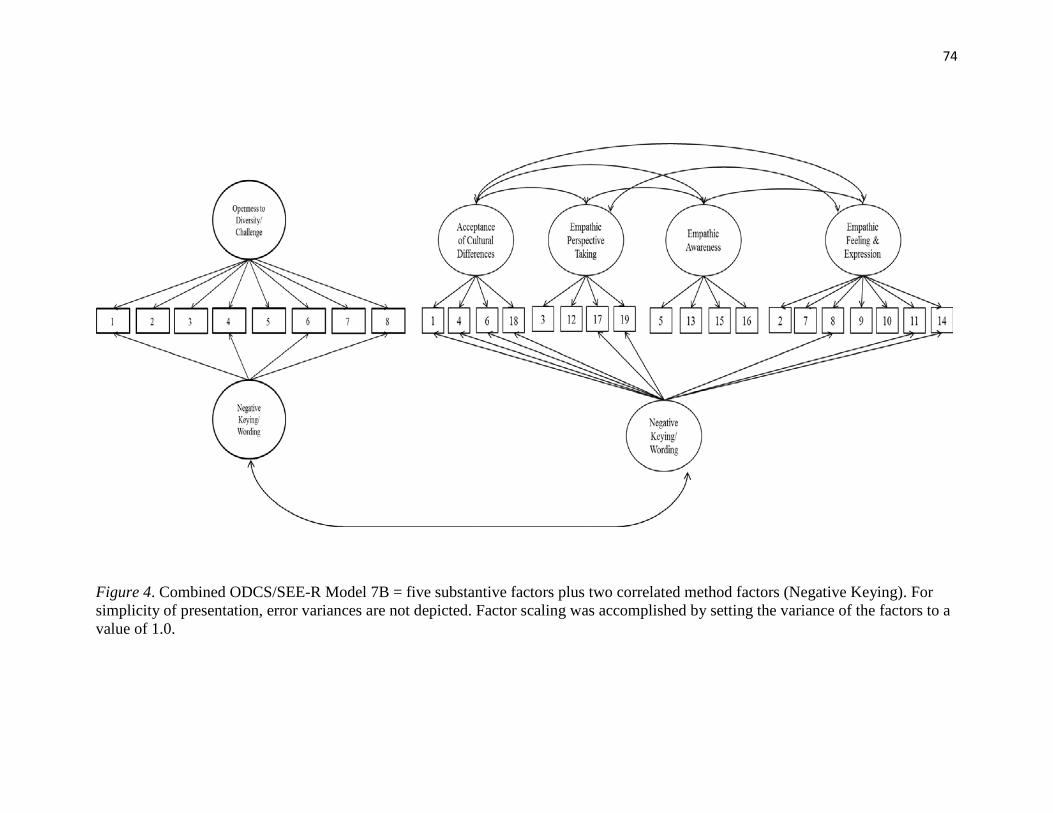
74
Figure 4. Combined ODCS/SEE-R Model 7B = five substantive factors plus two correlated method factors (Negative Keying). For simplicity of presentation, error variances are not depicted. Factor scaling was accomplished by setting the variance of the factors to a value of 1.0.
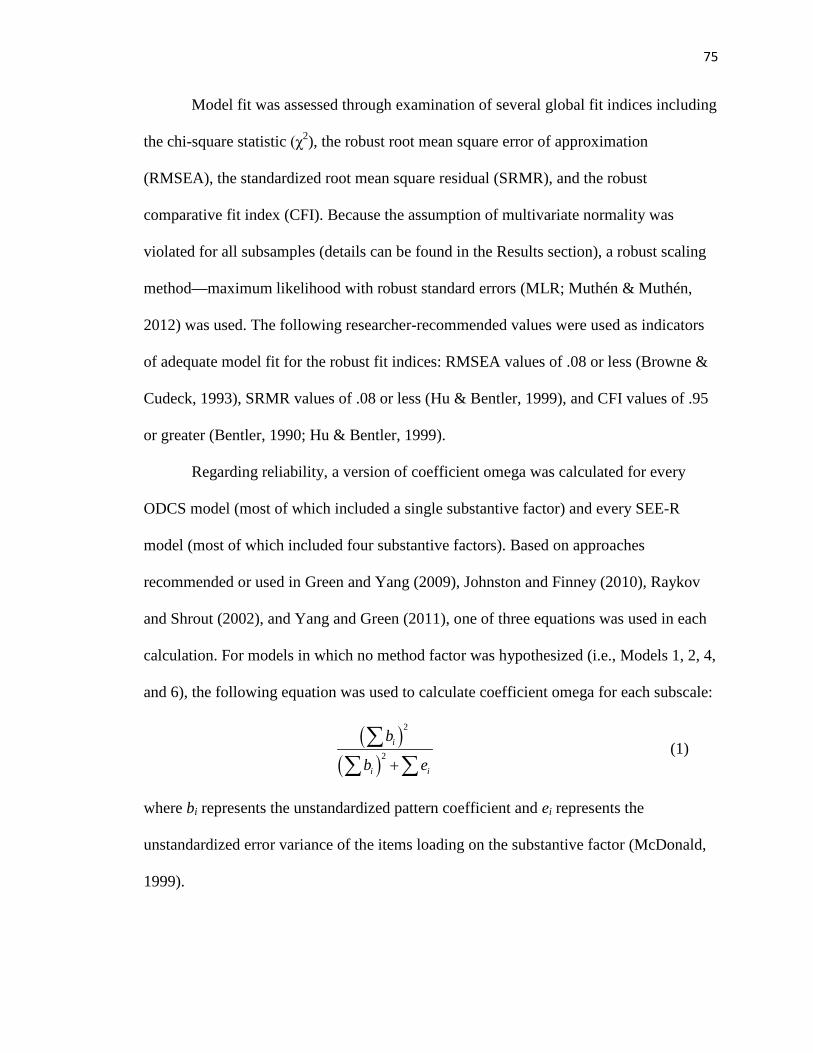
75
Model fit was assessed through examination of several global fit indices including
the chi-square statistic (χ2), the robust root mean square error of approximation
(RMSEA), the standardized root mean square residual (SRMR), and the robust
comparative fit index (CFI). Because the assumption of multivariate normality was
violated for all subsamples (details can be found in the Results section), a robust scaling
method—maximum likelihood with robust standard errors (MLR; Muthén & Muthén,
2012) was used. The following researcher-recommended values were used as indicators
of adequate model fit for the robust fit indices: RMSEA values of .08 or less (Browne &
Cudeck, 1993), SRMR values of .08 or less (Hu & Bentler, 1999), and CFI values of .95
or greater (Bentler, 1990; Hu & Bentler, 1999).
Regarding reliability, a version of coefficient omega was calculated for every
ODCS model (most of which included a single substantive factor) and every SEE-R
model (most of which included four substantive factors). Based on approaches
recommended or used in Green and Yang (2009), Johnston and Finney (2010), Raykov
and Shrout (2002), and Yang and Green (2011), one of three equations was used in each
calculation. For models in which no method factor was hypothesized (i.e., Models 1, 2, 4,
and 6), the following equation was used to calculate coefficient omega for each subscale:
( )
( )
2
2i
i i
b
b e+
∑∑ ∑
(1)
where bi represents the unstandardized pattern coefficient and ei represents the
unstandardized error variance of the items loading on the substantive factor (McDonald,
1999).
76
For Models 3 and 5, in which a method factor was hypothesized, the following
equation was used to calculate coefficient omega for each subscale:
( )( ) ( )
2
22i
i i j
b
b e b+ +
∑∑ ∑ ∑
(2)
where bi represents the unstandardized pattern coefficient, ei represents the
unstandardized error variance of the items loading on the substantive factor, and bj
represents the unstandardized pattern coefficient reflecting the relationship between the
“reversed” item on the subscale and the negative wording/keying method factor (Bentler,
2009). The advantage of this approach is that it takes into account (in the denominator)
the systematic variance associated with the method effect.
A similar equation was used to calculate reliability for Models 4 and 6, in which
correlated error terms were allowed:
( )( ) ( )
2
22 ( )
i
i i i k
b
b e Cov e e+ +
∑∑ ∑ ∑
(3)
where bi represents the unstandardized pattern coefficient, ei represents the
unstandardized error variance of the items loading on the substantive factor, and Cov(eiek)
represents the unstandardized covariance associated with correlated error terms (Raykov
& Shrout, 2002; Yang & Green, 2011). Once again, the advantage of this approach is that
it takes into account (in the denominator) the systematic variance associated with shared
variance presumed to be related to wording/keying.
Regarding research question 4, some participants were administered balanced
versions of both the ODCS and the SEE-R. Using data from a subset of these
participants, both measures were modeled simultaneously in a CTCM configuration to
77
estimate the correlation between keying-based method factors across the two instruments.
The baseline structure of those “combined” models is depicted in Figure 4 (above). Two
versions of the combined model were estimated: one in which substantive factors were
permitted to covary across instruments (Model 7A), and one in which they were not
(Model 7B, shown in Figure 4). Given the similarity of the SEE-R and ODCS target
constructs (ethnocultural empathy and openness to diversity/challenge), it was anticipated
that the former model would fit the data significantly better.
The specific instrument combination involved in the combined models was the
SEE-R-2 and the ODCS-3. The SEE-R-2 method factor was associated with negatively-
keyed and -worded items, while the ODCS-3 method factor was associated with items
that were negatively keyed but positively worded. Thus the method factor correlation in
both models (7A and 7B) represented the association of negative keying effects across the
two instruments. Because linguistic studies have repeatedly demonstrated the relative
difficulty of processing/comprehending negatively-worded statements (e.g., Sherman,
1973, 1976; Wason, 1959, 1961), it seemed likely that negative wording would be a more
salient factor than negative keying in method effects. It was therefore expected that the
association of negative keying effects across the SEE-R and ODCS would be relatively
weak (i.e., less than the .37 reported by DiStefano and Motl [2006] for the association of
negative wording effects across personality measures).
78
Results
Item-Level Descriptive Statistics. Descriptive statistics for items from all
versions of the ODCS and SEE-R (based on all available data) are presented below in
Tables 2 and 3; correlation matrices can be found in Appendix F. Regarding normality,
skewness and kurtosis values were within normal limits (absolute values less than 2 and
7, respectively). However, as noted earlier, data were multivariate nonnormal for all
subsamples. Mardia’s standardized coefficient for multivariate kurtosis was well above
the recommended cutoff of 3 in each condition: ODCS-1, 39.91; ODCS-2, 22.51; ODCS-
3, 29.45; ODCS-4, 29.60; SEE-R-1, 51.57; SEE-R-2, 43.14; SEE-R-3, 44.06; SEE-R-4,
38.69. Thus the Mplus MLR estimator, which is appropriate for datasets that are
nonnormal and/or incomplete (missingness was estimated at 2% or less for all
conditions), was used for all CFA models.
Among positively-keyed ODCS and SEE-R items, means were somewhat above
the midpoint of the 7-point response scale (indicating a tendency toward agreement with
those items). Among reversed items (i.e., those with negative keying), a parallel tendency
toward disagreement was evident. For example, the mean for SEE-R item 1 was 5.38
when it was positively keyed (condition 1). In the remaining conditions, when it was
negatively keyed, (raw) item 1 mean values were 2.82, 3.11, and 3.12.
Confirmatory Factor Analyses. Six models were estimated for each ODCS and
SEE-R scale version, even in cases where fit might be expected to be poor. For example,
it seemed unlikely that any model specifying a method factor (i.e., Model 3 or 5) would
outperform a substantive-only model for a scale where all items were positively keyed
and worded. The fit of such a model (with method factor loadings to items that were
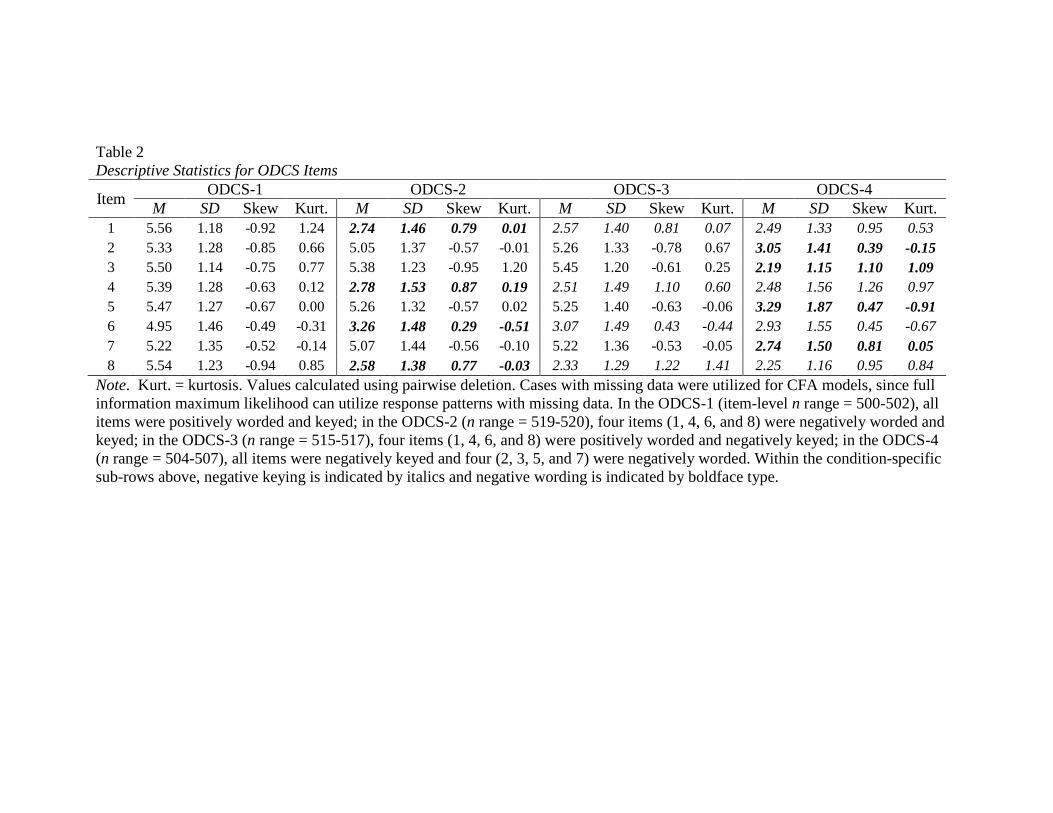
Table 2 Descriptive Statistics for ODCS Items
Item ODCS-1 ODCS-2 ODCS-3 ODCS-4
M SD Skew Kurt. M SD Skew Kurt. M SD Skew Kurt. M SD Skew Kurt. 1 5.56 1.18 -0.92 1.24 2.74 1.46 0.79 0.01 2.57 1.40 0.81 0.07 2.49 1.33 0.95 0.53 2 5.33 1.28 -0.85 0.66 5.05 1.37 -0.57 -0.01 5.26 1.33 -0.78 0.67 3.05 1.41 0.39 -0.15 3 5.50 1.14 -0.75 0.77 5.38 1.23 -0.95 1.20 5.45 1.20 -0.61 0.25 2.19 1.15 1.10 1.09 4 5.39 1.28 -0.63 0.12 2.78 1.53 0.87 0.19 2.51 1.49 1.10 0.60 2.48 1.56 1.26 0.97 5 5.47 1.27 -0.67 0.00 5.26 1.32 -0.57 0.02 5.25 1.40 -0.63 -0.06 3.29 1.87 0.47 -0.91 6 4.95 1.46 -0.49 -0.31 3.26 1.48 0.29 -0.51 3.07 1.49 0.43 -0.44 2.93 1.55 0.45 -0.67 7 5.22 1.35 -0.52 -0.14 5.07 1.44 -0.56 -0.10 5.22 1.36 -0.53 -0.05 2.74 1.50 0.81 0.05 8 5.54 1.23 -0.94 0.85 2.58 1.38 0.77 -0.03 2.33 1.29 1.22 1.41 2.25 1.16 0.95 0.84
Note. Kurt. = kurtosis. Values calculated using pairwise deletion. Cases with missing data were utilized for CFA models, since full information maximum likelihood can utilize response patterns with missing data. In the ODCS-1 (item-level n range = 500-502), all items were positively worded and keyed; in the ODCS-2 (n range = 519-520), four items (1, 4, 6, and 8) were negatively worded and keyed; in the ODCS-3 (n range = 515-517), four items (1, 4, 6, and 8) were positively worded and negatively keyed; in the ODCS-4 (n range = 504-507), all items were negatively keyed and four (2, 3, 5, and 7) were negatively worded. Within the condition-specific sub-rows above, negative keying is indicated by italics and negative wording is indicated by boldface type.
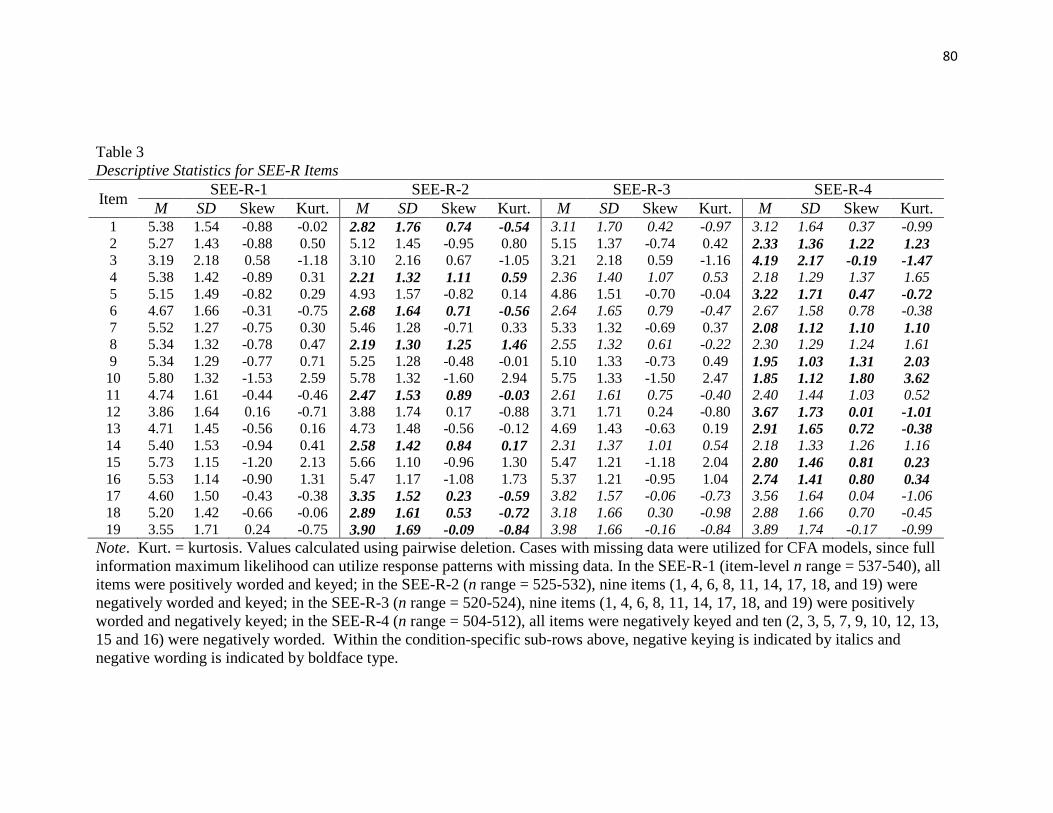
80
Table 3 Descriptive Statistics for SEE-R Items
Item SEE-R-1 SEE-R-2 SEE-R-3 SEE-R-4 M SD Skew Kurt. M SD Skew Kurt. M SD Skew Kurt. M SD Skew Kurt.
1 5.38 1.54 -0.88 -0.02 2.82 1.76 0.74 -0.54 3.11 1.70 0.42 -0.97 3.12 1.64 0.37 -0.99 2 5.27 1.43 -0.88 0.50 5.12 1.45 -0.95 0.80 5.15 1.37 -0.74 0.42 2.33 1.36 1.22 1.23 3 3.19 2.18 0.58 -1.18 3.10 2.16 0.67 -1.05 3.21 2.18 0.59 -1.16 4.19 2.17 -0.19 -1.47 4 5.38 1.42 -0.89 0.31 2.21 1.32 1.11 0.59 2.36 1.40 1.07 0.53 2.18 1.29 1.37 1.65 5 5.15 1.49 -0.82 0.29 4.93 1.57 -0.82 0.14 4.86 1.51 -0.70 -0.04 3.22 1.71 0.47 -0.72 6 4.67 1.66 -0.31 -0.75 2.68 1.64 0.71 -0.56 2.64 1.65 0.79 -0.47 2.67 1.58 0.78 -0.38 7 5.52 1.27 -0.75 0.30 5.46 1.28 -0.71 0.33 5.33 1.32 -0.69 0.37 2.08 1.12 1.10 1.10 8 5.34 1.32 -0.78 0.47 2.19 1.30 1.25 1.46 2.55 1.32 0.61 -0.22 2.30 1.29 1.24 1.61 9 5.34 1.29 -0.77 0.71 5.25 1.28 -0.48 -0.01 5.10 1.33 -0.73 0.49 1.95 1.03 1.31 2.03
10 5.80 1.32 -1.53 2.59 5.78 1.32 -1.60 2.94 5.75 1.33 -1.50 2.47 1.85 1.12 1.80 3.62 11 4.74 1.61 -0.44 -0.46 2.47 1.53 0.89 -0.03 2.61 1.61 0.75 -0.40 2.40 1.44 1.03 0.52 12 3.86 1.64 0.16 -0.71 3.88 1.74 0.17 -0.88 3.71 1.71 0.24 -0.80 3.67 1.73 0.01 -1.01 13 4.71 1.45 -0.56 0.16 4.73 1.48 -0.56 -0.12 4.69 1.43 -0.63 0.19 2.91 1.65 0.72 -0.38 14 5.40 1.53 -0.94 0.41 2.58 1.42 0.84 0.17 2.31 1.37 1.01 0.54 2.18 1.33 1.26 1.16 15 5.73 1.15 -1.20 2.13 5.66 1.10 -0.96 1.30 5.47 1.21 -1.18 2.04 2.80 1.46 0.81 0.23 16 5.53 1.14 -0.90 1.31 5.47 1.17 -1.08 1.73 5.37 1.21 -0.95 1.04 2.74 1.41 0.80 0.34 17 4.60 1.50 -0.43 -0.38 3.35 1.52 0.23 -0.59 3.82 1.57 -0.06 -0.73 3.56 1.64 0.04 -1.06 18 5.20 1.42 -0.66 -0.06 2.89 1.61 0.53 -0.72 3.18 1.66 0.30 -0.98 2.88 1.66 0.70 -0.45 19 3.55 1.71 0.24 -0.75 3.90 1.69 -0.09 -0.84 3.98 1.66 -0.16 -0.84 3.89 1.74 -0.17 -0.99
Note. Kurt. = kurtosis. Values calculated using pairwise deletion. Cases with missing data were utilized for CFA models, since full information maximum likelihood can utilize response patterns with missing data. In the SEE-R-1 (item-level n range = 537-540), all items were positively worded and keyed; in the SEE-R-2 (n range = 525-532), nine items (1, 4, 6, 8, 11, 14, 17, 18, and 19) were negatively worded and keyed; in the SEE-R-3 (n range = 520-524), nine items (1, 4, 6, 8, 11, 14, 17, 18, and 19) were positively worded and negatively keyed; in the SEE-R-4 (n range = 504-512), all items were negatively keyed and ten (2, 3, 5, 7, 9, 10, 12, 13, 15 and 16) were negatively worded. Within the condition-specific sub-rows above, negative keying is indicated by italics and negative wording is indicated by boldface type.
81
reversed in other adaptations of the scale) would, however, inform the interpretation of
results for the same model estimated on data from balanced versions of the scale.
Imagine, for instance, that a model positing a method effect were to adequately fit data
from both an all-positive wording/keying condition and a balanced version of the same
scale. That pattern of results would suggest that the “method” variance might actually be
substantive, or at least attributable to something other than wording/keying. In short, all
models were estimated in order to safeguard against overinterpretation of method factors.
Estimation problems were expected—and encountered—for certain model-data
combinations (see above paragraph). In these situations, models were re-estimated with
maximized iterations and (when provided) Mplus-suggested start values. These
strategies, which never resulted in convergence, were followed by a review of item
content and statistical results (e.g., correlations and standardized residuals); in cases
where a minor modification (e.g., the elimination of one correlated residual) was deemed
justifiable, it was made in an effort to obtain convergence. Occasionally, minor
modifications were successful. When they were not, statistical results for the models in
question were not reported. This conservative approach was adopted because the focus of
the study was not on validation or revision of the administered scales. Rather, the goal
was to examine the psychometric consequences of certain keying/wording conditions on
the models that might typically be used to assess their validity/reliability. Thus it was
important to retain comparability of models across scales and scale versions as much as
possible.
In the following paragraphs, CFA results will be delineated by instrument and
scale version. For each data condition (e.g., ODCS-2), the relative fit of the competing
82
model(s) will be discussed along with reliability estimates. Tables 4 and 5 (below)
include fit statistics and reliability estimates for all ODCS and SEE-R models,
respectively. Table 6 includes fit statistics for the combined SEE-R/ODCS models.
Parameter estimates for selected models can be found in Appendix G.
ODCS-1 Models. The ODCS-1 was identical to the published version of the
ODCS except that the order of items 5 and 6 had been switched. Because all items were
positively worded and keyed, it was expected that Model 1 (SUB; positing a single
substantive factor and no correlated errors or method factor) would fit the observed data.
However, it did not—although all factor loadings were statistically significant and in the
expected direction. In fact, Table 4 shows that none of the ODCS-1 models exhibited
acceptable fit (e.g., RMSEA > .10). Model 5 (METH-) yielded similarly poor fit statistics
to those for Model 1, whereas the CU models (4 and 6) did slightly better in terms of
most indices. Models 2 (POS/NEG) and 3 (METH+) did not converge. Reliability
estimates for all converging models ranged from .86 to .88 and were slightly higher than
the coefficient alpha values (.83-.84) reported by Pascarella et al. (1996) for their one-
factor model.
A review of standardized residuals for ODCS-1 Model 1 indicated that several
pairs of items shared significant variance beyond that accounted for by the substantive
factor. Most of these item pairs were similar in terms of semantic and/or lexical content
(e.g., #6. I enjoy taking courses that challenge my beliefs and values.; and #8. I enjoy
courses that are intellectually challenging.). In short, the ODCS-1 results—particularly
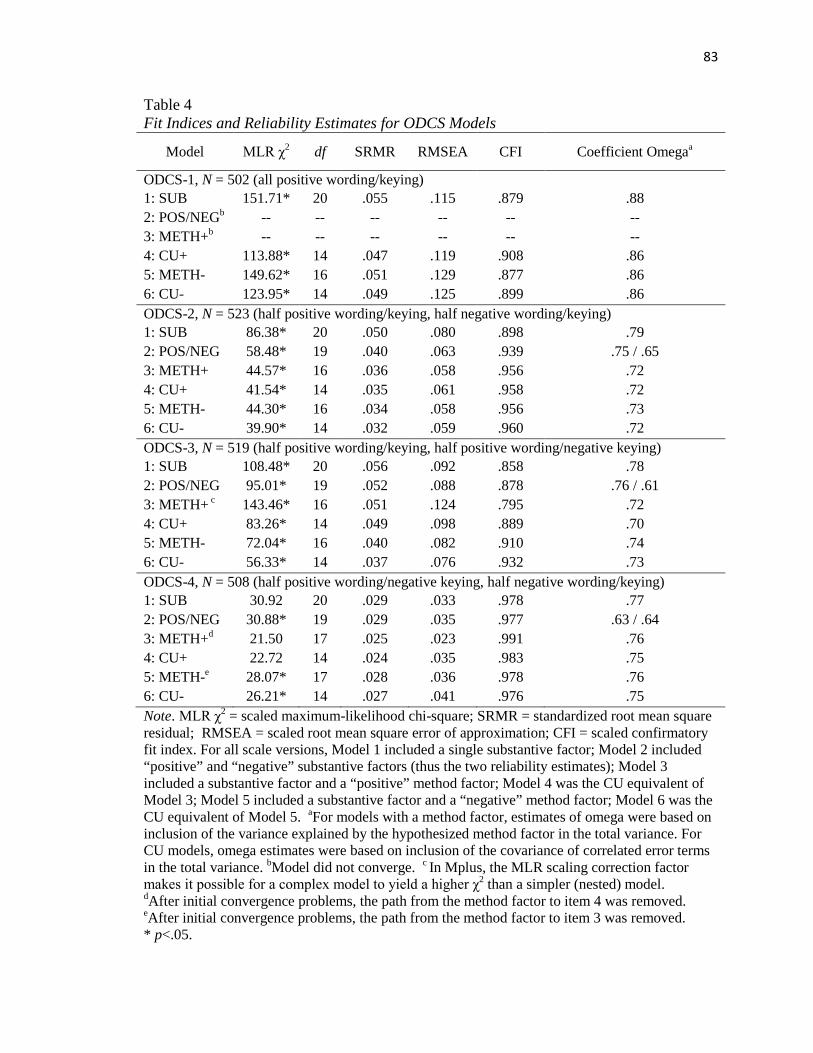
83
Table 4 Fit Indices and Reliability Estimates for ODCS Models
Model MLR χ2 df SRMR RMSEA CFI Coefficient Omegaa
ODCS-1, N = 502 (all positive wording/keying)
1: SUB 151.71* 20 .055 .115 .879 .88 2: POS/NEGb -- -- -- -- -- -- 3: METH+b -- -- -- -- -- -- 4: CU+ 113.88* 14 .047 .119 .908 .86 5: METH- 149.62* 16 .051 .129 .877 .86 6: CU- 123.95* 14 .049 .125 .899 .86 ODCS-2, N = 523 (half positive wording/keying, half negative wording/keying)
1: SUB 86.38* 20 .050 .080 .898 .79 2: POS/NEG 58.48* 19 .040 .063 .939 .75 / .65 3: METH+ 44.57* 16 .036 .058 .956 .72 4: CU+ 41.54* 14 .035 .061 .958 .72 5: METH- 44.30* 16 .034 .058 .956 .73 6: CU- 39.90* 14 .032 .059 .960 .72 ODCS-3, N = 519 (half positive wording/keying, half positive wording/negative keying)
1: SUB 108.48* 20 .056 .092 .858 .78 2: POS/NEG 95.01* 19 .052 .088 .878 .76 / .61 3: METH+ c 143.46* 16 .051 .124 .795 .72 4: CU+ 83.26* 14 .049 .098 .889 .70 5: METH- 72.04* 16 .040 .082 .910 .74 6: CU- 56.33* 14 .037 .076 .932 .73 ODCS-4, N = 508 (half positive wording/negative keying, half negative wording/keying)
1: SUB 30.92 20 .029 .033 .978 .77 2: POS/NEG 30.88* 19 .029 .035 .977 .63 / .64 3: METH+d 21.50 17 .025 .023 .991 .76 4: CU+ 22.72 14 .024 .035 .983 .75 5: METH-e 28.07* 17 .028 .036 .978 .76 6: CU- 26.21* 14 .027 .041 .976 .75 Note. MLR χ2 = scaled maximum-likelihood chi-square; SRMR = standardized root mean square residual; RMSEA = scaled root mean square error of approximation; CFI = scaled confirmatory fit index. For all scale versions, Model 1 included a single substantive factor; Model 2 included “positive” and “negative” substantive factors (thus the two reliability estimates); Model 3 included a substantive factor and a “positive” method factor; Model 4 was the CU equivalent of Model 3; Model 5 included a substantive factor and a “negative” method factor; Model 6 was the CU equivalent of Model 5. aFor models with a method factor, estimates of omega were based on inclusion of the variance explained by the hypothesized method factor in the total variance. For CU models, omega estimates were based on inclusion of the covariance of correlated error terms in the total variance. bModel did not converge. c In Mplus, the MLR scaling correction factor makes it possible for a complex model to yield a higher χ2 than a simpler (nested) model. dAfter initial convergence problems, the path from the method factor to item 4 was removed. eAfter initial convergence problems, the path from the method factor to item 3 was removed. * p<.05.
84
those for Model 1—suggest that the instrument lacks unidimensionality. This finding
may not come as a complete surprise, given that 8-item ODCS was designed to measure
openness to both diversity (e.g., people from different cultures) and challenge (e.g.,
courses that provide intellectual challenges).
ODCS-2 Models. Half of the ODCS-2 items were positively worded and keyed (2,
3, 5, and 7), while the remaining half were negatively worded and keyed (1, 4, 6, and 8).
Thus it was expected that the fit statistics for Model 1 (SUB) would be worse than those
for the other models. Such was the case, as all models exhibited adequate fit other than
Model 1 (see Table 4). The best fit statistics were obtained with Models 3 through 6
(positing method effects among positive or negative items), which yielded good fit but
weaker reliability estimates (.72-.73) than did the parallel ODCS-1 (all-positive
wording/keying) models (.86). For Models 2 through 6, all factor loadings were
statistically significant and in the expected direction. For Model 6 (CU-), two of the six
error covariances did not reach statistical significance. Both involved item 4 (Learning
about people from different cultures is not an important part of my education.). Based on
all diagnostic information, the best-fitting models appeared to be those with method
factors (3 and 5), which were close variants of one another. As noted above, the unique
variance shared by certain item pairs (e.g., 6 and 8) likely reflected more than “method
effects” associated with negative wording/keying.
ODCS-3 Models. Four of the ODCS-3 items were positively worded and keyed
(2, 3, 5, and 7), while the remaining four were positively worded and negatively keyed
(e.g., #8. I try to avoid courses that are intellectually challenging.). Said differently, the
wording was consistent throughout the instrument but the keying was balanced. Thus it
85
was expected that the fit statistics for Model 1, which posited no keying effects, would be
worse than those for the other models. In fact, the worst fit was obtained with Model 3
(METH+); Models 1 (SUB), 2 (POS/NEG), and 4 (CU+) did slightly better by most
statistical criteria but did not fit the data adequately; and Models 5 and 6 (positing
method effects among negatively-keyed items) did best, exhibiting marginally acceptable
fit. The factor loadings for Model 5 (METH-) were all statistically significant and in the
expected direction. For Model 6 (CU-), as was the case with the parallel model in the
ODCS-2 condition, two of the error covariances involving item 4 did not reach statistical
significance. Thus Model 5 seemed to provide the best fit to the observed data. Reliability
estimates for all models were similar to those observed for the ODCS-2 dataset.
RMSEA estimates were systematically higher across all ODCS-3 models (.076-
.124) than the corresponding values for models in the other balanced conditions (ODCS-2
and ODCS-4). It is worth noting that the RMSEA is believed to reflect only model
misspecification and not error due to sampling or other causes (Browne & Cudeck,
1992). The nature of the misspecification observed for the ODCS-3 models was likely
related to the manner in which item reversals were accomplished. Rather than the
simple/direct use of sentence-level negation (e.g., I do not enjoy courses that are
intellectually challenging.), this condition called for more elaborate alterations (e.g., I try
to avoid courses that are intellectually challenging.) that varied from item to item and
may have made the reversed items less cohesive as a group and less distinct from the
positively-keyed items.
ODCS-4 Models. In this condition, all items were negatively keyed; half were
positively worded (1, 4, 6, and 8), while the remainder were negatively worded (e.g.,
86
#2. The real value of a college education does not lie in being introduced to different
values.). Given that balance, it was again expected that the fit indices for Model 1 (SUB)
would be worse than those for the other models. However, as can be seen in Table 4, all
six models exhibited good overall fit (e.g., SRMR < .03; RMSEA ≤ .04; CFI > .97). The
best fit statistics were obtained with Models 3 and 4 (positing method effects associated
with negative wording), and reliability estimates for all METH and CU models were
slightly higher (.75-.76) than parallel estimates based on the other balanced scale versions
(but still lower than the .86 estimated for those models based on the all-positive
wording/keying condition). It should be noted that there were initial estimation problems
with the method-factor models, each of which converged to an admissible solution after
removal of one nonsignificant path from the method factor (to item 4 in Model 3, and to
item 3 in Model 5).
In addition to exhibiting good global fit, all six ODCS-4 models yielded
substantive factor loadings that were statistically significant and in the expected direction.
However, examination of Models 3-6 revealed several nonsignificant method factor
loadings (for the METH models) and error covariances (for the CU models). Given that
the Model 2 correlation between hypothesized POS and NEG factors was extremely high
(.96), it would be difficult to endorse any model as being superior to Model 1, which was
characterized by good global fit and the most parsimonious configuration. As anticipated
based on the literature, coefficient omega for this model was lower (.77) than for the
parallel model in the all-positive condition (.88), even though ODCS-1 Model 1 exhibited
poor fit.
87
SEE-R-1 Models. In this adapted version of the instrument, all 19 items were
positively worded and keyed. Thus it was expected that Model 1 (SUB; positing four
substantive factors and no correlated errors or method factor) would fit the observed data.
As can be seen in Table 5 (below), Model 1 exhibited marginally adequate global fit. In
addition, all factor loadings were significant and in the expected direction. Model 2
(POS/NEG) exhibited poor fit, while the CTCU models (4 and 6)—each of which
included dozens of correlated error terms—did not converge (in fact, this occurred for
both CTCU models under all SEE-R conditions). The fit statistics for the CTCM models
(3 and 5) were similar to those for Model 1. However, very few of the method factor
loadings were statistically significant, and a few were slightly negative. Thus Model 1
appeared to provide the best fit to the data from the all-positive SEE-R condition.
Coefficient omega values for that model, by subscale, were as follows: ACD = .77;
EPT = .78; EA = .75; EFE = .84. The correlation between the ACD and EFE factors was
more substantial (.83) than those among other factors (.39-.65).
SEE-R-2 Models. Ten of the SEE-R-2 items were positively worded and keyed (2,
3, 5, 7, 9, 10, 12, 13, 15, and 16), while the remaining nine items were negatively worded
and keyed (e.g., #17. I am not able to put myself in the shoes of someone who is racially
and/or ethnically different from me.). Thus it was expected that the fit statistics for Model
1 (which accounted for no wording/keying effects) and Model 2 (which ignored subscale
designations and was based solely on wording/keying direction) would be worse than
those for other models. Excluding the CTCU models, which again did not converge, such
was the case. As Table 5 shows, Model 2 exhibited poor fit; Model 1 yielded marginally
acceptable fit; and the best fit statistics were obtained with the CTCM models.
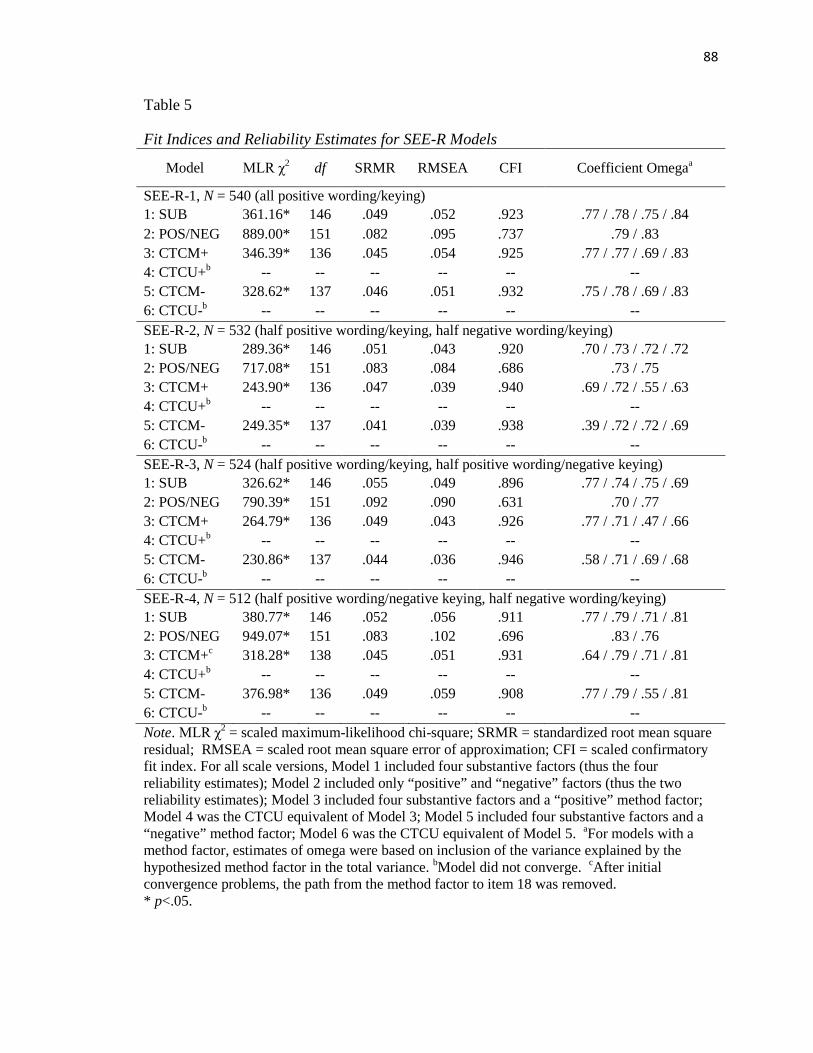
88
Table 5
Fit Indices and Reliability Estimates for SEE-R Models
Model MLR χ2 df SRMR RMSEA CFI Coefficient Omegaa
SEE-R-1, N = 540 (all positive wording/keying)
1: SUB 361.16* 146 .049 .052 .923 .77 / .78 / .75 / .84 2: POS/NEG 889.00* 151 .082 .095 .737 .79 / .83 3: CTCM+ 346.39* 136 .045 .054 .925 .77 / .77 / .69 / .83 4: CTCU+b -- -- -- -- -- -- 5: CTCM- 328.62* 137 .046 .051 .932 .75 / .78 / .69 / .83 6: CTCU-b -- -- -- -- -- -- SEE-R-2, N = 532 (half positive wording/keying, half negative wording/keying)
1: SUB 289.36* 146 .051 .043 .920 .70 / .73 / .72 / .72 2: POS/NEG 717.08* 151 .083 .084 .686 .73 / .75 3: CTCM+ 243.90* 136 .047 .039 .940 .69 / .72 / .55 / .63 4: CTCU+b -- -- -- -- -- -- 5: CTCM- 249.35* 137 .041 .039 .938 .39 / .72 / .72 / .69 6: CTCU-b -- -- -- -- -- -- SEE-R-3, N = 524 (half positive wording/keying, half positive wording/negative keying)
1: SUB 326.62* 146 .055 .049 .896 .77 / .74 / .75 / .69 2: POS/NEG 790.39* 151 .092 .090 .631 .70 / .77 3: CTCM+ 264.79* 136 .049 .043 .926 .77 / .71 / .47 / .66 4: CTCU+b -- -- -- -- -- -- 5: CTCM- 230.86* 137 .044 .036 .946 .58 / .71 / .69 / .68 6: CTCU-b -- -- -- -- -- -- SEE-R-4, N = 512 (half positive wording/negative keying, half negative wording/keying)
1: SUB 380.77* 146 .052 .056 .911 .77 / .79 / .71 / .81 2: POS/NEG 949.07* 151 .083 .102 .696 .83 / .76 3: CTCM+c 318.28* 138 .045 .051 .931 .64 / .79 / .71 / .81 4: CTCU+b -- -- -- -- -- -- 5: CTCM- 376.98* 136 .049 .059 .908 .77 / .79 / .55 / .81 6: CTCU-b -- -- -- -- -- -- Note. MLR χ2 = scaled maximum-likelihood chi-square; SRMR = standardized root mean square residual; RMSEA = scaled root mean square error of approximation; CFI = scaled confirmatory fit index. For all scale versions, Model 1 included four substantive factors (thus the four reliability estimates); Model 2 included only “positive” and “negative” factors (thus the two reliability estimates); Model 3 included four substantive factors and a “positive” method factor; Model 4 was the CTCU equivalent of Model 3; Model 5 included four substantive factors and a “negative” method factor; Model 6 was the CTCU equivalent of Model 5. aFor models with a method factor, estimates of omega were based on inclusion of the variance explained by the hypothesized method factor in the total variance. bModel did not converge. cAfter initial convergence problems, the path from the method factor to item 18 was removed. * p<.05.
89
All factor loadings were statistically significant and in the expected direction for Models
1, 3, and 5. In each model, the strongest inter-factor correlation was between ACD and
EFE (.69, .80, and .75, respectively). Reliability estimates for the converging SEE-R-2
models were systematically lower than estimates for the comparable models in the all-
positive wording/keying condition (e.g., Model 3: ACD = .77 [SEE-R-1]/.69 [SEE-R-2];
EPT = .77/.72; EA = .69/.55; EFE = .83/.63). The reader will observe that for the SEE-R-
2 CTCM model with a “negative” method factor (Model 5), coefficient omega was quite
low for the ACD subscale (.39). This result was a function of the fact that all four ACD
items (1, 4, 6, and 18) had (unstandardized) method factor loadings nearly as large as or
slightly larger than their (unstandardized) substantive factor loadings. Such a pattern
suggests that including unbalanced subscales within a larger, balanced scale may be a
suboptimal strategy from a measurement standpoint.
SEE-R-3 Models. In this condition, ten items were positively worded and keyed
(2, 3, 5, 7, 9, 10, 12, 13, 15, and 16), while the remainder were positively worded and
negatively keyed (e.g., #17. It is difficult for me to put myself in the shoes of someone
who is racially and/or ethnically different from me.). Put another way, item wording was
consistently positive and item keying was balanced (10/9). Of the four adaptations of the
SEE-R administered in this study, the SEE-R-3 was closest to the version advocated in
Gerstner (2012). Alterations were limited to the wording of three items (8; 11; 14), which
were modified slightly to meet the condition 3 balancing and wording configuration.
Given the above, it was anticipated that Model 5 (CTCM-), the model most
similar to that endorsed in Gerstner (2012), would best fit the observed data. The fit
statistics in Table 5 show that this was the case, as the CTCM- model yielded marginally
90
acceptable fit (e.g., SRMR = .044; RMSEA = .036; CFI = .946) and better fit statistics
than those obtained for Model 3 (e.g., CFI = .926), Model 1 (e.g., CFI = .896), and Model
2 (which, predictably, fit poorly). Once again, the CTCU models failed to converge. All
factor loadings for Model 5 and Model 1 were statistically significant and in the expected
direction; this was also true for Model 3, with one exception (the method factor loading
for item 10 approached, but did not reach, statistical significance). Coefficient omega
values for the best-fitting SEE-R-3 model, the CTCM- configuration, remained lower
(ACD = .58; EPT = .71; EA = .69; EFE = .68) than those for the parallel SEE-R-1 model,
and inter-factor correlations were also somewhat lower (range: .25-.45) than in conditions
1 and 2. Finally, the fit statistics and reliability estimates for Model 5 (see Table 5) were
similar to (if slightly worse than) those reported by Gerstner (2012) for her scalar
invariance model, which was based on data collected at two time points: SRMR = .047;
RMSEA = .027; CFI = .953; coefficient omega values (accounting for method variance)
for time point 1: ACD = .65; EPT = .74; EA = .71; EFE = .79.
SEE-R-4 Models. In this condition, all items were negatively keyed; nine were
positively worded (1, 4, 6, 8, 11, 14, 17, 18, 19), while the remainder were negatively
worded (e.g., #16. I do not believe that society differentially treats racial or ethnic groups
other than my own.). Given that balance, it was again expected that models accounting
for both substantive and method variance would yield the best fit. The pattern of model-
by-model global results was similar to that observed for the other balanced conditions in
Table 5 (although most of the SEE-R-4 models exhibited somewhat worse statistics).
Specifically, Models 4 and 6 did not converge; Model 2 exhibited poor fit; and the SUB,
CTCM+, and CTCM- models yielded acceptable fit to the observed data in terms of
91
SRMR and RMSEA but not in terms of CFI (after removal of the nonsignificant path
from the CTCM+ method factor to item 18). For Model 1, all substantive factor loadings
were statistically significant and in the expected direction. This was true for the CTCM
models as well; a majority of their method factor loadings, however, did not reach
statistical significance (though all method factor loadings were in the expected direction).
As was the case with the ODCS-4 models, it would be difficult to endorse any SEE-R-4
configuration as being superior to Model 1. In contrast to the results for all other balanced
scales, reliability coefficients for SEE-R-4 Model 1 (ACD = .77; EPT = .79; EA = .71;
EFE = .81) were quite comparable to those obtained for the corresponding (all-positive)
SEE-R-1 model (ACD = .77; EPT = .78; EA = .75; EFE = .84). Thus it appears that the
consistent (negative) keying in condition 4 may have served to dampen any method
effects associated with balanced wording among the items.
Combined SEE-R/ODCS Models. The combined models were based on data from
students who had been administered the SEE-R-2 (half positive wording/keying, half
negative wording/keying) and the ODCS-3 (half positive wording/keying, half positive
wording/negative keying). Models 7A and 7B were CTCM variants in which a method
factor for negative keying was specified for each instrument, and the two method factors
were allowed to covary. In Model 7A, correlations were permitted between the
substantive ODCS-3 factor and the four substantive SEE-R-2 substantive factors. In
Model 7B, these correlations were not permitted.
Statistical results for the combined models are presented in Table 6 (below).
Model 7B failed to converge even after adjustments were made. This was not
unexpected, given that the model did not specify correlations between conceptually
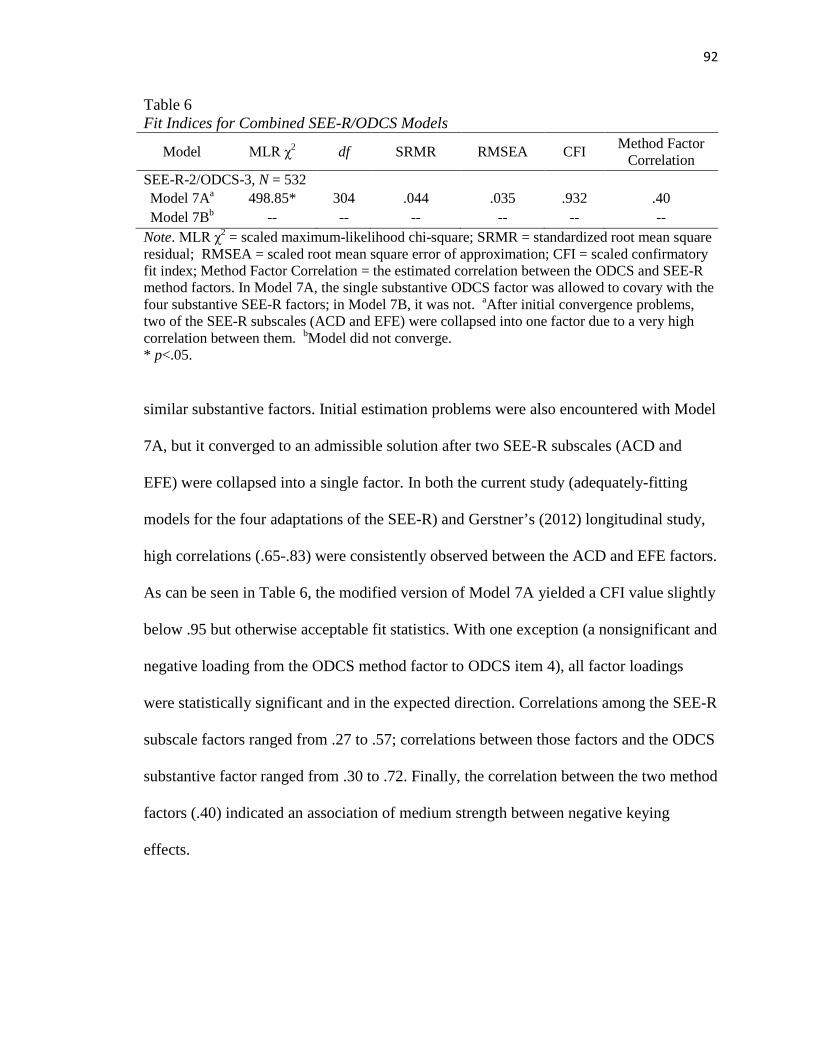
92
Table 6 Fit Indices for Combined SEE-R/ODCS Models
Model MLR χ2 df SRMR RMSEA CFI Method Factor Correlation
SEE-R-2/ODCS-3, N = 532
Model 7Aa 498.85* 304 .044 .035 .932 .40 Model 7Bb -- -- -- -- -- --
Note. MLR χ2 = scaled maximum-likelihood chi-square; SRMR = standardized root mean square residual; RMSEA = scaled root mean square error of approximation; CFI = scaled confirmatory fit index; Method Factor Correlation = the estimated correlation between the ODCS and SEE-R method factors. In Model 7A, the single substantive ODCS factor was allowed to covary with the four substantive SEE-R factors; in Model 7B, it was not. aAfter initial convergence problems, two of the SEE-R subscales (ACD and EFE) were collapsed into one factor due to a very high correlation between them. bModel did not converge. * p<.05.
similar substantive factors. Initial estimation problems were also encountered with Model
7A, but it converged to an admissible solution after two SEE-R subscales (ACD and
EFE) were collapsed into a single factor. In both the current study (adequately-fitting
models for the four adaptations of the SEE-R) and Gerstner’s (2012) longitudinal study,
high correlations (.65-.83) were consistently observed between the ACD and EFE factors.
As can be seen in Table 6, the modified version of Model 7A yielded a CFI value slightly
below .95 but otherwise acceptable fit statistics. With one exception (a nonsignificant and
negative loading from the ODCS method factor to ODCS item 4), all factor loadings
were statistically significant and in the expected direction. Correlations among the SEE-R
subscale factors ranged from .27 to .57; correlations between those factors and the ODCS
substantive factor ranged from .30 to .72. Finally, the correlation between the two method
factors (.40) indicated an association of medium strength between negative keying
effects.
93
Discussion of Study 1
The goal of Study 1 was to investigate the psychometric consequences of
balancing attitude scales by including negatively-worded and/or negatively-keyed
measurement items. Prior studies have generally reported differential functioning (in
terms of validity, dimensionality, and reliability) for positive and negative items on
balanced scales. However, previous research designs have not typically made any
distinctions between negative wording and negative keying, leaving important
measurement questions unanswered. In the current study, several adaptations of two
attitude scales (the ODCS and the SEE-R) were used to investigate the effects of
balancing via wording direction, keying direction, or both. Below, the four research
questions posed at the outset of the study will be addressed in turn. The reader is
encouraged to review Tables 4, 5, and 6 as needed.
Research Question #1. The first research question concerned balanced scales
(conditions 2, 3, and 4) and whether they would exhibit psychometric properties
comparable to those of scales where all items were keyed and worded in the same
direction (condition 1). The properties examined were dimensionality (assessed via
confirmatory factor analysis) and reliability (estimated using model-appropriate equations
for coefficient omega). Based on prevailing trends in the measurement literature, it was
hypothesized that all-positive (i.e., unbalanced) versions of the ODCS and SEE-R would
yield better psychometric properties than balanced adaptations.
In terms of reliability, the hypothesis was generally confirmed. Regarding the
ODCS, coefficient omega was systematically higher for the all-positive version of the
scale (.86-.88 across converging models) than for any of the balanced adaptations (.70-
94
.79 across models positing a single substantive factor with or without method effects).
Regarding the SEE-R, which includes four subscales, the trend was similar. Subscale
reliability estimates were usually highest in the all-positive condition (e.g., SEE-R-1
Model 1: .77 / .78 / .75 / .84), although similar estimates were obtained in the condition
where keying was consistently negative and wording was balanced (SEE-R-4 Model 1:
.77 / .79 / .71 / .81). It should be noted that the apparent internal consistency advantage
for all-positive wording/keying may be somewhat illusory. Given the low-stakes data
collection context, for example, each dataset no doubt included careless responders (i.e.,
satisficing students who, in an effort to finish as quickly as possible, consistently agreed
[or disagreed] with items without actually reading them). In the all-positive condition—
and condition 4, where keying did not change—such response patterns likely contributed
to internal consistency; in the balanced keying conditions, they likely detracted from it.
The pattern of dimensionality results provided mixed support for the RQ#1
hypothesis. Of the four ODCS adaptations, the all-positive version (ODCS-1) yielded the
worst fit statistics in all model configurations. In fact, no model—including the simple
one-factor model championed by Pascarella et al. (1994)—provided acceptable fit to the
ODCS-1 data. By contrast, and contrary to expectations, Model 1 fit the ODCS-4 data
(all negative keying, half negative wording) very well. Standardized residuals for the
ODCS-1 Model 1 suggested that several pairs of items shared significant variance beyond
that accounted for by the substantive factor. The ODCS-1 CU models fit the data
marginally better than did the SUB model, perhaps because the correlated error terms
“capitalized” on the variance shared by certain item pairs (e.g., items 6 and 8) that
happened to be chosen for reversal in conditions 2-4. Regardless, the poor ODCS-1 fit
95
statistics (and the pattern of results among the balanced conditions) indicated that the
original instrument, which is nearly identical to the ODCS-1, may not function well as a
unidimensional measure without revision. This finding may stem from the nature of the
scale, which was designed to assess both openness to diversity and openness to challenge;
it seems probable that given individuals may possess more of one of those traits than the
other. In short, the all-positive version of the ODCS did not show an advantage over
balanced versions in terms of dimensionality.
The dimensionality story was generally similar for the SEE-R adaptations. One
notable difference was that in the all-positive condition, Model 1 (positing four
substantive factors and no method effects) did fit the data reasonably well—and better
than the competing models in that condition. However, the fit statistics for that model
were only slightly better than those of the comparable (and best-fitting) model in the
SEE-R-4 condition (where keying was consistently negative and wording was balanced).
Across all conditions, the best-performing models appeared to be the SEE-R-3 Model 5
(whose CTCM- configuration that was very close to that endorsed in Gerstner [2012])
and the SEE-R-2 CTCM models. As is evident from a review of the best-fitting model(s)
by dataset in Table 5, conditions 2 and 3 resulted in a better fit for models specifying
method variance than did conditions 1 and 4. Thus the dimensionality results for the
SEE-R models showed an advantage (in terms of model fit) for the all-positive
wording/keying condition over the balanced conditions, though the advantage over
condition 4 (balanced via wording only) was minimal.
In summary, results were mixed with regard to the RQ#1 hypothesis. Estimates of
reliability (coefficient omega) were generally higher for the all-positive versions of the
96
ODCS and SEE-R than for the balanced versions, in keeping with expectations.
Regarding dimensionality, the SEE-R results indicated that balanced conditions 2 and 3
were more conducive to method effects than were conditions 1 and 4 (whose results
favored substantive-only models). For the ODCS, no advantage was evident for condition
1 because no model adequately fit the data from the ODCS-1. This finding indicates that
the canonical version of ODCS may lack unidimensionality.
Research Questions #2 and #3. The next research questions will be addressed
together because both concerned the utility of competing approaches to balancing
measurement scales. Specifically, were there differences in the psychometric properties
(i.e., dimensionality and reliability) of balanced scales that reversed items through the use
of negative wording and keying (condition 2), those that created reversals only via
negative wording (condition 4), and those that created reversals only via negative keying
(condition 3)? Based on trends in the measurement literature, two hypotheses were
generated:
• RQ#2: Balanced scales with items characterized by negative wording and keying
would exhibit weaker psychometric properties than balanced scales using only
one reversal strategy.
• RQ#3: Among balanced scales using only one reversal strategy, those with
balanced wording would exhibit weaker psychometric properties than those with
balanced keying.
Regarding reliability, trends were fairly consistent across the ODCS and SEE-R.
Coefficient omega values tended to be highest in condition 4 (which had consistent
keying) and somewhat lower in the other balanced conditions (which did not). Among
97
ODCS models positing method effects, for example, reliability estimates were slightly
higher in condition 4 (range: .75-.76) than in condition 2 (range: .72-.73) or condition 3
(range: .70-.74). A similar (if slightly muddier) pattern was observed for the SEE-R, as
conditions 3 (half negative keying) and 4 (half negative wording) tended to yield higher
reliability estimates than did condition 2 (half negative wording/keying). This trend was
evident for both substantive-only and CTCM models, as exemplified by the Model 1
reliability coefficients (SEE-R-4: .77 / .79 / .71 / .81; SEE-R-3: .77 / .74 / .75 / .69;
SEE-R-2: .70 / .73 / .72 / .72). In short, across balanced ODCS and SEE-R conditions,
coefficient omega tended to be highest in condition 4 (all negative keying, half negative
wording) and lowest in condition 2 (half positive wording/keying, half negative
wording/keying).
Regarding dimensionality, results varied somewhat by instrument. The strongest
fit statistics for the ODCS were clearly obtained under condition 4, where the best-fitting
model had a simple, one-factor structure (Model 1: SRMR = .029; RMSEA = .033; CFI =
.978). Under conditions 2 and 3, the best-fitting ODCS models posited method effects; fit
statistics were consistently better for the ODCS-2 (Model 5: SRMR = .034; RMSEA =
.058; CFI = .956) than for the ODCS-3 (Model 5: SRMR = .040; RMSEA = .082; CFI =
.910). Thus method effects were more apparent in conditions 2 and 3 (where keying
varied) than in condition 4 (where it did not).
Among balanced SEE-R datasets, the best-fitting models for condition 2
(SEE-R-2 Model 5: SRMR = .041; RMSEA = .039; CFI = .938) and condition 3
(SEE-R-3 Model 5: SRMR = .044; RMSEA = .036; CFI = .946) yielded better statistics
than the best-fitting model for condition 4 (SEE-R-4 Model 1: SRMR = .052; RMSEA =
98
.056; CFI = .911). However, the dimensionality trend was the same as for the ODCS:
Method effects were less apparent when only wording was balanced (SEE-R-4) than
when only keying was balanced (SEE-R-3) or when both wording and keying were
balanced (SEE-R-2).
In summary, results were informative with regard to the second and third research
questions. ODCS and SEE-R estimates of reliability (coefficient omega) were generally
lowest in condition 2 (where wording and keying were balanced) and highest in condition
4 (where only wording was balanced). Regarding dimensionality, across both instruments
the condition 4 data supported a substantive-only model (one factor for the ODCS; four
factors for the SEE-R), while the data for conditions 2 and 3 supported models with
method factors. The above findings supported the RQ#2 hypothesis (that condition 2
would yield the worst psychometric properties among the balanced scales), but not the
RQ#3 hypothesis (that condition 4 would yield weaker psychometric properties than
condition 3). Thus it appears that among balancing strategies, the use of balanced
wording (with consistently negative keying) may be preferable to the use of balanced
keying (with consistently positive wording), which may be preferable to the use of both
strategies (half positive wording/keying, half negative wording/keying).
Research Question #4. The final research question addressed the extent to which
method effects associated with negative keying might be evident across instruments. This
question could be answered for participants completing the SEE-R-2 and the ODCS-3
(both balanced adaptations). Responses to the two measures were modeled
simultaneously (using two CTCM- configurations) in order that the correlation between
negative-keying method factors across the instruments could be estimated. It was
99
hypothesized that the association of keying-based method effects across the SEE-R-2 and
the ODCS-3 would be weaker than that reported by DiStefano and Motl (2006) for
wording-based method effects (.37).
As noted in the results section, Model 7B (which did not permit the substantive
ODCS-3 factor to covary with the substantive SEE-R-2 factors) did not converge to an
admissible solution. Initial estimation problems were also encountered with Model 7A
(which did allow those substantive covariances); convergence was reached after the two
of the SEE-R-2 factors—ACD and EFE, which exhibited high correlations in simpler
SEE-R models—were combined. The final model fit the observed data fairly well
(SRMR = .047; RMSEA = .032; CFI = .938). Correlations between the (three) SEE-R
substantive factors and the ODCS substantive factor ranged from .30 to .72.
The parameter of interest to the research question, the correlation between the two
method factors in the combined model, was estimated at .40. Thus the RQ#4 hypothesis
was not supported; the moderate association of negative keying method effects observed
across the ODCS and SEE-R was comparable in strength to the association reported (for
a different pair of self-report instruments) by DiStefano and Motl (2006) for negative
wording method effects (.37). This finding suggests that scales balanced via keying and
scales balanced via wording may be similar in their susceptibility to method variance.
Study 1 Limitations. There are several aspects of Study 1 that may limit the
generalizability of its results. First, the participants were quite homogeneous in terms of
age and educational level/status. Thus the psychometric trends reported here might differ
for data from other populations. Second, as even a cursory review of Appendix A and
Appendix B will demonstrate, the adapted instruments administered in this study
100
included many lengthy, grammatically complex items. Among the ODCS items, for
example, only one (item 8) was less than ten words long; and a majority of SEE-R items
included at least 15 words (and often 20 or more). To the extent that such item
characteristics are not typical of attitude measures, the study results may not generalize to
other instruments. Furthermore, the participants were all first-year college students—a
population whose ability to comprehend complex language structures is likely stronger
than that of the general population.
The two measures adapted for the study differed in length and (presumed) factor
structure. However, as the instrument names imply and the results for Model 7A suggest,
there appears to be substantial overlap among their ODCS and SEE-R target constructs
(range of cross-instrument substantive factor correlations: .30-.72). Given the nebulous
nature of method factors (i.e., it is difficult to know what they really represent), a
research design using more conceptually distinct measures might provide “cleaner”
answers to some research questions (e.g., RQ#4). Additionally, results from the ODCS-1
(all-positive wording/keying) condition raise questions about the unidimensionality and
robustness of the canonical ODCS, given that a simple, one-factor model did not fit the
observed data for the all-positive wording/keying condition (in contrast to the findings of
Pascarella et al., 1994). By contrast, CFA results for the SEE-R-3 adaptation (which was
very close to the original SEE-R) supported the CTCM- factor structure endorsed by
Gerstner (2012). Finally, it seems possible that for multi-factor scales like SEE-R,
multidimensionality could interact with (potential) method effects.
IV. Study 2
Method
Participants. As in Study 1, participants were incoming freshmen who took part
in mandatory, low-stakes, university-wide assessment activities in August of 2012. A
qualitative think-aloud protocol was employed individually with a total of 8 randomly-
selected students who were given the option to fulfill their assessment requirement by
participating in this study rather than taking part in the activities conducted in their
(randomly-assigned) assessment rooms. All participants were traditional (i.e., 18-year-
old) freshmen; half were female, and all were white. Regarding reading skills, three
participants had “high” documented SAT Critical Reading scores (650 or above) and five
had “average” documented scores on the same measure (between 440 and 550).
Materials. The ODCS was adapted to create a 12-item version incorporating a
combination of the four wording/keying conditions employed in Study 1 (positive
keying/wording; positive keying/negative wording; negative keying/positive wording;
negative keying/negative wording). The same three items were presented four times each,
once in each keying/wording condition. This design was used to facilitate the elicitation
of participant verbalizations pertinent to the research question (i.e., the nature of
differential functioning of positive and negative items within balanced scales). The Study
2 version of the ODCS, which included the same printed instructions and response scale
used in Study 1, can be found in Appendix C.
Procedure. Students assigned to certain (larger) assessment rooms were
randomly selected in advance as potential participants. Once these individuals had
reported to their assigned rooms, been oriented to the nature of general assessment
102
activities at the university, and given informed consent, they were asked to come to the
front of the room. The lead proctor then provided them with brief written offers (“golden
tickets”) giving them the option to take part in a research study (see Appendix E). Of the
8 students who received the offer, all accepted and were directed to another room where
they were oriented to the nature of the study. It was explained that the research would be
conducted with one participant at a time in a nearby room; participants were provided
with a series of university-based assessment instruments unrelated to this study (pilot
measures of critical thinking) and instructed to work on these before and after their turn.
This approach was adopted to ensure that study participants spent an equivalent amount
of time (two to three hours) engaged in assessment activities as their peers who did not
receive a golden ticket. After the completion of study-specific consent forms (on which
permission to record verbal responses was requested), data collection commenced.
Each session began with a brief training module that included scripted
instructions and a researcher-illustrated example (these materials are included in
Appendix D). In order to enhance levels of comfort/confidence with the procedure (and
screen for potential confusion about instructions), the researcher first administered a few
(two to three, as necessary) practice items using a brief set of measurement items related
to attention and organization skills. For both the practice measure and the research
version of the ODCS, participants were asked to “think aloud” (i.e., verbalize their
thoughts) as they processed and responded to individual items. As advised by Sudman,
Bradburn, and Schwarz (1996), spoken cues were used as needed to encourage complete
verbalizations (e.g., “Remember to tell me everything you’re thinking”).
103
Following completion of the ODCS think-aloud, a brief structured interview was
conducted (again, individually) to ascertain retrospective participant opinions about the
relative difficulty of certain oppositely-keyed item pairs. This was planned in case the
procedure did not elicit (unprompted) information specifically related to the processing of
different types of item wording/keying. As noted by Van Someren et al. (1994), think-
aloud protocols can yield invalid or incomplete data for a variety of reasons including
disturbance of the cognitive process (i.e., the added requirement to think aloud causes
participants to complete the task differently than they would otherwise), synchronization
problems (i.e., verbalization is slower than the cognitive processes being described), and
working memory errors. All participant verbalizations (prompted and unprompted) were
audio-recorded; sessions lasted approximately 20 minutes each.
Analyses. Participant audio files were transferred to a computer and transcribed.
The think-aloud and interview portions of the transcriptions were subsequently analyzed
using a thematic networks approach (Attride-Stirling, 2001). This approach typically
entails six steps: (1) development of codes and dissection of data into discrete text
segments; (2) identification of themes; (3) construction of thematic networks, which are
“…web-like illustrations…that summarize the main themes constituting a piece of text”
(Attride-Stirling, 2001, p. 386); (4) description of thematic networks; (5) summarizing of
thematic networks; and (6) interpretation of patterns. The thematic networks approach
was chosen because of its rigor as well as its suitability for analysis of think-aloud data.
Regarding the first step of the analysis (dissection/coding of text), Attride-Stirling
(2001) notes that a coding framework is typically developed “…on the basis of the
theoretical interests guiding the research questions, on the basis of salient issues that arise
104
in the text itself, or on the basis of both” (p. 390). In this case, codes were developed in
both ways. First, six codes were established to reflect literature-based explanations
(described in Chapter 2) for the differential functioning of negative and positive scale
items: (1) careless responding; (2) individual differences in response style/personality; (3)
individual differences in cognitive/reading skills; (4) substantive differences between
positive and negative items; (5) method variance due to use of negative items; and (6)
item extremity. Then, based on an initial review of participant responses, ten additional
codes were established: (7) item does not apply to respondent; (8) misread of item; (9)
partial read of item; (10) item causes reread/confusion; (11) comment about repetition of
items; (12) respondent referring back to a prior item; (13) mapping/refining of response;
(14) apparent disparity between observed and reported behavior (i.e., the participant
reports doing/saying one thing but the researcher observes something different); (15)
comment reflecting participant’s attitude toward scale/task; and (16) comment related to
maintaining response consistency across items (e.g., wanting to give congruent responses
for similarly-worded items). All text segments (i.e., participant statements) deemed to be
related to any of the 16 codes and/or the larger Study 2 research question (Why do
measurement items with negative wording and/or keying elicit differential response
patterns than items that are positively worded/keyed?) were selected for further analysis,
regardless of the terminology used by participants. The text segments were then assigned
codes based on the above framework.
Once the coding process (step 1) had been completed, salient/common themes
were extracted from the text segments (step 2). Continuing with the analysis as delineated
by Attride-Stirling (2001), identified themes were then organized into a visual network
105
that was subsequently reviewed and refined (step 3). In step 4, the components of the
thematic network were described verbally and exemplified with supporting text
segments. Finally, the thematic network was summarized (step 5) and its patterns
interpreted (step 6). Responses to the brief structured interview were analyzed along with
the think-aloud data, since there was a great deal of thematic overlap among them.
Results
As summarized above, a thematic network typically consists of basic themes,
organizing themes, and one or more global themes. Although the network results from a
bottom-up construction (i.e., coding and categorization of discrete text segments), the
reader may benefit from a top-down orientation to its hierarchical structure. In the present
study, analysis of the think-aloud/interview data suggested the inclusion of what could be
termed a “universal” theme at the level above that of the global themes. The universal or
overarching theme that emerged from the data was Individual Differences. In short,
participants varied in their processing of, style of responding to, and comments about the
12-item, think-aloud adaptation of the ODCS (Appendix C). The nature of the individual
differences suggested the presence of variability that seemed independent of participants’
professed levels of the target construct (openness to diversity).
The main sources of individual differences, classified as global themes, were
based on groupings of the organizing themes at the next level down. There were a total of
three (arbitrarily-numbered) global themes: (1) Reading Skill; (2) Personality; and (3)
Style of Responding. Each global theme was based on two organizing themes (identified
below), each of which encapsulated a number of the basic themes that had emerged from
the text segments. The resulting thematic network is described in the following sections

106
(which delineate and exemplify the organizing and basic themes associated with each
global theme) and presented in Figure 5 (below). It should be noted that basic themes
have been omitted from the figure.
Global Theme 1: Reading Skill
The first global theme involved individual differences in participant reading
skill/behavior. Within the think-aloud procedure, all participants save one elected to read
the adapted ODCS items aloud before giving their responses. Thus it was possible to
directly observe instances when participants made reading errors and/or experienced
confusion regarding individual items. During the follow-up structured interview,
participants were asked to identify any items that had been confusing or difficult to
process. In addition, they were asked to gauge the comparability of a specific pair of
items (numbers 1 and 4) in terms of meaning and extremity. Taken together, these data
highlighted individual differences in reading skill/comprehension (particularly with
regard to negatively-worded statements) as well as differences in how items were
interpreted (i.e., meaning/semantics).
Organizing Theme: Negative Wording
This organizing theme pertained to participant processing of negatively-worded
items on the adapted ODCS. Encapsulated basic themes included misreads, rereads, self-
corrections, comprehension difficulties, and resulting response errors. These behaviors
were observed (and reported) primarily on items that featured negative wording.
Consistent with prior studies (e.g., Sherman, 1976; Wason, 1961), the statements that
participants found most challenging to process were those that had high complexity
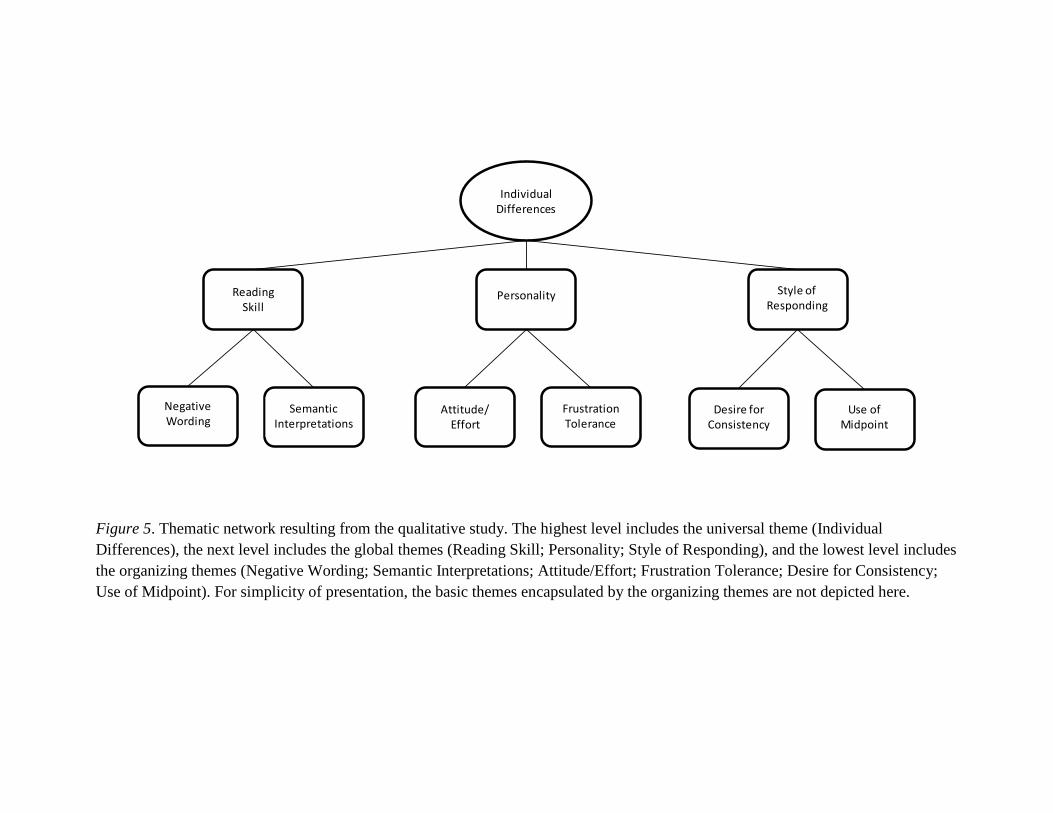
Figure 5. Thematic network resulting from the qualitative study. The highest level includes the universal theme (Individual Differences), the next level includes the global themes (Reading Skill; Personality; Style of Responding), and the lowest level includes the organizing themes (Negative Wording; Semantic Interpretations; Attitude/Effort; Frustration Tolerance; Desire for Consistency; Use of Midpoint). For simplicity of presentation, the basic themes encapsulated by the organizing themes are not depicted here.
Individual Differences
Reading Skill
Style of Responding
Use of Midpoint
SemanticInterpretations
Desire for Consistency
FrustrationTolerance
Attitude/Effort
Negative Wording
Personality
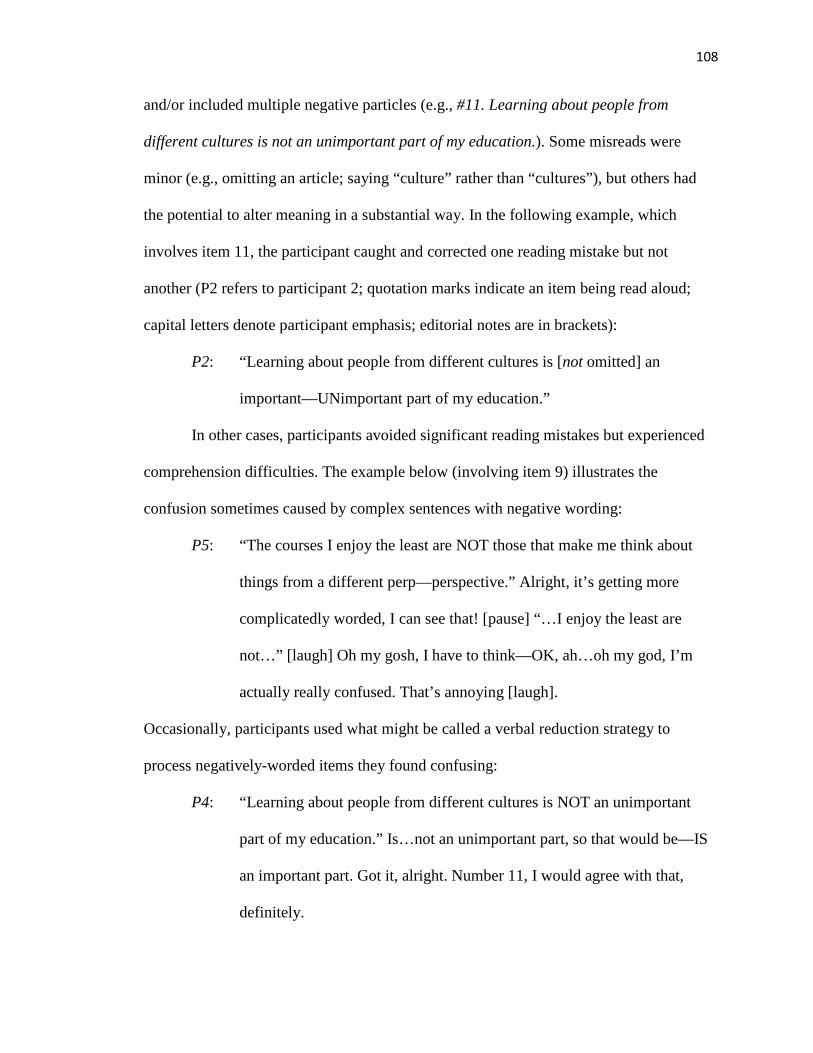
108
and/or included multiple negative particles (e.g., #11. Learning about people from
different cultures is not an unimportant part of my education.). Some misreads were
minor (e.g., omitting an article; saying “culture” rather than “cultures”), but others had
the potential to alter meaning in a substantial way. In the following example, which
involves item 11, the participant caught and corrected one reading mistake but not
another (P2 refers to participant 2; quotation marks indicate an item being read aloud;
capital letters denote participant emphasis; editorial notes are in brackets):
P2: “Learning about people from different cultures is [not omitted] an
important—UNimportant part of my education.”
In other cases, participants avoided significant reading mistakes but experienced
comprehension difficulties. The example below (involving item 9) illustrates the
confusion sometimes caused by complex sentences with negative wording:
P5: “The courses I enjoy the least are NOT those that make me think about
things from a different perp—perspective.” Alright, it’s getting more
complicatedly worded, I can see that! [pause] “…I enjoy the least are
not…” [laugh] Oh my gosh, I have to think—OK, ah…oh my god, I’m
actually really confused. That’s annoying [laugh].
Occasionally, participants used what might be called a verbal reduction strategy to
process negatively-worded items they found confusing:
P4: “Learning about people from different cultures is NOT an unimportant
part of my education.” Is…not an unimportant part, so that would be—IS
an important part. Got it, alright. Number 11, I would agree with that,
definitely.
109
Complex items like those referenced above (e.g., 9 and 11) seemed to consistently
tax participants’ working memory skills. In several cases, the processing demands of such
items resulted in apparent response errors:
P6: “The cois—courses I enjoy the least are not those that make me think
about things from a different perspective.” OK, kinda confusing. “The
courses I enjoy the least are not those...” [pause] “The courses I enjoy the
least are NOT those...” Um, I’ll have to, disagree with that, I think?
[laugh] That’s a confusing question! Yeah, I’d be a 3 with that one. It’s a
tough question to understand.
In the above excerpt, the participant became confused by item 9 and responded “3”
(Slightly Disagree) when her likely intent, based on previous responses and comments,
was to indicate agreement with the underlying sentiment of the statement (i.e., that such
courses are enjoyable). Consistent with expectations based on prior studies (e.g., Marsh,
1996), participants with lower SAT Critical Reading scores seemed somewhat more
susceptible to confusion (e.g., misreads, rereads, response latencies, response errors) than
did their peers with higher SAT Critical Reading scores. This was true in terms of both
frequency (i.e., the number of items on which processing difficulties were observed) and
severity (i.e., degree of confusion; amount of time needed to process items).
In both the think-aloud and interview portions of the study, participants identified
confusing items and provided insight into the nature of the processing difficulties they
experienced. As noted earlier, “problem” items tended to be complex and contain
grammatical negation. The two items most often described as confusing were items 9 and
11, both of which were negatively worded but positively keyed. Several students offered
110
the (unprompted) suggestion that one or both of these items should be reworded. Items 6,
10, and 12 were also cited by at least one student each as being difficult to process.
Participants often used terms like “double negatives” or “contradictory” when explaining
why such items confused them (R denotes the researcher):
P5: Almost the last half [were confusing or difficult to process]. Number 9,
number 12, and number 11. And number 10. So I guess, 9 through 12.
R: Why?
P5: Um, I guess there’s some contradictory wording, with “enjoy” and “the
least” in number 9. 10, “I do not mind” was just kind of like a wishy-
washy statement. And then, 11 had “not” AND “unimportant.” So that
kind of like, switched things around in my mind. And the same thing with
12, “enjoy the least.”
Finally, aspects of sentence structure were occasionally mentioned as factors in
comprehensibility. For example, one participant noted that the (syntactic) location of
negative wording tended to make a difference:
P4: If the NOT, like the negative—I guess it would be a negative—is in the
beginning part, it kind of sets the precedent for the rest of the statement,
that it’s going to be an opposite, as opposed to the previous statement [#6].
This observation was insightful, as participants did not generally exhibit or report
difficulty comprehending negatively-worded statements in which the structure was
relatively straightforward and the polarity was established early on (e.g., #7. I do not
enjoy having discussions with people whose ideas and values are different from my
111
own.). By contrast, the more complex items with negative wording, and particularly those
with multiple negative particles, were conducive to confusion and response errors:
P8: Once I started getting into some of these I feel like I was crossing
myself, I guess I was getting confused, and I didn’t really understand some
of the questions—I was probably going back and, one of them I would say
Strongly Agree and the other [comparable item with the same keying]
would be like, Disagree or something.
In short, some adapted ODCS items with negative wording were consistently difficult for
participants to process. Misreads, self-corrections, rereads, and response errors were
observed on these items. Such behaviors were more frequent, and severe, among
participants with lower SAT Critical Reading scores.
Organizing Theme: Semantic Interpretations
This organizing theme related to participants’ perceptions of the meaning of items
on the adapted ODCS. It emerged primarily from data obtained during the structured
interview, which included a series of questions about two similar items: #1. I enjoy
having discussions with people whose ideas and values are different from my own.; and
#4. I try to avoid having discussions with people whose ideas and values are different
from my own. The second of those items was designed to be parallel to the first but keyed
in the opposite direction. Participants were asked whether items 1 and 4 (which were not
“problem” items in terms of comprehension) were equivalent in meaning or extremity
(i.e., strength). Some favored the former interpretation, some favored the latter
interpretation, and some reported finding the items to be equivalent in meaning and
112
extremity. It should be noted that a few participants asked for clarification of the
questions, while others struggled to articulate their thoughts on semantic issues.
Participants who reported finding a substantive difference in meaning between
items 1 and 4 generally described that difference as subtle:
R: Do you feel like [items 1 and 4] mean the same thing?
P5: Um, kind of but not exactly because, if they did mean the same thing—
like you know, for me strongly agreeing or disagreeing, I’d rather have,
instead of “try to avoid,” I would say, like, “I DISlike having discussions.”
Cause “try to avoid” doesn’t necessarily mean that you dislike it, it’s just
that it [pause] makes you feel more uncomfortable. Well it’s slightly
different, not a whole lot different.
Given that the items in question included different verbs, it was not surprising that some
participants perceived a distinction in meaning. Other participants couched perceived
distinctions between the two items in terms of extremity:
P6: I think number 4 is more extreme, because most people, they see the
question “I enjoy having discussions with people,” [and] they’re pretty
much just gonna agree. But you’re gonna have to—“I try to avoid having
discussions”—people who…try to avoid having discussions, someone
really has to [pause] not like having discussions to agree with that.
It may not be of critical importance whether participants described perceived differences
between items 1 and 4 in terms of meaning or extremity (as noted earlier, the students
had some trouble articulating the nature of distinctions they perceived). The main point is
that for some participants, the two items were not equivalent.
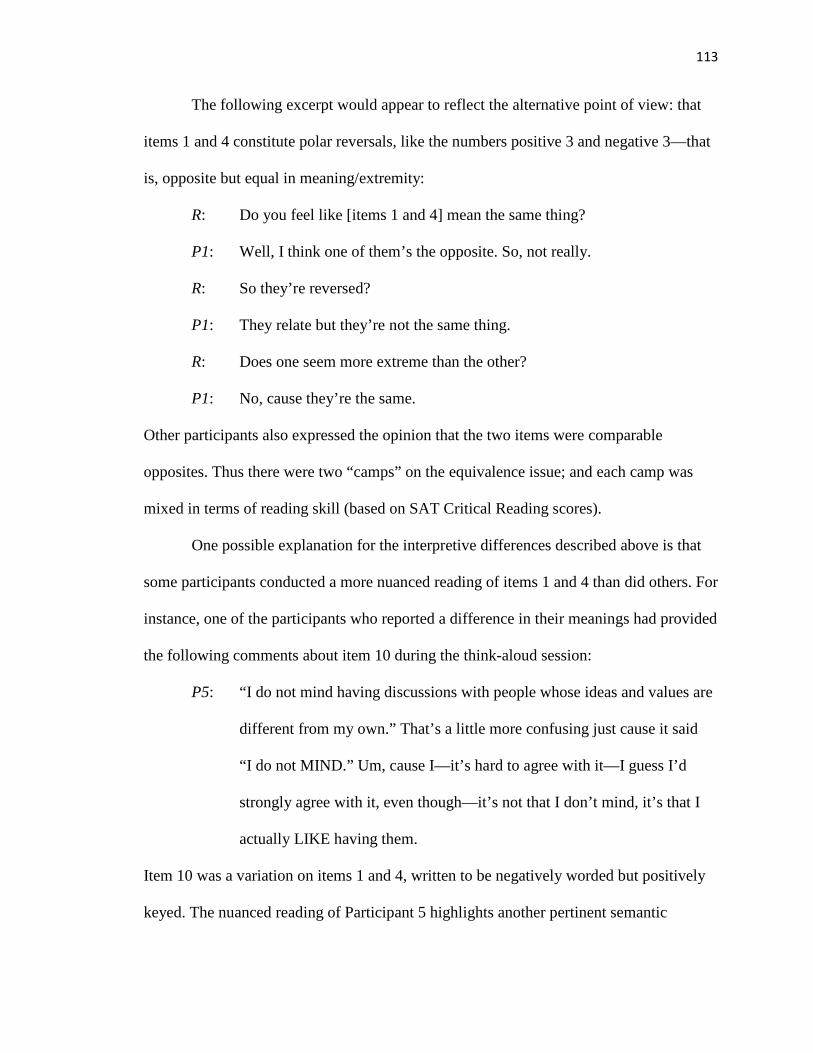
113
The following excerpt would appear to reflect the alternative point of view: that
items 1 and 4 constitute polar reversals, like the numbers positive 3 and negative 3—that
is, opposite but equal in meaning/extremity:
R: Do you feel like [items 1 and 4] mean the same thing?
P1: Well, I think one of them’s the opposite. So, not really.
R: So they’re reversed?
P1: They relate but they’re not the same thing.
R: Does one seem more extreme than the other?
P1: No, cause they’re the same.
Other participants also expressed the opinion that the two items were comparable
opposites. Thus there were two “camps” on the equivalence issue; and each camp was
mixed in terms of reading skill (based on SAT Critical Reading scores).
One possible explanation for the interpretive differences described above is that
some participants conducted a more nuanced reading of items 1 and 4 than did others. For
instance, one of the participants who reported a difference in their meanings had provided
the following comments about item 10 during the think-aloud session:
P5: “I do not mind having discussions with people whose ideas and values are
different from my own.” That’s a little more confusing just cause it said
“I do not MIND.” Um, cause I—it’s hard to agree with it—I guess I’d
strongly agree with it, even though—it’s not that I don’t mind, it’s that I
actually LIKE having them.
Item 10 was a variation on items 1 and 4, written to be negatively worded but positively
keyed. The nuanced reading of Participant 5 highlights another pertinent semantic
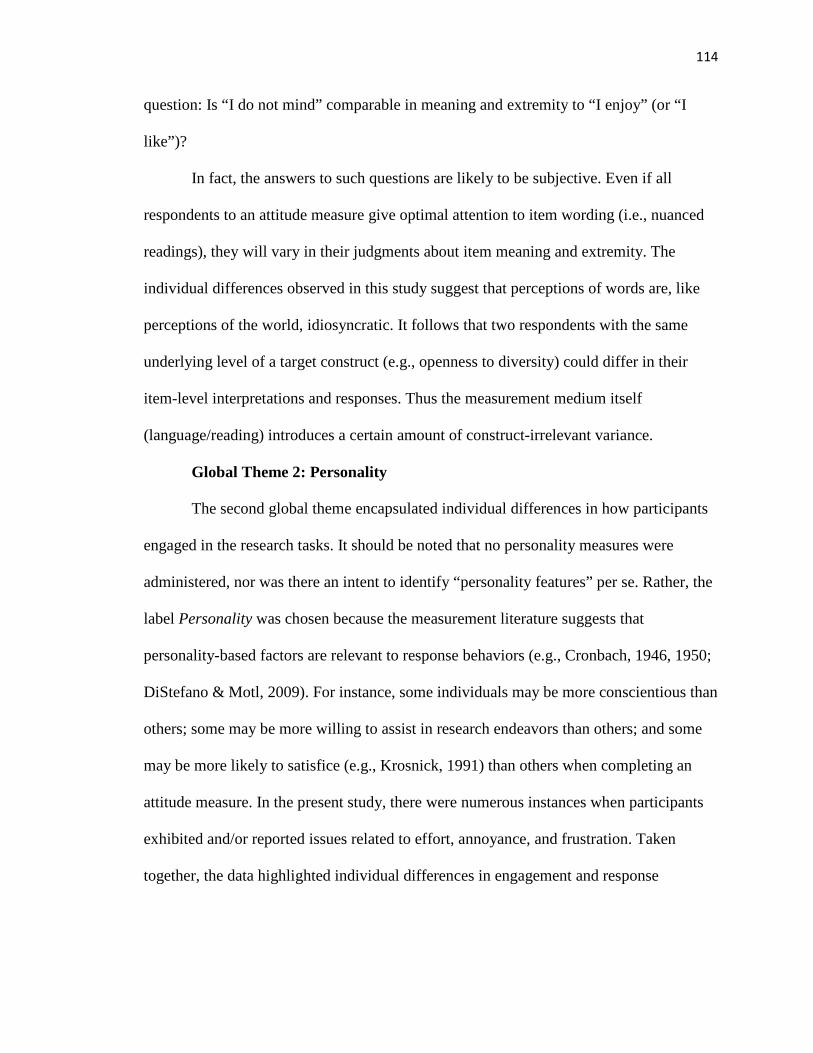
114
question: Is “I do not mind” comparable in meaning and extremity to “I enjoy” (or “I
like”)?
In fact, the answers to such questions are likely to be subjective. Even if all
respondents to an attitude measure give optimal attention to item wording (i.e., nuanced
readings), they will vary in their judgments about item meaning and extremity. The
individual differences observed in this study suggest that perceptions of words are, like
perceptions of the world, idiosyncratic. It follows that two respondents with the same
underlying level of a target construct (e.g., openness to diversity) could differ in their
item-level interpretations and responses. Thus the measurement medium itself
(language/reading) introduces a certain amount of construct-irrelevant variance.
Global Theme 2: Personality
The second global theme encapsulated individual differences in how participants
engaged in the research tasks. It should be noted that no personality measures were
administered, nor was there an intent to identify “personality features” per se. Rather, the
label Personality was chosen because the measurement literature suggests that
personality-based factors are relevant to response behaviors (e.g., Cronbach, 1946, 1950;
DiStefano & Motl, 2009). For instance, some individuals may be more conscientious than
others; some may be more willing to assist in research endeavors than others; and some
may be more likely to satisfice (e.g., Krosnick, 1991) than others when completing an
attitude measure. In the present study, there were numerous instances when participants
exhibited and/or reported issues related to effort, annoyance, and frustration. Taken
together, the data highlighted individual differences in engagement and response
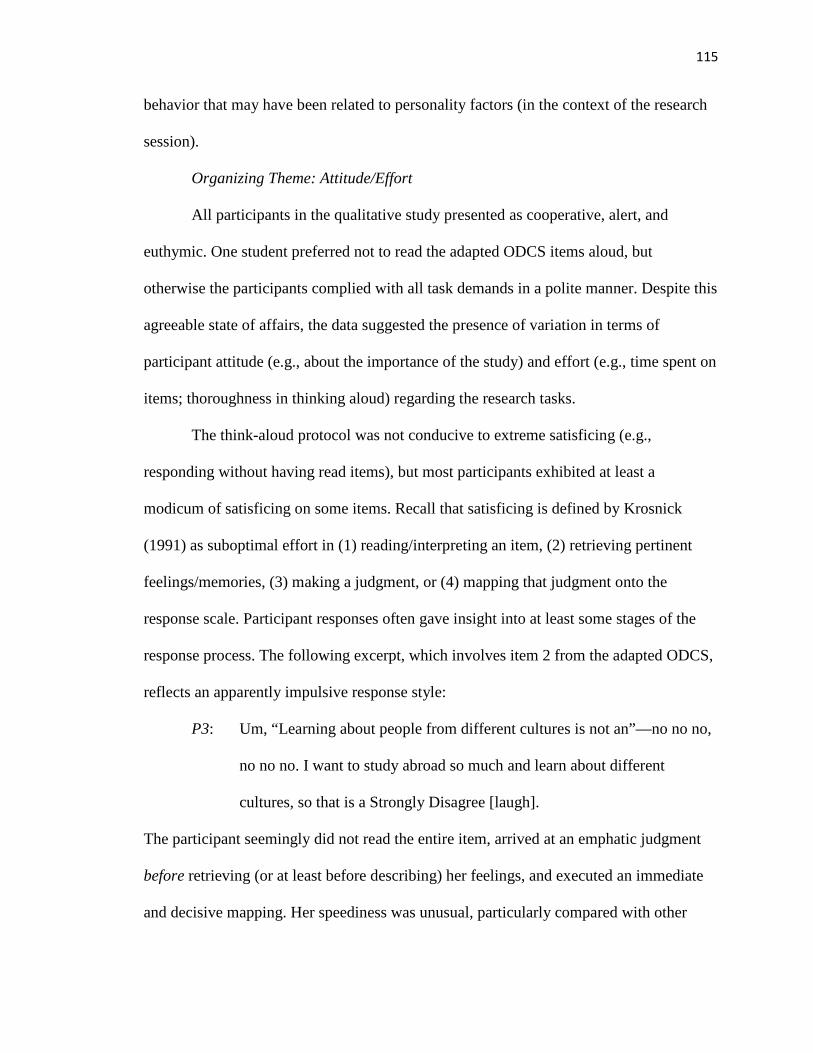
115
behavior that may have been related to personality factors (in the context of the research
session).
Organizing Theme: Attitude/Effort
All participants in the qualitative study presented as cooperative, alert, and
euthymic. One student preferred not to read the adapted ODCS items aloud, but
otherwise the participants complied with all task demands in a polite manner. Despite this
agreeable state of affairs, the data suggested the presence of variation in terms of
participant attitude (e.g., about the importance of the study) and effort (e.g., time spent on
items; thoroughness in thinking aloud) regarding the research tasks.
The think-aloud protocol was not conducive to extreme satisficing (e.g.,
responding without having read items), but most participants exhibited at least a
modicum of satisficing on some items. Recall that satisficing is defined by Krosnick
(1991) as suboptimal effort in (1) reading/interpreting an item, (2) retrieving pertinent
feelings/memories, (3) making a judgment, or (4) mapping that judgment onto the
response scale. Participant responses often gave insight into at least some stages of the
response process. The following excerpt, which involves item 2 from the adapted ODCS,
reflects an apparently impulsive response style:
P3: Um, “Learning about people from different cultures is not an”—no no no,
no no no. I want to study abroad so much and learn about different
cultures, so that is a Strongly Disagree [laugh].
The participant seemingly did not read the entire item, arrived at an emphatic judgment
before retrieving (or at least before describing) her feelings, and executed an immediate
and decisive mapping. Her speediness was unusual, particularly compared with other
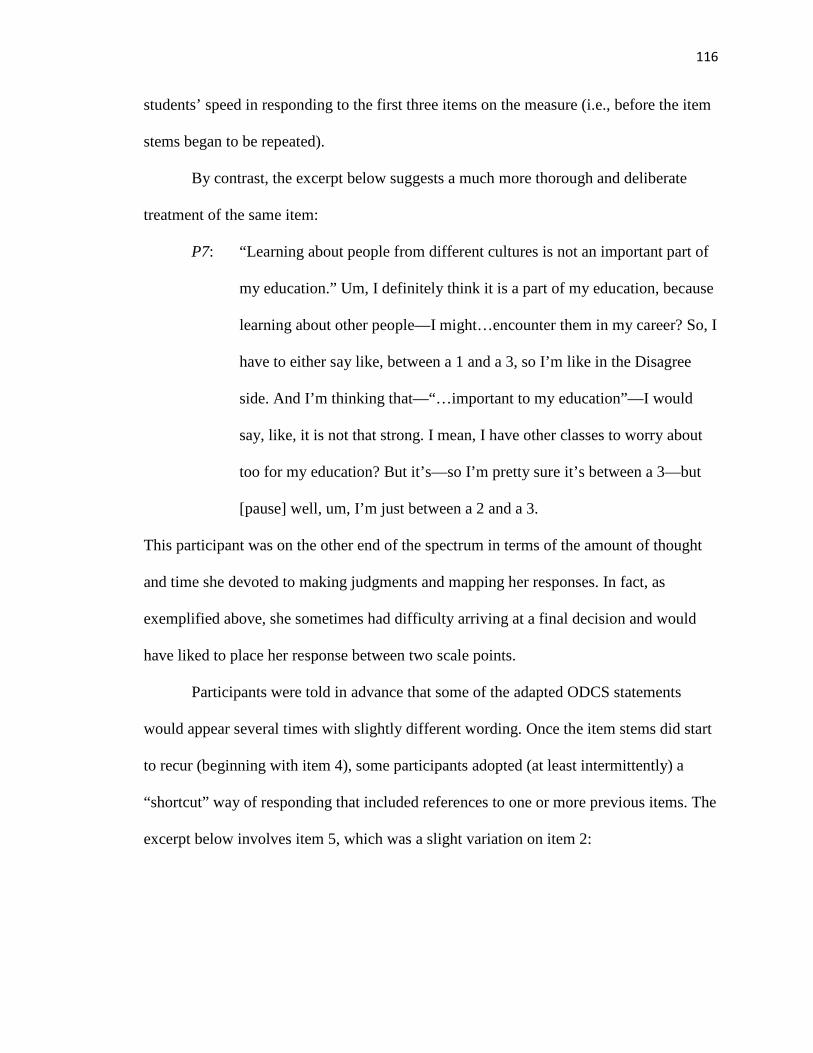
116
students’ speed in responding to the first three items on the measure (i.e., before the item
stems began to be repeated).
By contrast, the excerpt below suggests a much more thorough and deliberate
treatment of the same item:
P7: “Learning about people from different cultures is not an important part of
my education.” Um, I definitely think it is a part of my education, because
learning about other people—I might…encounter them in my career? So, I
have to either say like, between a 1 and a 3, so I’m like in the Disagree
side. And I’m thinking that—“…important to my education”—I would
say, like, it is not that strong. I mean, I have other classes to worry about
too for my education? But it’s—so I’m pretty sure it’s between a 3—but
[pause] well, um, I’m just between a 2 and a 3.
This participant was on the other end of the spectrum in terms of the amount of thought
and time she devoted to making judgments and mapping her responses. In fact, as
exemplified above, she sometimes had difficulty arriving at a final decision and would
have liked to place her response between two scale points.
Participants were told in advance that some of the adapted ODCS statements
would appear several times with slightly different wording. Once the item stems did start
to recur (beginning with item 4), some participants adopted (at least intermittently) a
“shortcut” way of responding that included references to one or more previous items. The
excerpt below involves item 5, which was a slight variation on item 2:
117
P5: OK, “Learning about people from different cultures is an important part of
my education.” So I guess I’d strongly agree with that, just because that’s
the opposite of number 2.
Rather than processing item 5 as a stand-alone unit, the participant recognized it as “the
opposite” of item 2 and simply reversed the answer she had given previously. Even
though this strategy (which will be discussed further under the Desire for Consistency
organizing theme) yielded an apparently congruent response, it still constituted a
substantial form of satisficing.
In fact, almost all participants gradually began to give quicker responses (relative
to their “baseline” speeds) as they progressed through 12 think-aloud items. This may
have been partly attributable to the high degree of repetition inherent in the measurement
instrument, but it likely also reflected a more general behavioral trend in attitude
measurement situations: Respondents may give good attention/effort on initial items,
orienting themselves to the target construct(s), their own pertinent feelings/memories, and
the response scale; after that, they proceed more efficiently—through increased
satisficing. As one participant (P3) remarked, “I remember certain words from questions
and [when] I see [them] again I’m like, ‘Oh, I could use that question to maybe help me
with the next one’.”
While discussing “confusing” items in his interview session, another participant
described the motivation to work as quickly as possible. He observed that for students
completing research measures or academic tests, confusing items are undesirable
specifically because they interfere with the prime directive, efficiency:
118
P4: …I mean, you’re also going faster [than usual], just trying to finish the
questionnaire. And then you have this [confusing item], it throws you for a
loop, and then you feel kind of rushed, and like, “Oh no, I’m losing
time” cause of the whole test-taking syndrome: “I need to finish.”
In summary, participants varied in their use of satisficing behaviors during the
think-aloud task. Some approached the items in a reflective, conscientious way, while
others gave quick and seemingly impulsive responses. Finally, there was a general
tendency for participants to gradually give faster/less thorough think-aloud responses as
they moved through the research instrument. One participant attributed this trend to the
“test-taking syndrome,” while another (P3) suggested that some people “just go through
the motions” when completing attitude measures.
Organizing Theme: Frustration Tolerance
This organizing theme centered on reactions to aspects of the think-aloud task that
were identified as annoying or frustrating. Participant comments (and researcher
observations) suggested that individuals varied in their ability to tolerate frustration,
regulate their emotions, and remain patient/focused. Again, the data were context-specific
but may have reflected more general personality factors that can impact response
behavior.
One potential source of frustration was the degree of repetition in the ODCS
adaptation. Simply put, questionnaire respondents tend to become impatient or
exasperated when they feel they are being asked to answer “the same question” again and
again. During the present study, participants were alerted in advance to the fact that
statements would be repeated with slightly different wording. This warning was
119
incorporated into the research design with the hope that participants would not become
hyperfocused on the repetition of content, and it seemed to be successful. However, basic
themes related to repetition emerged nonetheless (i.e., recognition of, annoyance with,
and questions about repeated content). The following excerpt came from the end of an
interview, when the participant was given the chance to ask questions about the study:
P2: Why are [the items] so similar? [laugh] I’m sure you probably know—
like, you did it on purpose, but…
R: Is it annoying that they’re so similar?
P2: Yeah. [pause] It was kind of annoying, but it’s probably a good tool for
you to analyze, like, what does one word do?
Most participants commented on item similarity during the think-aloud task, the
interview, or both. Their remarks often suggested a combination of mild annoyance and
amusement, the relative proportions of which seemed (based on the researcher’s
impressions) to depend on factors such as investment level and frustration tolerance.
Another potential source of frustration was the difficulty of processing certain
items. As detailed earlier, complex items with negative wording (e.g., items 9 and 11)
often confused participants. Frustration over confusing items, which may have been
exacerbated by feelings of embarrassment (since participants were reading and thinking
aloud in the presence of the researcher), tended to be stronger than reported frustration
associated with content repetition. The following excerpt involved item 9:
P1: “The courses I enjoy the least are not those that make me think about
things from a different perspective.” Ah, these are making my head hurt!
How is that different than the other one?
120
There also appeared to be an interaction between (1) the tendency of participants
to increase their work speed and (2) the location of the items that were reported to be
confusing. Nearly all items identified as difficult to process were located in the latter half
of the measure, when participants had “established set” (i.e., oriented themselves to the
measure) and appeared to want to proceed more efficiently. The following interview
excerpt suggests that for at least some respondents in measurement situations, frustration
can lead to satisficing:
P5: Um, I guess just that [laugh] the complicated wording really messed with
me. And it would probably frustrate me more in a test, and it wouldn’t
really make me want to [laugh] answer them as much, if I had to go back
and keep on thinking about ONE item, in a test when I want to keep on
taking the test.
R: You would lose patience?
P5: Yeah. So that might affect my answers for the other ones.
Not all participants became this frustrated. Some were remarkably patient—particularly
one of the weaker readers (according to SAT Critical Reading scores), who reviewed
certain items multiple times in an effort to comprehend them. It was clear that individual
differences in frustration tolerance represented a potential source of measurement error.
Finally, it seems likely that extent of respondent frustration would be greater, and
tolerance/patience less, in more typical (i.e., non-think-aloud) measurement contexts
where respondents have little or no direct interaction with the researcher(s).
121
Global Theme 3: Style of Responding
The third global theme involved individual differences in how the response scale
was used. Specifically, there were certain situations in which some participants adopted
unorthodox strategies for arriving at judgments and mapping those judgments onto the
response scale. First, some students made an effort to ensure consistency (i.e., congruent
responses) across similarly worded items. Second, there were instances of participants
choosing the midpoint response (Neither Agree nor Disagree) because they found an item
lacking in applicability or clarity. Both issues were observed during the think-aloud task
and explored further in the interview portion of the study. Taken together, the data
highlighted additional sources of potential measurement error.
Organizing Theme: Desire for Consistency
The think-aloud instructions, which were read aloud by the researcher, alerted
participants to the fact that some statements on the adapted ODCS would be repeated in a
slightly varied form. The instructions also advised, “Don’t worry about trying to be
consistent.” Once the item stems did start to recur, however, it was clear that some
participants wanted to provide consistent (i.e., congruent) responses to parallel items. For
example, items 3 and 6 were syntactically identical but for one word (“not”) that made
the latter item a reversal of the former. Participants exhibiting a desire for consistency,
upon recognizing an oppositely-keyed item like number 6, would process the item but
then make sure they gave the opposite response they had given for item 3.
This behavior was similar to the “shortcut” approach described earlier in the
context of efficiency. However, the desire for consistency seemed fundamentally
different—motivated not by efficiency (i.e., trying to complete the measure quickly as
122
possible), but by conscientiousness or compulsiveness. The interview responses of
participants suggested a certain response style dimension or spectrum bounded by two
extreme approaches, holistic and analytic. The “holistic” approach, as illustrated in the
following interview excerpt related to items 3 and 6 (final prompt), could be
characterized by a desire for consistency within all similarly worded items on a measure:
P5: Yeah, if I agreed with that one, I would disagree with this one. Or if I
strongly agreed with that one, I would strongly disagree with that [other]
one. I would definitely do that.
By contrast, proponents of the “analytic” approach (which the instructions advocated)
attempted to treat each item as its own entity, independent of any preceding items:
P1: …I wouldn’t do that [try to establish consistency], but I think most people
would… I personally would just be difficult and say whatever I thought
for [each] one.
Another participant (P8) argued that there is “no point [taking a] survey” if the items are
not treated independently.
In fact, the responses of most participants suggested that their approaches were
somewhere between the holistic and analytic extremes. One student (P4) opined that
consistency efforts might depend on how far down the measure a “repeated” item
appeared (“If you had it further down in the questionnaire, I feel like it would be more of
a different, whole new statement”). In summary, individual differences were apparent in
the desire to provide consistent (i.e., congruent) responses across similar items; such
variation would likely be unrelated to the target construct on an attitude measure.
123
Organizing Theme: Use of Midpoint
This relatively narrow organizing theme encapsulated measurement issues related
to use of the midpoint response (Neither Agree nor Disagree). In certain instances,
participants opted for the midpoint (“4” on the 7-point scale) because they found an item
lacking in either applicability or clarity. Regarding the former situation, one participant
enlisted this strategy for item 3 and all its variants:
P3: “The courses I enjoy the most are those that make me think about things
from a different perspective.” Well, hmmm [pause]. I don’t really think
I’ve had much experience with courses that have made me think about
things from a different perspective, so I’m probably gonna have to go with
Neither Agree nor Disagree.
The above strategy, while understandable given the available response choices, is
problematic from a measurement perspective because a “4” response is intended to
designate a relative value on a spectrum of opinion rather than the absence of an opinion.
During the follow-up interview, Participant 3 reported that she “would definitely have
chosen” a Does Not Apply (N/A) option had it been available as an option. Another
participant (P1) suggested that “bailout” use of the midpoint by respondents is not
uncommon (“Oh, yeah, if they’re—if they don’t really know at all, they’d just pick 4”).
There were also rare instances in which a participant used response option 4 to
indicate that s/he did not comprehend an item and was thus unsure how to answer it. The
following excerpt involved item 11:
124
P8: “Learning about people from different cultures is not an [pause]
unimportant part of my education.” Um, it IS important, so [pause] “is not
an unimportant part of my coll—of my education.” Um [pause] I would
say Agree? What—wait. “Learning about people from different cultures
[pause] is an important—is not an unimportant part of my education.” I
don’t know how to answer that one, so I’ll put 4 [laugh].
This response behavior, while again understandable given the available response choices,
is undesirable from a measurement perspective for obvious reasons. The participant
reported in her interview that she would have opted for N/A or Not Sure had either been
available. She went on to describe another Likert-based measurement instrument
(administered electronically by the university to all incoming freshmen) which had labels
only for the anchor points on the response scale:
P8: They didn’t really give you one [option] where you neither agree nor
disagree. It was just like, Strongly Disagree [on one end] or Strongly
Agree [on the other], so whenever you weren’t sure about it, I would
just click the middle one, cause I didn’t know what else to do…
R: When you weren’t sure, was that because the statement itself was
confusing?
P8: Yeah. Yep, or it didn’t apply to me too, so I would click the middle one.
R: So it would have been good if they had a box like Doesn’t Apply to Me?
P8: Yeah. In order just to answer the question, cause I felt like I HAD to
answer it. So, that’s what I would do.
125
In sum, the present study yielded evidence that Likert-based midpoints, in the
absence of an option such as N/A, may be used at times to communicate information that
is not scale-meaningful. Specifically, participants reported opting for the midpoint
response (“4”) in situations where an item was either very confusing or not applicable to
them. Such responses are problematic because they appear to represent a point on the
attitude spectrum when in fact they were intended as non-responses.
Discussion of Study 2
The Study 2 research question concerned measurement items with negative
wording and/or keying. In short, why do such items tend to elicit differential response
patterns than items that are positively worded/keyed? The qualitative data yielded several
pertinent themes under the “universal” umbrella of individual differences. Text excerpts
were classified into three global themes—Reading Skill, Personality, and Style of
Responding—and, at the next level down, six organizing themes: Negative Wording;
Semantic Interpretations; Attitude/Effort; Frustration Tolerance; Desire for Consistency;
and Use of Midpoint (see Figure 5 for a schematic presentation of the network). The
organizing themes reflected variation in respondent characteristics, usually as they
interacted with scale/item characteristics and the situational context (i.e., a think-aloud
research study). In the following paragraphs, each organizing theme will be discussed in
turn with regard to posited explanations for the differential functioning of positive and
negative measurement items (these explanations were summarized in Chapter 2).
The Negative Wording organizing theme involved participant processing of
negatively-worded items on the adapted ODCS. The data certainly provided supporting
evidence for the well-established theory that cognitive/linguistic demands are higher for
126
grammatically negative statements than for equivalent positive statements (e.g., Sherman,
1976; Wason, 1961). Negative items (particularly complex items such as 9 and 11) were
often associated with participant misreads, rereads, response delays, and confusion. To
the extent that relative difficulty processing negatively-worded statements is experienced
by the general population, that phenomenon may manifest as method variance (i.e.,
variation that cannot be explained in terms of respondent characteristics). However, in
addition, and consistent with the findings of Marsh (1986; 1996), Study 2 participants
with (documented) weaker reading skills experienced more frequent and severe
comprehension difficulties on negatively-worded items than did individuals with stronger
reading skills.
The Semantic Interpretations organizing theme centered on perceived meanings
of certain adapted ODCS items. Many of the relevant text excerpts came from the
structured interviews, during which participants were asked whether items 1 and 4 (which
were parallel and differentiated only by the word “not”) seemed equivalent in terms of
meaning and/or strength. These interview questions were designed to glean information
related to two posited explanations for the differential functioning of positive and
negative measurement items: (1) the substantive explanation, or the idea that positive and
negative items may tap separable constructs such as “presence of anxiety” and “absence
of anxiety” (e.g., Mook, Kleijn, & van der Ploeg, 1991); and (2) the item extremity
explanation (Spector, Van Katwyk, Brannick, & Chen, 1997), or the idea that systematic
differences in the extremity (strength) of oppositely-keyed items can lead to keying-based
artifactors. The qualitative data yielded partial support for each explanation. Whereas
some participants perceived distinctions in meaning between items 1 and 4, others
127
perceived differences in extremity; and some participants felt the items were equivalent
in both meaning and extremity (i.e., polar opposites). This diversity of opinions suggests
that semantic interpretations are subtly idiosyncratic, and that the use of language as a
measurement medium may introduce construct-irrelevant variance.
The Attitude/Effort organizing theme involved variation in participant
engagement in the research tasks—for example, some students were thorough and
conscientious while others seemed more susceptible to satisficing behaviors. The data
strongly supported the long-established theory that personality-based factors are relevant
to response behaviors (e.g., Cronbach, 1946, 1950). In addition, although the research
design was not conducive to extreme satisficing, there were instances where individuals
processed negatively-worded items so quickly/impulsively that apparent response errors
resulted. Thus there was evidence of some degree of careless responding, a phenomenon
that has been identified as a potential explanation for keying-based artifactors (e.g.,
Woods, 2006).
The Frustration Tolerance organizing theme, which emerged based on participant
comments as well as researcher observations, involved variation in the degree to which
participants became annoyed or frustrated with aspects of the think-aloud task (e.g.,
repetition of content; items that were difficult to comprehend). The data suggested that
for some individuals, frustration was detrimental to investment/conscientiousness and
conducive to increased satisficing. This theme provided further evidence that personality
characteristics are relevant to response behaviors, and that careless responding (in
varying degrees) may contribute to differential response distributions for negative and
positive items.

128
The Desire for Consistency organizing theme reflected variation in the degree to
which participants treated similar items on the adapted ODCS as independent entities.
Some respondents exhibited and reported a holistic strategy whose goal was apparently to
establish congruent responses across parallel items or item sets (e.g., strongly agreeing
with items 3 and 9, and strongly disagreeing with items 6 and 12). This behavior seemed
to constitute evidence of a particular response style possibly related to personality factors
such as conscientiousness or compulsiveness.
Finally, the Use of Midpoint organizing theme centered on instances when
participants opted for the Likert midpoint response (Neither Agree nor Disagree) because
they found an item to be either very confusing or not applicable to them. The data
suggested that in the absence of a response choice such as “Does Not Apply,”
respondents may feel more comfortable (mis)using the midpoint option than skipping the
item. Such response behavior, which has previously been identified as an important
measurement issue (e.g., Harter, 1997; Marsh, 2013; Presser & Schuman, 1980), is not
specific to balanced scales. However, it may be more likely to occur with negatively-
worded items, which tend to be more difficult for respondents to comprehend.
In summary, Study 2 yielded some degree of validating evidence for most, if not
all, of the literature-based explanations for the differential functioning of positive and
negative measurement items. The evidence seemed more compelling for some
explanations (method variance; careless responding; response styles; individual
differences in cognitive/reading skills) than for others (substantive differences; item
extremity), though this pattern may have been a function of the research design. As noted
earlier, most of the posited explanations are not mutually exclusive. For example, in a
129
given measurement study it would seem possible to have a substantial percentage (e.g.,
10%) of careless responders, a substantial percentage of individuals with weak reading
skills, and a systematic difference in extremity between negative and positive items.
Study 2 Limitations. There are several limitations of Study 2 that may affect the
generalizability of its results. First, the group of participants lacked diversity in terms of
age, race, and educational level. Second, the adapted version of the ODCS included (by
design) a high degree of repetition and a preponderance of lengthy, complex statements.
Because such features would typically be undesirable in (and, hopefully, absent from) a
measurement scale, some respondent behaviors observed in the study (e.g.,
comprehension difficulties; efforts to ensure congruent responses) might be less
frequent/prominent with more typical measures. Third, the think-aloud methodology no
doubt impacted respondent behavior. For example, would participants have given the
same level of attention to items had they remained in a large testing room and completed
measures independently? Might their reading/comprehension of items have been more
accurate had they not been reading aloud for the researcher? In light of such questions,
the results reported here should be interpreted with caution until they can be replicated.

V. General Discussion
Overall, findings from Studies 1 and 2 implicated a number of phenomena that
may contribute to the oft-reported differential functioning of positive and negative
measurement items on balanced scales. These phenomena can be conceptualized as
characteristics of respondents, measurement items, or the data collection context—or
interactions among those characteristics. Some can also be conceptualized in terms of
previously posited explanations for differential positive/negative item functioning. With
regard to those explanations, the contrasting designs of Study 1 and Study 2 yielded some
convergent evidence and some divergent evidence. The overall findings and their
implications are summarized below.
Study 2, which was qualitative and exploratory in nature, elicited several themes
related to the types of characteristics noted above: that negatively-worded items are more
difficult to process than positively-worded equivalents (item characteristic); that the
difficulty of processing negatively-worded items is greater for individuals with weaker
reading skills (respondent characteristic); that perceptions of item meaning/strength vary
by individual (item-respondent interaction); that individuals vary in terms of personality
characteristics that may be predictive of satisficing behaviors (respondent characteristic);
that response styles, such as the desire for consistent responding across similar items,
impact response patterns (respondent characteristic); and that in some situations,
respondents may “misuse” Likert scale midpoints in order to indicate that an item lacks
applicability or comprehensibility (item-respondent interaction).
In Study 1, which concerned the psychometric properties of scales with different
wording/keying configurations, results were not entirely consistent across measures and
131
conditions. However, several trends were apparent. First, reliability estimates were
generally highest for scales where all items were positively worded and keyed, slightly
lower for scales with consistent (negative) keying and balanced wording, and lowest for
scales with balanced keying (with or without balanced wording). Similarly, CFA results
indicated that method variance was more substantial/evident when keying was balanced
(conditions 2 and 3, where the best-fitting models posited method effects) than when it
was not (conditions 1 and 4, where the best-fitting models accounted for only substantive
variance). Analysis of a combined SEE-R/ODCS model suggested that the association of
keying-based method effects across instruments (.40) may be similar in strength to that
previously reported for wording-based method effects.
Condition 4 in Study 1 was of particular interest, as it had not been utilized in any
previous (published) studies. The configuration—in which all items were negatively
keyed and half were negatively worded—yielded higher reliability estimates than did the
other balanced conditions. In addition, as noted above, the best-fitting models in
conditions 2 and 3 posited method effects while the best-fitting models in condition 4 did
not (although the advantage of those substantive models was slim). Thus it appeared that
balanced keying was more conducive to method effects than was balanced wording, at
least in an unstructured data collection situation (i.e., where participants could proceed
through multiple measures at their own pace). It should be noted, however, that the nature
of the employed item adaptation approaches may have affected the Study 1 results. For
example, the strategy of creating negatively-worded items in a highly consistent manner
(via the addition of “not” or “do not”) could have inflated (at least some) correlations
among them, whereas negatively-keyed adaptations may have been more semantically
132
distinct from one another (and thus less highly correlated) because they were necessarily
crafted on an item-by-item basis. Further research is needed to determine whether
consistent keying can in fact reduce method effects associated with balanced wording,
and/or whether its apparent benefits come at the expense of validity because it essentially
masks careless responding.
Questions about the effects of negative wording and keying were also informed
by Study 2, which featured more structure and encouraged participants to read and think
aloud. The nature of the research design was not conducive to “pure” careless responding
and other strong forms of satisficing, but participants did have consistent difficulty
processing certain negatively-worded items (some of which were also negatively keyed).
The extent of the comprehension difficulties, which sometimes led to response errors,
tended to be greater for individuals identified as having average (rather than above-
average) reading skills. These patterns seemed consistent with the Study 1 finding that
the combination of negative wording and negative keying (condition 2) may be more
conducive to method effects than either in isolation.
Among literature-based theories for the psychometric consequences of balancing
scales, current results yielded no support for the “substantive differences” hypothesis
(e.g., Mook et al., 1991; 1992). That hypothesis states that balanced keying/wording can
result in the emergence of related but distinct substantive factors (e.g., presence of
ethnocultural empathy; absence of ethnocultural empathy). In Study 1, models positing
only wording/keying-based factors (POS/NEG) generally exhibited poor fit and were
always outperformed by competing models. Study 2 provided at least initial evidence that
respondents vary in their perceptions of the relative meaning/extremity of parallel but
133
oppositely-keyed items, rendering unlikely the possibility that positive and negative items
are perceived as substantively distinct across respondents.
Similarly, current findings did not support the “item extremity” hypothesis—that
artifactors can result when at least some pairs of oppositely-keyed items are semantically
extreme relative to the standing of most respondents on the target construct (Spector et
al., 1997). Implicit in this explanation is the idea that perceptions of extremity are
uniform across respondents. However, as described above, Study 2 participants did not
agree on the relative meaning or extremity of pairs of items written to be semantically
equivalent but oppositely keyed. It should be noted that the items in Study 2 may not
have been sufficiently extreme to elicit evidence for the item extremity hypothesis. In
addition, the Study 1 design was probably not conducive to triggering this complex
phenomenon; observed item means did not suggest that the ODCS or SEE-R items were
“extreme” relative to the response scale spectrum.
By contrast, there was compelling evidence from both studies in support of the
method variance hypothesis (e.g., Russell & Carroll, 1999). That hypothesis argues that
the balancing of measurement scales introduces systematic but construct-irrelevant
variance because negative and positive items elicit different response distributions. Study
2 participants reported and exhibited difficulty processing a number of negatively-worded
items, some of which were also negatively keyed. In Study 1, models positing method
effects related to wording/keying generally fit “balanced” data better than did simpler
models (condition 4 was an exception to this trend). Thus it appears that balancing scales
via negative wording and/or keying (item characteristics) is in fact conducive to method
effects, as most prior studies of balanced scales suggests.
134
Study 2 findings provided at least some support for several respondent-based
hypotheses about the nature of differences in the psychometric properties of balanced and
unbalanced scales. First, although the Study 2 research design was not conducive to
strong satisficing, some apparent response errors were observed. This pattern provided
support for the “careless responding” explanation (e.g., Woods, 2006), which suggests
that aberrant responding to negative items by a portion of respondents can result in
artifactors (or method factors). Study 2 findings also supported the idea that item
response distributions can be impacted by individual differences in cognitive/reading
skills (e.g., Marsh, 1986; 1996) as well as by response styles that may be related to
personality traits (e.g., DiStefano & Motl, 2006). It was not a goal of this project to
detect/disentangle these mechanisms in the Study 1 datasets; however, it seems likely
they were present given CFA results (particularly for conditions 2 and 3) and the
relatively unstructured data collection conditions (i.e., participants proceeded through
multiple measures at their own pace).
Interestingly, the Desire for Consistency response style (which emerged as a
Study 2 theme) would theoretically counteract or override the mechanism by which
wording/keying-based method variance would typically be expected to operate. By
giving congruent responses to parallel items with opposite keying, respondents would
minimize the extent to which their response patterns could differ across positive and
negative items. Further research of this phenomenon is warranted, given the consensus
among Study 2 participants that it is not uncommon.
135
Implications
As noted elsewhere, most of the explanations posited for the differential
functioning of negative and positive items are not mutually exclusive. Contributing
factors may include item characteristics, respondent characteristics, and/or contextual
characteristics (e.g., the stakes and degree of structure involved in the data collection
process). Regardless of the constellation of such factors that may be present in a given
research situation, the strategy of balancing scales via wording/keying and scoring all
items seems likely (based on a preponderance of published studies) to introduce method
variance. As suggested by Marsh (1986; 1996), researchers may want to consider
alternative strategies for minimizing and/or identifying potentially anomalous/invalid
response patterns. For instance, certain clinical measures (e.g., the Minnesota Multiphasic
Personality Inventory) include items, some negatively worded, that are intended to gauge
response consistency rather than loading on a substantive subscale. For computer-
administered measures, the tracking of item-level response time may allow for the
identification of extreme satisficers (e.g., careless responders).
Additional strategies for collecting “better data” may include careful attention to
scale instructions, item comprehensibility, respondent motivation, and data collection
procedures (e.g., Crocker & Algina, 1986; Cronbach, 1950; Finney, 2001). For example,
shorter and clearer items (whether positively or negatively worded/keyed) should be less
conducive to confusion, frustration, impatience, fatigue, and other potential threats to
validity. Regarding Likert scales, the provision of a “Don’t Know” or “N/A” option may
reduce inappropriate use of the midpoint response option. Scale instructions can be
written to remind participants that their responses are valued and that accurate responses
136
to attitude items will require both thought and time. Similarly, data collection conditions
that are highly structured—for example, having participants complete measures one at a
time—can yield higher-quality data (Finney, 2001).
In closing, it should be reiterated that none of the ODCS and SEE-R adaptations
used in this project matched the original, published versions of those instruments. Thus
caution should be exercised in drawing inferences about the properties of the original
measures based on current findings. However, the Study 1 results did provide support for
the presumed factor structure of the SEE-R (CTCM-) and raise concerns about the
unidimensionality of the ODCS.

137
Appendix A
Versions of the Openness to Diversity/Challenge Scale (ODCS)
Administered in Study 1
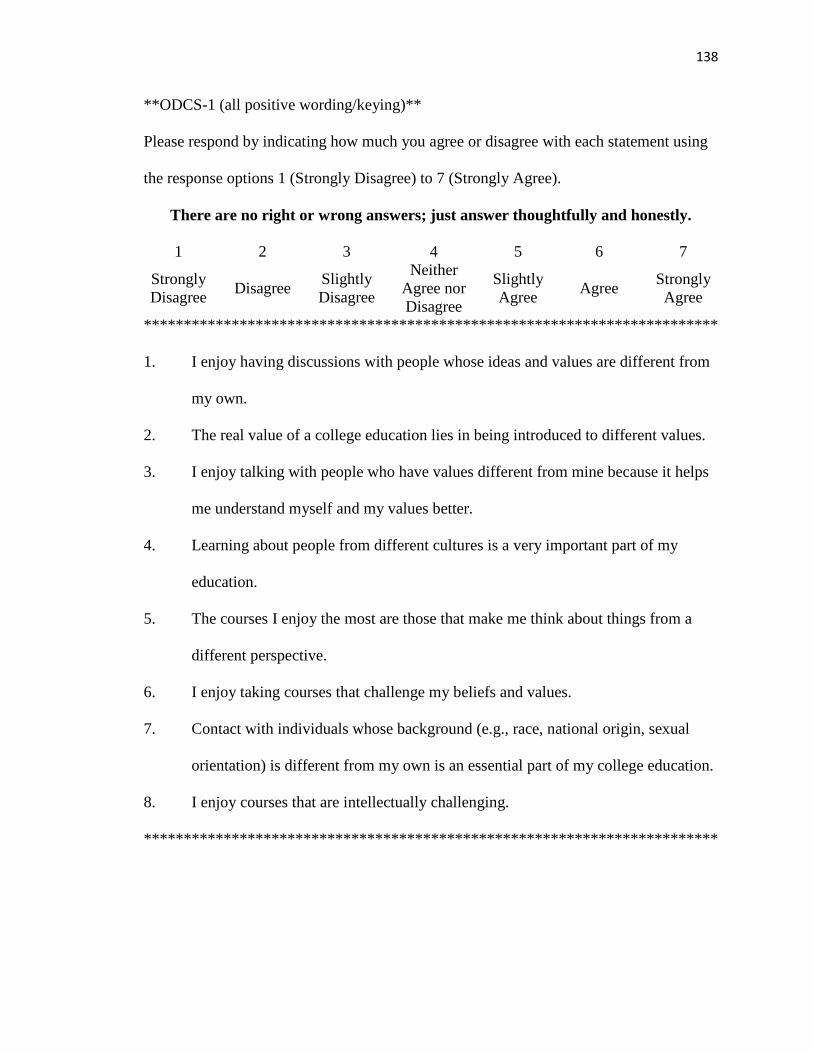
138
**ODCS-1 (all positive wording/keying)**
Please respond by indicating how much you agree or disagree with each statement using
the response options 1 (Strongly Disagree) to 7 (Strongly Agree).
There are no right or wrong answers; just answer thoughtfully and honestly.
1 2 3 4 5 6 7
Strongly Disagree Disagree Slightly
Disagree
Neither Agree nor Disagree
Slightly Agree Agree Strongly
Agree
************************************************************************
1. I enjoy having discussions with people whose ideas and values are different from
my own.
2. The real value of a college education lies in being introduced to different values.
3. I enjoy talking with people who have values different from mine because it helps
me understand myself and my values better.
4. Learning about people from different cultures is a very important part of my
education.
5. The courses I enjoy the most are those that make me think about things from a
different perspective.
6. I enjoy taking courses that challenge my beliefs and values.
7. Contact with individuals whose background (e.g., race, national origin, sexual
orientation) is different from my own is an essential part of my college education.
8. I enjoy courses that are intellectually challenging.
************************************************************************
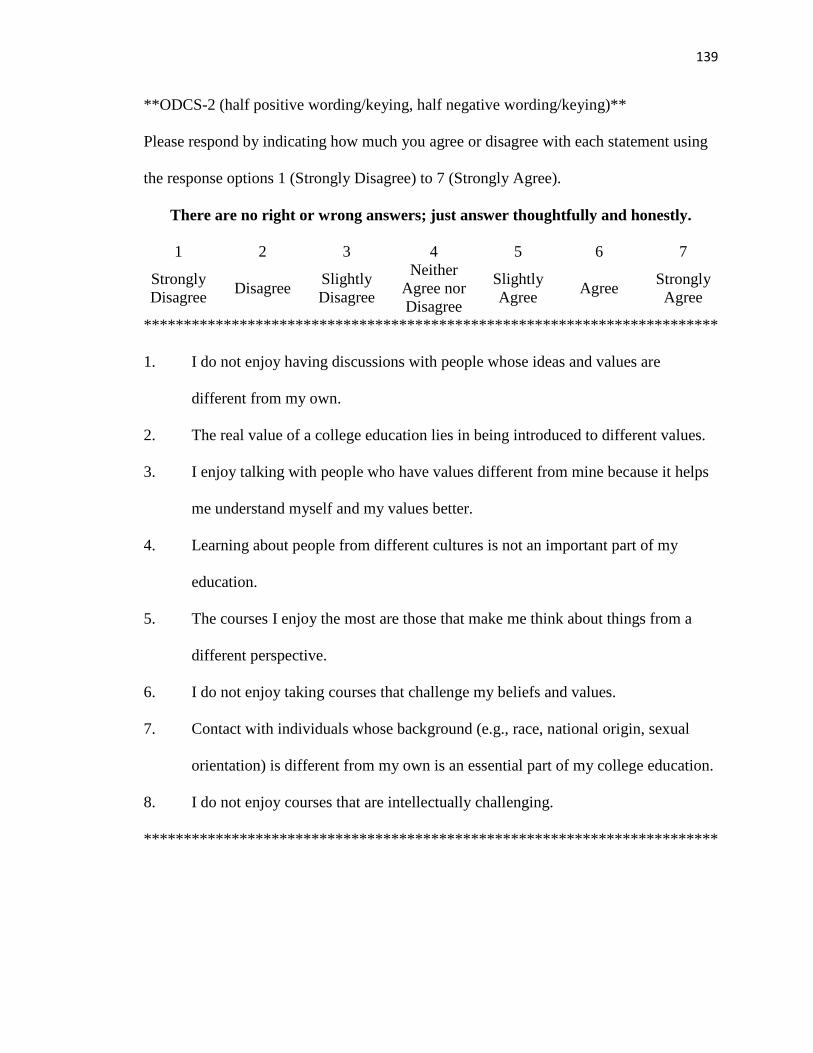
139
**ODCS-2 (half positive wording/keying, half negative wording/keying)**
Please respond by indicating how much you agree or disagree with each statement using
the response options 1 (Strongly Disagree) to 7 (Strongly Agree).
There are no right or wrong answers; just answer thoughtfully and honestly.
1 2 3 4 5 6 7
Strongly Disagree Disagree Slightly
Disagree
Neither Agree nor Disagree
Slightly Agree Agree Strongly
Agree
************************************************************************
1. I do not enjoy having discussions with people whose ideas and values are
different from my own.
2. The real value of a college education lies in being introduced to different values.
3. I enjoy talking with people who have values different from mine because it helps
me understand myself and my values better.
4. Learning about people from different cultures is not an important part of my
education.
5. The courses I enjoy the most are those that make me think about things from a
different perspective.
6. I do not enjoy taking courses that challenge my beliefs and values.
7. Contact with individuals whose background (e.g., race, national origin, sexual
orientation) is different from my own is an essential part of my college education.
8. I do not enjoy courses that are intellectually challenging.
************************************************************************
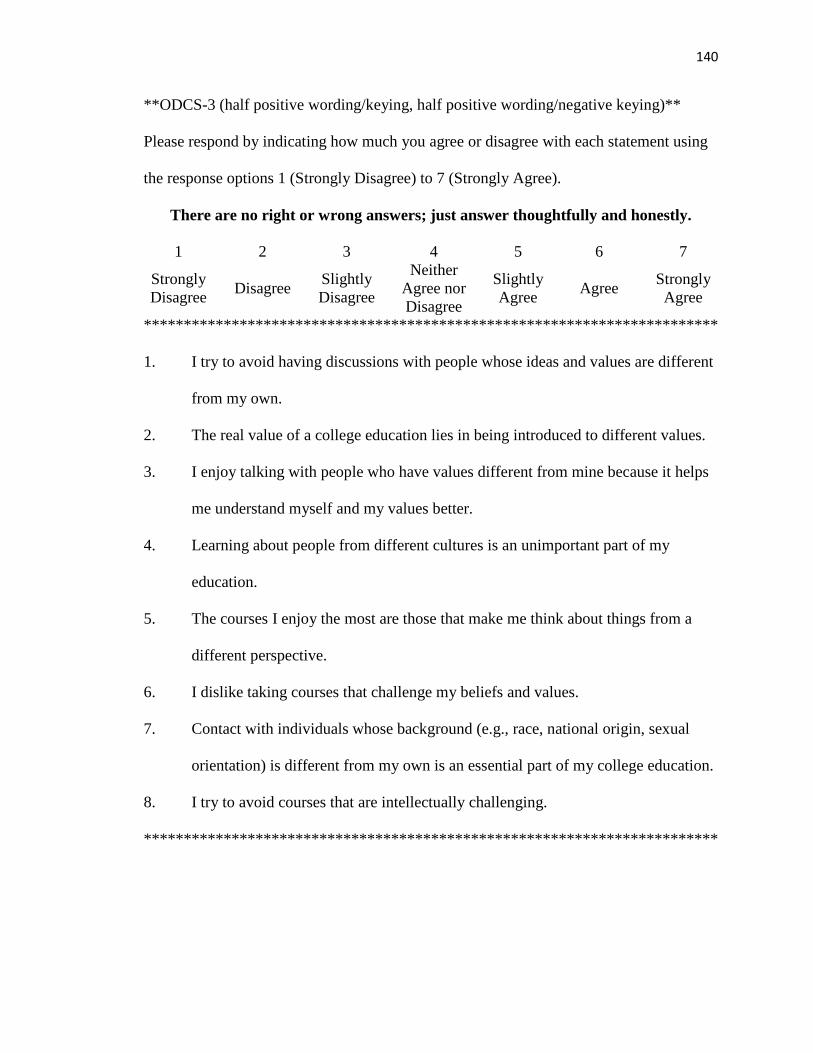
140
**ODCS-3 (half positive wording/keying, half positive wording/negative keying)**
Please respond by indicating how much you agree or disagree with each statement using
the response options 1 (Strongly Disagree) to 7 (Strongly Agree).
There are no right or wrong answers; just answer thoughtfully and honestly.
1 2 3 4 5 6 7
Strongly Disagree Disagree Slightly
Disagree
Neither Agree nor Disagree
Slightly Agree Agree Strongly
Agree
************************************************************************
1. I try to avoid having discussions with people whose ideas and values are different
from my own.
2. The real value of a college education lies in being introduced to different values.
3. I enjoy talking with people who have values different from mine because it helps
me understand myself and my values better.
4. Learning about people from different cultures is an unimportant part of my
education.
5. The courses I enjoy the most are those that make me think about things from a
different perspective.
6. I dislike taking courses that challenge my beliefs and values.
7. Contact with individuals whose background (e.g., race, national origin, sexual
orientation) is different from my own is an essential part of my college education.
8. I try to avoid courses that are intellectually challenging.
************************************************************************
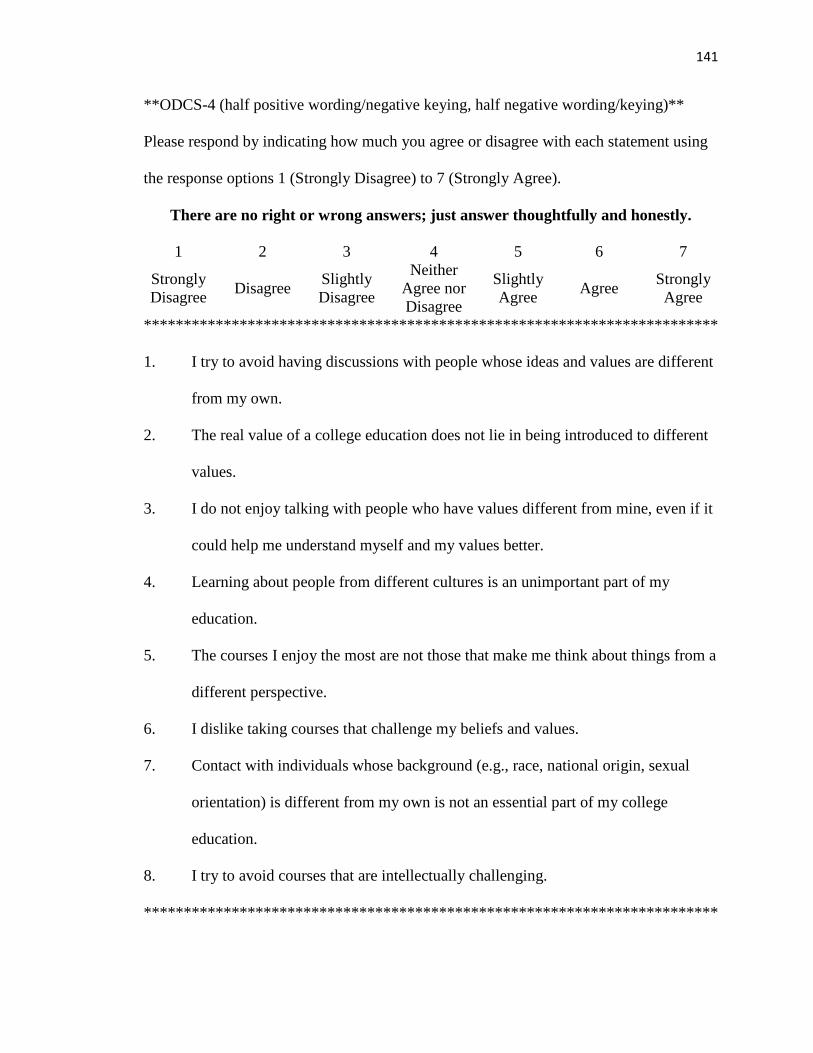
141
**ODCS-4 (half positive wording/negative keying, half negative wording/keying)**
Please respond by indicating how much you agree or disagree with each statement using
the response options 1 (Strongly Disagree) to 7 (Strongly Agree).
There are no right or wrong answers; just answer thoughtfully and honestly.
1 2 3 4 5 6 7
Strongly Disagree Disagree Slightly
Disagree
Neither Agree nor Disagree
Slightly Agree Agree Strongly
Agree
************************************************************************
1. I try to avoid having discussions with people whose ideas and values are different
from my own.
2. The real value of a college education does not lie in being introduced to different
values.
3. I do not enjoy talking with people who have values different from mine, even if it
could help me understand myself and my values better.
4. Learning about people from different cultures is an unimportant part of my
education.
5. The courses I enjoy the most are not those that make me think about things from a
different perspective.
6. I dislike taking courses that challenge my beliefs and values.
7. Contact with individuals whose background (e.g., race, national origin, sexual
orientation) is different from my own is not an essential part of my college
education.
8. I try to avoid courses that are intellectually challenging.
************************************************************************

142
Appendix B
Versions of the Scale of Ethnocultural Empathy – Revised (SEE-R)
Administered in Study 1
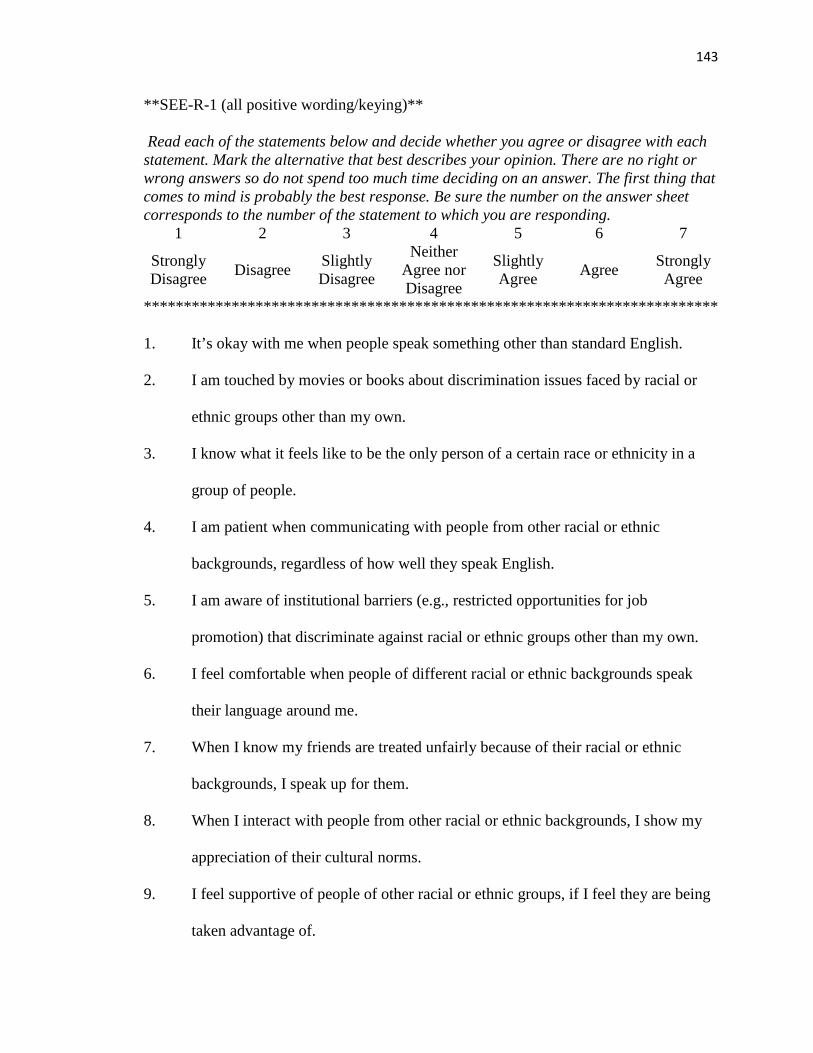
143
**SEE-R-1 (all positive wording/keying)**
Read each of the statements below and decide whether you agree or disagree with each statement. Mark the alternative that best describes your opinion. There are no right or wrong answers so do not spend too much time deciding on an answer. The first thing that comes to mind is probably the best response. Be sure the number on the answer sheet corresponds to the number of the statement to which you are responding.
1 2 3 4 5 6 7
Strongly Disagree Disagree Slightly
Disagree
Neither Agree nor Disagree
Slightly Agree Agree Strongly
Agree
************************************************************************
1. It’s okay with me when people speak something other than standard English.
2. I am touched by movies or books about discrimination issues faced by racial or
ethnic groups other than my own.
3. I know what it feels like to be the only person of a certain race or ethnicity in a
group of people.
4. I am patient when communicating with people from other racial or ethnic
backgrounds, regardless of how well they speak English.
5. I am aware of institutional barriers (e.g., restricted opportunities for job
promotion) that discriminate against racial or ethnic groups other than my own.
6. I feel comfortable when people of different racial or ethnic backgrounds speak
their language around me.
7. When I know my friends are treated unfairly because of their racial or ethnic
backgrounds, I speak up for them.
8. When I interact with people from other racial or ethnic backgrounds, I show my
appreciation of their cultural norms.
9. I feel supportive of people of other racial or ethnic groups, if I feel they are being
taken advantage of.
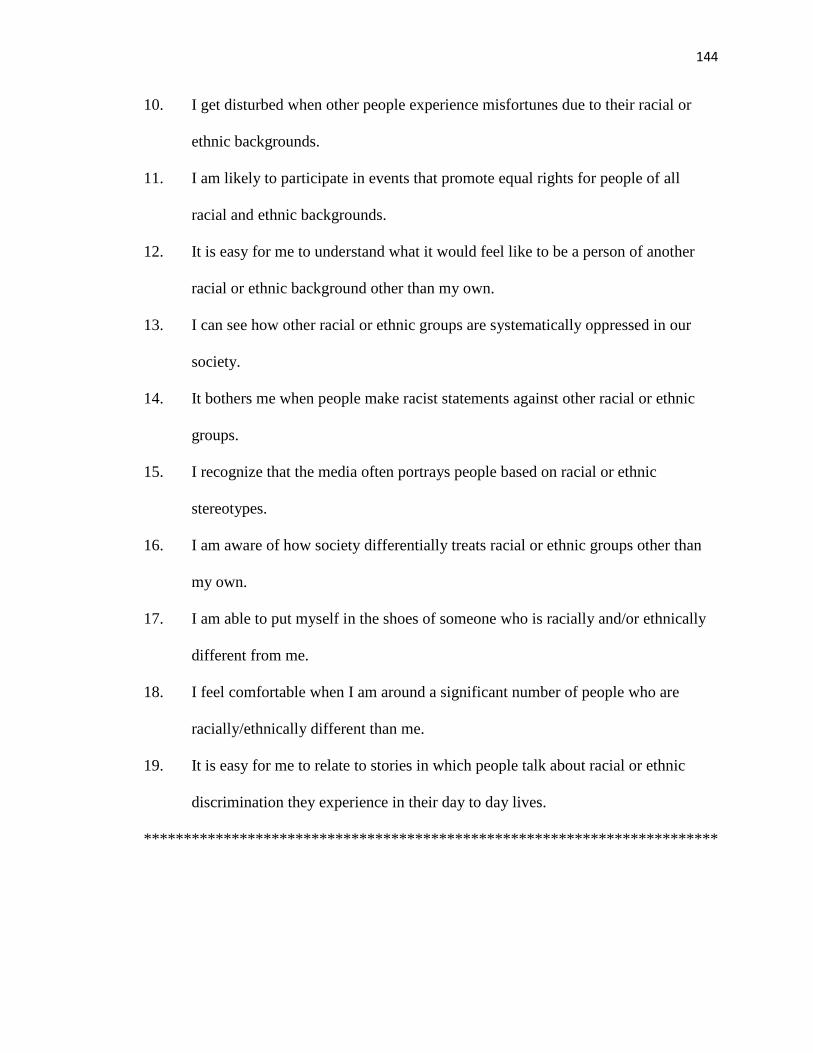
144
10. I get disturbed when other people experience misfortunes due to their racial or
ethnic backgrounds.
11. I am likely to participate in events that promote equal rights for people of all
racial and ethnic backgrounds.
12. It is easy for me to understand what it would feel like to be a person of another
racial or ethnic background other than my own.
13. I can see how other racial or ethnic groups are systematically oppressed in our
society.
14. It bothers me when people make racist statements against other racial or ethnic
groups.
15. I recognize that the media often portrays people based on racial or ethnic
stereotypes.
16. I am aware of how society differentially treats racial or ethnic groups other than
my own.
17. I am able to put myself in the shoes of someone who is racially and/or ethnically
different from me.
18. I feel comfortable when I am around a significant number of people who are
racially/ethnically different than me.
19. It is easy for me to relate to stories in which people talk about racial or ethnic
discrimination they experience in their day to day lives.
************************************************************************
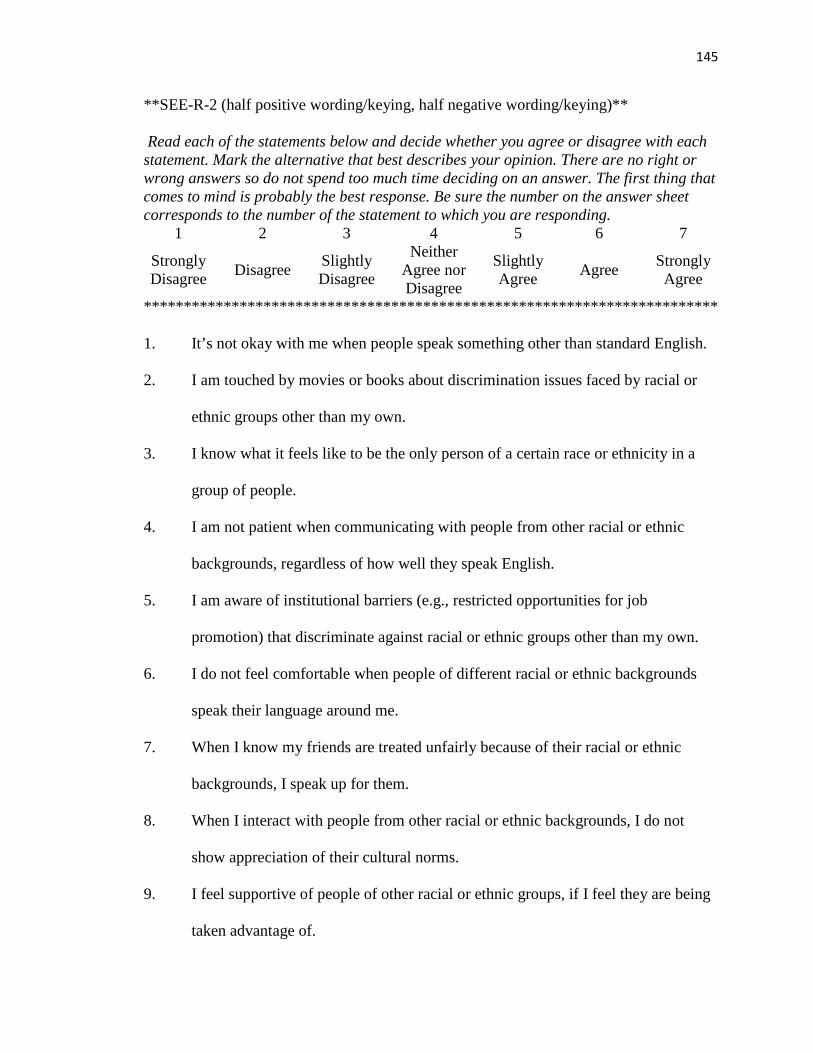
145
**SEE-R-2 (half positive wording/keying, half negative wording/keying)**
Read each of the statements below and decide whether you agree or disagree with each statement. Mark the alternative that best describes your opinion. There are no right or wrong answers so do not spend too much time deciding on an answer. The first thing that comes to mind is probably the best response. Be sure the number on the answer sheet corresponds to the number of the statement to which you are responding.
1 2 3 4 5 6 7
Strongly Disagree Disagree Slightly
Disagree
Neither Agree nor Disagree
Slightly Agree Agree Strongly
Agree
************************************************************************
1. It’s not okay with me when people speak something other than standard English.
2. I am touched by movies or books about discrimination issues faced by racial or
ethnic groups other than my own.
3. I know what it feels like to be the only person of a certain race or ethnicity in a
group of people.
4. I am not patient when communicating with people from other racial or ethnic
backgrounds, regardless of how well they speak English.
5. I am aware of institutional barriers (e.g., restricted opportunities for job
promotion) that discriminate against racial or ethnic groups other than my own.
6. I do not feel comfortable when people of different racial or ethnic backgrounds
speak their language around me.
7. When I know my friends are treated unfairly because of their racial or ethnic
backgrounds, I speak up for them.
8. When I interact with people from other racial or ethnic backgrounds, I do not
show appreciation of their cultural norms.
9. I feel supportive of people of other racial or ethnic groups, if I feel they are being
taken advantage of.

146
10. I get disturbed when other people experience misfortunes due to their racial or
ethnic backgrounds.
11. I am not likely to participate in events that promote equal rights for people of all
racial and ethnic backgrounds.
12. It is easy for me to understand what it would feel like to be a person of another
racial or ethnic background other than my own.
13. I can see how other racial or ethnic groups are systematically oppressed in our
society.
14. It does not bother me if people make racist statements against other racial or
ethnic groups.
15. I recognize that the media often portrays people based on racial or ethnic
stereotypes.
16. I am aware of how society differentially treats racial or ethnic groups other than
my own.
17. I am not able to put myself in the shoes of someone who is racially and/or
ethnically different from me.
18. I do not feel comfortable when I am around a significant number of people who
are racially/ethnically different than me.
19. It is not easy for me to relate to stories in which people talk about racial or ethnic
discrimination they experience in their day to day lives.
************************************************************************
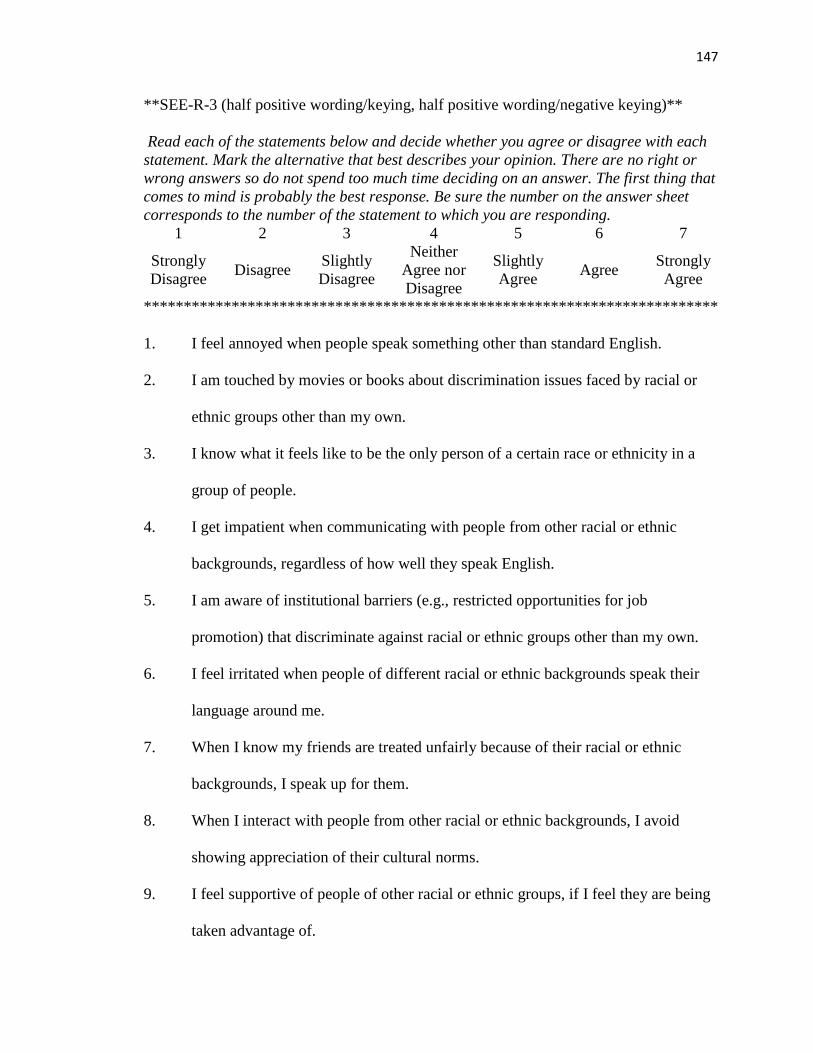
147
**SEE-R-3 (half positive wording/keying, half positive wording/negative keying)**
Read each of the statements below and decide whether you agree or disagree with each statement. Mark the alternative that best describes your opinion. There are no right or wrong answers so do not spend too much time deciding on an answer. The first thing that comes to mind is probably the best response. Be sure the number on the answer sheet corresponds to the number of the statement to which you are responding.
1 2 3 4 5 6 7
Strongly Disagree Disagree Slightly
Disagree
Neither Agree nor Disagree
Slightly Agree Agree Strongly
Agree
************************************************************************
1. I feel annoyed when people speak something other than standard English.
2. I am touched by movies or books about discrimination issues faced by racial or
ethnic groups other than my own.
3. I know what it feels like to be the only person of a certain race or ethnicity in a
group of people.
4. I get impatient when communicating with people from other racial or ethnic
backgrounds, regardless of how well they speak English.
5. I am aware of institutional barriers (e.g., restricted opportunities for job
promotion) that discriminate against racial or ethnic groups other than my own.
6. I feel irritated when people of different racial or ethnic backgrounds speak their
language around me.
7. When I know my friends are treated unfairly because of their racial or ethnic
backgrounds, I speak up for them.
8. When I interact with people from other racial or ethnic backgrounds, I avoid
showing appreciation of their cultural norms.
9. I feel supportive of people of other racial or ethnic groups, if I feel they are being
taken advantage of.
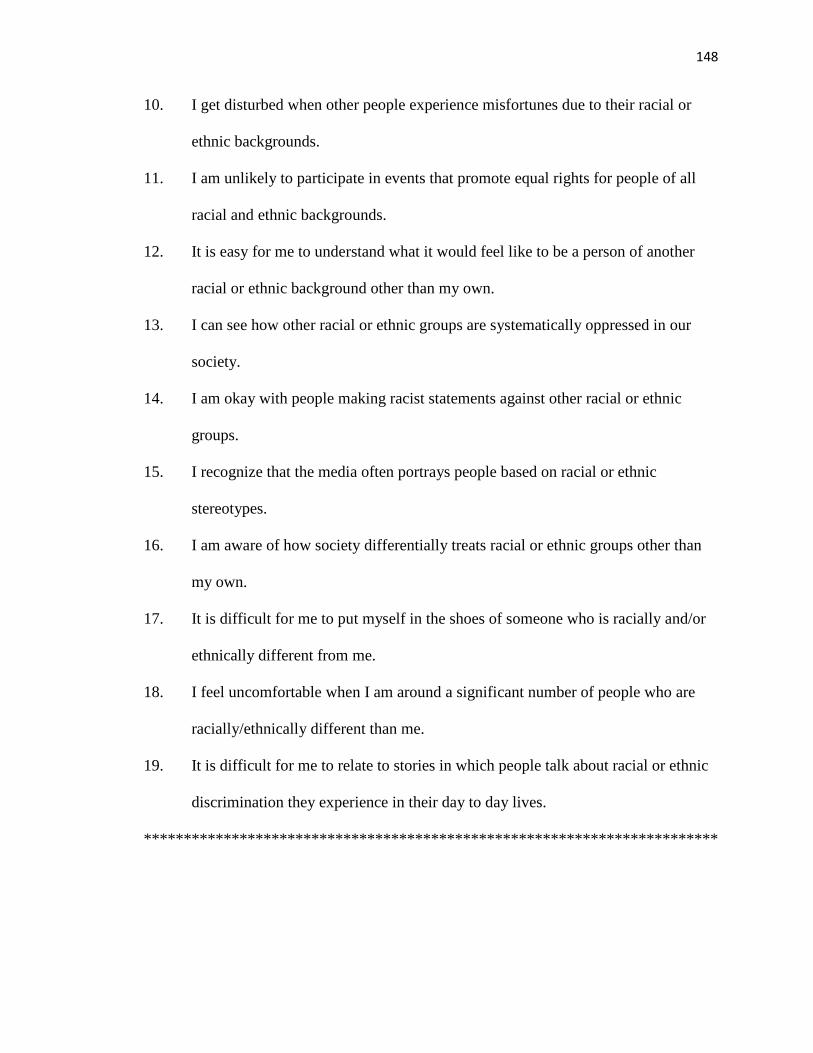
148
10. I get disturbed when other people experience misfortunes due to their racial or
ethnic backgrounds.
11. I am unlikely to participate in events that promote equal rights for people of all
racial and ethnic backgrounds.
12. It is easy for me to understand what it would feel like to be a person of another
racial or ethnic background other than my own.
13. I can see how other racial or ethnic groups are systematically oppressed in our
society.
14. I am okay with people making racist statements against other racial or ethnic
groups.
15. I recognize that the media often portrays people based on racial or ethnic
stereotypes.
16. I am aware of how society differentially treats racial or ethnic groups other than
my own.
17. It is difficult for me to put myself in the shoes of someone who is racially and/or
ethnically different from me.
18. I feel uncomfortable when I am around a significant number of people who are
racially/ethnically different than me.
19. It is difficult for me to relate to stories in which people talk about racial or ethnic
discrimination they experience in their day to day lives.
************************************************************************
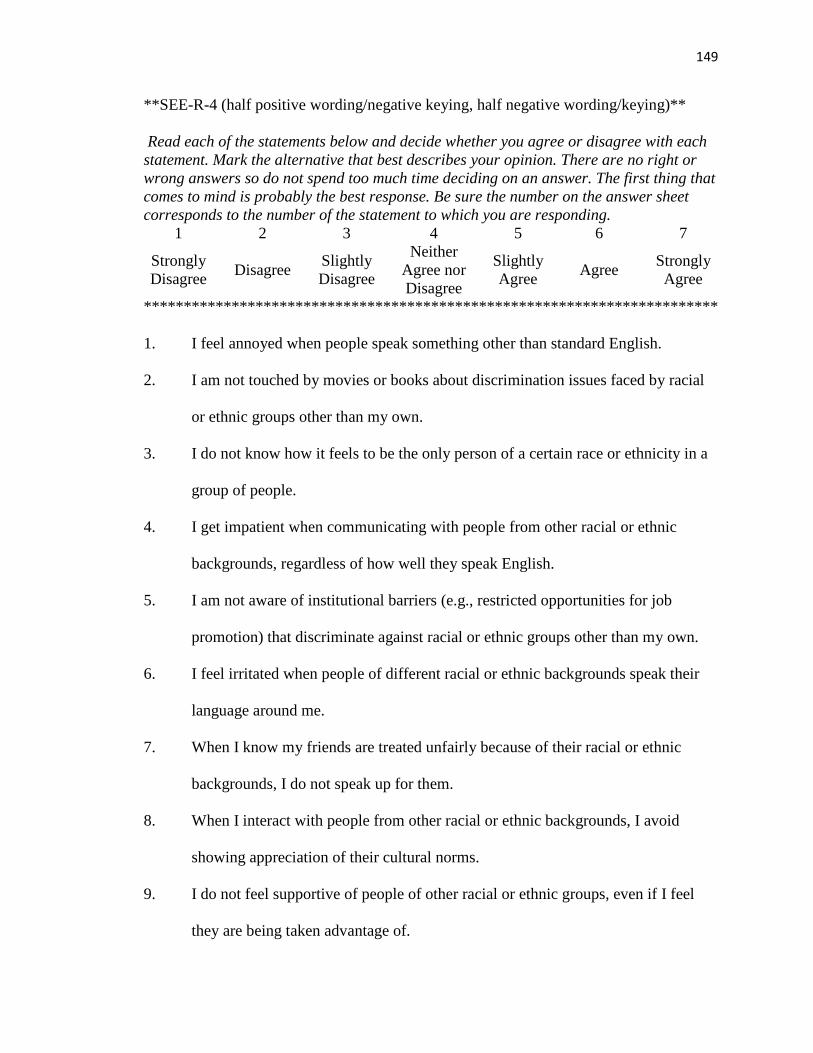
149
**SEE-R-4 (half positive wording/negative keying, half negative wording/keying)**
Read each of the statements below and decide whether you agree or disagree with each statement. Mark the alternative that best describes your opinion. There are no right or wrong answers so do not spend too much time deciding on an answer. The first thing that comes to mind is probably the best response. Be sure the number on the answer sheet corresponds to the number of the statement to which you are responding.
1 2 3 4 5 6 7
Strongly Disagree Disagree Slightly
Disagree
Neither Agree nor Disagree
Slightly Agree Agree Strongly
Agree
************************************************************************
1. I feel annoyed when people speak something other than standard English.
2. I am not touched by movies or books about discrimination issues faced by racial
or ethnic groups other than my own.
3. I do not know how it feels to be the only person of a certain race or ethnicity in a
group of people.
4. I get impatient when communicating with people from other racial or ethnic
backgrounds, regardless of how well they speak English.
5. I am not aware of institutional barriers (e.g., restricted opportunities for job
promotion) that discriminate against racial or ethnic groups other than my own.
6. I feel irritated when people of different racial or ethnic backgrounds speak their
language around me.
7. When I know my friends are treated unfairly because of their racial or ethnic
backgrounds, I do not speak up for them.
8. When I interact with people from other racial or ethnic backgrounds, I avoid
showing appreciation of their cultural norms.
9. I do not feel supportive of people of other racial or ethnic groups, even if I feel
they are being taken advantage of.
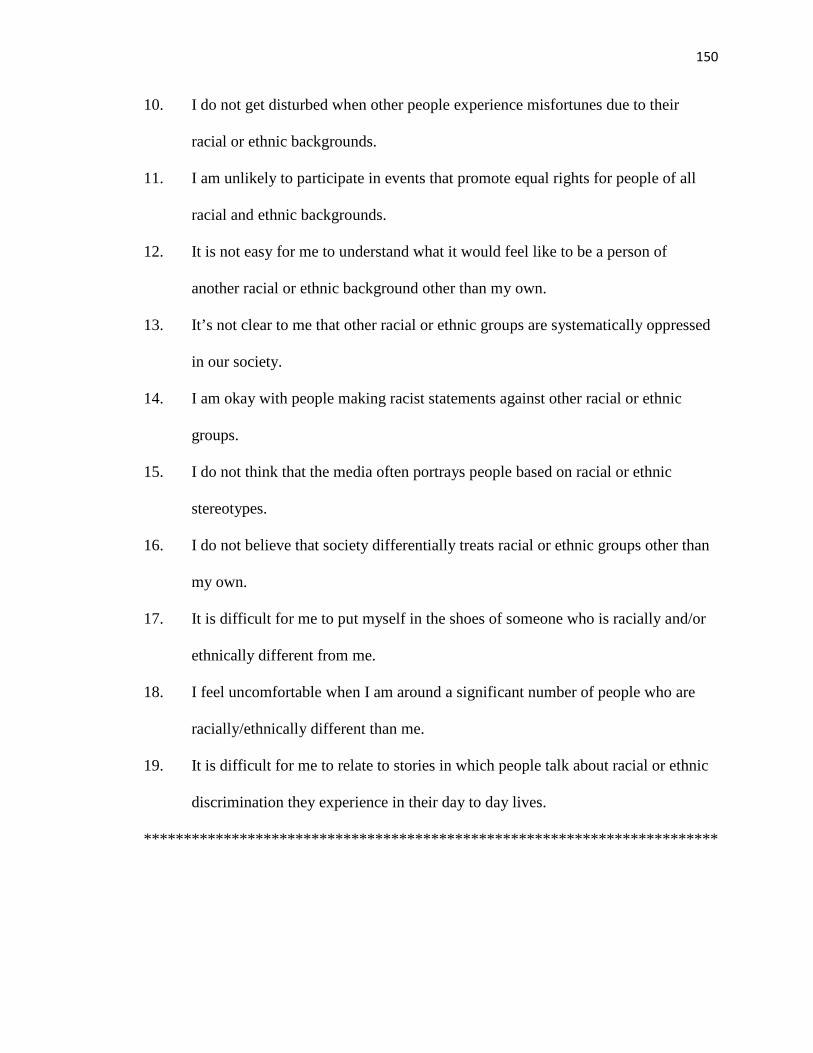
150
10. I do not get disturbed when other people experience misfortunes due to their
racial or ethnic backgrounds.
11. I am unlikely to participate in events that promote equal rights for people of all
racial and ethnic backgrounds.
12. It is not easy for me to understand what it would feel like to be a person of
another racial or ethnic background other than my own.
13. It’s not clear to me that other racial or ethnic groups are systematically oppressed
in our society.
14. I am okay with people making racist statements against other racial or ethnic
groups.
15. I do not think that the media often portrays people based on racial or ethnic
stereotypes.
16. I do not believe that society differentially treats racial or ethnic groups other than
my own.
17. It is difficult for me to put myself in the shoes of someone who is racially and/or
ethnically different from me.
18. I feel uncomfortable when I am around a significant number of people who are
racially/ethnically different than me.
19. It is difficult for me to relate to stories in which people talk about racial or ethnic
discrimination they experience in their day to day lives.
************************************************************************

151
Appendix C
Version of the Openness to Diversity/Challenge Scale (ODCS)
Administered in Study 2
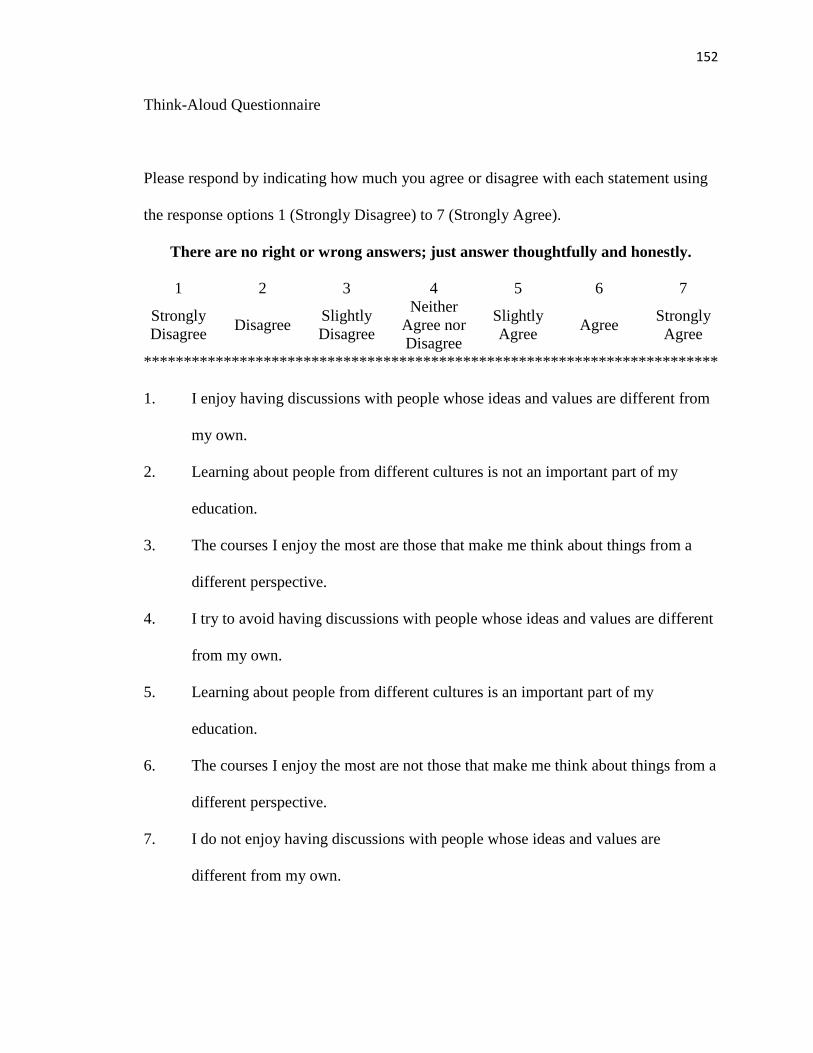
152
Think-Aloud Questionnaire
Please respond by indicating how much you agree or disagree with each statement using
the response options 1 (Strongly Disagree) to 7 (Strongly Agree).
There are no right or wrong answers; just answer thoughtfully and honestly.
1 2 3 4 5 6 7
Strongly Disagree Disagree Slightly
Disagree
Neither Agree nor Disagree
Slightly Agree Agree Strongly
Agree
************************************************************************
1. I enjoy having discussions with people whose ideas and values are different from
my own.
2. Learning about people from different cultures is not an important part of my
education.
3. The courses I enjoy the most are those that make me think about things from a
different perspective.
4. I try to avoid having discussions with people whose ideas and values are different
from my own.
5. Learning about people from different cultures is an important part of my
education.
6. The courses I enjoy the most are not those that make me think about things from a
different perspective.
7. I do not enjoy having discussions with people whose ideas and values are
different from my own.
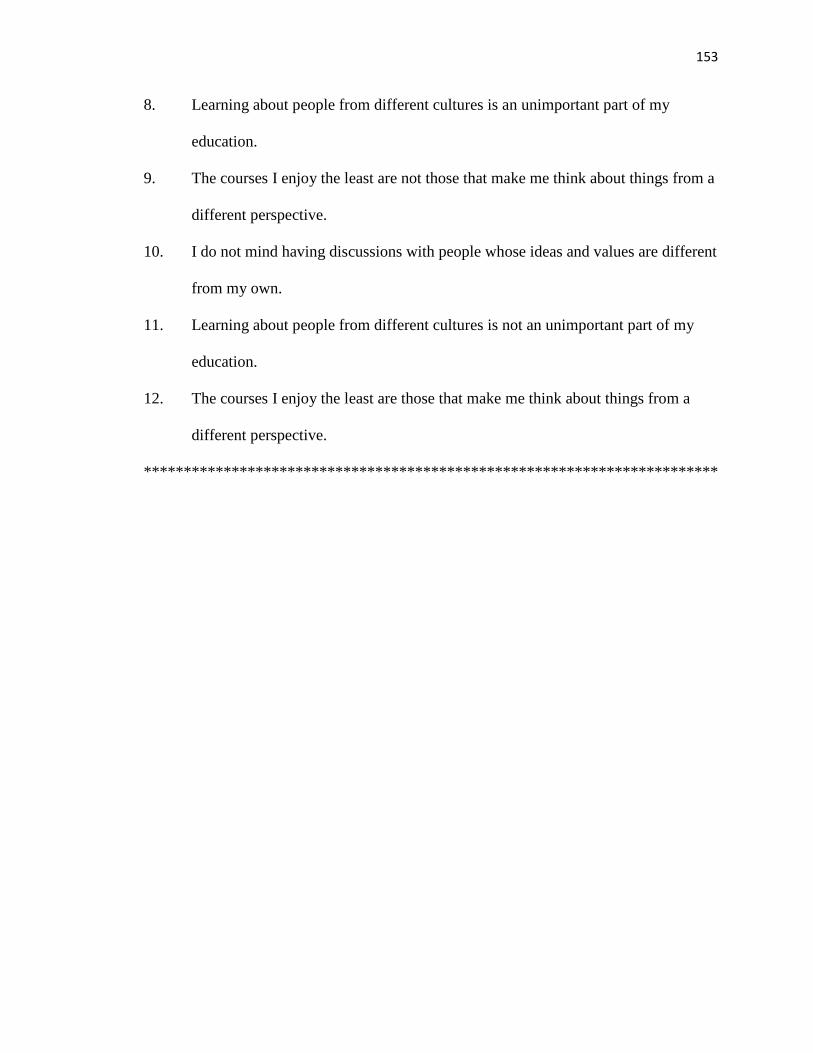
153
8. Learning about people from different cultures is an unimportant part of my
education.
9. The courses I enjoy the least are not those that make me think about things from a
different perspective.
10. I do not mind having discussions with people whose ideas and values are different
from my own.
11. Learning about people from different cultures is not an unimportant part of my
education.
12. The courses I enjoy the least are those that make me think about things from a
different perspective.
************************************************************************

154
Appendix D
Instructions and Training Materials Used in Study 2
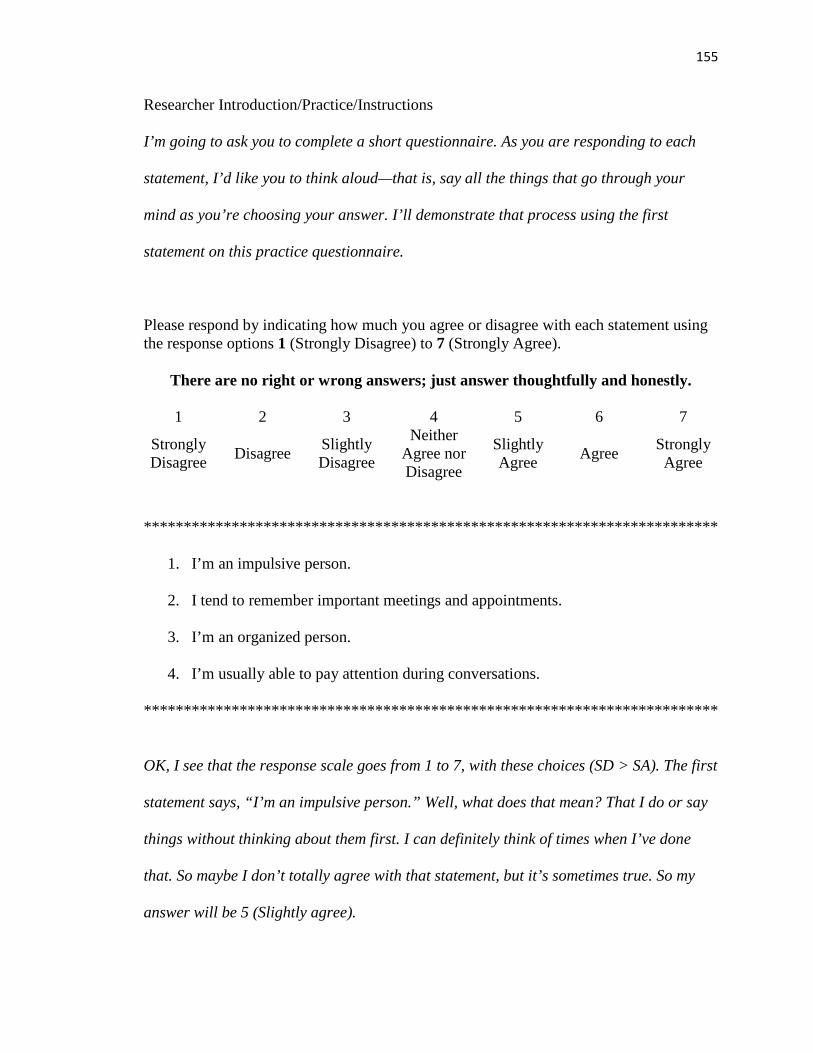
155
Researcher Introduction/Practice/Instructions
I’m going to ask you to complete a short questionnaire. As you are responding to each
statement, I’d like you to think aloud—that is, say all the things that go through your
mind as you’re choosing your answer. I’ll demonstrate that process using the first
statement on this practice questionnaire.
Please respond by indicating how much you agree or disagree with each statement using the response options 1 (Strongly Disagree) to 7 (Strongly Agree).
There are no right or wrong answers; just answer thoughtfully and honestly.
1 2 3 4 5 6 7
Strongly Disagree Disagree Slightly
Disagree
Neither Agree nor Disagree
Slightly Agree Agree Strongly
Agree
************************************************************************
1. I’m an impulsive person.
2. I tend to remember important meetings and appointments.
3. I’m an organized person.
4. I’m usually able to pay attention during conversations.
************************************************************************
OK, I see that the response scale goes from 1 to 7, with these choices (SD > SA). The first
statement says, “I’m an impulsive person.” Well, what does that mean? That I do or say
things without thinking about them first. I can definitely think of times when I’ve done
that. So maybe I don’t totally agree with that statement, but it’s sometimes true. So my
answer will be 5 (Slightly agree).
156
That example was just one way people might think through their answers. There’s no
“right” way to do it. I just want you to say all the things that go through your mind as
you’re choosing your answers. Does the thinking-aloud thing make sense? OK, you go
ahead and try the next couple.
[Give feedback/clarification/encouragement as needed for items 2 and 3. If additional
practice is needed, item 4 can be used.]
Now I’m going to turn on the recorder and we’ll move on to the real questionnaire.
Remember to talk out loud—say everything you’re thinking as you figure out your answer
choices. You don’t have to write down your answers, because they’re not the focus of the
study. I’m more interested in the process by which you reach your answers. Does that
make sense? OK, one thing you’ll notice about this questionnaire is that some of the
statements appear several times with slightly different wording. Don’t worry about trying
to be consistent. Just process each statement as if it’s the first one you’ve answered.
[During process, can prompt by saying, Remember to tell me what you’re thinking.]
157
Brief Structured Interview Questions
[Administer as soon as the 12 ODCS statements are finished.]
Great, thank you! We’re almost done, but before you go back to the other room I want to
ask you a couple of quick questions. And I’ll keep the recorder on if that’s OK, so I don’t
forget your answers.
First, were there any of these that you found confusing or difficult to process? Which
one(s)? Why?
OK, now re-read #1 and #4 (pause). Do you feel like they mean the same thing? Why
(not)? Does one seem more extreme than the other? If so, why? Can you imagine a
situation in which somebody might disagree with both #1 and #4?
Next, look at #3 and #6 (pause). Did one of those seem easier to process than the other
one? Why (not)? If you were just filling out this questionnaire on your own—not as part
of a study—would you feel like you had to give consistent answers for those? That is, if
you chose Agree for #3, and then you got down to #6, would you think, “Oh, #6 is
basically the opposite of #3, so I should choose Disagree”?
Thank you very much. Do you have any questions about anything?
[Turn off recorder.]

158
Appendix E
“Golden Ticket” Used to Recruit Study 2 Participants
159
Dear _________________________,
Instead of participating in the regularly scheduled Assessment Day activities, you have
been selected to participate in a special research study today! The research is designed to
help us understand the thinking processes involved in completing assessment tests and
questionnaires. In short, we’ll be asking you to help us make our assessment measures
better. Please gather your belongings and report to room _______ immediately after
reading this message. Participation in the research will meet all of the requirements for
Assessment Day. Once you arrive at room ______, we will describe the research in more
detail and you will have the opportunity to either accept or decline participation, as well
as the chance to ask any questions you might have about the research. We look forward
to hearing what you have to say!

160
Appendix F
Correlation Matrices for Datasets
Collected in Study 1
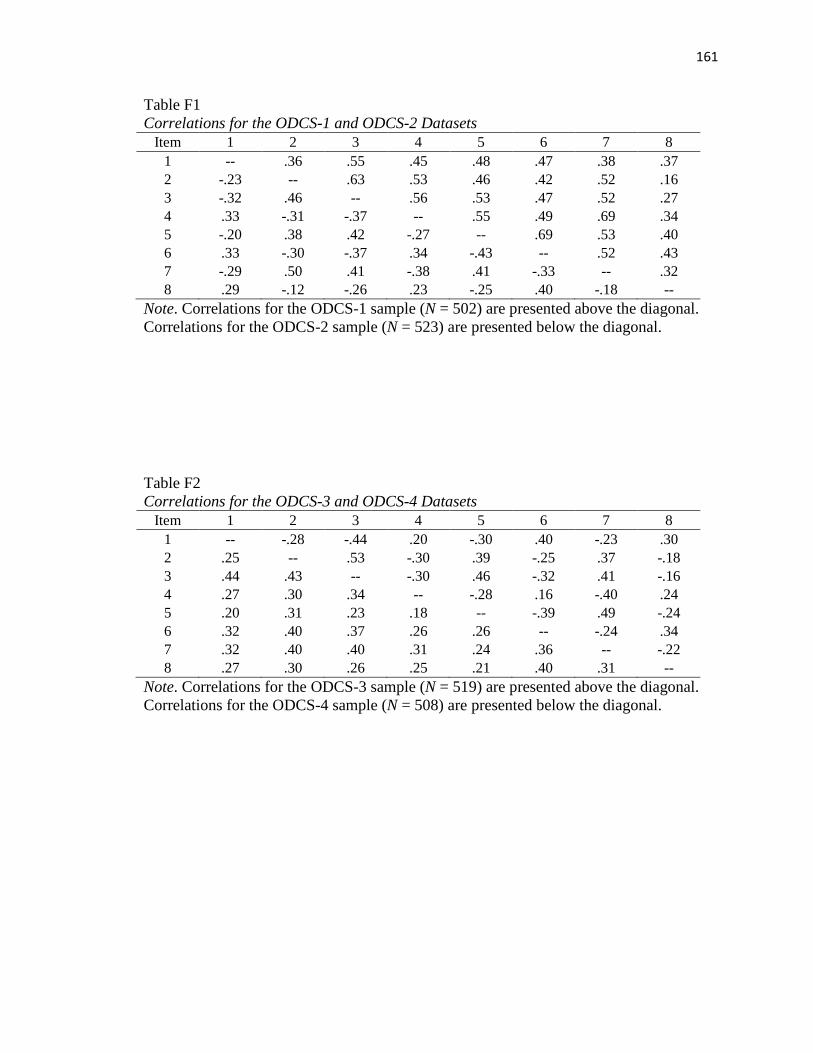
161
Table F1 Correlations for the ODCS-1 and ODCS-2 Datasets
Item 1 2 3 4 5 6 7 8 1 -- .36 .55 .45 .48 .47 .38 .37 2 -.23 -- .63 .53 .46 .42 .52 .16 3 -.32 .46 -- .56 .53 .47 .52 .27 4 .33 -.31 -.37 -- .55 .49 .69 .34 5 -.20 .38 .42 -.27 -- .69 .53 .40 6 .33 -.30 -.37 .34 -.43 -- .52 .43 7 -.29 .50 .41 -.38 .41 -.33 -- .32 8 .29 -.12 -.26 .23 -.25 .40 -.18 --
Note. Correlations for the ODCS-1 sample (N = 502) are presented above the diagonal. Correlations for the ODCS-2 sample (N = 523) are presented below the diagonal.
Table F2 Correlations for the ODCS-3 and ODCS-4 Datasets
Item 1 2 3 4 5 6 7 8 1 -- -.28 -.44 .20 -.30 .40 -.23 .30 2 .25 -- .53 -.30 .39 -.25 .37 -.18 3 .44 .43 -- -.30 .46 -.32 .41 -.16 4 .27 .30 .34 -- -.28 .16 -.40 .24 5 .20 .31 .23 .18 -- -.39 .49 -.24 6 .32 .40 .37 .26 .26 -- -.24 .34 7 .32 .40 .40 .31 .24 .36 -- -.22 8 .27 .30 .26 .25 .21 .40 .31 --
Note. Correlations for the ODCS-3 sample (N = 519) are presented above the diagonal. Correlations for the ODCS-4 sample (N = 508) are presented below the diagonal.
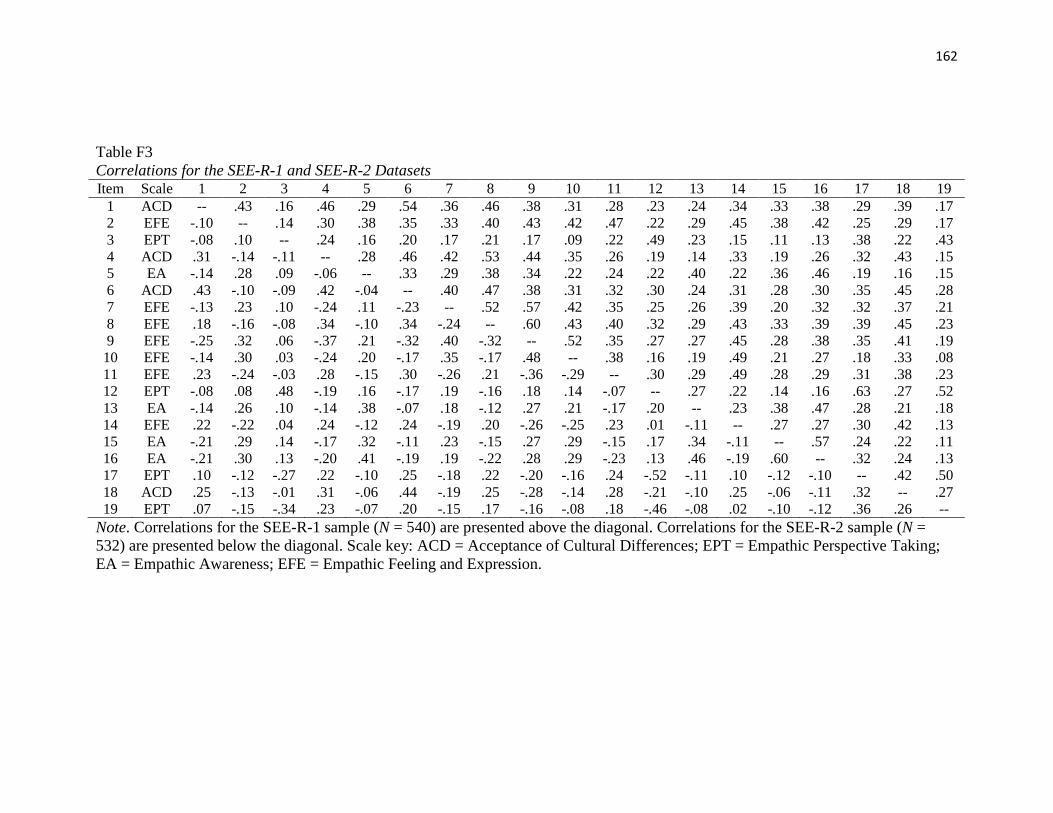
162
Table F3 Correlations for the SEE-R-1 and SEE-R-2 Datasets Item Scale 1 2 3 4 5 6 7 8 9 10 11 12 13 14 15 16 17 18 19
1 ACD -- .43 .16 .46 .29 .54 .36 .46 .38 .31 .28 .23 .24 .34 .33 .38 .29 .39 .17 2 EFE -.10 -- .14 .30 .38 .35 .33 .40 .43 .42 .47 .22 .29 .45 .38 .42 .25 .29 .17 3 EPT -.08 .10 -- .24 .16 .20 .17 .21 .17 .09 .22 .49 .23 .15 .11 .13 .38 .22 .43 4 ACD .31 -.14 -.11 -- .28 .46 .42 .53 .44 .35 .26 .19 .14 .33 .19 .26 .32 .43 .15 5 EA -.14 .28 .09 -.06 -- .33 .29 .38 .34 .22 .24 .22 .40 .22 .36 .46 .19 .16 .15 6 ACD .43 -.10 -.09 .42 -.04 -- .40 .47 .38 .31 .32 .30 .24 .31 .28 .30 .35 .45 .28 7 EFE -.13 .23 .10 -.24 .11 -.23 -- .52 .57 .42 .35 .25 .26 .39 .20 .32 .32 .37 .21 8 EFE .18 -.16 -.08 .34 -.10 .34 -.24 -- .60 .43 .40 .32 .29 .43 .33 .39 .39 .45 .23 9 EFE -.25 .32 .06 -.37 .21 -.32 .40 -.32 -- .52 .35 .27 .27 .45 .28 .38 .35 .41 .19
10 EFE -.14 .30 .03 -.24 .20 -.17 .35 -.17 .48 -- .38 .16 .19 .49 .21 .27 .18 .33 .08 11 EFE .23 -.24 -.03 .28 -.15 .30 -.26 .21 -.36 -.29 -- .30 .29 .49 .28 .29 .31 .38 .23 12 EPT -.08 .08 .48 -.19 .16 -.17 .19 -.16 .18 .14 -.07 -- .27 .22 .14 .16 .63 .27 .52 13 EA -.14 .26 .10 -.14 .38 -.07 .18 -.12 .27 .21 -.17 .20 -- .23 .38 .47 .28 .21 .18 14 EFE .22 -.22 .04 .24 -.12 .24 -.19 .20 -.26 -.25 .23 .01 -.11 -- .27 .27 .30 .42 .13 15 EA -.21 .29 .14 -.17 .32 -.11 .23 -.15 .27 .29 -.15 .17 .34 -.11 -- .57 .24 .22 .11 16 EA -.21 .30 .13 -.20 .41 -.19 .19 -.22 .28 .29 -.23 .13 .46 -.19 .60 -- .32 .24 .13 17 EPT .10 -.12 -.27 .22 -.10 .25 -.18 .22 -.20 -.16 .24 -.52 -.11 .10 -.12 -.10 -- .42 .50 18 ACD .25 -.13 -.01 .31 -.06 .44 -.19 .25 -.28 -.14 .28 -.21 -.10 .25 -.06 -.11 .32 -- .27 19 EPT .07 -.15 -.34 .23 -.07 .20 -.15 .17 -.16 -.08 .18 -.46 -.08 .02 -.10 -.12 .36 .26 --
Note. Correlations for the SEE-R-1 sample (N = 540) are presented above the diagonal. Correlations for the SEE-R-2 sample (N = 532) are presented below the diagonal. Scale key: ACD = Acceptance of Cultural Differences; EPT = Empathic Perspective Taking; EA = Empathic Awareness; EFE = Empathic Feeling and Expression.
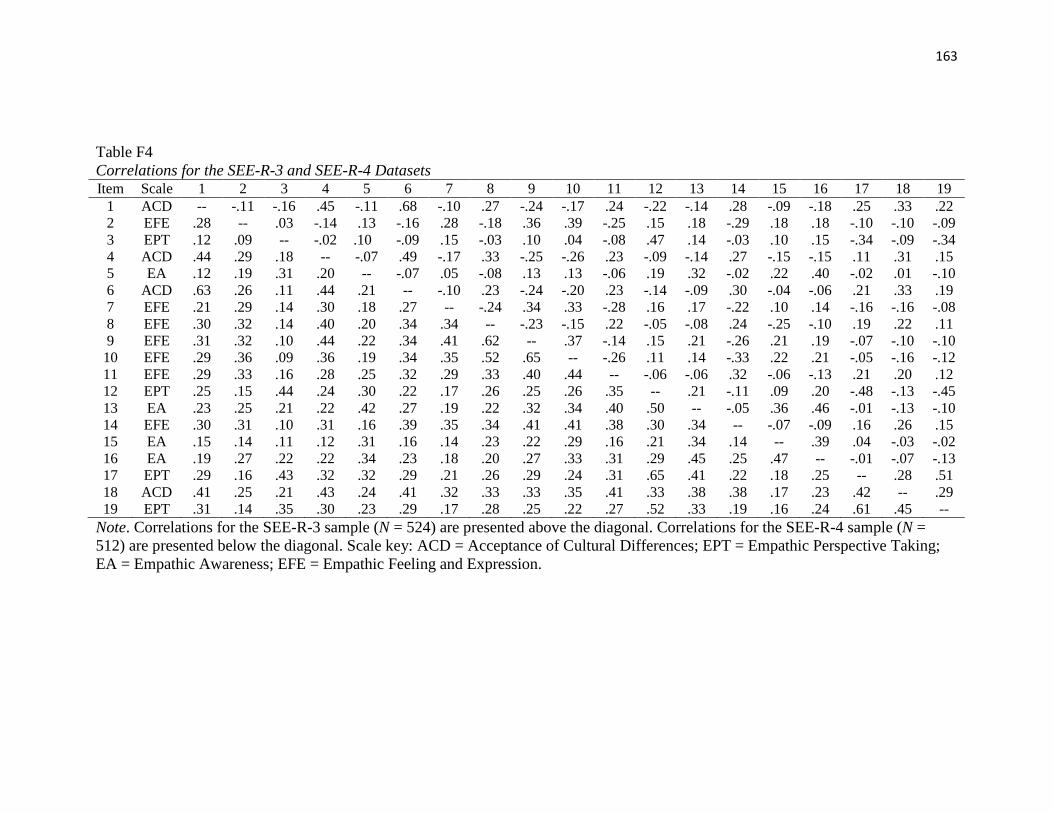
163
Table F4 Correlations for the SEE-R-3 and SEE-R-4 Datasets Item Scale 1 2 3 4 5 6 7 8 9 10 11 12 13 14 15 16 17 18 19
1 ACD -- -.11 -.16 .45 -.11 .68 -.10 .27 -.24 -.17 .24 -.22 -.14 .28 -.09 -.18 .25 .33 .22 2 EFE .28 -- .03 -.14 .13 -.16 .28 -.18 .36 .39 -.25 .15 .18 -.29 .18 .18 -.10 -.10 -.09 3 EPT .12 .09 -- -.02 .10 -.09 .15 -.03 .10 .04 -.08 .47 .14 -.03 .10 .15 -.34 -.09 -.34 4 ACD .44 .29 .18 -- -.07 .49 -.17 .33 -.25 -.26 .23 -.09 -.14 .27 -.15 -.15 .11 .31 .15 5 EA .12 .19 .31 .20 -- -.07 .05 -.08 .13 .13 -.06 .19 .32 -.02 .22 .40 -.02 .01 -.10 6 ACD .63 .26 .11 .44 .21 -- -.10 .23 -.24 -.20 .23 -.14 -.09 .30 -.04 -.06 .21 .33 .19 7 EFE .21 .29 .14 .30 .18 .27 -- -.24 .34 .33 -.28 .16 .17 -.22 .10 .14 -.16 -.16 -.08 8 EFE .30 .32 .14 .40 .20 .34 .34 -- -.23 -.15 .22 -.05 -.08 .24 -.25 -.10 .19 .22 .11 9 EFE .31 .32 .10 .44 .22 .34 .41 .62 -- .37 -.14 .15 .21 -.26 .21 .19 -.07 -.10 -.10
10 EFE .29 .36 .09 .36 .19 .34 .35 .52 .65 -- -.26 .11 .14 -.33 .22 .21 -.05 -.16 -.12 11 EFE .29 .33 .16 .28 .25 .32 .29 .33 .40 .44 -- -.06 -.06 .32 -.06 -.13 .21 .20 .12 12 EPT .25 .15 .44 .24 .30 .22 .17 .26 .25 .26 .35 -- .21 -.11 .09 .20 -.48 -.13 -.45 13 EA .23 .25 .21 .22 .42 .27 .19 .22 .32 .34 .40 .50 -- -.05 .36 .46 -.01 -.13 -.10 14 EFE .30 .31 .10 .31 .16 .39 .35 .34 .41 .41 .38 .30 .34 -- -.07 -.09 .16 .26 .15 15 EA .15 .14 .11 .12 .31 .16 .14 .23 .22 .29 .16 .21 .34 .14 -- .39 .04 -.03 -.02 16 EA .19 .27 .22 .22 .34 .23 .18 .20 .27 .33 .31 .29 .45 .25 .47 -- -.01 -.07 -.13 17 EPT .29 .16 .43 .32 .32 .29 .21 .26 .29 .24 .31 .65 .41 .22 .18 .25 -- .28 .51 18 ACD .41 .25 .21 .43 .24 .41 .32 .33 .33 .35 .41 .33 .38 .38 .17 .23 .42 -- .29 19 EPT .31 .14 .35 .30 .23 .29 .17 .28 .25 .22 .27 .52 .33 .19 .16 .24 .61 .45 --
Note. Correlations for the SEE-R-3 sample (N = 524) are presented above the diagonal. Correlations for the SEE-R-4 sample (N = 512) are presented below the diagonal. Scale key: ACD = Acceptance of Cultural Differences; EPT = Empathic Perspective Taking; EA = Empathic Awareness; EFE = Empathic Feeling and Expression.

164
Appendix G
Parameter Estimates
from Selected Study 1 CFA Models
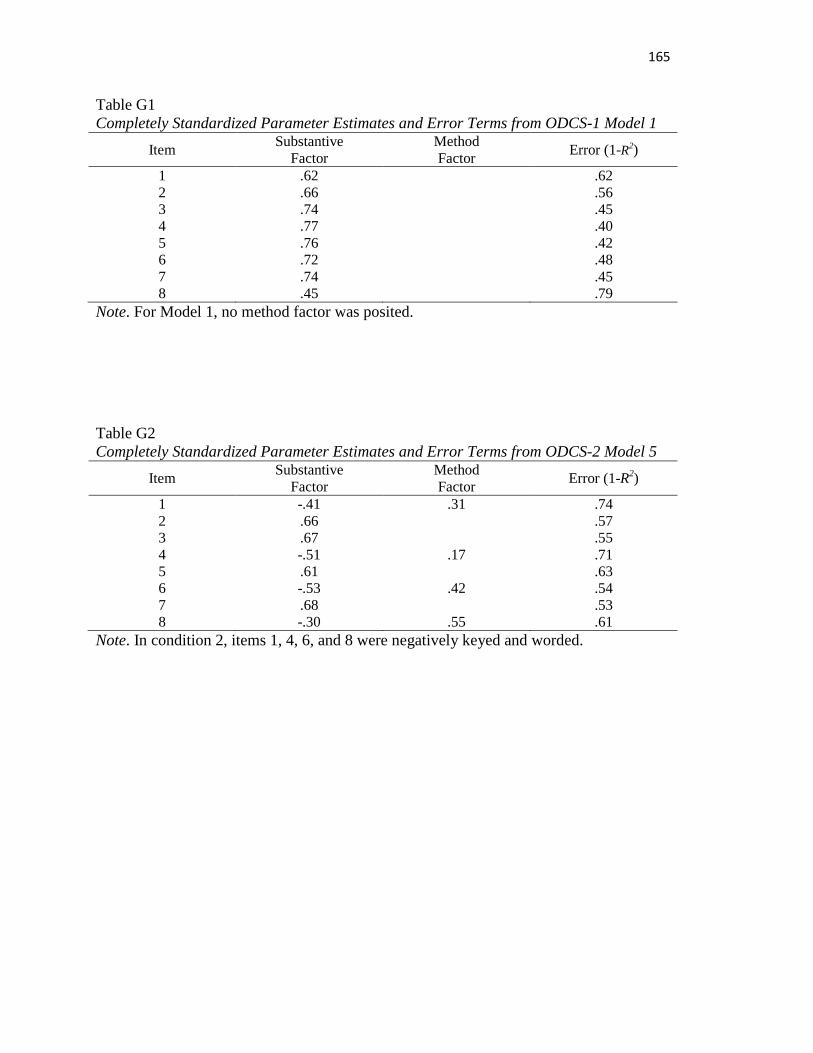
165
Table G1 Completely Standardized Parameter Estimates and Error Terms from ODCS-1 Model 1
Item Substantive Factor
Method Factor Error (1-R2)
1 .62 .62 2 .66 .56 3 .74 .45 4 .77 .40 5 .76 .42 6 .72 .48 7 .74 .45 8 .45 .79
Note. For Model 1, no method factor was posited.
Table G2 Completely Standardized Parameter Estimates and Error Terms from ODCS-2 Model 5
Item Substantive Factor
Method Factor Error (1-R2)
1 -.41 .31 .74 2 .66 .57 3 .67 .55 4 -.51 .17 .71 5 .61 .63 6 -.53 .42 .54 7 .68 .53 8 -.30 .55 .61
Note. In condition 2, items 1, 4, 6, and 8 were negatively keyed and worded.
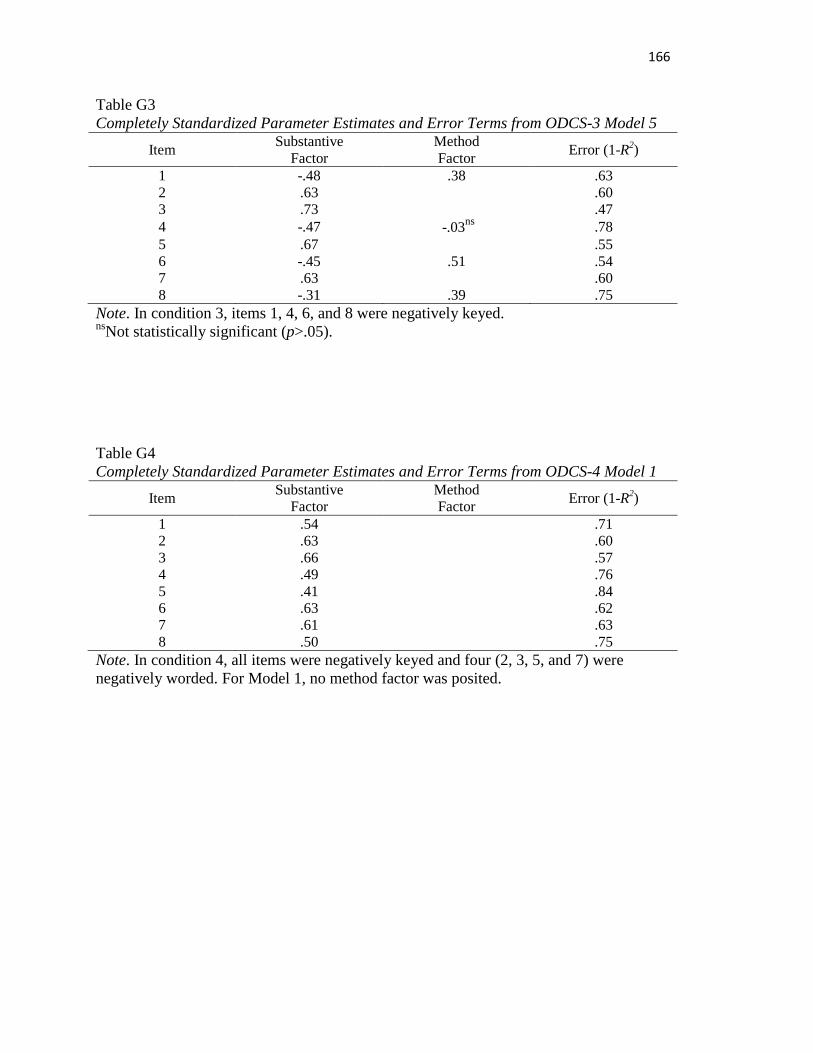
166
Table G3 Completely Standardized Parameter Estimates and Error Terms from ODCS-3 Model 5
Item Substantive Factor
Method Factor Error (1-R2)
1 -.48 .38 .63 2 .63 .60 3 .73 .47 4 -.47 -.03ns .78 5 .67 .55 6 -.45 .51 .54 7 .63 .60 8 -.31 .39 .75
Note. In condition 3, items 1, 4, 6, and 8 were negatively keyed. nsNot statistically significant (p>.05).
Table G4 Completely Standardized Parameter Estimates and Error Terms from ODCS-4 Model 1
Item Substantive Factor
Method Factor Error (1-R2)
1 .54 .71 2 .63 .60 3 .66 .57 4 .49 .76 5 .41 .84 6 .63 .62 7 .61 .63 8 .50 .75
Note. In condition 4, all items were negatively keyed and four (2, 3, 5, and 7) were negatively worded. For Model 1, no method factor was posited.

167
Table G5 Completely Standardized Parameter Estimates and Error Terms from SEE-R-1 Model 1
Item ACD Factor
EPT Factor
EA Factor
EFE Factor
Method Factor Error (1-R2)
1 .68 .54 2 .62 .62 3 .57 .67 4 .67 .55 5 .60 .64 6 .71 .50 7 .67 .56 8 .76 .43 9 .75 .44
10 .63 .61 11 .58 .67 12 .81 .35 13 .60 .64 14 .64 .59 15 .67 .56 16 .80 .36 17 .78 .39 18 .65 .58 19 .65 .58
Note. For Model 1, no method factor was posited.
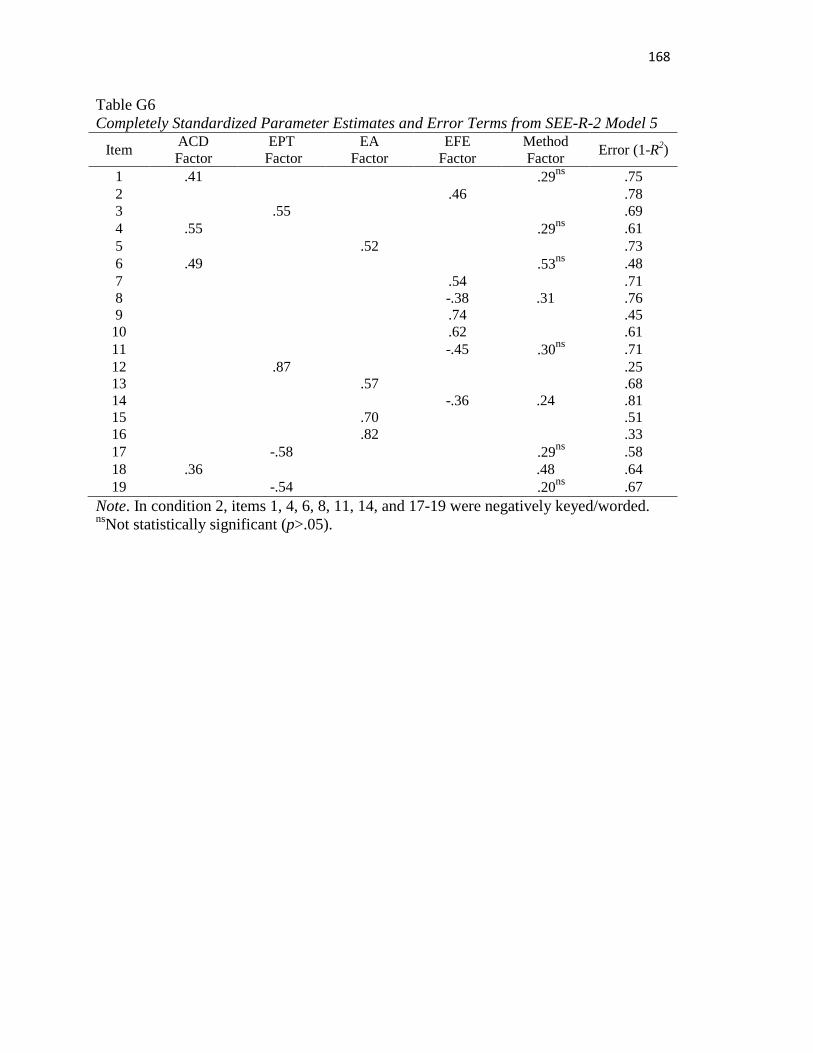
168
Table G6 Completely Standardized Parameter Estimates and Error Terms from SEE-R-2 Model 5
Item ACD Factor
EPT Factor
EA Factor
EFE Factor
Method Factor Error (1-R2)
1 .41 .29ns .75 2 .46 .78 3 .55 .69 4 .55 .29ns .61 5 .52 .73 6 .49 .53ns .48 7 .54 .71 8 -.38 .31 .76 9 .74 .45
10 .62 .61 11 -.45 .30ns .71 12 .87 .25 13 .57 .68 14 -.36 .24 .81 15 .70 .51 16 .82 .33 17 -.58 .29ns .58 18 .36 .48 .64 19 -.54 .20ns .67
Note. In condition 2, items 1, 4, 6, 8, 11, 14, and 17-19 were negatively keyed/worded. nsNot statistically significant (p>.05).
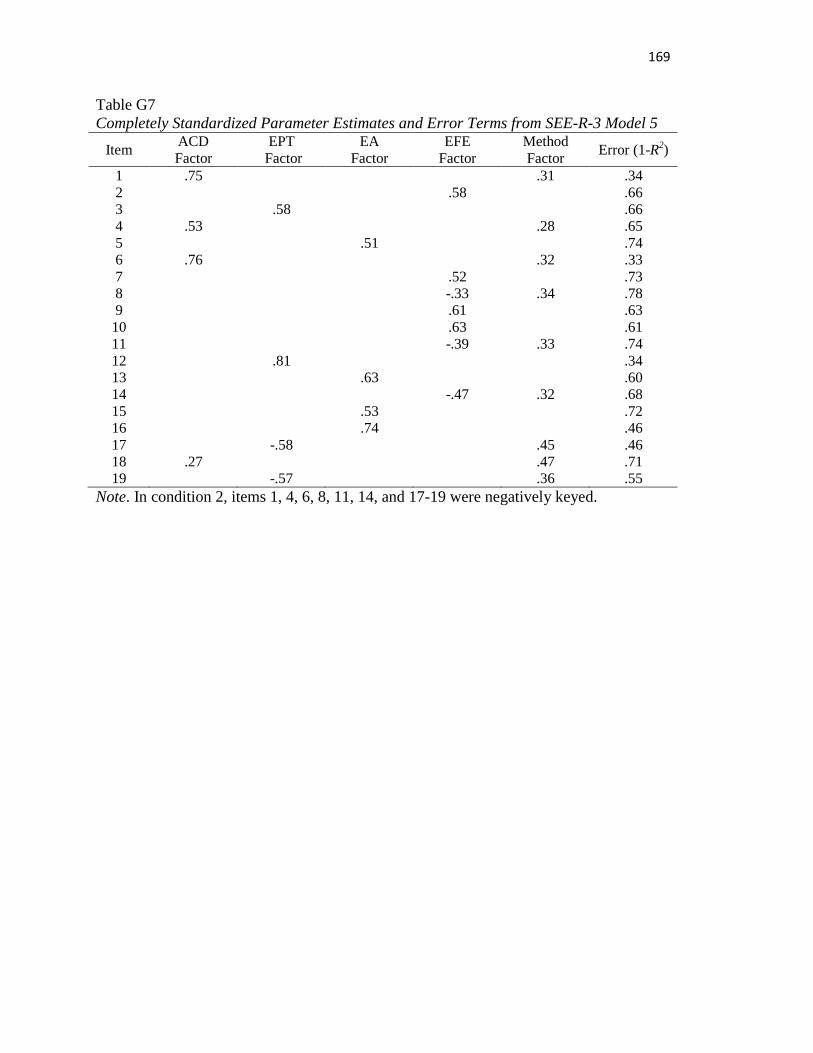
169
Table G7 Completely Standardized Parameter Estimates and Error Terms from SEE-R-3 Model 5
Item ACD Factor
EPT Factor
EA Factor
EFE Factor
Method Factor Error (1-R2)
1 .75 .31 .34 2 .58 .66 3 .58 .66 4 .53 .28 .65 5 .51 .74 6 .76 .32 .33 7 .52 .73 8 -.33 .34 .78 9 .61 .63
10 .63 .61 11 -.39 .33 .74 12 .81 .34 13 .63 .60 14 -.47 .32 .68 15 .53 .72 16 .74 .46 17 -.58 .45 .46 18 .27 .47 .71 19 -.57 .36 .55
Note. In condition 2, items 1, 4, 6, 8, 11, 14, and 17-19 were negatively keyed.
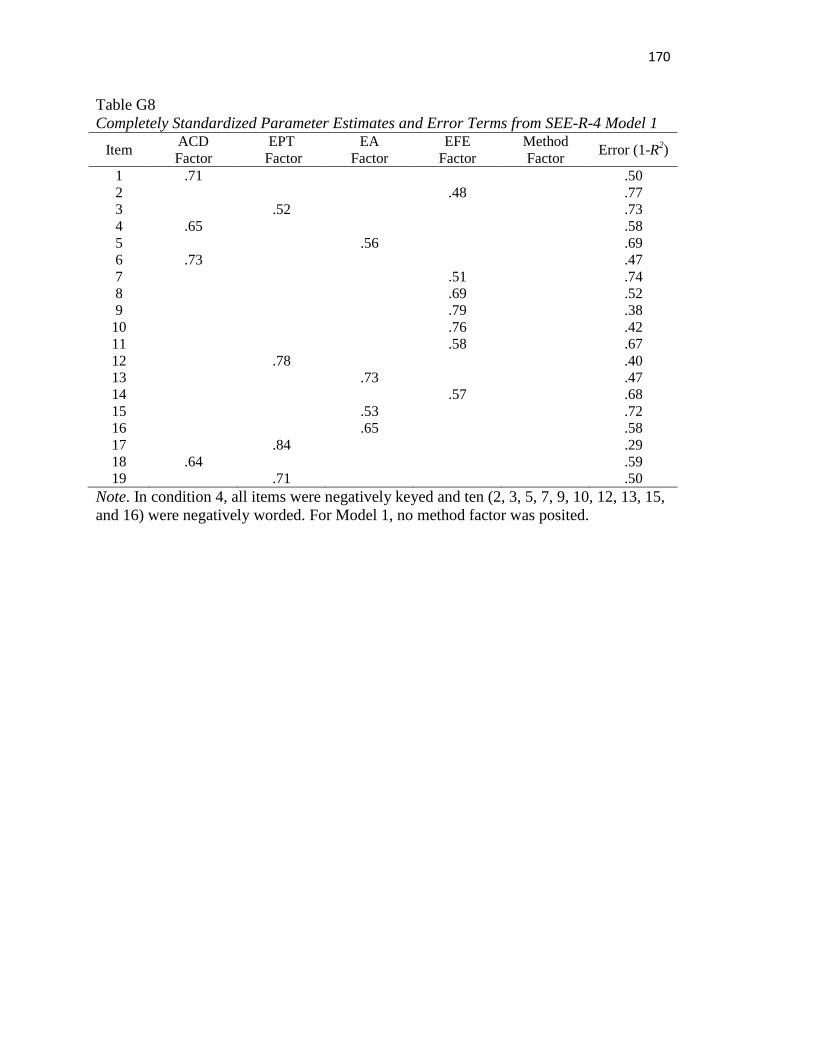
170
Table G8 Completely Standardized Parameter Estimates and Error Terms from SEE-R-4 Model 1
Item ACD Factor
EPT Factor
EA Factor
EFE Factor
Method Factor Error (1-R2)
1 .71 .50 2 .48 .77 3 .52 .73 4 .65 .58 5 .56 .69 6 .73 .47 7 .51 .74 8 .69 .52 9 .79 .38
10 .76 .42 11 .58 .67 12 .78 .40 13 .73 .47 14 .57 .68 15 .53 .72 16 .65 .58 17 .84 .29 18 .64 .59 19 .71 .50
Note. In condition 4, all items were negatively keyed and ten (2, 3, 5, 7, 9, 10, 12, 13, 15, and 16) were negatively worded. For Model 1, no method factor was posited.
171
References
Ahlawat, K. (1985). On the negative valence items in self-report measures. Journal of
General Psychology, 112, 89-99.
Alessandri, G., Vecchione, M., Tisak, J., & Barbaranelli, C. (2011). Investigating the
nature of method factors through multiple informants: Evidence for a specific
factor? Multivariate Behavioral Research, 46, 625-642.
Angleitner, A., John, O., & Löhr, F.-J. (1986). It's what you ask and how you ask it: An
itemmetric analysis of personality questionnaires. In A. Angleitner (Ed.),
Personality assessment via questionnaires (pp. 61 - 107). Berlin [u.a.]: Springer.
Asher, S., Hymel, S., & Renshaw, P. (1984). Loneliness in children. Child
Development, 55, 1456–1464.
Attride-Stirling, J. (2001). Thematic networks: An analytic tool for qualitative research.
Qualitative Research, 1, 385-405.
Barnette, J. (2000). Effects of stem and Likert response option reversals on survey
internal consistency: If you feel the need, there is a better alternative to using
those negatively worded stems. Educational and Psychological Measurement, 60,
361-370.
Bass, B. (1956). Development and evaluation of a scale for measuring social
acquiescence. Journal of Abnormal and Social Psychology, 53, 296-299.
Benson, J. & Hocevar, D. (1985). The impact of item phrasing on the validity of attitude
scales for elementary school children. Journal of Educational Measurement, 22,
231-240.
172
Bentler, P. (1990). Comparative fit indexes in structural models. Psychological
Bulletin, 107, 238–246.
Bentler, P. (2009). Alpha, dimension-free, and model-based internal consistency
reliability. Psychometrika, 74, 137–143.
Bentler, P., Jackson, D., & Messick, S. (1971). Identification of content and style: A
two-dimensional interpretation of acquiescence. Psychological Bulletin, 76,
186-204.
Bentler, P., & Jackson, D., & Messick, S. (1972). A rose by any other name.
Psychological Bulletin, 77, 109-113.
Bernstein, I., & Eveland, D. (1982). State vs. trait anxiety: A case study in confirmatory
factor analysis. Personality and Individual Differences, 3, 361-372.
Bernstein, I., & Garbin, C. (1985). A comparison of alternative proposed subscale
structures for MMPI Scale 2. Multivariate Behavioral Research, 20, 223-235.
Biber, D. (1988). Variation across speech and writing. Cambridge, UK: Cambridge
University Press.
Billiet, J., & McClendon, M. (2000). Modeling acquiescence in measurement models for
two balanced sets of items. Structural Equation Modeling, 7, 608-628.
Block, J. (1971). On further conjectures regarding acquiescence. Psychological Bulletin,
76, 205-210.
Bollen, K. (1989). Structural equation modeling with latent variables. New York: Wiley.
Borgers, N., Hox, J., & Sikkel, D. (2004). Response effects in surveys on children and
adolescents: The effect of number of response options, negative wording, and
neutral mid-point. Quality & Quantity, 38, 17-33.
173
Brown, K., & Ryan, R. (2003). The benefits of being present: Mindfulness and its
role in psychological well-being. Journal of Personality and Social Psychology,
84, 822–848.
Browne, M., & Cudeck, R. (1993). Alternative ways of assessing model fit.
Sociological Methods and Research, 21, 230–258.
Carmines, E., & Zeller, R. (1979). Reliability and validity assessment. Beverly Hills:
Sage.
Carpenter, P., & Just, M. (1975). Sentence comprehension: A psycholinguistic
processing model of verification. Psychological Review, 82, 45-73.
Chang, L. (1995a). Connotatively inconsistent test items. Applied Measurement in
Education, 8, 199-209.
Chang, L. (1995b). Connotatively consistent and reversed connotatively consistent items
are not fully equivalent: Generalizability study. Educational and Psychological
Measurement, 55, 991-997.
Chen, Y., Rendina-Gobioff, G., & Dedrick, R. (2010). Factorial invariance of a Chinese
self-esteem scale for third and sixth grade students: Evaluating method effects
associated with positively and negatively worded items. International Journal of
Educational and Psychological Assessment, 6, 21-35.
Clark, J., & Plano Clark, V. (2011). Designing and Conducting Mixed Methods
Research (2nd edition). Thousand Oaks, CA: Sage.
Cloud, J., & Vaughn, G. (1970). Using balanced scales to control acquiescence.
Sociometry, 33, 193-202.
174
Cordery, J., & Sevastos, P. (1993). Responses to the original and revised Job Diagnostic
Survey: Is education a factor in responses to negatively worded items? Journal of
Applied Psychology, 78, 141-143.
Corwyn, R. (2000). The factor structure of global self-esteem among adolescents and
adults. Journal of Research in Personality, 34, 357-379.
Cote, J., & Buckley, R. (1987). Estimating trait, method, and error variance: Generalizing
across 70 construct validation studies. Journal of Marketing Research, 24,
315-318.
Couch, A., & Keniston, K. (1960). Yeasayers and naysayers: Agreeing response set as a
personality variable. Journal of Abnormal and Social Psychology, 60, 151-174.
Cremeens, J., Eiser, C., & Blades, M. (2007). A qualitative investigation of school-aged
children’s answers to items from a generic quality of life measure. Child: Care,
Health and Development, 33, 83-89.
Crocker, L., & Algina, J. (1986). Introduction to classical and modern test theory.
Wadsworth Group: Belmont, CA.
Cronbach, L. (1946). Response sets and test validity. Educational and Psychological
Measurement, 6, 475-494.
Cronbach, L. (1950). Further evidence on response sets and test design. Educational and
Psychological Measurement, 10, 3-31.
DiStefano, C., Morgan, G., & Motl, R. (2012). An examination of personality
characteristics related to acquiescence. Journal of Applied Measurement, 13,
41-56.
175
DiStefano, C., & Motl, R. (2006). Further investigating method effects associated with
negatively worded items on self-report surveys. Structural Equation Modeling,
13, 440-464.
DiStefano, C., & Motl, R. (2009). Personality correlates of method effects due to
negatively worded items on the Rosenberg Self-Esteem scale. Personality and
Individual Differences, 46, 309-313.
Dunbar, Ford, Hunt, & Der (2000). Question wording effects in the assessment of
global self-esteem. European Journal of Psychological Assessment, 16, 13-19.
Ebesutani, C., Drescher, C., Reise, S., Heiden, L., Hight, T., Damon, J., & Young, J.
(2012). The importance of modeling method effects: Resolving the
(uni)dimensionality of the Loneliness Questionnaire. Journal of Personality
Assessment, 94, 186-195.
Finney, S. (2001). A comparison of the psychometric properties of negatively and
positively worded questionnaire items. Unpublished dissertation.
Finney, S., & DiStefano, C. (2006). Non-normal and categorical data in structural
equation modeling. In G. Hancock & R. Muller (Eds.), Structural equation
modeling: A second course (pp. 269-314). Information Age Publishing.
Foss, D., & Hakes, D. (1978). Psycholinguistics: An introduction to the psychology of
language. Englewood Cliffs, NJ: Prentice-Hall.
Gadermann, A., Guhn, M., & Zumbo, B. (2010). Investigating the substantive aspect of
construct validity for the Satisfaction with Life Scale adapted for children: A
focus on cognitive processes. Social Indicators Research, 100, 37-60.
176
Gerstner, J. (2012). Evaluating the psychometric properties of the Scale of Ethnocultural
Empathy: A confirmatory factor analytic approach. Manuscript submitted for
publication.
Green, S., & Yang, Y. (2009). Reliability of summed item scores using structural
equation modeling: An alternative to coefficient alpha. Psychometrika, 74,
155-167.
Greenberger, E., Chen, C., Dmitrieva, J., & Farruggia, S. (2003). Item-wording and the
dimensionality of the Rosenberg Self-Esteem Scale: Do they matter? Personality
and Individual Differences, 35, 1241-1254.
Grove, W., & Geerken, M. (1977). Response bias in surveys of mental health: An
empirical investigation. American Journal of Sociology, 82, 1289-1316.
Haertzen, C., Meketon, M., & Hooks, N. (1970). Subjective experiences produced by
the withdrawal of opiates. British Journal of Addiction, 65, 245-255.
Harrison, D., McLaughlin, M., & Coalter, T. (1996). Context, cognition, and common
method variance: Psychometric and verbal protocol evidence. Organizational
Behavior and Human Decision Processes, 68, 246-261.
Hart, E., Leary, M., & Rejeski, W. (1989). The measurement of social physique anxiety.
Journal of Sport and Exercise Psychology, 11, 94-104.
Harter, J. (1997). The psychometric utility of the midpoint on a Likert scale. Unpublished
dissertation.
Hazlett-Stevens, H., Ullman, J., & Craske, M. (2004). Factor structure of the Penn State
Worry Questionnaire: Examination of a method factor. Assessment, 11, 361-370.
177
Höfling, V., Moosbrugger, H., Schermelleh-Engel, K., & Heidenreich, T. (2011).
Mindfulness or Mindlessness? A Modified Version of the Mindful Attention and
Awareness Scale (MAAS). European Journal of Psychological Assessment, 27,
59-64.
Holden, R., Fekken, G., & Cotton, D. (1991). Assessing psychopathology using
structured test-item response latencies. Psychological Assessment, 3, 111-118.
Holden, R., Fekken, G., & Jackson, D. (1985). Structured personality test item
characteristics and validity. Journal of Research in Personality, 19, 386-394.
Holden, R., & Troister, T. (2009). Developments in the self-report assessment of
personality and psychopathology in adults. Canadian Psychology, 50, 120-130.
Horan, P., DiStefano, C., & Motl, R. (2003). Wording effects in self-esteem scales:
Methodological artifact or response style? Structural Equation Modeling, 10,
435-455.
Hu, L., & Bentler, P. (1999). Cutoff criteria for fit indexes in covariance structure
analysis: Conventional criteria versus new alternatives. Structural Equation
Modeling, 6, 1–55.
Ibrahim, A. (2001). Differential responding to positive and negative items: The case of
a negative item in a questionnaire for course and faculty evaluation.
Psychological Reports, 88, 497-500.
Idaszak, J., & Drasgow, F. (1987). A revision of the Job Diagnostic Survey: Elimination
of a measurement artifact. Journal of Applied Psychology, 27, 69-74.
Jackson, D., & Lay, C. (1968). Homogeneous dimensions of personality scale content.
Multivariate Behavioral Research, 3, 321-337.
178
Johnston, M., & Finney, S. (2010). Measuring basic needs satisfaction: Evaluating
previous research and conducting new psychometric evaluations of the Basic
Needs Satisfaction in General Scale. Contemporary Educational Psychology,
35, 280-296.
Juni, S., Hanson, M., & Ottomanelli, G. (1996). Reliability of the Weak Opiate
Withdrawal Scale for inner-city opiate users. Psychological Reports, 79,
1273-1274.
Krosnick, J. (1991). Response strategies for coping with the cognitive demands of
attitude measures in surveys. Applied Cognitive Psychology, 5, 213–236.
Krosnick, J., Narayan, S., & Smith, W. (1996). Satisficing in surveys: Initial evidence.
New Directions for Evaluation, 1996, 29–44.
Kuncel, R. (1977). The subject-item interaction in itemmetric research. Educational and
Psychological Measurement, 37, 665-678.
Lai, J. (1994). Differential predictive power of the positively versus the negatively
worded items of the Life Orientation Test. Psychological Reports, 75,
1507-1515.
Lindwall, M., Barkoukis, V., Grano, C., Lucidi, F., Raudsepp, L., Liukkonen, J., &
Thøgersen-Ntoumani, C. (2012). Method effects: The problem with negatively
versus positively keyed items. Journal of Personality Assessment, 94, 196-204.
Lorge, I. (1937). Gen-like: Halo or reality? Psychological Bulletin, 34, 545-546.
Magazine, S., Williams, L., & Williams, M. (1996). A confirmatory factor analysis
examination of reverse coding effects in Meyer and Allen’s Affective and
179
Continuance Commitment Scales. Educational and Psychological
Measurement, 56, 241-250.
Marsh, H. (1986). Negative item bias in ratings scales for preadolescent children:
A cognitive-developmental phenomenon. Developmental Psychology, 22,
37-49.
Marsh, H. (1996). Positive and negative global self-esteem: A substantively meaningful
distinction or artifactors? Journal of Personality and Social Psychology, 70,
810-819.
Marsh, H., Scalas, L., & Nagenast, B. (2010). Longitudinal tests of competing factor
structures for the Rosenberg Self-Esteem Scale: Traits, ephemeral artifacts, and
stable response styles. Psychological Assessment, 22, 366-381.
Marsh, K. R. (2013). The effects of item and respondent characteristics on midpoint
response option endorsement: A mixed methods approach. Unpublished
dissertation.
McDonald, R. (1999). Test theory: A unified treatment. Mahwah, New Jersey:
Lawrence Erlbaum Associates.
McPherson, J., & Mohr, P. (2005). The role of item extremity in the emergence of
keying-related factors: An exploration with the Life Orientation Test.
Psychological Methods, 10, 120-131.
Melnick, S. & Gable, R. (1990). The use of negative item stems: A cautionary note.
Educational Research Quarterly, 14, 31-36.
180
Meyer, J., & Allen, N. (1984). Testing the “side-bet theory” of organizational
commitment: Some methodological considerations. Journal of Applied
Psychology, 69, 372-378.
Meyer, T., Miller, M., Metzger, R., & Borkovec, T. (1990). Development and validation
of the Penn State Worry Questionnaire. Behaviour Research and Therapy, 28,
487-495.
Miller, T., & Cleary, T. (1993). Direction of wording effects in balanced scales.
Educational and Psychological Measurement, 53, 51-60.
Mook, J., Kleijn, W., & van der Ploeg, H. (1991). Symptom-positively and -negatively
worded items in two popular self-report inventories of anxiety and depression.
Psychological Reports, 69, 551-560.
Mook, J., Kleijn, W., & van der Ploeg, H. (1992). Positively and negatively worded items
in a self-report measure of dispositional optimism. Psychological Reports, 71,
275-278.
Motl, R., Conroy, D., & Horan, P. (2000). The Social Physique Anxiety Scale: An
example of the potential consequence of negatively worded items in factorial
validity studies. Journal of Applied Measurement, 1, 327-345.
Muthén, L.K., & Muthén, B.O. (2012). Mplus user’s guide [Computer software and
manual], (7th ed.). Los Angeles: Muthén & Muthén.
Nunnally, J. (1978). Psychometric Theory (2nd ed.). New York: McGraw-Hill.
Pascarella, E., Bohr, L., Nora, A., Ranganathan, S., Desler, M., & Bulakowski, C. (1994).
Impacts of 2‐year and 4‐year colleges on learning orientations: A preliminary
study. Community College Journal of Research and Practice, 18, 577-589.
181
Pascarella, E., Edison, M., Nora, A., Hagedorn, L., & Terenzini, P. (1996). Influences on
students’ openness to diversity and challenge in the first year of college. Journal
of Higher Education, 67, 174-195.
Peterson, C. & Peterson, J. (1976). Linguistic determinants of the difficulty of true-false
test items. Educational and Psychological Measurement, 36, 161-164.
Pilotte, W., & Gable, R. (1990). The impact of positive and negative item stems on the
validity of a computer anxiety scale. Educational and Psychological
Measurement, 50, 603-610.
Pinker, S. (1994). The language instinct: How the mind creates language. New York:
William Morrow and Company.
Podsakoff, P., MacKenzie, S., Lee, J., & Podsakoff, N. (2003). Common method biases
in behavioral research: A critical review of the literature and recommended
remedies. Journal of Applied Psychology, 88, 879-903.
Pohl, S., & Steyer, R. (2010). Modeling common traits and method effects in multitrait-
multimethod analysis. Multivariate Behavioral Research, 45, 45-72.
Presser, S., & Schuman, H. (1980). The measurement of a middle position in attitude
surveys. The Public Opinion Quarterly, 44, 70-85.
Quilty, L., Oakman, J., & Risko, E. (2006). Correlates of the Rosenberg Self-Esteem
scale method effects. Structural Equation Modeling, 13, 99-117.
Raykov, T., & Shrout, P. (2002). Reliability of scales with general structure: Point and
interval estimation using a structural equation modeling approach. Structural
Equation Modeling, 9, 195-212.
182
Rhemtulla, M., Brosseau-Liard, P., & Savalei, V. (2012). When can categorical variables
be treated as continuous? A comparison of robust continuous and categorical
SEM estimation methods under suboptimal conditions. Psychological Methods,
17, 354-373.
Roberts, R., Lewinsohn, P., & Seeley, J. (1993). A brief measure of loneliness suitable
for use with adolescents. Psychological Reports, 72, 1379-1391.
Rorer, L. (1965). The great response style myth. Psychological Bulletin, 63, 129-156.
Rosenberg, M (1989). Society and the Adolescent Self-Image (revised edition).
Middletown, CT: Wesleyan University Press.
Russell, D., Peplau, L., & Cutrona, C. (1980). The revised UCLA Loneliness scale:
Concurrent and discriminant validity evidence. Journal of Personality
Assessment, 42, 290-294.
Russell, J., & Carroll, J. (1999). On the bipolarity of positive and negative affect.
Psychological Bulletin, 125, 3-30.
Samelson, F. (1972). Response style: A psychologist’s fallacy? Psychological Bulletin,
78, 13-16.
Scheier, M., & Carver, C. (1985). Optimism, coping, and health: Assessment and
implications of generalized outcome expectancies. Health Psychology, 4,
219-247.
Schmitt, N., & Stults, D. (1985). Factors defined by negatively keyed items: The result
of careless respondents? Applied Psychological Measurement, 9, 367-373.
183
Schriesheim, C., & Eisenbach, R. (1995). An exploratory and confirmatory factor
analytic investigation of item wording effects on the obtained factor structures
of survey questionnaire measures. Journal of Management, 21, 1177-1193.
Schriesheim, C., Eisenbach, R., & Hill, K. (1991). The effect of negation and polar
opposite item reversals on questionnaire reliability and validity: An experimental
investigation. Educational and Psychological Measurement, 51, 67-78.
Schriesheim, C., & Hill, K. (1981). Controlling acquiescence response bias by item
Reversals: The effect on questionnaire validity. Educational and Psychological
Measurement, 41, 1101-1114.
Schuman, H., & Presser, S. (1981). Questions and answers in attitude surveys.
New York: Academic Press.
Shavelson, R., & Marsh, H. (1986). On the structure of self-concept. In R. Schwarzer
(Ed.), Anxiety and cognitions. Hillsdale, NJ: Erlbaum.
Sherman, M. (1973). Bound to be easier? The negative prefix and sentence
comprehension. Journal of Verbal Learning and Verbal Behavior, 12, 73-84.
Sherman, M. (1976). Adjectival negation and the comprehension of multiply negated
sentences. Journal of Verbal Learning and Verbal Behavior, 15, 143-157.
Simpson, R., Rentz, R., & Shrum, J. (1976). Influence of instrument characteristics on
student responses in attitude assessment. Journal of Research in Science
Teaching, 13, 275-281.
Spector, P., Van Katwyk, P., Brannick, M., & Chen, P. (1997). When two factors don’t
reflect two constructs: How item characteristics can produce artifactual factors.
Journal of Management, 23, 659-677.
184
Spielberger, C., Gorsuch, R., & Lushener, R. (1970). Test manual for the State-Trait
Anxiety Inventory. Palo Alto, CA: Consulting Psychologists Press.
Steinberg, L. (2001). The consequences of pairing questions: Context effects in
personality measurement. Journal of Personality and Social Psychology, 81,
332-342.
Stogdill, R. (1963). Manual for the leader behavior description questionnaire—Form XII.
Columbus: Bureau of Business Research, Ohio State University.
Sudman, S., Bradburn, N., & Schwarz, N. (1996). Thinking about answers: The
application of cognitive processes to survey methodology. San Francisco:
Jossey-Bass.
Tomás, J., & Oliver, A. (1999). Rosenberg’s self-esteem scale: Two factors or method
effects. Structural Equation Modeling, 6, 84-98.
Tourangeau, R., & Rasinski, K.A. (1988). Cognitive processes underlying context effects
in attitude measurement. Psychological Bulletin, 103, 299-314.
Trott, D., & Jackson, D. (1967). An experimental analysis of acquiescence. Journal of
Experimental Research in Personality, 2, 278-288.
Van Someren, M., Barnard, Y., & Sandberg, J. (1994). The think aloud method: A
practical guide to modelling cognitive processes. London: Academic Press.
Wang, Y., Davidson, M., Yakushko, O., Bielstein, H., Tan, J., & Bleier, J. (2003). The
scale of ethnocultural empathy: Development, validation, and reliability.
Journal of Counseling Psychology, 50, 221-234.
Wason, P. C. (1959). The processing of positive and negative information.
Quarterly Journal of Experimental Psychology, 11, 92-107.
185
Wason, P. C. (1961). Response to the affirmative and negative binary statements.
British Journal of Psychology, 52, 133-142.
Watson, D. (1992). Correcting for acquiescent response bias in the absence of a
balanced scale. Sociological Methods and Research, 21, 52-88.
Weijters, B., Geuens, M., & Schillewaert, N. (2010). The stability of individual response
Styles. Psychological Methods, 15, 96-100.
Williams, L., Cote, J., & Buckley, M. (1989). Lack of method variance in self-reported
affect and perceptions at work: Reality or artifact? Journal of Applied
Psychology, 74, 462-468.
Woods, C. (2006). Careless responding to reverse-worded items: Implications for
confirmatory factor analysis. Journal of Psychopathology and Behavioral
Assessment, 28, 189-194.
Yang, Y., & Green, S. (2011). Coefficient alpha: A reliability coefficient for the 21st
century? Journal of Psychoeducational Assessment, 29, 377-392.
Yang, Y., Harkness, J., Chin, T.-Y., & Villar, A. (2010). Response styles and culture.
In J. Harkness, M. Braun, B. Edwards, T. Johnson, L. Lyberg, P. Mohler, B.
Pennell, & T. Smith (Eds.), Survey methods in multinational, multiregional, and
multinational contexts (pp. 203-223). Hoboken: Wiley.