effects of marketing strategies on performance of
TRANSCRIPT

EFFECTS OF MARKETING STRATEGIES ON PERFORMANCE OF
PETROLEUM COMPANIES IN KENYA
NJERI WILFRED KAMAU
A RESEARCH PROJECT SUBMITTED IN PARTIAL FULFILMENT OF THE
REQUIREMENTS FOR THE AWARD OF THE DEGREE OF MASTER OF
BUSINESS ADMINISTRATION, SCHOOL OF BUSINESS, UNIVERSITY OF
NAIROBI
2016

i
DECLARATION
This Project is my original work and has not been presented for a degree in any other
University
……………………………………….. …………………………
Signed Date
Njeri Wilfred Kamau
D61/74949/2014
This Project has been submitted for examination with my approval as the Student‟s
University Supervisor.
……………………………………….. …………………………
Signed Date
Francis N Kibera, PhD
Professor of Marketing
Department of Business Administration
School of Business
University of Nairobi

ii
ACKNOWLEDGEMENTS
I hereby wish to acknowledge the following people for their immense support during the
compilation of this research.
To my supervisor, Prof. Francis Kibera, I extend my sincere gratitude for his commitment
and advice. His ideas, recommendations and support were valuable.
Many thanks also goes to managers of petroleum firms for their co-operation in filling in
the questionnaires which formed a major component of this research project.
I am also grateful to my family for their encouragement. Special thanks also go to my
wife Priscah and our children Ted and Ashley for their patience.

iii
TABLE OF CONTENTS
DECLARATION............................................................................................................ i
ACKNOWLEDGEMENTS ......................................................................................... ii
TABLE OF CONTENTS ............................................................................................ iii
LIST OF FIGURES ...................................................................................................... v
LIST OF TABLES ....................................................................................................... vi
ABBREVIATIONS AND ACRONYMS ................................................................... vii
ABSTRACT ................................................................................................................ viii
CHAPTER ONE: INTRODUCTION ......................................................................... 1
1.1 Background of the Study .......................................................................................... 1
1.1.1 Marketing Strategies and Organizational Performance .................................. 2
1.1.2 Firm Performance ........................................................................................... 3
1.1.3 Petroleum Firms in Kenya .............................................................................. 4
1.2 Research Problem ..................................................................................................... 5
1.3 Research Objectives .................................................................................................. 7
1.4 Value of the Study .................................................................................................... 7
CHAPTER TWO: LITERATURE REVIEW ............................................................ 9
2.1 Introduction ............................................................................................................... 9
2.2 Theoretical Foundation ............................................................................................. 9
2.2.1 Neo Institutional Theory of Differentiation .................................................... 9
2.3 Porter‟s Generic Strategies ....................................................................................... 9
2.4 Marketing and Marketing Management.................................................................. 10
2.5 Marketing Strategies ............................................................................................... 12
2.6 Marketing Strategies and Performance of Organizations ....................................... 16
CHAPTER THREE: RESEARCH METHODOLOGY ......................................... 18
3.0 Introduction ............................................................................................................. 18
3.1 Research design ...................................................................................................... 18
3.2 Population of the Study ........................................................................................... 18
3.3 Data Collection ....................................................................................................... 18

iv
3.4 Data Analysis .......................................................................................................... 19
CHAPTER FOUR: DATA ANALYSIS, PRESENTATION AND
INTERPRETATION .................................................................................................. 20
4.1 Introduction ............................................................................................................. 20
4.2 Response Rate ......................................................................................................... 20
4.3 Demographic Profile ............................................................................................... 20
4.3.1 Gender Distribution ...................................................................................... 20
4.3.2 Period of Service in the Company ................................................................ 21
4.3.3 Highest Level of education ........................................................................... 22
4.4 Marketing Strategies ............................................................................................... 22
4.4.1 Differentiation Strategy ................................................................................ 23
4.4.2 Cost Leadership Strategy.............................................................................. 25
4.4.3 Market Focus strategy .................................................................................. 26
4.4.4 Corporate Growth Strategy .......................................................................... 27
4.5 Industry Performance .............................................................................................. 28
4.6 Correlation Analysis ............................................................................................... 29
4.7 Regression Analysis ................................................................................................ 30
CHAPTER FIVE: SUMMARY, CONCLUSIONS AND
RECOMMENDATIONS ............................................................................................ 33
5.1 Introduction ............................................................................................................. 33
5.2 Summary ................................................................................................................. 33
5.3 Conclusions ............................................................................................................. 35
5.4 Recommendations ................................................................................................... 36
5.5 Limitations of the Study.......................................................................................... 37
5.6 Suggestion for Further Study .................................................................................. 37
REFERENCES ............................................................................................................ 38
APPEDICES ................................................................................................................ 42
APPENDIX I: QUESTIONNAIRE ........................................................................... 42
APPENDIX II– Population of Oil Marketing Companies in Kenya ...................... 47

v
LIST OF FIGURES
Figure 4.1: Gender distribution ..................................................................................... 21

vi
LIST OF TABLES
Table 4.1: Period of Service in the Company ........................................................ 21
Table 4.2: Highest Level of education ................................................................... 22
Table 4.3: Responses on the Scope of Discrepancy of Goods and Services ......... 23
affected Organizational Performance .................................................. 23
Table 4.4: Responses on Differentiation Strategy ................................................. 24
Table 4.5: Responses on Cost Leadership Strategy .............................................. 25
Table 4.6: Responses on Marketing Strategy ....................................................... 26
Table 4.7: Responses on Corporate Growth Strategy........................................... 27
Table 4.8: Adoption of Marketing Strategies ....................................................... 28
Table 4.9: Correlation Matrix ............................................................................... 29
Table 4.10: Model Summary ................................................................................. 30
Table 4.11: Coefficients of Variation .................................................................... 31

vii
ABBREVIATIONS AND ACRONYMS
AMA : American Marketing Association
CFA : Collateral Financing Agreement
ERC : Energy Regulatory Commission
GoK : Government of Kenya
HHI : Harfindal Hirschman Index
KPC : Kenya Pipeline Company
OMC : Oil Marketing Companies
OTS : Open Tender System
O&G : Oil and Gas Companies
PIEA : Petroleum Institute of East Africa
ROA : Return on Assets
ROE : Return on Equity
SPSS : Statistical Package for Social Sciences

viii
ABSTRACT
The current study set out to document the strategic responses of oil firms in Kenya to
challenges of increased competition by seeking answers to possible effects of marketing
strategies on performance of petroleum companies in Kenya. Primary data were collected
using questionnaires from a total of 35 firms. The data were analyzed using descriptive
statistics including percentages, mean scores, standard deviations and frequencies.
Thereafter regression analysis was used to determine the influence of the independent
variable on the dependent variable. The study established that i) the petroleum industry has
ensured cost leadership strategy by strategic location of storage, filling and loading
facilities, and high operational efficiency through reduced wastage of time and resources; ii)
the industry has ensured consistent product availability and use of highly efficient
equipment and facilities; ii) the industry uses segmented markets as a method of competitive
advantage; iv) the industry employs various strategies to remain profitable in a largely
competitive market. The study also concluded that cost leadership, corporate growth,
market-focus and differentiation strategies are responsible for gaining market share among
petroleum companies in Kenya. The study recommended that the industry should embrace
cost leadership and differentiation strategies to enhance the profit margin. Finally, the
government through the Energy Regulation Commission should ensure that the players in
the petroleum marketing business compete on a level ground by fully enforcing the Energy
Act and removing the price regulation in the petroleum market to enable petroleum
marketers practice price leadership strategy.

1
CHAPTER ONE: INTRODUCTION
1.1 Background of the Study
Over the decades global business environment has greatly changed at a remarkable
intensity and pace. According to Acquaah and Yasai-Ardekani (2008), volatility,
competitiveness and unpredictability of the environment is greatly observed in operating
environment. Marketing strategies have thus been of essence as weapons of defense to
curb competition, despite manifestation of operative environmental changes influences.
The continuous increase in competition being faced will ensure accrued rewards for
companies‟ embracing competitive advantage to compete with their competitors having a
precise consumer needs understanding ability. Business landscape transformation is
achievable despite the ever changing operating environment through continuous scan of
the environment as well as offering goods and services of high value to customers (Allen
& Helms, 2006). Marketing strategies thus contribute extensively in performance
influence of any organization while adaptation to changes observed in the environment of
business. Once a firm identifies its competences it becomes possible for it to direct its
concentration on areas of higher competitive advantage.
Evolution of marketing beyond traditional economic analysis has led to its application in
resolving problems that extend over the firms‟ boundaries and in societal goals attainment
(Lazer 1969). Marketing mix constitutes actions and solutions that are in operation to
facilitate meeting of customers' needs and achievement of business goals. Marketing
strategies functions in determination of the nature, strength, direction and interaction that
exists amid elements of marketing mix and the factors in the environment in a certain
situation. According to Levie (2006) developing an organization‟s marketing strategy aims
at establishing, building, defending and mentioning its competitive advantage.
To impact on mutually-satisfying transactions of exchange and relationships; marketing
strategies and tactics exist in taking decisions on different variables. That is to say,
marketers use different tools which involve extra-large marketing (Kotler, 1997) and also
product marketing (4Ps) (McCarthy, 2002) that is Product, Price, Place and Promotion.
According to Kotler and Connor (1997), marketing is a challenging practice yet it seems

2
so simple to give description on. In the service industry, the P‟s increase to seven, that is,
physical evidence, process, and people (Bashan, 2011).
Despite other small independent oil companies being incorporated in Kenya, the
petroleum sector largely remains oligopolistic. International companies dominate markets
accounting for 90% of all imported petroleum products and virtually businesses in the
country. Total Kenya, Shell BP, Caltex, Mobil and KenolKobil controlled 85.3% of the
market in early years 2000 (GoK, 2006). In 2008 market concentration ratio was 76.7%
with HHI (Harfindal Hirschman Index) estimating it at 1649.16. Over the years, a number
of companies have exited the Kenyan market (and East African market at large) mostly
through mergers and acquisition. Previously dominating oil companies such as Chevron,
Caltex, Agip, BP, Mobil and others have exited the local market and their assets taken
over by other new or existing companies. However many small independent oil marketing
firms have continued to join the oil and gas sector since the market is now liberalized.
A research study explaining performance diversity is of essence especially in energy
industry. Taking into consideration firms‟ importance of strategies incorporation
(Porter,1980), as well as literature on existing gaps. Porter‟s typology is employed in
carrying out investigations here. In addition it also investigates on the influences of
Porter‟s typology on the performance of a firm, with specific emphasis on exploring and
testing the correlation between Porter‟s generic strategy and performance.
1.1.1 Marketing Strategies and Organizational Performance
Marketing strategies entail the firms‟ embrace of tactics to countering marketing stress,
enhancing attraction of buyers, and improvement of market position in the present
(Thompson & Strickland, 2002). According to Porter (2008) acceptance of marketing
strategies by firms aims at finding a place in the market where they can best safeguard
themselves from industrial marketing forces and help in manipulating such forces to their
advantage. Porter (2008) argues that through the five forces that shape the industry,
analysis and understanding of environmental marketing helps a firm to develop a
competitive advantage in the industry. These forces are entry of new competitors,
bargaining power of buyers, contention among current competitors, substitution threat and

3
bargaining power for suppliers. Marketing forces analysis signals the truth that
competition goes way beyond the already established industry players.
According to Bourgeo (2009) through marketing strategy firms establish enduring
competitive advantage over its competitors. A marketing strategy guides an organization‟s
financial management, marketing and other operations through highlighting important
decisions. David (2010) points out that marketing strategy support an enterprise in
determining its operations as of current and in the future, and at the same time helps the
organization in identifying markets suitable for venturing into.
Firms should give consideration to initiators of change in turbulent business environment
so as to catch up with competition (Karanja, 2012). According to Kenol Kobil (2010)
change drivers include globalization, integration of regional economic, technology,
government, regulatory authorities, customer needs and wants. In order to exploit the
opportunities that exist in growing markets, firms must develop appropriate strategies.
Porter (1980) views an industry that is growing as an industry characterized by absence of
game rule, presence of technology innovations and arising of new needs of customers.
According to Pearce and Robinson, (2003) a firm is at the verge of creating a risk and an
opportunity if it does not strategize its activities on management of appropriate strategies‟
development.
1.1.2 Firm Performance
The concept of performance is a relative concept. However, the measures used to
determine the performance of the firm remains an issue of debate among researchers,
academia and policy makers as well. According to the Longman Advanced Dictionary
(2000) firm performance is the ability of a firm or product to compete and be more
successful than others in the industry. From the literature, it is argued that a firm‟s
performance is its ability to compete in a homogeneous market or industry and succeed or
do better than others.
Different researchers have supported the concept that the success of a firm depends on its
superior performance; and that the performance of the firm can be measured by financial
and nonfinancial indicators. According to Liargovas and Skandalis ( 2014) the firm
performance can be measured using various financial performance indicators like the

4
return on sale, the return on assets and the return on equity because these results can be
easily calculated. Porter (2004) posits that firms may compete on market share and
profitability. Allen and Helms (2006) argued that the key determinants of a firm
performance are the marketing expenditure, relative product quality and the level of
productivity. In support of this financial evaluation, Bauer and Colgan (2011) proposed
the firm performance by evaluating its sales and net profit margin. According to Allen
and Helms (2006), Baue and Colgan (2011) and Bain (2009) the firm can quantify
performance using the financial performance in the form of Return on Assets (ROA) and
Return on Equity (ROE).
Bourge (2009) suggested that in the new environment of business, the performance of the
firm can be measured by the pecuniary, consumer, internal business process and the
perspectives of knowledge and progression. David (2010) concluded that the financial
measure is appropriate to measure the firm performance. Using at least five years period
of ROA is appropriate because it measures the long term strategy to survive and the
structural variables of the firm. While there exist a multidimensional view on the concept
and measure of the firm performance, financial measure are the more convenient measure
that determines the firm performance even though there are nonfinancial measure like
customer satisfaction, service and product quality and the total market shares. Therefore,
this study measures the performance of the petroleum companies by using the return on
assets (ROA), which is the financial measure that evaluates whether the firm management
earned reasonable return with the asset under their control (Emery, 2007).
1.1.3 Petroleum Firms in Kenya
According to the Kenya Energy Regulatory Commission (2015), the major sources of
commercial energy in Kenya are the petroleum fuels. Kenya being a prime petroleum
products importer, it has 800km cross country oil pipeline running from Mombasa to
Nairobi and Western Kenya, terminating in Nairobi, Nakuru, Eldoret and Kisumu, under
the management of Kenya Pipeline Company. Kenya Pipeline Company (KPC) has
recently acquired another terminal at Konza City previously owned by Petrocity Oil
Company. In 2006, the Energy Act No. 12 of 2006 was enacted, delegating the Energy

5
Regulatory Commission (ERC) with the mandate of regulating petroleum and renewable
energy sectors in addition to electricity (KERC, 2015).
Kenya therefore is currently importing refined products only now that the refinery in
Changamwe, Mombasa is not functioning. The Ministry of Energy through the Open
Tender System (OTS) coordinates the importation of refined products. The OTS winner
allocates refined products to other oil companies under coordination of the Ministry of
Energy based on calculated cargo participation as well as each company‟s market share.
Indications on importation of refined fuels have it that major oil companies are the
dominants (Government of Kenya, 2005). Total owns the highest market share at 18.5%,
Vivo own 17.6%, Kenol Kobil own 15.7%, Gulf Energy own 6.4%, National Oil
Corporation own 5.9%, Libya Oil own 5.9%, Hashi own 4.7% while the rest is held by
more than 30 other smaller players (PIEA, 2016).
At the retail level, there are numbers of subsidiaries to foreign based and local based
companies of varied sizes who have outlets through which petroleum products are sold
directly to consumer. The subsidiaries of foreign markets companies are by far the largest
players in the sub-sector despite liberalization of the industry which allowed for the entry
of more players in the market (Petroleum Institute of East Africa (PIEA, 2000).
1.2 Research Problem
Currently the oil industry plays a remarkable stake on the growth and development of
countries‟ economy. Therefore, a dynamic importance for strategic planning for such
institutions gets them to foresee a better future by adapting to the environment beside the
oil industry policies (Kettunen, 2006). Progressively, companies are currently more
dependent providing services compared to delivering of performance at a competitive
level as observed by market demands and stakeholders. Achievement of this requires
careful definition of delivering services, negotiated, and agreed upon with more
consideration on needs, wants and preferences of parties' involved. For profitability of an
organization, strategies must be in place for its positioning in market dominance as well as
improving its overall performance. To confront the competitive pressure in the oil market
environment, marketing has been of essence in improving firms‟ performance in many

6
nations (Bimal, 2012). The oil sector is a major player in the country‟s development of
socio economy. As a matter of fact in Kenya, all other sectors depend on this sector and
any form of destabilization in the sector will affect almost all other sectors in the
economy.
Globally, efforts on several researches have had to deal with macro disputes and
management of company structure and strategies emphasis, conduct and performance of
marketing activities due to their relation with indices of performance such as market share,
growth, efficiency and consumers and clients‟ wellbeing. Allen and Helms (2006) laments
the major defect that exists in static and microanalysis of marketing practices in
developing economies, that is, minimization of marketing environment impacts on
performance measures achievement. According to Bain (2009) despite effortless
undertakings of research to give explanations at the organizational level, on marketing
practices in developing economies, they lack provision of answers to issues that relate to
strategies influences on the performance of mineral prospecting industries particularly the
petroleum marketing companies. Therefore, marketing strategy functions to determine the
nature, strength, direction and interaction existing in elements of marketing mix and the
environmental aspects in a specified situation (Britt & Jex 2008; Cross, 1999).
The field of petroleum industry in Kenya has been widely studied. Mwangi (2012)
researched on Factors that influence relocation of Multinational Oil companies based in
Kenya to other countries and found that major reasons that led to the exit was shrinking
profit margins. Chege (2012) researched on challenges of strategy implementation for
firms in the petroleum industry in Kenya and established that the major challenges were
technology, resource allocation, job responsibilities, prioritization, organization structure,
values and resistance to change. Kieyah (2011) carried out a study on the petroleum
industry in Kenya while Deloitte (2013) researched on the oil and gas potential in East
Africa. The Institute of Economic Affairs (2000) researched on the state of Petroleum
Industry in Kenya since Liberalization. There had been no research yet on the marketing
strategies embraced by petroleum marketing firms in Kenya to remain of essence, in spite
of the high competition experienced in the Oil industry in Kenya that has contributed to
the exit of a number of oil marketing multinationals from the market. This study sought to

7
fill this gap by answering the research question: What are the marketing strategies adopted
by petroleum marketing firms in Kenya to remain competitive?
1.3 Research Objectives
To assess the degree to which marketing strategies affect performance of Kenyan
petroleum companies.
1.4 Value of the Study
The perceptions of the effect of management in marketing strategies on organizational
performance are under investigation here, thus contributing to the existing pool of
knowledge.
To the students, researchers, strategists, marketers and policy makers, this study will equip
them with understanding of the relationship in existence for marketing strategies and the
performance of organizations. To the managers, it will enable them to selectively establish
a workable strategy from the several alternative strategies available and enhance
stakeholders‟ comprehension of the direction being taken by the organization.
High fuel prices reduce the discretionary family income and influences a myriad of
spending decisions. For instance, those with cars, they will either only use them when they
have received their salaries or will use the cars very sparingly. For those who use
kerosene, a family may be forced to use charcoal or firewood to meet domestic needs.
With Collateral Financial Agreement (CFA), the supply of petroleum products can be
guaranteed and hence the prices of the petroleum products will not sky rocket due to high
demand and little supply. To the collateral managers, this study opens a window for them
to carry out more research and take in new clients who look at improving their financial
performance. Collateral Management equips lenders with the setting up of operational
parameters of risk while still lending, controlling and monitoring these parameters
(Ananthakrishnan, 2013).
Through this research, the government is able to appreciate the need of ensuring sufficient
petroleum products are available. In periods of high petroleum products prices, there are
usually reduced economic growth, a deteriorating foreign balance of trade and rising
prices. CFA helps by ensuring that the consignment bought is bought at a reasonably low
8
price as it is done through the OTS. This ensures that there is availability of petroleum
products that are reasonably low priced than would have been if each OMC were to buy
their share independently and for cash.
The study will help petroleum firms to understand how leadership strategy cost and
differentiation strategy affects the sales productivity. It will also help the customers to
understand various marketing strategies and their effects on sales performance of various
commodities in general.

9
CHAPTER TWO: LITERATURE REVIEW
2.1 Introduction
Chapter two gives a summary of the works of other researchers in regard to this study. It
entails theoretical review, empirical review and the research gap in existence.
2.2 Theoretical Foundation
A theoretical framework is the structure for the support of theories which introduce
research study and describe why the research problem exists. It is important to state what
other scholars hold as knowledge and what those theories have in common on your
problem. It therefore provides scientific justification for your investigation. This study is
based on the Neo Institutional Theory of Differentiation
2.2.1 Neo Institutional Theory of Differentiation
This theory gives a description on goods and services differentiation (Oliver, 1996). In
organizational and competitions pressures of higher influence, strategic managers
decisions translate to coping with them, which in turn result in legitimacy, differentiation
and isomorphism, which, according to resource-based view, can enhance the chances of
acquiring competitive advantage as a result of differences in capabilities and resources.
From the propositions of this theory, rivalry reduction and probability increment in
increasing competitiveness is attributable to differentiation. Improvement of performance
is intensified by superior efforts of sharing limited resources as heightened by
differentiation on firms‟ competitiveness.
2.3 Porter’s Generic Strategies
Sustainable competitive advantage” came into existence when Porter in 1985 put forth
competitive strategy types possessed by a firm in achieving long run competitive
advantage that is sustainable. Porter gives detailed approach on success of a business.
Sustainable competitive advantage equates to a superior performance that is sustainable.
According to his propositions, structural conditions of an industry are outlined in his mode
of Five Forces that determine industrial performance averagely. According to Porter

10
(1980), two types of competitive advantage i.e. low costs and differentiation leads to
derivation of a competitive position that is strong and performance of a specified firm in
an industry. However, these two approaches don‟t alternate each other since even on the
basis of differentiation, costs also largely matter. Porter‟s approach gives a wide range of
market on cost leadership and differentiation seeking competitive advantage.
According to Porter (1980,) achievement of remarkable performance in an industry that is
competitive is achievable through pursuing cost leadership, differentiation, or focus
approach to industry competition development. Failure of an organization in pursuing
generic strategies may lead to it being stuck and experience diminished performances in
comparison to firms laying hold of this strategy. Due to their dependence on the industry
or firm, these generic strategies are applicable in business unit levels and hence their
name.
2.4 Marketing and Marketing Management
Quoting American Marketing Association (AMA) (1985) Kerin, Hartley and Rudelins
(2004) gave a definition of marketing as that process that entails planning and execution
of pricing conception, promotion, and ideas distribution, goods and services in creating
satisfactory exchanges to objectives of individuals and organizations. London Chartered
Institute of Marketing, (2005) defined marketing as the process of management that is in
charge for identification, anticipation and satisfaction of consumers‟ requirements
profitably. Stanton (1983) gave a definition of marketing to be totally the interaction of
business activities aimed at planning, pricing, promoting and distributing wants in
satisfaction of present and potential customers via products and services profitably. In
view of the above definitions, marketing particularly encompasses need identification and
need satisfaction, remembering the components of the marketing mix, which includes both
tangible and intangible products. Beverland and Lockshin (2004) claimed that critically,
marketing is a spanning periphery doings for institutions, that brings firms to be in direct
and constant attachment with customers, similarly corresponding to views of the likes of
Moris, et al, 2002; Day 1999, & Morris et al, 1990 and in source identification, and
customer value delivery (Flint et al, 2002).
11
Appiah-Adu and Singh (2004) proposes that for modern day businesses, a competitive
environment appear to demand that firms‟ progression in its identifiable segments
marketing implementation should be successful. The initiator of strategic planning and
business operations is taken to be marketing hence; it is depicted to be core in
organizational efforts. Subsequently, over the years, academic researchers and business
practitioners have given great attention to the concept of marketing effectiveness
(Norburn, et al, 1990; Lai, et al, 1992; Ghosh et al, 1994; Dunn et al, 1994). Kotler,
(1977); Dunn et al, (1994); Webster, (1995) business executives have been encouraged by
this steady stream of management literature to initiate marketing effectiveness
improvement as a result of characteristic link with administrative variables such as
enhanced gratification of customers, maximization of profits, competitive advantage and
coordination of organizations. As stated clearly by Miller and Leptos, (1987) for firms to
enhance efficiency, productivity and effectiveness, marketing had better be treated as a
profession. Moreover, the argument of others is that fundamental function for operative
marketing proficiencies is the core initiator of achievement of excellence (Hooley et al,
1994).
Kotler (1997) defined marketing in term of four distinct elements, as also expressed by
Kohli and Jaworski (1990) and Webster(1992) as follows, philosophy of organizational
market placement, subdivision supervision, targeting and positioning strategies,
operationalized through the marketing mix, and reinforced all over by market astuteness.
However, according to Onah (2000.) the word “marketing” is becoming an enigma. He
asserted that marketing is a process that within societal constraints, attempts to establish
mutually satisfying relationship, between people or organizations with diverse
requirements. The practitioners are people or organizations that seek to satisfy these
requirements (Inanga, 1985). Lastly, on the concept of marketing, Anyanwu (1995)
claimed that the concept of marketing is used to talk about the marketing principles
application in solving problems that organizations and institutions face, hence marketing
pervasively goes beyond societal activities of vending tooth paste, soap and steel (Kotler,
2009).

12
Ferrell and Pride (2002), on the order hand, defined management of marketing as the
process of planning, organizing, implementing, and controlling marketing activities to
successfully and proficiently facilitate exchanges. Accordingly, they attempted to
differentiate between marketing and marketing management, and observed that marketing
has the programs functions of product planning, designing, pricing, promotion,
distribution and exchange; whereas, management marketing is accountable for analysis,
planning, execution and control of these marketing activities for effective performance,
growth, and sustainability. But Kotler and Keller (2006) put the definition of management
of marketing as the art and science that gets, keeps, and grows customers through
generating, providing and communicating customer value that is superior via choosing
target markets. The duo claimed that marketing management takes place when a party to
potential exchange contemplates other parties‟ ways of realizing desired responses. From
Wikipedia (2008) marketing management is said to be a discipline of business that focuses
practically on the marketing techniques applications; and firm‟s marketing resources and
activities management. It was noted from this viewpoint that the choice of marketing
management is pretty far-reaching, implying that any activity or resources of the firm used
to obtain clients and be able oversee the company‟s interactions with them are within the
preview of marketing management. McKenna (1991) expressed a similar opinion as the
last two authors, of encompassment of management of marketing factors that has
influences on the company‟s ability for value delivery to customers that must be universal,
part of everyone‟s job description from the receptionist‟s desk to the Board of Directors.
Boone and Kurtz (2007) expressed definition of marketing management as the planning
process and conception execution, pricing, promotion, distribution, ideas research, goods,
services, organizations and events that create exchanges, and relationship maintenance
that satisfies exchanges, individuals and organizational goals.
2.5 Marketing Strategies
Dess and Davis (1984), cost leadership strategy refers to collection of achievements that
are integrated andare useful for production of goods and services with distinctive
characteristics offered to customers at minimal price in comparison to those of the
competitors or at reduced costs that are aimed at acheiving higher profits. A cost

13
leadership strategy is aimed at production of products and services that are cheaper than
those of its rivals. It aims at gaining a marketing advantage through offering the lowest
cost in the market (Bauer & Colgan, 2001). For a firm to execute its cost leadership
strategy sucessfully, it has to design, produce, and sells more of its product as compared to
its competitors (Parnell, 2000). Process innovations, product designs, economies of scale,
reduction in production costs and time, learning curve, benefits and re-engineering
activities are what initiates cost advantages and reduction of costs.In order to lower the
costs, firms invest in facilities that are efficient-scale, ensure effective controls of cost of
production and embark in minimizing cost that lead to additional expense in areas such as
advertising (Porter, 1980). The basic thing for a firm pursuing marketingness through cost
reduction is to embark on upholding efficiency in all operations so as to successively
control all cost and exploit new ways that can lead to cost reduction (Dess & Davis, 1984).
Malburg (2000) observed that cost leadership strategy is of essence for use by an
organization so as to achieve low cost advantage. He further insists that firms ought to
outsource from other organizations on the activities that result to cost advantage and
immediately discontinue activities having none.Power (2001) observes that cost leadership
is achievable through ensuring greater productions and dispatch, economies of scale,
products design, updating technology, utilization of resources, input cost reduction and
ensuring easy accessibility of raw materials. Helms et al (1997) made similar
observations in his study that lower pricing results to increased demands translating to
higher market share. However, disadvantages of cost leadership strategy are also eminent.
It leads to reduction in customer loyalty and revenue loss if an enterprise lowers its price
so much (Cross, 1999). Miller (1988) argued that for cost leadership strategy to be
effective,product lines had to stabilize and innovations to major in production processes.
Porter (1980)suggested that placing firm‟s emphasis on budgetary controls and returns
will aid much in ensuring costs and prices are as low as possible.
Where firms offer products or services with exceptional sorts that are valued by customers
constitutes differentiation strategy (Kotler, 2000). This strategy enables for the
incorporation of unique characteristics, qualities and opinions to an enterprises‟ product
hence adding value (Ireland et al. 2001). Differentiation excellence depends on a

14
researching on needs of buyers and expectations so as to be informed on what they
perceive as necessary. The desired characteristic are then incorporated while making the
product so as to enhance buyer desire for that product. Products whose characteristics
have significance difference from those of competitors form the basis of marketing
advantage. Uniqueness of a product adds value to a firm enabling it to command a fair
price. Firms‟ ability to supply differentiated product to the market at a price that is higher
than the expenditure incurred in production, enables it to perform better than its
competitors and earn higher proceeds. Differentiation strategy is highly characterized by
perceived quality (whether real or not), which is achievable via superior product design,
technology, customer service, dealer network among others. Differentiation has an
advantage in that supposed value and brand loyalty safeguards firms against threats from
any of the forces determining marketing state of a market. Barriers to new entrants are
shielded by brand loyalty of firms from substitutes. Production technology acts as a risk to
differentiation strategy. Differentiation advantage „shelf life‟ is getting shorter and
shorter, and this may at the end of it change customer tastes and wipe out the marketing
advantage.
Differentiation grants a customer the reason for choosing a specified brand despite there
being other services or products. Kotler (2000) pointed out that although most goods and
services are differentiable, not every product differences is valuable or worthy to
consumers. An encounter exists in establishing an alteration that customers consider to be
relevant and how to promote these differences (Aaker, 1984). This helps an organization
in avoiding risks of over, under, disorderly and suspicious positioning. Sheikh (2007)
asserts that a variety of methods of differentiating the goods and services are so prominent
currently. Included in these ways is unusual provision features, product innovations that
are of speed and technological update, customer service that is responsive, tastes and
perceived prestige and status (Porter, 1980). Differentiation strategy used by firms should
be able to incorporate development and investment in activities that are distinctive and
that customers would prefer.
Market Focus strategy entails targeting particular market segment whereby it enables an
enterprise to provide service to the segment effectively and efficiently compared to its

15
rivals. Focusing involves choosing market niche which contains customers with distinctive
preferences. A niche can be based on specialized requirements, geographical uniqueness
or appealing special attributes to certain members. A focus strategy with regard to low
cost is based on existence of a customer segment with needs which have a less cost to
satisfy compared to the entire market while focus strategy anchored on differentiation is
depended on the existence of a buyer segment with demand for product with special
attributes. Advantages of focus strategy involve customer control in cases of the firm
being the sole supplier. Enhancement of customer loyalty cushions the firm to counter
new entrants in form of opponents and alternatives. Thus, adoption of this strategy ensures
that firms closely monitor and meet the needs of the customers.
Through market Focus, enterprises target at enhancing their market share by venturing in a
suitable market and markets which are unattractive to the competitors and which are
overlooked. The market niches may be as a result of factors such as geography, product
requirement and specifications and customer characteristics. Porter (1980) pointed out that
excellence of a focus strategy is a function of the size of an industry segment and its
potential to grow but Focus-based strategies are used jointly with either differentiation or
cost leadership strategy. David, (2010) argues that focus strategies turn out to be more
successful where buyers have distinct tastes and preferences and where the markets gap
has not been ventured into by competitors.
Ansoff matrix describes Corporate Growth Strategies as the basis for existing and
impending goods of a firm and accessible markets thereof. The matrix highlighted four
types of growth strategies which a firm can adopt. These include Market Penetration
strategy which involves focusing on selling existing products or services into existing
market to gain a higher market share; Market Development strategy which grows a firm
via pointing the goods on proposal to innovative market sectors; Diversification strategy
which grows a firm by diversification in new businesses through new product
development and intended features of the fresh fairs and Invention Growth approach
develops fresh and rationalized goods for trade sectors being served presently (Porter,
1996).

16
Most firms capabilities and resources are highly leveraged by market penetration strategy,
whereas market share growth maintenance increases the market spectrum. Existence of
opportunities for increased market share is observed in cases where competitors have
exhausted the capacity limits. Due to limited market penetration when a market
approaches saturation, a firm must pursue other strategies in order to ensure continued
growth.
2.6 Marketing Strategies and Performance of Organizations
A study by Kombo (1997) on the motor industry projected that in order for firms to
penetrate the marketing environment they had to embrace significant changes in their
strategic variables. Introduction of fresh skills in manufactured goods development,
differentiation of their merchandises, segmentation and targeting their consumers with
plenty and better-quality customer service was embraced by firms. Marketing strategy
directly related to the performance of a firm as observed via increased profitability (Bain,
1956). A study by Hahn and Powers (2010) had it that formulating and successfully
implementing prominent strategies leads to apprehension of grander performance by a
firm in comparison to firms that lack to embrace such.
Parnell (2011) noticed remarkable researches on generic strategies impacts on firm‟s
performance. Conclusions by Spanos and Lioukas (2001) point out affirmative existence
of evidence for the rapport amongst generic approaches and market performance, which
was immaterial. Argyres and McGaha (2002) concur that disparity and lesser charges were
openly linked with cost-effectiveness. However, this research was not conducted in the
energy industry Kenya context hence the study cannot be generalised to the petroleum
companies in Kenya. Hahn and Powers (2010) recognized that high quality strategy design
and efficacious application results to realization of superior performance in comparison to
firms not doing so.
According to Porter (1980) competitive strategies have had considerable support and
recognition in the field of strategic management. Porter argued that better marketing
position in a particular industry can be improved or diminished by organizations search for
17
marketing strategy; depending on the enterprise strategy chosen which happens to be the
foundation of competitiveness.
In conclusion, generic strategies of cost leadership or differentiation have emanated to a
superior performance, while others found combination strategies to be optimal on low-cost
and differentiation. Argyres and McGaha (2002) conclude that there was a direct relation
between differentiation and reduced cost in comparison with profitability. Cost leadership
strategy was quite significant in offering perfomance advantage (Helms, 2006, and Power
and Hahn, 2004). Hahn and Powers (2010) states that design and positive execution of
strategies with higher value realizes greater efficiency by firm in comparison to a firm that
fail to do so.

18
CHAPTER THREE: RESEARCH METHODOLOGY
3.0 Introduction
This chapter discusses the research methodology that was applied in the study. The
subsections are research design, population of the study, data collection and analysis.
3.1 Research design
Descriptive survey approach was employed to collect data from respondents. Kothari
(2006), claims that different kinds of questions are considered in descriptive research in
order to reach survey and fact establishment. Appropriateness of this study is observed in
that variables don‟t include manipulation but rather establishment of current phenomenal
status (Borg & Gail, 1983). This design equips the researcher in examining of marketing
strategies effects on organizations performance of petroleum companies in Kenya.
3.2 Population of the Study
The targeted population was all the petroleum companies in Kenya. Cooper and Schindler
(2006) described population as the sum of essentials collected about which one wish to
make some inference. According to PIEA April-June 2016 publication, there are 35
OMCs plus the other group classified as others (Appendix II). All the 35 OMCs have their
head offices in Nairobi. It was therefore a census survey.
3.3 Data Collection
The researcher personally collected the data from the target respondents where possible.
Drop and pick method was also used. The questionnaires were personally administered to
the respondents by the researcher. This method made the data collection simpler and the
researcher was able to facilitate accuracy in the data collection as the method entailed a
personal appeal. Upon presentation of the questionnaires the respondents were expected to
fill in their responses in the provided spaces. The questionnaires collected information
based on the objectives of the study.

19
3.4 Data Analysis
The pertinent data were first cleaned, coded and organized in a manner that facilitated
analysis using the Statistical Package for Social Sciences (SPSS). Quantitative data
collected was analyzed by use of descriptive statistics to generate percentages, mean
scores, standard deviations and frequencies. Tables and other graphical presentations were
used to present the data. Regression analysis was used to establish the link that exists
between the independent and dependent variables.
The regression model used was:
y = B0+ B1X1 +B2X2 + B3X3 + B4X4+á
Where:
y = Firm performance
B0 = Constant Term
B1B2, B3, = Beta coefficients
X1= cost leadership strategy
X2= Differentiation strategy
X3= Market Focus strategy
X4= Corporate Growth Strategies
á=Error in the model:

20
CHAPTER FOUR: DATA ANALYSIS, PRESENTATION AND
INTERPRETATION
4.1 Introduction
This Chapter discusses the findings and discussions in line with the objective of the study
which was to assess the degree to which marketing strategies affect performance of
Kenyan petroleum companies.
4.2 Response Rate
All the 35 questionnaires administered were filled and returned. This represented 100%
response rate. A 50% response rate is satisfactory for analyzing and reporting; 60%
response rate is good and an excellent rate is that which is 70% and beyond (Mugenda &
Mugenda 1999). Therefore the response rate was considered excellent for the study.
4.3 Demographic Profile
This research established the demographic information in order to determine whether it
had the effects on marketing strategies and the performance of petroleum companies in
Kenya. The demographic information of the respondents included gender, the period of
service and education levels.
4.3.1 Gender Distribution
It was paramount for this study to determine the gender of respondents in order to
acknowledge any evidence of gender parity in indicated positions. The information is
presented in Figure 1.

21
Figure 4.1: Gender Distribution
Source: Primary Data
The results in Figure 4.1 revealed that were more male respondents (62.9%) in the study
as compared to female respondents (37.1%).
4.3.2 Period of Service in the Company
The researcher sought to determine if the respondents had stayed in the industry long
enough to provide valuable responses that pertain to marketing strategies and the
performance of petroleum companies in Kenya. The relevant results are summarized in
Table 4.1.
Table 4.1: Period of Service in the Company
Years of Service in Company Frequency (n) %
0-4 years 3 8.6
5-9 years 5 14.3
10-14years 12 34.3
Over 15years 15 42.8
Total 35 100
Source: Primary Data
62.9%
37.1%
Male
Female

22
The results in Table 4.1 show that 42.9% of the respondents had served in their
companies for above 15 years, 34.3% had provided services between 10 and 14 years,
14.3% had worked for 5 to 9 years while only 8.6% for a span of 0 to 4 years. It was
concluded that a great percentage of the respondents had worked for considerable time in
their companies.
4.3.3 Highest Level of education
The respondents had been asked to indicate how their highest level of education. The
pertinent results are depicted in Table 4.2.
Table 4.2: Highest Level of education
Level of Education Frequency (n) %
Postgraduate 13 37.1
Degree 15 42.9
Certificate/Diploma 7 20.0
Total 35 100
Source: Primary Data
As depicted in Table 4.2, 42.9% had attained university degree, 37.1% had postgraduate
education while 8.33% had certificate/college diplomas. These results strengthened the
response rate of 100% due to the fact that majority of the respondents were well educated
as they were in a position to respond to the questions of research on marketing strategies
and the effectiveness of petroleum companies in Kenya.
4.4 Marketing Strategies
The study sought to investigate different marketing strategies and their effect on the
performance. In subsections 4.4.1, 4.4.2, 4.4.3, and 4.4.4, respondents had been asked to
indicate their responses using a scale of 1 to 5 (5=very great extent, 4=great extent, 3=
moderate extent, 2=less extent and 1=No extent). The relevant responses are summarized
in each sub-section.

23
4.4.1 Differentiation Strategy
The respondents were then asked to indicate the extent to which “the scope of discrepancy
of goods and services affected organizational performance”. The pertinent results are
summarized in Table 4.3.
Table 4.3: How Discrepancy of Goods and Services affected Organizational
Performance:
To What Extent Frequency (n) %
Very Great Extent 21 60.0
Great Extent 6 17.1
Moderate Extent 5 14.3
Little Extent 3 8.6
Total 35 100
Source: Primary Data
The results in Table 4.3 revealed that majority of the respondents agreed that
differentiation of goods and services impacted on organizational performance to a very
great extent (60.0%) while 8.6% agreed to a little extent that differentiation of products
and services affected organizational performance. These findings portray that
differentiation of products and services affected organizational performance in various
ways.
The differentiation strategy results were further expanded and respondents thereafter asked
to indicate their responses. The relevant responses are given in Table 4.4.

24
Table 4.4: Responses on Differentiation Strategy
Source: Primary Data
The results in Table 4.4 indicate to a great extent that “The industry offers a broad
service/product range to cater for varied needs” with 69% and a mean score of 4.20. On
the other hand, only 3% agreed at no extent in terms of “differentiation excellence in this
industry depends on buyers‟ needs and expectations”. The overall mean score for
Differentiation Strategy was 4.21. The study findings were in agreement with Leitner and
Goldenberg (2010) who concluded that to enhance performance, superiority must exist in
differentiation strategy.
Differentiation Strategy
Statement
No
Extent
(1)
Less
Extent
(2)
Moderate
Extent (3)
Great
Extent
(4)
Very
Great
Extent (5)
Mean
Score
% % % % %
Uniqueness of a product adds
value to an industry enabling it to
command a fair price
- 4 10 59 27 4.18
The industry maintain a strong
brand /image identification - - 11 52 37 4.33
The industry use network as a
Differentiation strategy - 3 9 49 39 4.22
The industry frequently develop
new products/services - 5 19 43 33 4.21
The ability to supply
differentiated product to the
market at a price that is higher
than the expenditure incurred in
production, enables this to
perform better than its
competitors
- 2 7 56 35 4.24
There is innovation in technology
to differentiate Services/ products; - 3 12 56 29 4.18
The industry offers a broad
service/ product range to cater for
varied needs
- - 6 69 26 4.20
There are strict service/product
quality control procedures
through TQM
1 2 6 55 36 4.22
Differentiation excellence in this
industry depends on buyers‟
needs and expectations
3 1 12 61 20 4.12
Grand Mean Score 4.21

25
4.4.2 Cost Leadership Strategy
Further, the study sought to find out the extent to which their organizations used each of
the following ways to respond to market changes. The relevant responses are summarized
in Table 4.5.
Table 4.5: Responses on Cost Leadership Strategy
Statements on Cost Leadership
Strategy
No
Extent
Less
Extent
Moderate
Extent
Great
Extent
Very
Great
Extent
Mean
Score
% % % % %
The industry underprices its products
and services to outdo competitors 3 1 12 62 21 4.09
The industry has an efficient and low
cost distribution channels - - 6 69 26 4.16
The industry acquires its capital from
low cost sources - 1 9 57 33 4.21
The industry firms emphasizes on
training, education, and institutional
learning in order to reduce staff
turnover, wastage and defects
7 8 11 55 19 4.19
This industry continuously develops
cost effective and innovative services/
products and refines existing ones
- 4 8 57 31 4.27
The industry achieves economies of
scale through lending to groups and
extensive mass mobilization of
members to build a large customer base
4 6 12 54 24 4.12
The industry outsources noncore
functions and/or enters into joint
ventures to control cost
- - 7 70 23 4.18
The industry achieves new service
features in response to demand 3 3 8 59 27 4.17
Grand Mean Score 4.71
Source: Primary Data
To a very great extent, the highest rated way was “the industry acquires its capital from
low cost sources” with 33%, followed by “this industry continuously develops cost
effective and innovative services/products and refines existing ones” (31%) and “the
industry achieves new service features in response to demand (27%). On contrary, the
respondents felt that at no extent that “the industry Petroleum firm emphasizes on training,
education, and institutional learning in order to reduce staff turnover, wastage and defects”
with 7%. The overall mean score for cost leadership strategy was 4.71. These findings

26
concur with Allen and Helms (2006) who outlined that cost leadership influences
organizational perfomance.
4.4.3 Market Focus strategy
On marketing focus strategy, the respondents had been requested to indicate the extent at
which their organization embraces factors that improve effectiveness. The results are
contained in Table 4.6.
Table 4.6: Responses on Marketing Strategy
Market Focus Strategy
No
Extent
Less
Extent
Moderate
Extent
Great
Extent
Very
Great
Extent
Mean
Score
% % % % %
Increasing number of service points 1 8 17 54 20 4.11
Ensuring easy accessibility for clients - 10 18 55 19 4.08
Conducting Regular market surveys of
customer needs - 3 8 67 21 4.02
Use of latest technology - 4 8 64 24 4.09
Offering services not offered by
competitors - - 7 69 24 4.06
Attractive appearance of premises - 2 3 58 37 4.14
producing affordable products - - 6 69 26 4.10
increasing investment logistics and supply
chain management 1 2 6 55 36 4.11
expanding its distribution network 3 1 12 61 20 4.13
broad range of new products - 5 19 43 33 4.01
Offering their goods and services to areas
which have niche. - 2 7 56 35 4.09
Offering goods and services to the market
based on geographical aspects, purchasing
power of customers, and demand
variation.
- 3 12 56 29 4.08
Better services to the identified market
niche - 5 19 43 33 4.05
Grand Mean Score 4.08
Source: Primary Data
As discernible in Table 4.6, the respondents rated to a great extent “Offering services not
offered by competitors” and “producing affordable products” all with 69%. The results

27
further reveal that all the mean scores were over 4.00 on a scale of 1 to 5. This meant that
the organizations embraced factors that improve effectiveness.
4.4.4 Corporate Growth Strategy
The respondents were finally asked to point out the extent of agreement with the following
statement in relation to how they affect performance in their business. The pertinent
results are summarized in Table 4.7.
Table 4.7: Responses on Corporate Growth Strategy
Corporate Growth Strategy Factors
Strongly
Disagree
Disagree Neutral Agree Strongly
agree Mean
Score % % % % %
Market Penetration has enabled
industry to achieve growth and enhance
its market share
- - - 25 75 4.43
Market Development enabled the
industry to grow through directing the
products that they currently offer to
new market segments
- 19 16 30 35 4.15
Diversification has enabled the
industry to grow as a result of
diversifying into new businesses
through development of new products
and services for new markets
- - 6 69 26 4.31
Product Development has enabled a
firms to develop new and modernized
products for the market segments it
currently serves
1 2 6 55 36 4.21
Grand Mean Score 4.28
Source: Primary Data
The results in Table 4.7 show that the respondents strongly agreed that “Market Penetration
has enabled industry to achieve growth and enhance its market share” with 75% while as the
same time strongly disagreeing “Product Development has enabled a firms to develop new and
modernized products for the market segments it currently serves” with 1%. The overall mean
was 4.28. This means that exploitation of new markets for products already in existence is
bound to enhance firms performance in case the major competencies in operation relates
to specified products rather than to the specific segments of the market (Mintzberg1973).
28
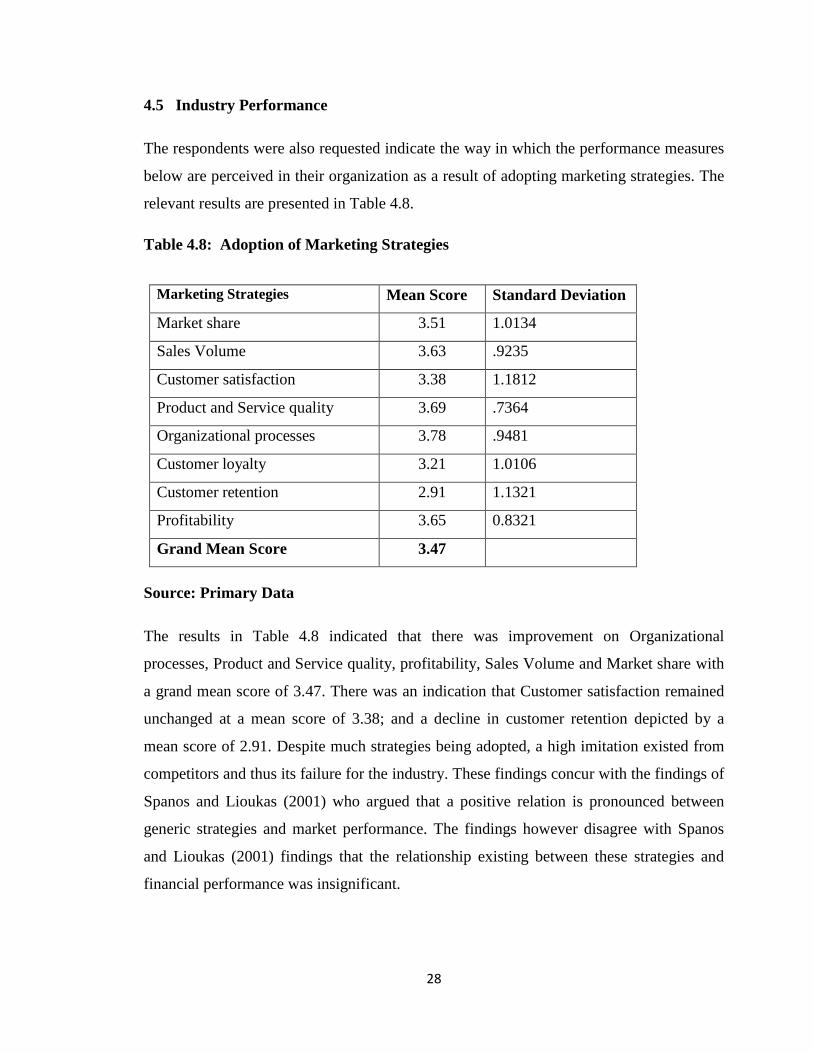
4.5 Industry Performance
The respondents were also requested indicate the way in which the performance measures
below are perceived in their organization as a result of adopting marketing strategies. The
relevant results are presented in Table 4.8.
Table 4.8: Adoption of Marketing Strategies
Marketing Strategies Mean Score Standard Deviation
Market share 3.51 1.0134
Sales Volume 3.63 .9235
Customer satisfaction 3.38 1.1812
Product and Service quality 3.69 .7364
Organizational processes 3.78 .9481
Customer loyalty 3.21 1.0106
Customer retention 2.91 1.1321
Profitability 3.65 0.8321
Grand Mean Score 3.47
Source: Primary Data
The results in Table 4.8 indicated that there was improvement on Organizational
processes, Product and Service quality, profitability, Sales Volume and Market share with
a grand mean score of 3.47. There was an indication that Customer satisfaction remained
unchanged at a mean score of 3.38; and a decline in customer retention depicted by a
mean score of 2.91. Despite much strategies being adopted, a high imitation existed from
competitors and thus its failure for the industry. These findings concur with the findings of
Spanos and Lioukas (2001) who argued that a positive relation is pronounced between
generic strategies and market performance. The findings however disagree with Spanos
and Lioukas (2001) findings that the relationship existing between these strategies and
financial performance was insignificant.

29
4.6 Correlation Analysis
Karl Pearson‟s product moment correlation analysis was of essence in determining the
link that exists amid variables considered in this study. The findings summarized in Table
4.9.
Table 4.9: Correlation Matrix
Organizationa
l Performance
Cost
Leadership
Strategy
Corporate
Growth
Strategy
Market
Focus
Strategy
Differentiation
Strategy
Organizational
Performance
Pearson
Correlation
1
Sig. (2-
tailed)
Cost
Leadership
Strategy
Pearson
Correlation
.476**
1
Sig. (2-
tailed)
.000
Corporate
Growth
Strategy
Pearson
Correlation
.248* -.343
** 1
Sig. (2-
tailed)
.023 .002
Market Focus
Strategy
Pearson
Correlation
.281**
.101 -.180 1
Sig. (2-
tailed)
.010 .377 .116
Differentiation
Strategy
Pearson
Correlation
.304**
-.208 .368**
-.243* 1
Sig. (2-
tailed)
.005 .067 .001 .032
**. Correlation is significant at the 0.01 level (2-tailed).
*. Correlation is significant at the 0.05 level (2-tailed).
Source: Primary Data
Pearson‟s correlations analysis was at 95% confidence interval and 5% confidence. The
matrix of correlation between the marketing strategies and organizational performance is
summarized in Table 4.9. The results has presented a positive relationship existing
amongst performance of organizations and the strategies of marketing as pointed out by
Pearson‟s correlation of 0.476, 0.248, 0.281and 0.304 respectively.

30
4.7 Regression Analysis
Predictor variables influence was tested using multiple regression analysis. The results are
presented in Table 4.10.
Table 4.10: Model Summary
Model R R Square Adjusted R Square Std. Error of the Estimate
1 .819a .671 .653 .37290
Fitness of the model was determined using coefficient of determination. The coefficient of
multiple determinations (R2) is the variance in the dependent explained uniquely or jointly
by the independent variables expressed as a percentage. The models‟ average adjusted
coefficient of determination (R2) was 0.653 and it had an implication that 65.3% of the
variations in the performance of the organization are explainable using the predictor
variables studied.
Coefficient table was also of essence in determining the study model. The findings are
tabulated as follows.
Coefficients of variation
A polynomial, a series or any expression constituting a multiplicative factor referred to as
coefficient; normally it‟s a number, involving no variables in the expression. The findings
are presented in Table 4.11.

31
Table 4.11: Coefficients of Variation
Model Unstandardized
Coefficients
Standardized
Coefficients
t Sig.
B Std.
Error
Beta
1
(Constant) .676 .327 .538 .592
Differentiation Strategy .517 .096 .397 5.375 .000
Cost Leadership Strategy .397 .043 .670 9.336 .000
Market Focus Strategy .269 .048 .394 5.660 .000
Corporate Growth Strategy .230 .042 .413 5.448 .000
Source: Primary Data.
From the SPSS generated output presented in table above, the equation (Y = β0 + β1X1 +
β2X2 + β3X3 + β4X4+ ε) becomes:
Y= 0.676+ 0.517X1+ 0.397X2 + 0.269X3+ 0.230X4
The regression model gives that, change in differentiation strategy by a unit while other
influences remain constant results to a corresponding change in the performance of the
organization by 0.517. In addition a small cost leadership strategy deviation results to a
corresponding change in organizational performance by a value of 0.397. Market focus
strategy changes are accompanied by corresponding changes in structural performance by
0.269 while a noticeable group development approach changes result to changes in
organizational performance by 0.230. The implication here is that differentiation strategy
highly influenced organizational performance with cost leadership strategy being the
second influencer, market focus strategy being third and corporate growth strategy as the
last influencing factor.
The findings conform to Bain (1956) that marketing strategy and industry performance
have a direct relationship as observed via increased profitability. The findings concur with

32
Argyres and McGaha (2002) in their conclusions that diversity and lower cost had a direct
connection with profitability. The findings further agree with Power and Hahn (2004)
significant perfomance advantage resulting from cost leadership strategy.
A significance level of 5% was used to undertake this study. Comparison between
probability value and α=0.05 was the criteria employed to establish the significance of
independent variables. Profitability value less than α indicated the significance of
independent variable otherwise no significance. Thus predictor variables in this case were
significant as depicted by possibility values of less than α=0.05.

33
CHAPTER FIVE: SUMMARY, CONCLUSIONS AND RECOMMENDATIONS
5.1 Introduction
The study assessed the degree to which marketing strategies affect performance of Kenyan
petroleum companies. To satisfy the above objective, quantitative data was collected by
use of questionnaires from all the petroleum companies in Kenya.
After data collection, the data was cleaned, coded and organized in a manner that
facilitated analysis using the Statistical Package for Social Sciences (SPSS). The analyzed
data generated percentages, mean scores, standard deviations and frequencies. Tables and
other graphical presentations were used to present the data. Regression analysis was used
to establish the link that exists between the independent and dependent variables.
5.2 Summary
The study targeted a sample size of 35 respondents. The response rate was 100%. The
results showed that majority of the respondents were males (62.9%) and that 42.9% had
attained university degree.
On differentiation strategy, the respondents indicated to a great extent that “the industry
offers a broad service/product range to cater for varied needs” with 69% and a mean score
of 4.20. On the other hand, only 3% agreed at no extent in terms of “differentiation
excellence in this industry depends on buyers‟ needs and expectations”. The overall mean
score for Differentiation Strategy was 4.21.
On cost leadership strategy, to a very great extent, the highest rated way was “the industry
acquires its capital from low cost sources” with 33%, followed by “this industry
continuously develops cost effective and innovative services/products and refines existing
ones” (31%) and “the industry achieves new service features in response to demand
(27%). On contrary, the respondents felt that at no extent that “the industry Petroleum firm
emphasizes on training, education, and institutional learning in order to reduce staff
turnover, wastage and defects” with 7%.

34
The findings on marketing focus strategy showed that to a great extent “Offering services
not offered by competitors” and “producing affordable products” all with 69% were rated
the highest. The results further revealed that all the mean scores were over 4.00 on a scale
of 1 to 5. This meant that the organizations embraced factors that improve effectiveness.
The pertinent results on Market Penetration showed that the respondents strongly agreed
that “Market Penetration has enabled industry to achieve growth and enhance its market
share” with 75% while as the same time strongly disagreeing “product development has
enabled a firms to develop new and modernized products for the market segments it
currently serves” with 1%. The overall mean was 4.28. This meant that exploitation of
new markets for products already in existence is bound to enhance firms performance in
case the major competencies in operation relates to specified products rather than to the
specific segments of the market (Mintzberg1973).
According to the information generated, it indicated that there was improvement on
Organizational processes, Product and Service quality, profitability, Sales Volume and
Market share with a grand mean score of 3.71. There was further indication that Customer
satisfaction remained unchanged with a mean score of 3.38; and a decline in customer
retention depicted by a mean score of 2.91.
Results of the regression analyses revealed that a positive link between institutional
performance and the marketing strategies (cost leadership, corporate growth, market focus
and differentiation strategies). The fitness of the model was determined using coefficient
of determination. The coefficient of multiple determinations (R2) is the proportion of the
variance in the dependent explained uniquely or jointly by the predictor variables. The
average adjusted coefficient of determination (R2) for the model is 0.653 and giving an
implication that 65.3% of the variations in organizational performance are explainable by
the predictor variables studied.
The regression model gave a minute change in differentiation strategy that resulted to
change in organizational performance by a factor of 0.517. The outcomes agree with Bain

35
(1956) that marketing strategy relates directly to performance of the industry as seen
through profitability increase. Similarly, Argyres and McGaha (2002) stated that there is a
direct link existing mid differentiation and lower cost were and profitability.
At 5% significance level the results of the study were established. Comparison on the
probability value and α=0.05 was the criteria employed in comparing the significance
between the predictor variables. A probability value of less than α implied that the
predictor variable was significant. In this study, each of the predictor variables was
significant as their probability values were below α=0.05.
5.3 Conclusions
The petroleum industry ensured cost leadership strategy by strategic location of storage,
filling and loading facilities, and high operational efficiency through reduced wastage of
time and resources.
Under corporate growth strategy, the industry ensured consistent product availability and
use of highly efficient equipment and facilities. There was also the use of high customer
attendance standards, brand image management and use of additional payment methods.
Under focus strategy, the petroleum industry used segmented markets as a method of
competitive advantage. The researcher also concludes that the cost leadership,
differentiation, focus and market expansion strategies were effective in enhancing the
performance of the petroleum sector.
The study found that the industry employed various strategies to remain profitable in a
largely competitive market. Conclusions are that the approaches adopted by the petroleum
firms included the cost leadership strategy, differentiation strategy, corporate growth
strategy and focus strategy. The researcher also concluded that differentiation strategy and
cost leadership strategies were the most widely used competitive strategies.
The study also concluded that the following strategies are responsible for gaining market
share among petroleum companies in Kenya: cost leadership, corporate growth, market-
focus and differentiation strategies. In addition, it can be concluded that, product, price,
place, promotion, process, people and physical ambience strategies also lead to improved
36
performance. However, it should be noted that there are other factors that contribute
positively in increasing the performance of the petroleum companies in Kenya. This is
because the four independent variables have contributed only sixty eight percent towards
this trend. Finally, petroleum companies in Kenya have adopted the marketing strategies
to help them improve their performance. In order to improve sales and market share, the
industry should consider selling of their products in a right manner and also sell relevant
products to the public. They should also team up with the other oil companies in order to
carry out promotions throughout the country in a bid to promote public awareness.
5.4 Recommendations
Despite that various elements (product, price, promotion, physical ambience and
distribution) exerting positive significance on gaining market share among petroleum
companies in Kenya, marketing managers ought to figure out that the strongest impact has
emerged from people and process which strongly effected on gaining market share among
petroleum companies in Kenya. Reasonably, the 4Ps result on the successful consequence
of a service delivery process and the interactions operating amid the service provider and
the customer, represents that business operations are fundamentally successful. The
resulting effect of this is improved performance of the company and customer
fulfillment/loyalty levels due to successful relations in marketing initiatives. This will
result in customer retention and eventually customer acquisition from the competitors.
This leads to a gain in market share.
Since petroleum marketers cannot control the prices of petroleum products, the industry
should aim at embracing cost leadership strategies and differentiation strategies to
ascertain increases in profit margin. The government through the Energy Regulation
Commission should ensure that the players in the petroleum marketing business compete
on a level ground by enforcing the energy act fully and getting rid of unscrupulous
marketers. The government should also remove the price regulation in the petroleum
market to enable petroleum marketers practice price leadership strategy.

37
5.5 Limitations of the Study
Despite the provision of notable insight in this research, a number of limitations can be
highlighted:
The study mainly focused on competition whereas there could be other environmental
factors that could greatly affect the operations of a firm.
The unwillingness of marketing managers to confide information claiming to have
engagements and consequently, delegating this to marketing department staff. This is
evident in that most private firms do not want to disclose much information to outsiders.
5.6 Suggestion for Further Study
Modification by doing a case study of the market leader in the industry can be carried out
to actually determine the marketing strategies that they use that enable them remain at the
top of the game. Researching further ought to be carried out to determine the other
performance increasing aspects of petroleum companies in Kenya other than marketing
strategies. Research can also be carried on other industries other than the petroleum
companies.

38
REFERENCES
Aaker, D. A. (1984).Developing business strategies, John Wiley & Sons, New York.
Acquaah, M. & Yasai-Ardekani, M. (2008). Does the implementation of a combination
marketing strategy yield incremental performance benefits? A new perspective
from a transition economy in Sub-Saharan Africa. Journal of Business Research,
61(4), 346-354.
Allen, R.S. & Helms, M.M. (2006). Linking strategic practices and industry performance
to Porter‟s generic strategies. Business Process Management, 12(4), 433-54.
Ansoff, H. & McDonnell, E. (1990).Implanting Strategic Management, Prentice Hall,
London.
Bain, J. (2009). Barriers to New Competition. Cambridge, Mass.: Harvard University
Press.
Bauer, C.& Colgan, J. (2011). Planning for electronic commerce strategy: an explanatory
study from the financial services sector.Logistics Information Management, 14
(1/2), 24-32.
Borg, W. R. & Gall, M. D. (1983). Educational research: An introduction (4th ed.). New
York: Longman
Bourgeo, L. J. (2009). Strategy and the Environment: A Conceptual Integration, Academy
of Management Review, 5, 25–39.
Britt, T. & Jex, S. (2008).Organizational Psychology: A Scientist-Practitioner Approach,
2nd
Ed. John Wiley and Sons, Inc. Hoboken, NJ.
Cross, L. (1999). Strategy drives marketing success”, Graphic Arts Monthly, 71 (2),96.
David, F.R. (2010).Strategic Management: Concepts; Prentice Hall Inc. Upper Saddle
River, New Jersey.
Dess, G.G. & Davis, P.S. (1984).Generic strategies as determinants of strategic group
membership and industry performance. Academy of Management Journal, 27,
467-88.
39
Emery, M. (2007).Open systems is alive and well. Presented to USA Academy of
Management Conference, Boston
Emery, M. (2000).The evolution of open systems to the 2 stage model. In Beyerlein, M.
(Ed.), Work Teams: Past, Present and Future, Kluwer Academic, New York.
Hahn, W. & Powers, T.L. (2010). Strategic plan quality, implementation capability, and
industry performance. Academy of Strategic Management Journal, 9(1), 63-81.
Helms, M. M. Clay, D. & Peter, W. (1997). Marketing strategies and business
performance: evidence from the adhesives and sealants industry, Management
Decision, 35(9), 689-703.
Hyatt, L. (2001). A simple guide to strategy, Nursing Homes, 50 (1),12-3.
Ireland, R.D. Hitt, M. Camp, M. & Sexton, D. L. (2001).Integrating entrepreneurship and
strategic management actions to create industry wealth, Academy of Management
Executive, 15 (4), 48-59.
Karanja, P.W. (2012).Marketing Strategies of real estates, The Perspective of Porters
genericmodel, University of Nairobi Unpublished MBA Project.
Kombo, H.K. (1997). Strategic Responses by industry Facing Changed Environmental
Conditions; A case study of Motor Vehicle Holders in Kenya. An Unpublished
MBA Project University of Nairobi.
Kothari, C.R. (2006). Research Methods: Methods and techniques. 3rdEdition. New age
international publishers.
Kotler, P. (2000).Marketing Management. The Millennium Edition, Upper Saddle River,
Prentice Hall.
Leitner, K.H. & Guldenberg, S. (2010). Generic strategies and industry performance in
SMEs: A longitudinal study of Austrian SMEs. Small Business Economics, 35(3),
169-189.
Malburg, C. (2000). Competing on costs. industry Week, 249 (17), 31.
Miller, D. (1988). Relating Porter‟s business strategies to environment and structure:
analysis and perfomance implications.Academy of management journal, 31, 56-60.

40
Miller, D. & Friesen, P.H. (1986). Porter‟s generic strategies and performance: An
empirical examination with American data, Part I: Performance implications.
Organizational Studies, 7(3), 255-261.
Kamau, D. (2007). Relating Porter‟s business strategies to environment and structure:
analysis and perfomance implications.Academy of management journal, 31, 56-60.
Mintzberg, H. (1973). Strategy – making in three modes, California Management Review,
2, 44- 53
Mugenda, O.M. & Mugenda, A.G. (2003).Research Methods; Quantitative and
Qualitative approaches. Nairobi: Acts Press
Oliver, C. (1996). The institutional embeddedness of economic activity, in Baum, J.A.C.
Dutton, J. (Eds),Advances in Strategic Management, JAI Press, Greenwich, CT,
Vol. Vol. 13 pp.163-87.
Parnell, J.A. (2011). Strategic capabilities, marketing strategy, and performance among
retailers in Argentina, Peru and the Smalled States. Management Decision, 49(1),
130-155.
Parnell, J. A. (2000). Reframing the combination strategy debate: defining forms of
combination, Journal of Applied Management Studies, 9(1), 33-54.
Pearce, J.A. & Robinson, R. B. (2003).Strategic Management: Formulation
Implementation and control, 8th
Edition, McGraw Hill.
Porter, M.E. (1980). Marketing strategy. New York: The Free Press.
Porter, M. E. (1996). What is strategy, Harvard Business Review, November/December
Power, T.L. & Hahn, W. (2004).Critical marketing methods, generic strategy and industry
performance. International Journal of Bank Marketing, 22 (1), 43-64.
Spanos, Y.E. & Lioukasm, S. (2001). An examination into the causal logic of rent
generation: contrasting Porter's marketing strategy framework and the resource
based perspective. Strategic Management Journal, 22(10), 907-934.
Thompson, A. A. & Strickland, A.J. (2002).Strategic management concepts and cases.
13th
ed. New York: McGraw-Hill/Irwin.

41
Tichy, N & Cohen, E. (1997).The leadership engine: How winning companies build
leaders at every level. New York: Harper.
Venu, S. (2001), India: marketing advantage: alternative scenarios, Businessline, 12, 1.
Wallace, T. F. (1992). Customer-driven strategy: Winning through operational excellence.
Essex Junction, VT: Oliver Wight

42
APPEDICES
APPENDIX I: QUESTIONNAIRE
SECTION A: DEMOGRAPHICS
Please tick where appropriate
1. Indicate your gender
Male [ ] Female [ ]
2. How long have you worked for this company?
0-4 Years [ ] 5-9 Years [ ] 10-14 Years [ ] Over 15 Years [ ]
3. Highest Level of education
Primary Level [ ] „O‟ Level [ ]
Certificate/Diploma [ ] Degree [ ]
Postgraduate [ ]
SECTION B: MARKETTING STRATEGIES
Differentiation Strategy
5 To what extent does differentiation of products and services affect performance in
your company?
Very great extent [ ]
Great extent [ ]
Moderate extent [ ]
Little extent [ ]
No extent [ ]

43
6 Please indicate the extent to which you agree with the following statements on
differentiation strategy in your industry? Use a scale of 1 to 5 where 5= very great
extent, 4= great extent, 3 = moderate extent, 2= less extent and 1= No extent.
Statement 1 2 3 4 5
Uniqueness of a product adds value to an industry enabling it
to command a fair price
This Petroleum industry maintain a strong brand /image
identification
The industry use network as a Differentiation strategy
The industry frequently develop new products/services
The ability to supply differentiated product to the market at a
price that is higher than the expenditure incurred in
production, enables this to perform better than its competitors
There is innovation in technology to differentiate Services/
products;
The industry offers a broad service/ product range to cater for
varied needs
There are strict service/product quality control procedures
through TQM
Differentiation excellence in this industry depends on buyers‟
needs and expectations

44
Cost Leadership Strategy
7 To what extent does your industry use each the following options in response to
changes in the market? Use a scale of 1 to 5 where 5= very great extent, 4= great
extent, 3 = moderate extent, 2= less extent and 1= No extent.
Statement 1 2 3 4 5
This industry Prices its products/services below competitors to
outperform them
The industry has an efficient and low cost distribution channels
The industry acquires its capital from low cost sources
The Petroleum industry emphasizes on training, education, and
institutional learning in order to reduce staff turnover, wastage and
defects
This industry continuously develops cost effective and innovative
services/ products and refines existing ones
The industry achieves Economies of scale through lending to groups
and extensive mass mobilization of members to build a large
customer base
The industry out sources non-core functions or enters into joint
ventures to control cost
The industry achieves new service features in response to demand

45
Market Focus strategy
8 Rate the extent to which your company has utilized the following factors for
enhancing performance. Use a scale of 1 to 5 where 5= very great extent, 4= great
extent, 3 = moderate extent, 2= less extent and 1= No extent.
Market Focus Strategy 1 2 3 4 5
Increasing number of service points
Ensuring easy accessibility for clients
Conducting Regular market surveys of customer needs
Use of latest technology
Offering services not offered by competitors
Attractive appearance of premises
producing affordable products
increasing investment logistics and supply chain management
expanding its distribution network
broad range of new products
Offering their goods and services to areas which have niche.
Offering goods and services to the market based on geographical aspects,
purchasing power of customers, and demand variation.
Better service services to the identified market niche

46
Corporate Growth Strategy
9 To what extent do you agree with the following statement in relation to how they
affect performance in your company? Use a scale of 1 to 5 where 5= Strongly agree,
4= Agree, 3 = Neutral, 2= Disagree and 1= Strongly Disagree.
Factors 1 2 3 4 5
Market Penetration has enabled industry to achieve growth and enhance its
market share
Market Development enabled the industry to grow through directing the
products that they currently offer to new market segments
Diversification has enabled the industry to grow as a result of diversifying into
new businesses through development of new products and services for new
markets
Product Development has enabled the industry to develop new and modernized
products for the market segments it currently serves
SECTION C: INDUSTRY PERFORMANCE
10 What is the trend of the following performance measures in your company as a result
of adoption of marketing strategies?
Greatly
Improved
Improved Constant Decreasing Greatly
decreased
Market share
Sales Volume
Customer satisfaction
Product and Service
quality
Organizational processes
Customer loyalty
Customer retention
profitability
THANK YOU

47
APPENDIX II– Population of Oil Marketing Companies in Kenya
According to PIEA April – June 2016 publication, there are 35 OMCs. Also, all the 35
OMCs in the population have their head offices in Nairobi, which made it easy to collect
data.
1. Total Kenya Limited
2. VIVO Energy Kenya Limited
3. Kenol/Kobil Limited
4. Hashi Energy Limited
5. Gulf Energy Limited
6. Libya Oil Kenya Limited
7. Gapco Kenya Limited
8. Regnol Oil Kenya Limited
9. Petro Oil Limited
10. National Oil Corporation of Kenya Limited
11. Hass Petroleum Limited
12. Fossil Fuels Limited
13. Engen Kenya Limited
14. Oryx Energies Kenya Limited
15. Bakri International Co. Limited
16. Royal Energy Kenya Limited
17. MGS International Limited
18. Tosha Petroleum Kenya Limited
19. Ainushamsi Energy Limited

48
20. Galana Oil Kenya Limited
21. Olympic Petroleum Limited
22. Banoda Oil Limited
23. Ranway Traders Limited
24. Essar Petroleum (EA) Limited
25. Cityoil Kenya Petroleum Limited
26. Ramji Hiribhai Devani
27. East African Gas Oil Limited
28. Dalbit Petroleum Limited
29. Trojan International Limited
30. Global Petroleum Products
31. Axon Energy Limited
32. Tiba Oil Company Limited
33. Futures Energy Co. Limited
34. Tradiverse Kenya Limited
35. Fast Energy Limited
Source: (Petroleum Institute of East Africa, 2016)