effects of laser induced shock waves on metals … · overlays and target absorber materials. based...
TRANSCRIPT
Reprinted from:
SHOCK WAVES AND HIGH - STRAIN - RATE PHENOMENA IN METALS (1981)Edited by Marc A. Meyers and Lawrence E. MurrBook available from: Plenum Publishing Corporation233 Spring Street, New York, N.Y. 10013
Chapter 38
EFFECTS OF LASER INDUCED SHOCK WAVES
ON METALS
Allan H. ClauerJohn H. Holbrook
Battelle Columbus LaboratoriesColumbus, Ohio USA
Barry P. Fairand
Laser Consultants, Inc.Upper Arlington, Ohio USA
A high-energy, pulsed laser beam combined with suitable transparent overlays can generatepressure pulses of up to 6 to 10 GPa on the surface of a metal. The propagation of these pressure pulsesinto the metal in the form of a shock wave produces changes in the materials microstructure andproperties similar to those produced by shock waves caused in other ways. This paper reviews themechanism of shock wave formation, calculations for predicting the pressure pulse shape and amplitude,in-depth microstructural changes and the property changes observed in metals. These property changesinclude increases in hardness, tensile strength and fatigue life. The increases in fatigue life appear toresult from significant residual surface stresses introduced by the shock process.
I. INTRODUCTION
The ability of a high-energy, pulsed laser beam to produce recoil pressures fromvaporization of metal surfaces was suggested in 1963 by Askaryon and Morez (1). Othersverified this effect on unconfined surfaces (2-4). Then Anderholm (5) showed that pressures ofgigapascals (GPa) could be obtained at confined surfaces, i.e., surfaces covered by an overlaytransparent to the laser beam. This configuration confined the vaporized materials in the vicinityof the metal surface and significantly increased the peak pressures developed. Later, O'Keefe andSkeen (6) investigated the effects of several different transparent overlays and Yang (7)
675
676 A.H. CLAUER ET AL.
measured the peak pressures developed by a large number of metal absorbers using a glass
transparent overlay. Fairand et al (8) and Fairand and Clauer (9) showed comparisons between
pressure measurements and calculated pressures including the effects of different transparent
overlays and target absorber materials.
Based on the early demonstrations of the potentially significant stress waves developed in
metals by high energy pulsed laser beams, Fairand et al (11) showed that beneficial property and
microstructural changes could be produced in an aluminum alloy. The success of these first
experiments led to the further exploration and development of laser shock processing of metals.
This paper reviews all the aspects of laser shock processing: the formation mechanism of the
stress waves, calculations for predicting the pressure environment, in-depth microstructural
effects and the material property changes which have been observed up to this point in the process
development.
II. MECHANISM OF SHOCK WAVE GENERATION
High amplitude stress waves of sufficient magnitude to plastically deform metals and
significantly alter their properties require high-intensity-short duration pulses of laser energy
because vaporization rather than melting of the surface is desired. The required laser power
densities incident on the shocked surface typically exceed 108 W/cm2 and laser energy deposition
times are less than 1 µsec.
The mechanism for formation of the high amplitude pressure pulses is as follows. The
mean free path in metals of visible and near infrared laser radiation is less than 1 µm. Therefore,
only a very thin surface layer of material is heated by the laser light when a laser beam of sufficient
intensity strikes a metal surface. Because of the rapid energy deposition time, thermal diffusion of
energy away from the interaction zone is limited to, at most, a few micrometers. The heated
material vaporizes and the vapor rapidly achieves temperatures greater than several tens of
thousands of degrees, whereupon electrons are ionized from the atoms and the vapor is
transformed into a plasma. The plasma continues to strongly absorb the laser energy until the end
of the deposition time. If this vapor is not confined to the metal surface, pressures of only a few
tenths of a GPa are achieved. However, if an overlay transparent to the laser light is pressed
against the metal surface, the hydrodynamic expansion of the heated plasma in the confined region
between the metal target and transparent overlay creates the high amplitude-short duration
pressure pulse required for laser and shock processing.

LASER-INDUCED SHOCK WAVES 677
Efficient absorption of laser energy at the metal surface is required to create the intensepressure pulses used in shock processing. Energy losses due to reflection from the surface andabsorption in a surrounding gas environment or plasma plume formed by the laser vaporizedmaterial will reduce the maximum shock pressures which can be generated. Losses fromreflection can be reduced either by appropriate selection of the laser wavelength, e.g., shorterwavelength radiation is more efficiently absorbed by a metal than longer wavelengths, or byaddition of an absorbent coating to the metal surface. An effective method of avoiding gasbreakdown losses with surrounding environment is to either perform the laser shock experimentsin a vacuum or cover the surface with a material which is transparent to the incident laser light.As mentioned above, the transparent overlay also confines the heated metal plasma to the vicinityof the metal surface where absorbed energy is efficiently converted into a high amplitude pressurepulse.
Laser shock induced changes in material properties have been studied using Q switchedneodymium-glass and ruby lasers (6, 11, 12, 13). The neodymium laser operates in the nearinfrared at a wavelength of l.06 µm, and ruby emits in the visible spectrum at 0.694 µm. Theselasers can be operated at pulse widths ranging from less than 1 nanosecond up to about 100nanoseconds and an output energy per pulse exceeding 100 joules. The pulsed CO2 laser also hasbeen extensively used to study pressure generation mechanism in solids (14, 15). Most of thiswork, however, has involved the generation of low amplitude pressure pulses which are not ofinterest in shock processing studies, and these are not covered here.
III. ANALYSIS OF SHOCK WAVES GENERATED AT A CONFINED SURFACE
Theoretical and experimental studies have provided a quantitative description of pressureenvironments which are generated at a metal surface by a pulsed laser beam (10). The importantparameters governing the amplitude and shape of these pressures have been analyzed over a widerange of incident laser power densities and as a function of the type of target material andtransparent overlay.
A. Theory of Laser Generated Stress Waves
The nonlinear-coupled radiation and hydrodynamic equations governing pressureevolution at the metal surface during laser irradiation are best solved numerically using a highspeed computer. A code called LILA1 which is based on a method of finite differences, is used
1The hydrodynamic portion of the code was taken from the PUFF code. Tech. Report. No. AFWL-TR-66-48, 1966 (unpublished).

678 A. H. CLAUER ET AL.
for this purpose. In this code, absorption of laser light is handled exponentially and governed by acharacteristic absorption coefficient. The two absorptions processed considered in the calculationare classical absorption of electromagnetic radiation by a metallic conductor and absorption in theplasma state via an inverse bremsstrahlung process.
An analytical equation of state is used to describe the behavior of the metal duringirradiation by an intense beam of laser light. It is assumed that the equation of state can beformulated as a superposition of terms which separately describe the zero-temperature behavior ofthe material, thermal motion of heavy particles, and the thermal excitation and ionization ofelectrons. The zero-isotherm pressure is written as a combination of repulsive terms due tooverlap of the electron shells of the positive ions and Fermi kinetic energy of the free electronsand positive ions. Thermal motion of heavy particles is represented by an interpolation equationfor the free energy which in the limit of very low densities and/or high temperature approaches anideal gas equation of state. In the limit of high densities and low temperature, the interpolationrelation approaches a Debye description for the material.
The internal energy and pressure terms due to excitation of the free electrons in the metalare expressed as a quadratic function of temperature which has a limiting value equal to the Fermidegeneracy temperature (∼104 K). At higher temperatures, effects due to ionization dominate.The ionized electrons are treated as an ideal gas and the degree of ionization is determined fromthe solution of a set of Saha equations. The hydrodynamics are described by the standardequations of conservation of mass, momentum, and energy. Transport of thermal energy in thelaser-heated materials occurs by radiation diffusion using a Rosseland mean opacityapproximation (16), conduction by the metal atoms, and conduction by the ionized electrons inthe plasma (17).
B. Experimental Measurements
Because of superior time resolution and sensitivity, X-cut quartz disks are excellenttransducer elements for measuring laser generated stress wave environments (18). Stress wavepropagation through a disk coated with electrodes generates a short-circuit current which isrelated to the pressure amplitude. The output current can be fed to a resistor and the voltage dis-played on a fast oscilloscope.
This method has been used to measure the shape and amplitude of laser-induced stresswaves as a function of incident laser power density, wavelength, type of target absorber andtransparent overlay.

LASER-INDUCED SHOCK WAVES 679
1. Results of Measured and Predicted Pressure Environments
In Fig.1, results of peak pressure measurements made with quartz piezoelectric pressuretransducers are compared to LILA calculations. The measured and predicted values are given asa function of different target absorbers, overlay materials and incident laser power density. Themetal targets were prepared by vacuum depositing 3-µm-thick films directly onto the frontelectrode surface of the quartz transducers. In experiments with black paint targets, the paint wassprayed onto the transducer surface. The 0.3-cm-thick transparent quartz overlays were pressfitted against the metal and black paint targets and in the case of the water overlay experiments,the laser beam was directed vertically downward onto a 0.3 cm-thick layer of distilled water. Theexperiments were conducted with a Q-switched neodymium-glass laser which operates at the nearinfrared wavelength of 1.06 µm.
FIGURE 1. Comparison of predicted and measured peak pressures generated in different targetfilms by quart or water overlays. The curves are calculated by the LILA code, the data points areexperimental measurements.
Laser induced pressure measurements also were made by Yang who used a Q-switchedruby laser (7). He investigated the effect of different metal targets on peak pressure over a rangeof incident laser power densities extending from 108 w/cm2 up to109 w/cm2. Results of peakpressures measured in aluminum targets agree favorably with the experimental data shown in Fig.1. Yang's measurements show peak pressures vary linearly with laser power density and decreasetoward zero as the laser power density is reduced to 108 w/cm2.

680 A.H. CLAUER ET AL.
As seen from Fig. 1, peak pressure is significantly affected by the choice of the transparent
overlay material. The acoustic impedance of the overlay is an important parameter which controls
the amplitude of the resultant pressures. Water, for example, has an acoustic impedance about
1/10 that of quartz, which is the reason the pressures generated with water overlays are lower
than for quartz.
Also shown in Fig. l, thermal properties of the absorbent material affect peak pressure
values for laser power densities less than 109 w/cm2; however, at laser power densities above 109
w/cm2, deposition of laser energy is sufficiently intense to almost totally negate the effect of the
target's thermal properties on stress-wave generation. The dense, ionized plasma formed at the
target surface is the dominant mechanism controlling the amplitude of the stress wave. Peak
pressures will continue to increase with increasing incident laser power density until optical
breakdown of the transparent overlay occurs or a substantial fraction of the incident laser light is
reflected by the dense ionized plasma formed at the interface between the target and overlay.
The time behavior of the stress-wave and its relation to the laser pulse is illustrated in Fig.
2. The stress wave closely follows the rise time of the laser pulse to its peak value and initial
decay. Thereafter, the pressure pulse decays slower than the laser pulse because the pressure
environment is controlled by the rate at which energy diffuses out of the interaction zone into the
surrounding colder material. Figure 2 shows that the predicted pressure pulse is in good
agreement with the measured value. Because the rise time and initial decay of the pressure wave is
controlled by the shape of the laser pulse, it is possible to change the time history of the pressure
wave simply by increasing or decreasing the length of the laser pulse. An example of how the
duration of the pressure pulse can be varied by adjusting the width of the laser pulse is shown in
Fig. 3.
IV. IN-DEPTH STRESS WAVE ENVIRONMENTS
Laser induced stress waves are rapidly attenuated and dispersed as they propagate through
a metal target. Attenuation, particularly the decrease of the peak pressure, with distance into the
metal is of interest relative to the intensity and depth of stress wave effects on the material
microstructure and properties. Because of the rapid attenuation of laser-induced stress waves, it is
also of great interest to investigate methods whereby the in-depth pressure environments can be

LASER-INDUCED SHOCK WAVES 681
enhanced without an inordinate increase in the incident laser power density.
FIGURE 2. Comparison of computed and measured pressures for water overlay -
aluminum target at 1.2 x l09 W/cm2.
FIGURE 3. Comparison of pressure pulses generated by different laser pulse lengths.Pressures measured through 1.27 x l0-3 cm thick Zn foils covered with 0.3 cm thick quartz discs.
Initially, the high amplitude stress wave environments are controlled by hydrodynamiceffects; however, as the amplitude of the wave decreases and approaches the dynamic yieldstrength of the metal, strength properties of the metal must be taken into account. The LILAcode only contains the constitutive equations for hydrodynamic motion, therefore, its use islimited to predicting high-intensity stress wave propagation environments in thin target wherematerial strength properties are not important. In those cases where strength properties of themetal are important a two-dimensional finite-difference program known as was used to
682 A. H. CLAUER ET AL

analyze the in-depth properties of stress waves. (The program is discussed in a later
section of this paper.)
A. Pressure Enhancement In Thin Targets
The LILA program was used to investigate an acoustic impedance mismatch technique and
superposition of stress waves as methods of enhancing the amplitude of stress waves in thin
targets. The acoustic impedance mismatch technique involved placing a thin foil of the target
material in intimate contact with a much higher acoustic impedance back-up block. With this
arrangement, a stress wave which initiated at the front surface of the specimen would propagate
through it and reflect off the higher acoustic impedance backup material as a compressive wave,
thereby reinforcing the incident pressure pulse in the near back-surface region. In the
superposition studies, stress waves were initiated simultaneously at two opposite surfaces of a
thin foil. These waves superimpose near the center of the foil to create a stress wave environment
whose amplitude was nearly double that in the individual waves.
Tungsten, which has an acoustic impedance nearly four times greater than titanium, was
used as a backup for titanium in the impedance mismatch calculation. The geometrical
configuration used in the LILA calculations consisted of a 0.025-cm-thick titanium target covered
with a 0.3-cm-thick quartz disc and backed by a 0.6-cm-thick tungsten disk. An example of the
LILA predictions is shown in Fig. 4. As seen from the figure, pressures greater than 10 GPa can
be generated at the titanium/tungsten surface even though the pressure at the surface of the
titanium is only about 6 GPa.
FIGURE 4. Comparison of computed and measured pressures for the quartz overlay-titanium target-tungsten backup arrangement.The dashed line is the laser pulse shape used in these calculations.
LASER-INDUCED SHOCK WAVES 683

In the stress-wave superposition calculation, two laser beams impinged simultaneously on
the two opposite surfaces of a 0.025-cm-thick titanium foil which was covered with 0.3-cm-thick
fused quartz discs. An example of the stress-wave environment which can be generated in this
manner is shown in Fig. 5. As seen from this figure, pressures greater than 10 GPa can be
generated by this technique. Both the superposition of stress waves (split beam technique) and
acoustic impedance method have been used to increase the amount of deformation induced in
metal targets.
FIGURE 5. Computed pressure for the split beam configurationand the quartz overlay-0.025 cm thick titanium target-quartzoverlay arrangement. The dashed curve illustrates the laser pulseshape used in these calculations
B. Thick Target Effects
The program was used to analyze the in-depth stress fields in those cases where
strength properties of the metal became important. is a two-dimensional finite difference
program for computing the solution to wave propagation problems (19) and is described in detail
elsewhere (20, 21). The program is designed to include an elastic-plastic response to the stress
waves with or without work hardening. The code is presently being used to calculate
stress wave interactions in an iron-3 weight percent silicon alloys (Fe-3Si) for reasons which are
discussed in more detail in a later section. Only elastic-perfectly plastic material response is
included here. As part of the study, the attenuation of the planar shock wave as it passes through
a 2.7 mm thick specimen was calculated. This calculation was compared to previous
measurements of pressure pulses made with quartz transducers placed at the back surfaces of
disks having different thicknesses (22). The disks were shocked on the side opposite the quartz
gauge with nominally the same laser beam conditions, so the back surface measurements
684 A. H. CLAUER ET AL.
reflected primarily the in-material effects on the shock wave.
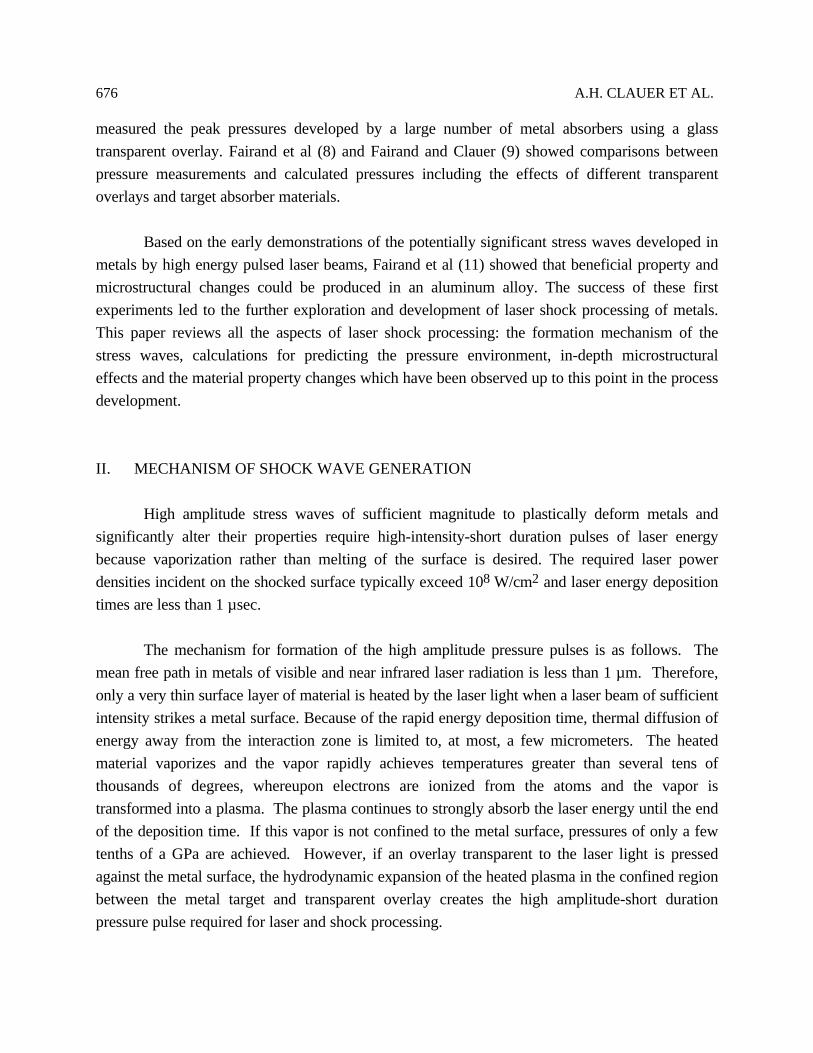
The change in shape of the stress waves after passing through different material thicknesses
is shown in Fig. 6. The development of the elastic precursor is clearly shown after traveling
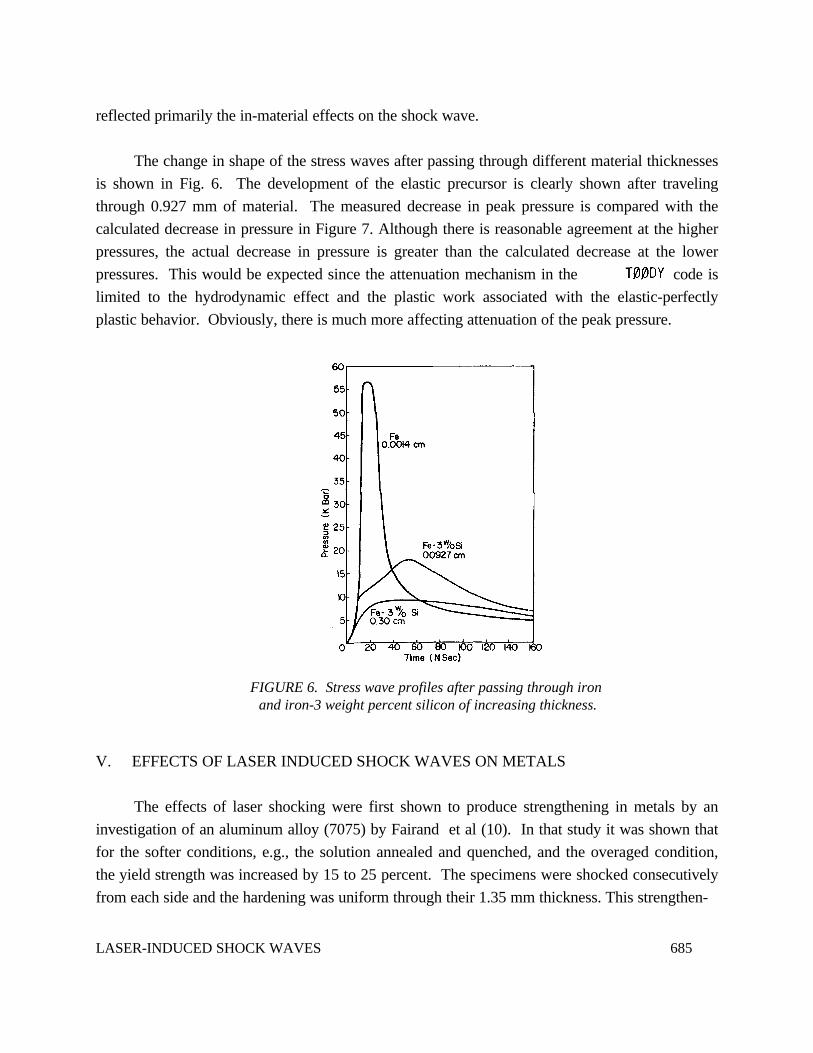
through 0.927 mm of material. The measured decrease in peak pressure is compared with the
calculated decrease in pressure in Figure 7. Although there is reasonable agreement at the higher
pressures, the actual decrease in pressure is greater than the calculated decrease at the lower
pressures. This would be expected since the attenuation mechanism in the code is
limited to the hydrodynamic effect and the plastic work associated with the elastic-perfectly
plastic behavior. Obviously, there is much more affecting attenuation of the peak pressure.
FIGURE 6. Stress wave profiles after passing through iron and iron-3 weight percent silicon of increasing thickness.
V. EFFECTS OF LASER INDUCED SHOCK WAVES ON METALS
The effects of laser shocking were first shown to produce strengthening in metals by an
investigation of an aluminum alloy (7075) by Fairand et al (10). In that study it was shown that
for the softer conditions, e.g., the solution annealed and quenched, and the overaged condition,
the yield strength was increased by 15 to 25 percent. The specimens were shocked consecutively
from each side and the hardening was uniform through their 1.35 mm thickness. This strengthen-
LASER-INDUCED SHOCK WAVES 685
FIGURE 7. Comparison of calculated and experimentallymeasured decrease in peak pressure of the stress wave as ittravels through iron-3 weight percent silicon.
ing was equivalent to about a 5 percent tensile prestrain. The harder, peak-aged material did not
show any strengthening effect. However, it was shocked at a somewhat lower pressure than the
over-aged material. These results indicated that the shock conditions developed by high intensity
laser irradiations were sufficient to produce strengthening and hardening. These investigators
showed by transmission electron microscopy that the cause of these property changes was a
significant increase in dislocation density produced by the passage of the shock wave (10).
The effects of laser shocking on different properties of metals will now be discussed.
A. Microstructure
When the peak pressure of the shock wave is greater than the dynamic yield strength, it
produces extensive plastic deformation in the metal. This results in a large increase in dislocation
density as shown in Fig. 8. This is typical of the microstructures developed by laser shocking
aluminum alloys (27-29). Similar effects including twinning were observed in 304 stainless steel
(27).
686 A. H. CLAUER ET AL.
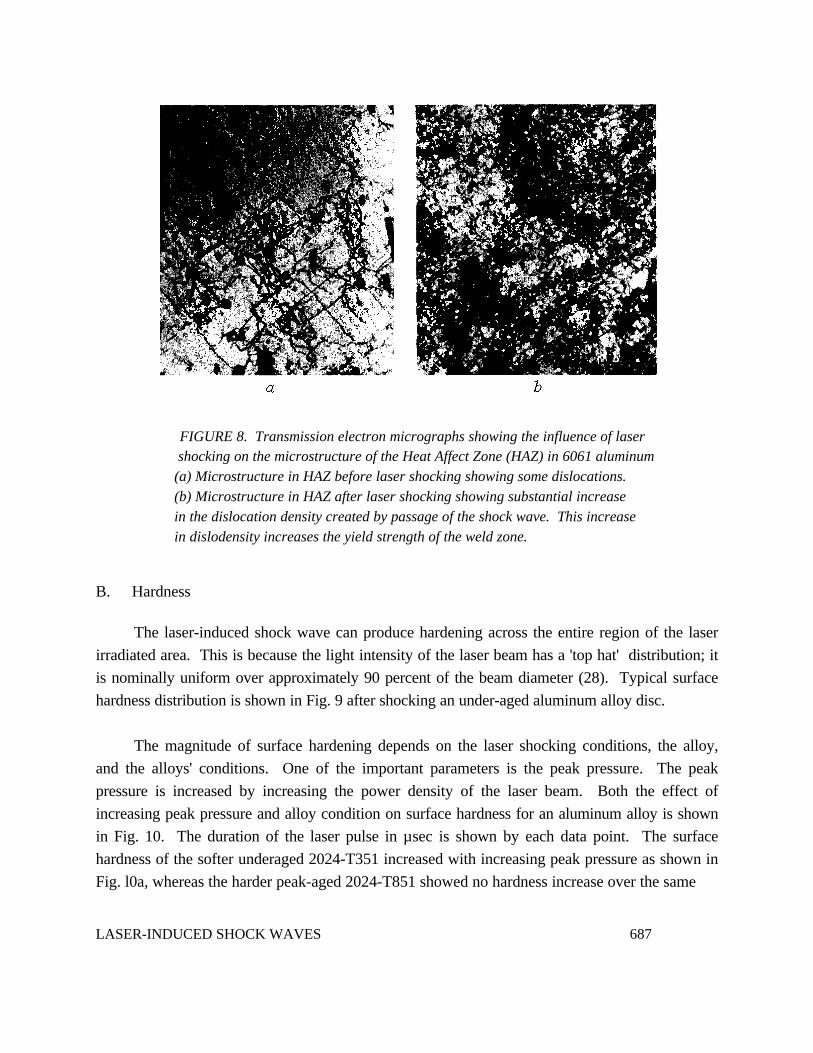
FIGURE 8. Transmission electron micrographs showing the influence of laser shocking on the microstructure of the Heat Affect Zone (HAZ) in 6061 aluminum(a) Microstructure in HAZ before laser shocking showing some dislocations.(b) Microstructure in HAZ after laser shocking showing substantial increasein the dislocation density created by passage of the shock wave. This increasein dislodensity increases the yield strength of the weld zone.
B. Hardness
The laser-induced shock wave can produce hardening across the entire region of the laser
irradiated area. This is because the light intensity of the laser beam has a 'top hat' distribution; it
is nominally uniform over approximately 90 percent of the beam diameter (28). Typical surface
hardness distribution is shown in Fig. 9 after shocking an under-aged aluminum alloy disc.
The magnitude of surface hardening depends on the laser shocking conditions, the alloy,
and the alloys' conditions. One of the important parameters is the peak pressure. The peak
pressure is increased by increasing the power density of the laser beam. Both the effect of
increasing peak pressure and alloy condition on surface hardness for an aluminum alloy is shown
in Fig. 10. The duration of the laser pulse in µsec is shown by each data point. The surface
hardness of the softer underaged 2024-T351 increased with increasing peak pressure as shown in
Fig. l0a, whereas the harder peak-aged 2024-T851 showed no hardness increase over the same
LASER-INDUCED SHOCK WAVES 687

FIGURE 9. Surface hardness profiles across the laser shocked zone on 2024-T351 aluminum shocked at a peak pressure of5. 8 GPa with a 25 µsec laser pulse.
FIGURE 10. Dependence of average surface hardness on peak shockpressures, comparing laser shocking and flyer plate (23) shocking. Thepulse length in nsec is written beside each data point; (a) 2024-T351and (b) 2024-T851.
range, Fig. l0b. The peak pressures were obtained from the values of peak power density moni-
tored during the experiment and the relation between peak power density and peak pressure (Fig.
1)
A perspective on these results can be had by comparing them with results obtained by
shocking similar material with a flyer plate. Herring and Olson (23) shocked 2024 aluminum in
688 A. H. CLAUER ET AL.

similar heat treated conditions to those studied here, with a thin mylar flyer plate, producing a
range of shock pressures of 150 nsec duration. These data are included as the open squares in
Fig. 10. For 2024-T351, there is a trend for the laser shocking results to define a rapid shock
hardening region with increasing peak pressure at pressures below 5 GPa. The flyer plate results
are in accord with this rapid hardening and show a saturation of shock hardening above 5 GPa.
This saturation hardness is the same as the hardness of a heavily hammered surface, 165 to 178
DPH. The suggestion of a lower saturation hardness by the laser shocking points above 5 GPa
might be due to the short pulse duration of the higher pressure shots compared to the flyer plate
pulse duration. It has been shown that hardening effects can increase with increasing duration of
the shock wave for a constant pressure amplitude. The lack of shock hardening of 2024-T851 is
also consistent with the flyer plate results (Figure l0b). The laser shocking pressures were all
below the apparent threshold pressure for surface hardening of 8 to 10 GPa indicated by the flyer
plate data. However, this pressure threshold is within the upper pressure range attainable with the
pulse laser.
The hardening of the 2024-T351 alloys is a result of a significant increase in dislocation
density caused by the shock wave (28). A similar increase in dislocation density after shocking is
observed in the 2024-T851 alloy, but the precipitation hardening effect masks the strain hardening
effect.
The 7075 aluminum alloys responds differently to laser hardening. When 7075 aluminum
was laser shocked under conditions similar to the 2024 alloy, no surface hardening was observed
even in the soft over-aged condition.
The above surface hardening effects were all caused by a single laser shot. However, some
metals do not respond to a single shot at the peak pressures achievable by the laser. In this case,
multiple shots can produce a progressive increase in hardness.
This effect is illustrated by the surface hardness changes of 304 stainless steel after an
increasing number of laser shocks. The difference in the surface hardness profile after one and five
successive shots has been shown previously (27). The average surface hardness with number of
shots up to ten shots is shown in Fig. 11. This figure shows that hardness increases with in-
creasing numbers of shots and that further increases are possible with more shots. The increase in
hardness is apparently caused by an increase in the dislocation density with increasing laser shock
repetitions. (27)
LASER-INDUCED SHOCK WAVES 689
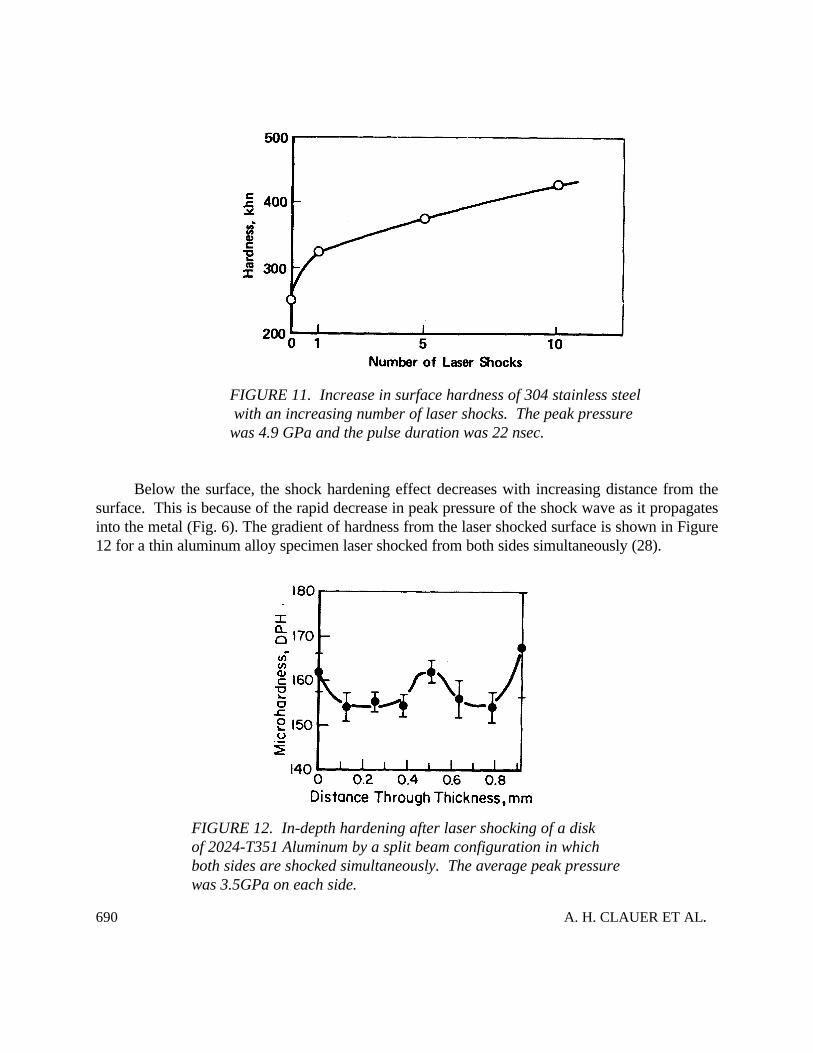
FIGURE 11. Increase in surface hardness of 304 stainless steel with an increasing number of laser shocks. The peak pressurewas 4.9 GPa and the pulse duration was 22 nsec.
Below the surface, the shock hardening effect decreases with increasing distance from thesurface. This is because of the rapid decrease in peak pressure of the shock wave as it propagatesinto the metal (Fig. 6). The gradient of hardness from the laser shocked surface is shown in Figure12 for a thin aluminum alloy specimen laser shocked from both sides simultaneously (28).
FIGURE 12. In-depth hardening after laser shocking of a diskof 2024-T351 Aluminum by a split beam configuration in whichboth sides are shocked simultaneously. The average peak pressurewas 3.5GPa on each side.
690 A. H. CLAUER ET AL.
The unshocked hardness of the 2024-T351 is 140-142 DPH. If a thicker specimen was shocked
from one side only, the hardness would decrease to the unshocked level within one to two
millimeters below the surface. In the case shown in Fig. 12, shock waves enter from both surfaces
and when they superimpose at mid-thickness, they produce a local increase in hardness. Thus,
this split-beam shocking procedure produces more uniform through-thickness hardening in thinner
sections than would a shot from one side only.
C. Tensile Strength
The first effects of laser shocking on tensile strength were those of Fairand et al on 7075-
T73 (11) mentioned earlier. Later, significant strengthening of weld zones on two aluminum
alloys was shown (29). Laser shocking the weld and heat affected zones of three millimeter thick
5054 and 6061 aluminum alloys increased the yield strength of the welds by 50 percent after laser
shocking (29). In the case of the 5054 alloy, this increased the yield strength back to the parent
material level.
The 2024 aluminum alloy showed a slight increase in tensile strength for the under-aged
conditions but none for the peak and condition. The elongation decreased after laser shocking as
often observed in strain hardened metals, but the reduction in area often increased (30).
The relation between hardening and strengthening in the 2024 and 7075 aluminum alloys
after laser shocking is different (30). The softer 2024-T351 conditions shows a significant
hardening response but little tensile strengthening after laser shocking. By comparison, the softer
7075-T73 condition shows little hardening but does develop a significant increase in tensile
strength after laser shocking. Neither of the peak aged conditions show any response.
Presumably, the high precipitation hardening in the peak aged condition swamps the dislocation
strain hardening effect. The reasons for the difference in the response of the softer conditions is
not understood.
D. Residual Stresses
The hardness gradient and the shocked surface indicates that there should also be a surface
residual stress after laser shocking. This is the case as shown in Figure 13. The residual stresses
are compressive and are relatively uniform across the radius of the laser shocked region. The
level of these residual stresses is in the range of the yield strength and above for this alloy. The
residual stress falls off with distance below the surface but persists to depths of about 1 mm.LASER-INDUCED SHOCK WAVES 691

FIGURE 13. In-depth residual surface stress after laser shocking of 7075-T6 aluminum. In each case, a hole was drilled in the center of the laser shocked region. The residual stress measurements were made in the remaining annulus of laser shocked area.
These residual compressive surface stresses are large and will have a significant effect on
certain material properties that are sensitive to the surface initiation and propagation of cracks,
such as fatigue and stress corrosion cracking. Fatigue properties have been observed to be
significantly improved, but the response of stress corrosion cracking to laser shocking has not
been clearly established.
E. Fatigue
The effects of laser shocking on fatigue properties has been investigated for aluminum
alloys only (28, 31). Fatigue of welded aluminum alloy specimens and crack propagation and
fretting fatigue of unwelded specimens have been studied. All of these fatigue studies were
conducted on a Krouse fatigue machine in tension-tension on nominally 4.8 to 6 mm thick sheet.
692 A. H. CLAUER ET AL.
1. Fretting Fatigue

The fretting fatigue tests were carried out on 7075-T6 specimens having the half dog-bone
configuration. The specimens were held together by a steel aerospace quality fastener designed to
give approximately a 30 percent stress differential between the two pieces of the specimen held
together by the fastener. This load differential created a rubbing or fretting action on the
aluminum surfaces in the vicinity of the fastener. The region around the fastener holes was either
laser shocked or left unshocked for a baseline comparison.
The results are summarized in Table 1. The stress ratio for these tests was R = 0.1. The
initial maximum stress loading was set at 96.5 MPa to evaluate the fretting mode of failure, i.e.,
high cycle failure. The average life of the unshocked specimens was less than 500,000 cycles at
96.5 MPa and about half of that at 116 MPa maximum stress amplitude. The specimens which
were laser shocked in the region of the fastener hole had dramatically longer lives. One shocked
specimen had over 48 million cycles accumulated at 96.5 and 106 MPa maximum stress
amplitude, before raising the stress to 116 MPa caused failure after 250,000 cycles. The second
specimen accumulated 15 million cycles at 96.5 MPa before failing when the maximum stress
amplitude was increased to 116 MPa.
TABLE I Influence of Laser Shocking on FrettingFatigue Failure of Fastened Joints in 7075-T5 Aluminum
After failure the fracture surfaces of the specimens with and without laser shocking were
examined by scanning electron microscopy. A common feature for both the shocked and
unshocked specimens was the existence of a layer of material at the fretted surface about 80 toLASER-INDUCED SHOCK WAVES 693
150 µm thick. This layer is a severely worked region resulting from the contact shear stresses
caused by the relative movement between the rubbing surfaces of the pad and the strip. The
work-hardened layers appear to have about the same thickness in the shocked and unshocked
specimens after fatigue. The fracture surfaces of both the shocked and unshocked specimens were
similar in appearance. The fractures initiated at cracks in pitted regions of the fretted surfaces in
both the shocked and unshocked specimens.
The reason for the significantly increased fretting fatigue resistance at the 96 to 116 MPa
stress level is probably the presence of the compressive residual surface stresses. The surface
initiated damage consisting of galling, seizing, and crack initiation proceeds much the same in
both the shocked and non-shocked specimens. However, the compressive surface stresses
prevent the surface cracks from propagating and causing fracture except after very long times. At
higher stress levels, the stress concentration at the base of the crack would wash out the effects of
the residual stresses.
2. Fatigue
The fatigue properties of welded 5456 aluminum alloy have been investigated for both the
laser shocked and the non-shocked conditions. The tests were run at R = 0 and at R = 0.1
corrected to R = 0. The results of these tests were compared to a large number of baseline data
points (32), and are shown in Fig. 14. The non-shocked fatigue life is in good agreement with the
baseline data. None of the laser shocked specimens were taken to failure because of the long test
times required, but each of them shows a significant increase in life over the non-shocked
conditions. This increase in life could be attributed to the residual surface compressive stress,
elimination of residual surface tensile stresses and possibly in part to increasing the strength of the
material in the heat affected zone.
In other experiments, fatigue of 2024-T3 and 7075-T6 aluminum specimens were investigated
(31). These specimens were designed to investigate fatigue behavior associated with fastener
holes. A number of different shocking conditions were tried. A few of the more pertinent results
are described here.
The specimen configuration is shown in Fig. 15. The smaller diameter circles on each side
of the main hole were included to decrease the number of cycles to crack initiation. The region
around the hole was then either not shocked or was laser shocked with a split beam, i.e., shocked
from both sides simultaneously. The power density of the beam was such that a peak pressure of 7
to 8 GPa was produced. The pulse length was nominally 15 to 20 µsec.694 A. H. CLAUER ET AL.

FIGURE 14. Effects of laser shocking on the fatigue life ofwelded 5456 aluminum for axial fatigue tests at R = 0. Thedashed line represent typical as-welded properties.
FIGURE 15. Crack initiation/growth specimen.
LASER-INDUCED SHOCK WAVES 695

The 2024-T3 alloy results for constant stress amplitude fatigue tests at 15 ksi are shown in
Fig. 16. Comparison of the unshocked and shocked conditions shows that laser shocking
produced an increase in life by a factor of four to five. The unshocked specimens not taken to
failure had nearly cracked through the cross-section at termination. Even when the specimens
were precracked before laser shocking, a significant increase in fatigue life was observed.
EFFECT OF LASER SHOCKING ON FATIGUE BEHAVIOR
FIGURE 16. Effect of laser shocking on the fatigue behavior of 2024-T3 aluminum.
For the 7075-T6 alloy, a different response was obtained. For constant stress amplitude
tests from 15 to 24 ksi, no improvement in fatigue life was observed after laser shocking the crack
initiation/propagation specimens, Figure 17. However, in fastener configuration specimens tested
using a flight by flight stress spectrum 1 having a maximum stress of 27 ksi, there was a
noticeable improvement in the fatigue life (Fig. 18). A similar, but smaller effect was noted for a
40 ksi maximum stress flight by flight spectrum. In the flight by flight spectra, the nominal
average stress maxima are probably less than 15 ksi. Thus, the periodic overstresses do not
appear to remove the effect of the residual surface compressive stresses. The fastener specimen
configuration investigation. It is clear from examination of the fracture surfaces that the
1A flight by flight spectrum consists of a series of stress cycles having random amplitudes, all below aspecified maximum stress level.
696 A. H. CLAUER ET AL.
compressive residual surface stresses are slowing crack propagation by forcing the cracks to
tunnel between the outside surfaces of the specimen (31). This is probably the biggest contributor
to the increase in fatigue life in the above results. The effect of laser shocking on crack initiation is
not clear but is being studied.
VI. STRESS WAVE INTERACTIONS
Recently an investigation has been undertaken to study the effects of stress wave
interactions within specimens where the initial stress wave is caused by laser shocking and the
interacting waves originate as release waves from the specimen surfaces. The study uses the
finite different computer code mentioned earlier to calculate these interactions in terms of
the magnitude of the local plastic work performed within the specimen. The calculated results are
then correlated with experimentally observable evidence of localized deformation in Fe-3 weight
percent Si. With this material, hands and individual dislocations generated by plastic deformation
can be revealed by etch pitting. This is particularly useful for the laser shocking studies since the
resulting plastic deformation is not homogeneous, and the etch-pitting serves to identify the
regions experiencing significant deformation. This technique has been successfully used in an
earlier program investigating the deformation caused by laser shocking (22).
By combining the etch pitting and computational techniques, the distribution and magnitude
of localized, non-uniform plastic work predicted by the computer code can be directly compared
to visual evidence of intensity and distribution of plastic strain. If the correlation between the two
is not reasonable, the material properties in the code can be modified in a manner consistent with
models of high-rate materials deformation response until a good correlation is obtained. In this
way, we can achieve a better understanding of high strain rate, non-uniform deformation behavior
in metals.
The code requires specified inputs to describe the material-specific response to
the stress waves. These are equation of state parameters and plastic stress strain parameters. The
equation of state used was that of iron referred to earlier, the plastic response was elastic perfectly
plastic with a dynamic yield stress of .79 GPa. These were chosen as a reasonable starting point
to investigate the initial correlation between the predicted and observed plastic deformation
results. After the first round of experiments, these inputs will be modified to examine the sensi-
tivity of the prediction to the specified material parameters may also create a
LASER.INDUCED SHOCK WAVES 697

somewhat different response at 15 ksi constant stress amplitude compared to the crack
initiation/propagation specimens.
FATIGUE TEST RESULTS ON 7075-T6 ALUMINUM
FIGURE 17. Effect of laser shocking on the fatigue behavior of 7075-T6 aluminum.
FIGURE 18. Fatigue test results for 27 ksi flight/flight load spectrum for fastened joint specimens of 7075-T6 aluminum.
The reasons for these different responses in 2024-T3 and 7075-T6 alloys is not known and
is the subject of continuing and to determine which of these produces the best correlation of

698 A. H. CLAUER ET AL.
prediction to observation.
The specimens were thin disks having a diameter to thickness ratio of 5 and 10. The disks
machined from Fe-3 Si were 27 mm diameter and either 2.7 or 5.4 mm thick. Both solid disks
and disks consisting of a 13.5 mm disk press fit into the center of a 6.75 mm wide annulus were
studied. The latter was a guard ring configuration. In concept, the disk-guard ring interface
should prevent the circumferential tensile release wave from travelling into the central disk.
During laser shocking, the disks were held from the sides only by plastic set screws. When
laser shocked from one side only, the back surface was a free surface. After laser shocking, the
specimens were aged to develop the required etch pitting response (22), then sectioned along a
diameter. The cross sections were electropolished and etch pitted to reveal the distribution of the
plastic strain.
The areas experiencing plastic deformation are preferentially attacked during etching and
show up as dark against a light matrix (undeformed) when examined using optical microscopy.
More heavily deformed areas etch darker up to 5 to 7 percent equivalent tensile strain, but the
intensity of etching (e.g., as measured with a densitometer) is not easily translatable to a given
plastic strain level. For plastic strain above the equivalent of 5 to 7 percent uniaxial plastic strain,
the etch pit intensity begins to decrease until at about 10 percent uniaxial strain equivalent, the
appearance is the same as that of an undeformed area. In the present work, levels of deformation
due to laser shocking were usually less than this strain, except occasionally at the front surface.
This makes it possible to visually discern areas that are plastically deformed by the laser shocking
and to qualitatively discriminate between different intensities of deformation by comparing etch pit
densities on the polished and etched cross-sections.
Comparisons between iso-plastic work contours calculated for a disk cross-section using
and the etch pit patterns obtained on laser shocked disk cross sections are presented for
several cases. These are for 2.7 mm thick specimens with an without a guard ring and for a 5.4
mm thick specimen with a guard ring. In these three examples, the laser pulse width and peak
pressure were maintained reasonably constant at 24 nsec and 4.8 Gpa, respectively.
The appearance of the etched samples will be discussed first, then compared to the
calculations. Comparison of Figs. 19 and 20 illustrates the effect of a guard ring on the resulting
LASER-INDUCED SHOCK WAVES 699
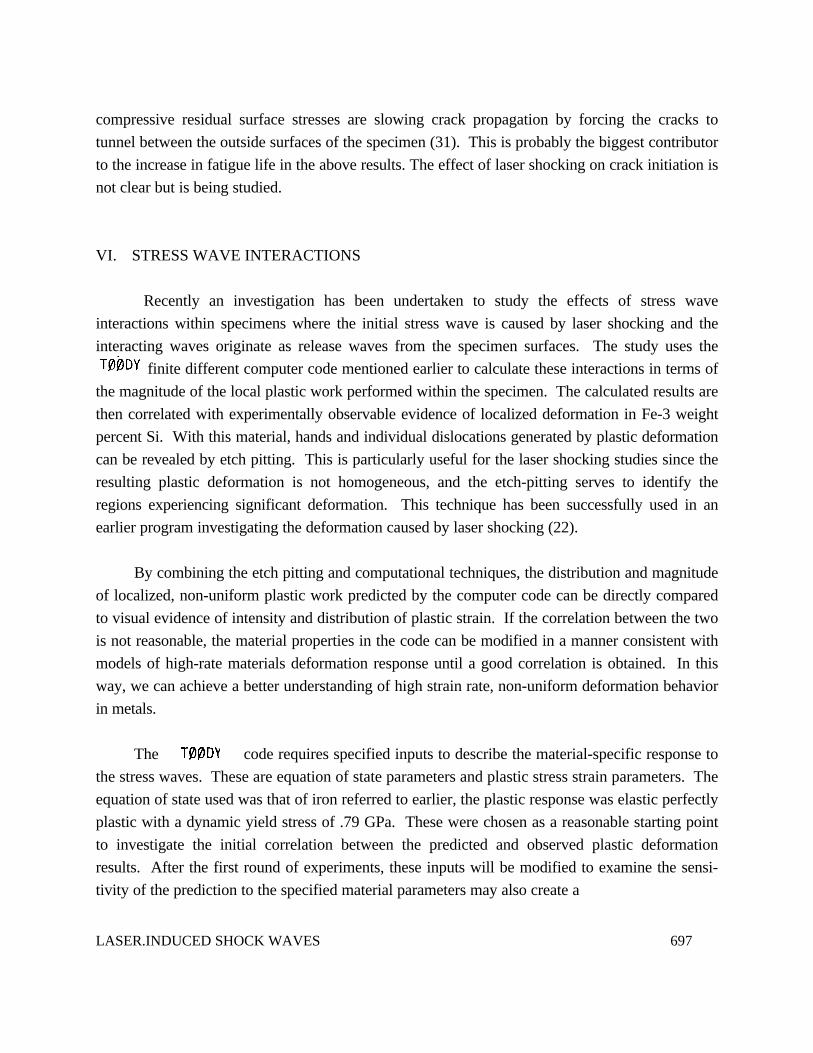
deformation patterns of specimens with a ratio of 10 (2.7 mm thick). In the specimen
with a guard ring, Fig. 18a, the etch pit distribution indicates that the regions having the most
plastic work other than the shocked surface are at the center of the specimen and at two locations
in the guard ring: adjacent to the guard ring interface and at mid-width of the guard ring. For the
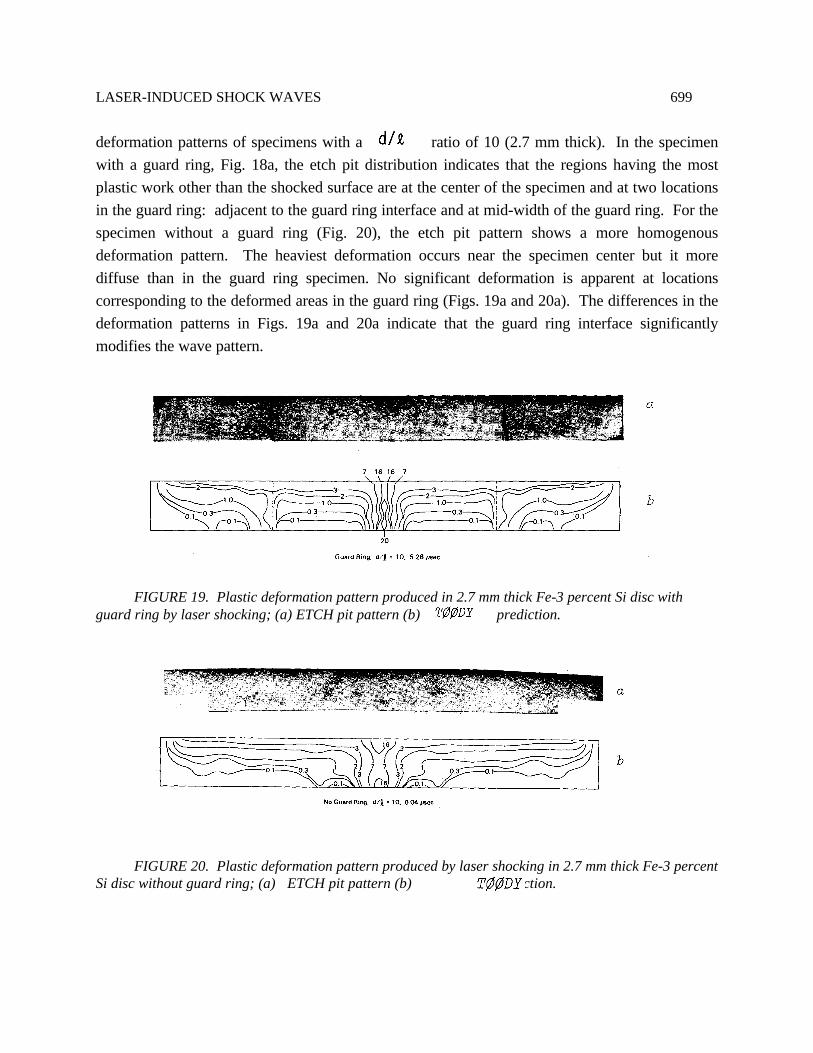
specimen without a guard ring (Fig. 20), the etch pit pattern shows a more homogenous
deformation pattern. The heaviest deformation occurs near the specimen center but it more
diffuse than in the guard ring specimen. No significant deformation is apparent at locations
corresponding to the deformed areas in the guard ring (Figs. 19a and 20a). The differences in the
deformation patterns in Figs. 19a and 20a indicate that the guard ring interface significantly
modifies the wave pattern.
FIGURE 19. Plastic deformation pattern produced in 2.7 mm thick Fe-3 percent Si disc withguard ring by laser shocking; (a) ETCH pit pattern (b) prediction.
FIGURE 20. Plastic deformation pattern produced by laser shocking in 2.7 mm thick Fe-3 percentSi disc without guard ring; (a) ETCH pit pattern (b) prediction.

700 A. H. CLAUER ET AL.
Examination of the plastic work prediction of the code are also shown in Fig.
18b and 19b along with the associated metallographic section. There is reasonable agreement
between the calculations and the actual deformation pattern as revealed by the etch-
pitting. Qualitatively, the code predicts the major differences in the deformation behavior at the
specimen center and at the guard ring interface for the specimens with and without guard rings.
The quantitative predictions by are less satisfactory. For instance, in both uses of the
2.7 mm thick specimens (Figs. 18b and 19b), the computer calculations indicate that the intensity
of plastic work expected at the back-center of the specimen is equal or greater than the amount of
plastic work at the front-center. The etch pit patterns do not show this effect.
There are several possible reasons why the results are not in quantitative
agreement with the observed behavior. Foremost among these is the fact that the stress-strain
behavior of the silicon-iron input to the code is elastic-perfectly plastic, and only one
dynamic yield stress was used. Incorporation of work-hardening and a change in the dynamics
yield stress could be expected to significantly change the calculated plastic work distribution.
Calculations of the time dependence of the plastic work shows that much of the non-uniform
work occurs at longer times after shocking, indicating that it may be caused by the interaction of
lower amplitude shock waves. Raising the local flow stress by using a higher dynamics yield
stress or incorporating work hardening may limit the magnitude of the calculated deformation.
The effect of specimen thickness on the laser-induced deformation can be seen by
comparing the two guard ring specimens in Figs. 18 and 20. The etch pit patterns clearly show
that the central column of deformation extends deeper into the thicker specimen Also, the
deformation at the interface in the central region of the guard ring present in the thinner specimen
is missing in the thicker specimen. The code satisfactorily predicts these differences in
deformation behavior in the guard rings. Moreover, the code prediction of the plastic work
distribution in the central column is quite good for the thicker specimen.
We feel that a reliable scheme for calculating the deformation due to laser shocking would
be valuable for future studies on and applications of laser surface treatment. Overall, these initial
experiments have shown that the predictions of the code are reasonably consistent with
the actual deformation as revealed by etch-pitting. This is somewhat surprising in view of the
simple mechanical behavior input to the code. Elements of the materials input that are expected
to increase the accuracy of the calculations are: a more realistic stress-strain behavior
including work-hardening and strain-rate dependence; a more accurate equation of state for the
Fe-3 percent Si, and a better description of energy dissipation of propagating waves, elastic and

LASER-INDUCED SHOCK WAVES 701
Figure 21. Plastic deformation pattern produced by laser shocking
of a 5.4 mm Fe-3 percent Si disc with guard ring; (a) ETCH pit
pattern (b) prediction
plastic. Work is currently under way to evaluate these refinements and improve the quantitative
predictive capabilities of
VII. ACKNOWLEDGEMENTS
The authors wish to acknowledge the support of the National Science Foundation, Army
Research Office and Air Force for research presented in this paper. They also wish to
acknowledge the direction of the fatigue studies by Mr. S. Ford and the assistance of Miss M. R.
Cantin and Mr. C. R. Barnes.
VIII. REFERENCES
1. Askar yon, G. A., and Morez, E. M., JETP Lett., 16, 1638, (1963).
2. White, R. M., J. Appl. Phys., 34, 2123 (1963).
3. Gregg, D. W., and Thomas, S. J., J. Appl. Phys., 37, 2787, (1966).
4. Skeen, C. H., and York, C. M., J. Appl. Phys., 12, 369 (1968).
5. Anderholm, N. C., Appl. Phys. Lett, 16, 113 (1970).

702 A. H. CLAUER ET AL.
6. O’Keefe, J. O., Skeen, C. H., and York, C. M., J. Appl. Phys., 44, 4622 (1973).
7. Yang, L. C., J. Appl. Phys., 45, 2601 (1974).
8. Fairand, B. P., Clauer, A. H., Jung, R.G., and Wilcox, B. A., Appl. Phys. Lett., 25, 431
(1974).
9. Fairand, B. P., and Clauer, A. H., Opt. Comm., 18, 448 (1976).
10. Fairand, B. P. and Clauer, A. H., J. Appl. Phys., 50, 1497 (1979).
11. Fairand, B. P., Wilcox, B. A., Gallagher, W. J., and Williams, D. N., J. Appl. Phys., 43, 3893
(1972).
12. Metz, S. A., and Smidt, F. A. Jr., Appl. Phys. Lett., 19, 207, (1971).
13. Inal, O. T., and Murr, L. E., J. Appl. Phys., 49, 2427 (1978).
14. Hettche, L. R., Schriempf, J. T., and Stegman, R. L., J. Appl. Phys., 44, 4079 (1973).
15. Beverly, R. E. III and Walters, C. T., J. Appl. Phys., 47, 3485 (1976).
16. Bond, J. W. Jr., Watson, M., and Welch, J. A. Jr., “Atomic Theory of Gas Dynamics,”
Addison-Wesley, Reading, MA (1965).
17. Spitzer, L. Jr., “Physics of Fully Ionized Gases,” Interscience, New York, (1967).
18. Graham, R. A., Neilson, F. W., and Benedick, W. B., J. Appl. Phys., 36, 1775 (1965).
19. Herrman, W., “A Lagrongion Finite Difference Method for Two Dimensional Motion
Including Material Strength,” Air Force Weapons Laboratory Technical Report, AFWL-TR-
64-107, Albuquerque, N. M. (1964).
20. Bertholf, L. D., and Karnes, C. H., J. of Appl. Mechanics, 36, Trans ASME, 91, Series E,
533 (1969).
21. Stevens, A. L., and Jones, O. E., J. of Appl. Mechanics (1972).
22. Clauer. A. H., Fairand, B. P., and Wilcox, B. A., Met. Trans. A., 8A, 119 (1977).
23. Herring, R. B., and Olson, G. B., AMMRC TR71-61, Army Materials and Mechanics
Research Center, (1971).
24. Antrobus, D. J., and Reid, C. N., Final Report for Ministry of Defense, University of
Birmingham, Great Britain (1972).
25. Waddington, J. S., Ph.D. Thesis, University of Liverpool (1964).
26. Rose, M. F., and Berger, T. L., Phil. Mag., 17, 1121 (1968).
27. Fairand, B. P., and Clauer, A. H., “Laser-Solid Interactions and Laser Processing,” Ferris, S.
D., Leony, H. J., and Poate, J. M. (eds.) American Institute of Physics, New York (1978).
28. Clauer, A. H., and Fairand, B. P., “Applications of Lasers in Materials Processing,”
Metzbower, Z. A. (ed.) American Society for Metals, Metals Park (1979).
29. Clauer, A. H., Fairand, B. P., and Wilcox, B. A. Met. Trans. A., 8A, 187 (1977).
30. Clauer, A. H., Fairand, B. P., and Slater, J. E., NASA Cr-145132 (1977).

LASER-INDUCED SHOCK WAVES 703
31. Ford, S. C., Fairand, B. P., Clauer, A. H., and Galliher, R. D., Technical Report AFWAL-
TR-80-3001, Vol. II (1980).